A partially nested cortical hierarchy of neural states underlies event segmentation in the human brain
- Donders Institute for Brain, Cognition and Behaviour, Radboud University Nijmegen, Netherlands
- Department of Psychology, Brock University, Canada
Figures
Figure 1
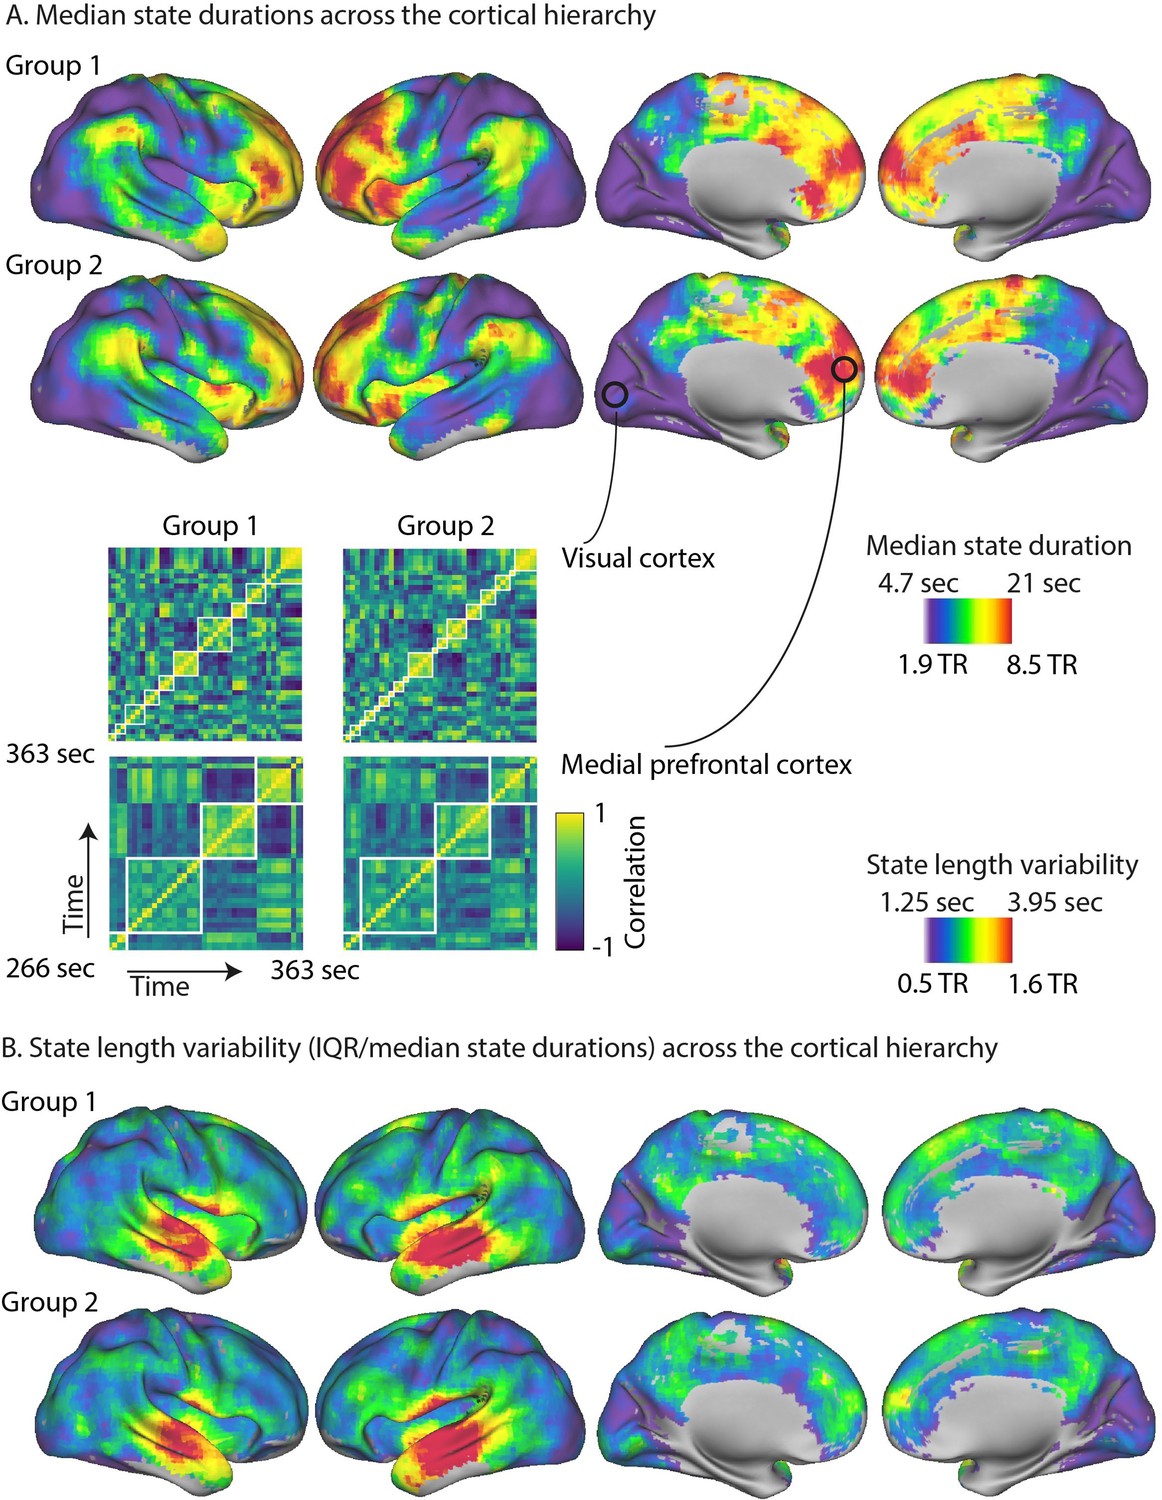
The cortical hierarchy of neural state durations.
(A) The optimal number of states varied greatly across regions, with many shorter states in the primary visual, auditory, and sensorimotor cortices and few longer states in the association cortex, such as the medial and lateral prefrontal gyrus. These results are highly consistent across two independent groups of participants. Parts of the correlation matrices for two selected searchlights are shown in the insets for each of the groups, representing approximately 1.6 min of the movie. The white lines in these insets are the neural state boundaries that are detected by greedy state boundary search (GSBS). (B) The variability in state durations, as quantified by the interquartile range (IQR)/median state duration, was particularly high in the middle and superior temporal gyri and the anterior insula.
Figure 2
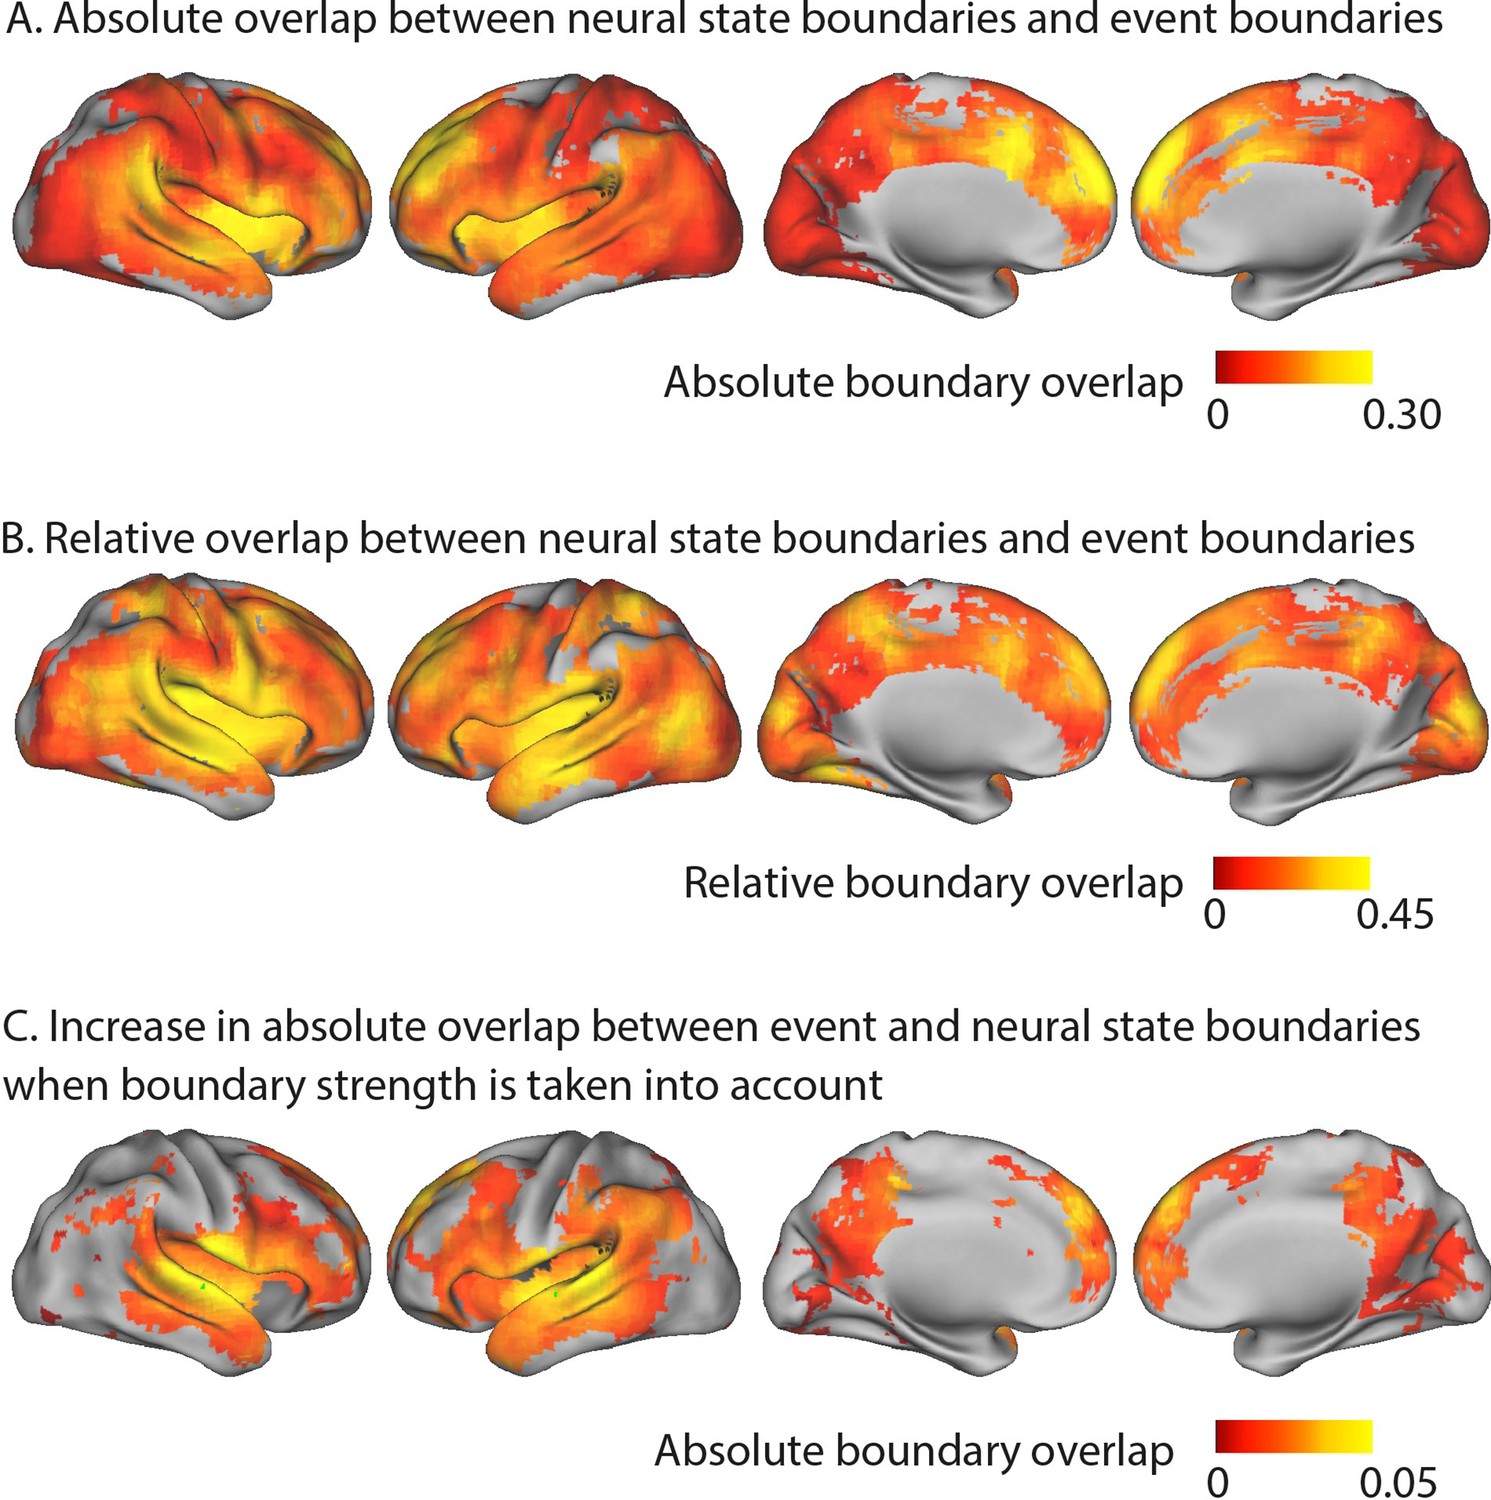
Overlap between neural state and event boundaries.
(A) Absolute boundary overlap between neural state boundaries and the perceived event boundaries identified by a different group of participants outside the scanner. The metric is scaled between zero (expected overlap) and one (all neural state boundaries overlap with an event boundary). The medial prefrontal cortex, anterior insula, anterior cingulate cortex, and left superior and middle frontal gyrus show the strongest alignment between neural state boundaries and perceived event boundaries. (B) Relative overlap between neural state boundaries and perceived event boundaries (scaled w.r.t. the maximal possible overlap given the number of neural state boundaries). Regions in different parts of the cortical hierarchy (early and late) show a significant association between the neural state boundaries and perceived event boundaries. (C) Increase in absolute overlap between neural state boundaries and event boundaries when neural state boundaries are weighted by their strengths, in comparison to using binary boundaries (as in A). Regions with strong neural state boundaries (i.e., a large change between successive states) were more likely to overlap with perceived event boundaries than weak boundaries. Statistical analyses for (A–C) were based on data from 15 independent groups of participants, the depicted difference/overlap values were based on data in which all 265 participants were averaged together. All of the colored regions showed a significant association after false discovery rate (FDR) correction for multiple comparisons.
Figure 3
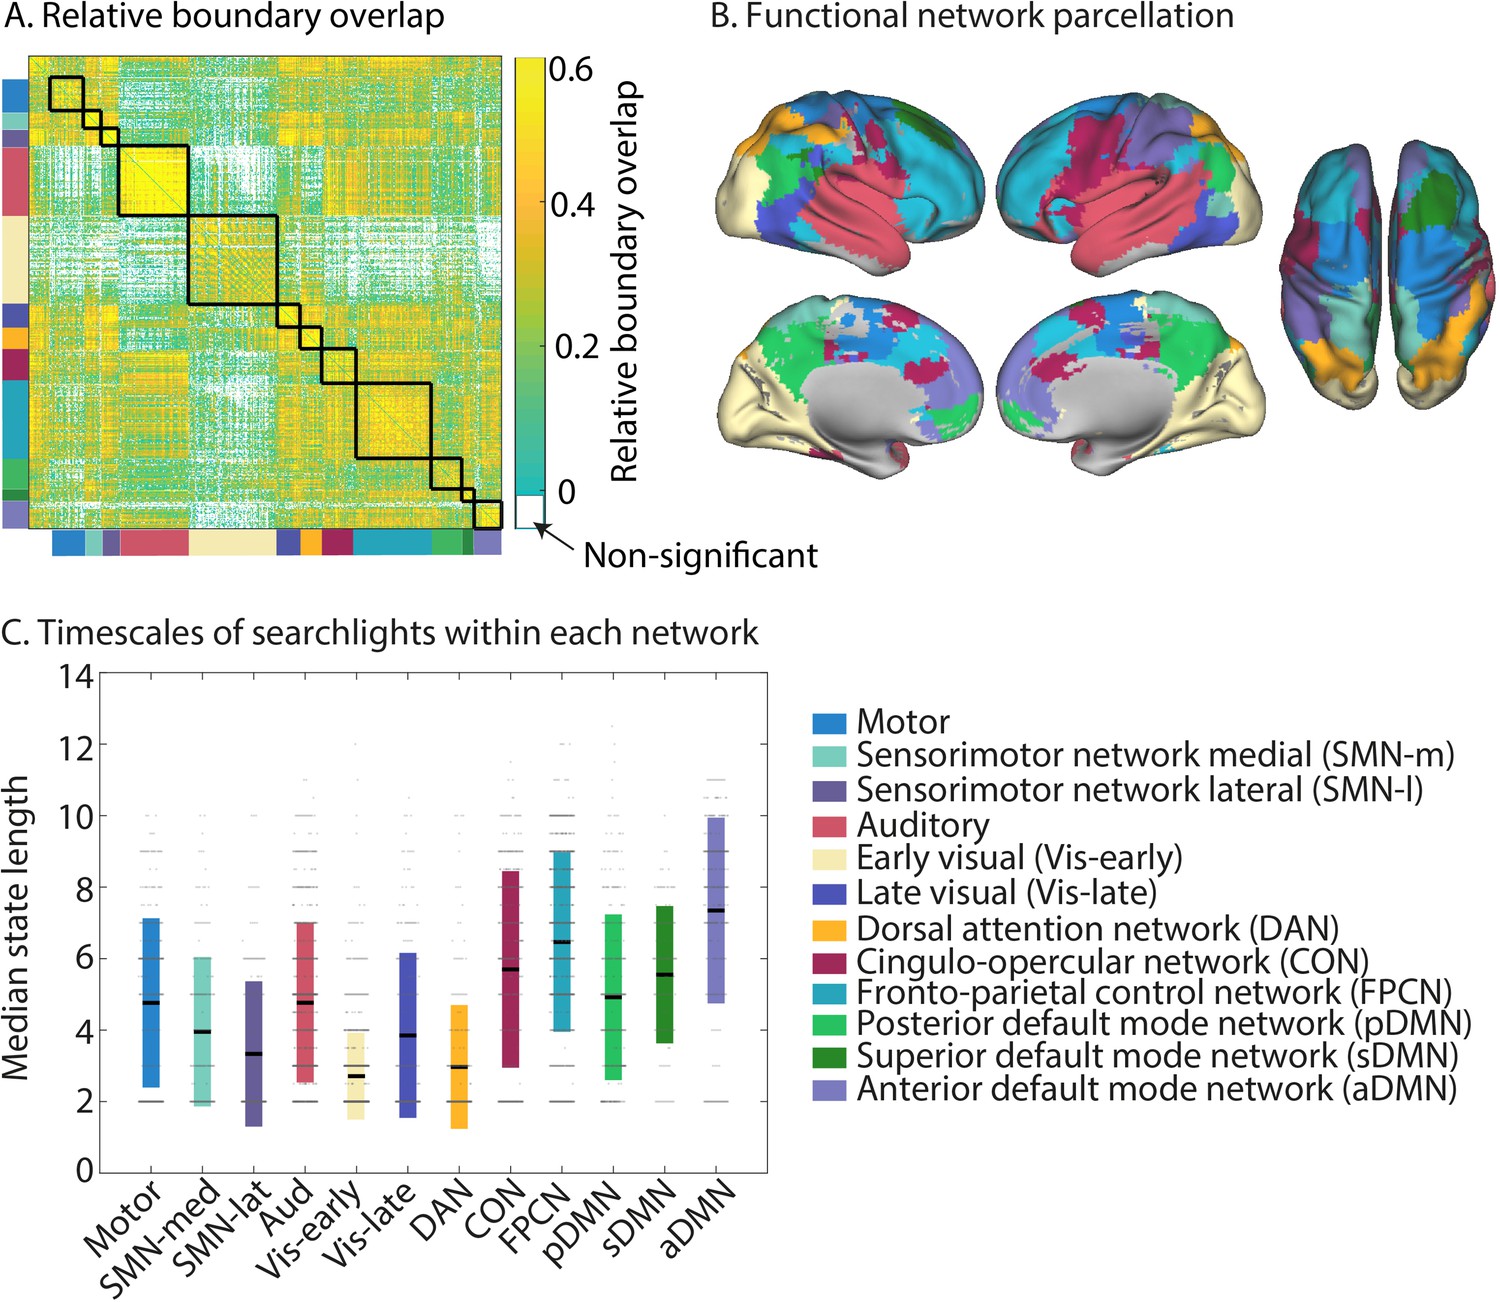
Neural state boundaries are shared within and across distinct functional networks that span the cortical hierarchy.
(A) The relative boundary overlap between each pair of searchlights, ordered according the functional networks they are in. The black lines show the boundaries between functional networks. Searchlight pairs shown in white did not have significant relative boundary overlap after false discovery rate (FDR) correction for multiple comparisons. (B) Visualization of the detected functional networks. The network label at each voxel is determined by the functional network that occurs most often in all the searchlights that overlap with that voxel. (C) Visualization of the neural state durations within each network. Each searchlight is shown as a dot. The colored bars show the mean and 1 standard deviation around the mean for each network. The data shown in (A–C) are based on data averaged across all participants. The test for statistical significance in (A) was performed with data of 15 independent groups of participants. All of the colored regions in (A) showed a significant association after FDR correction for multiple comparisons.
Figure 4
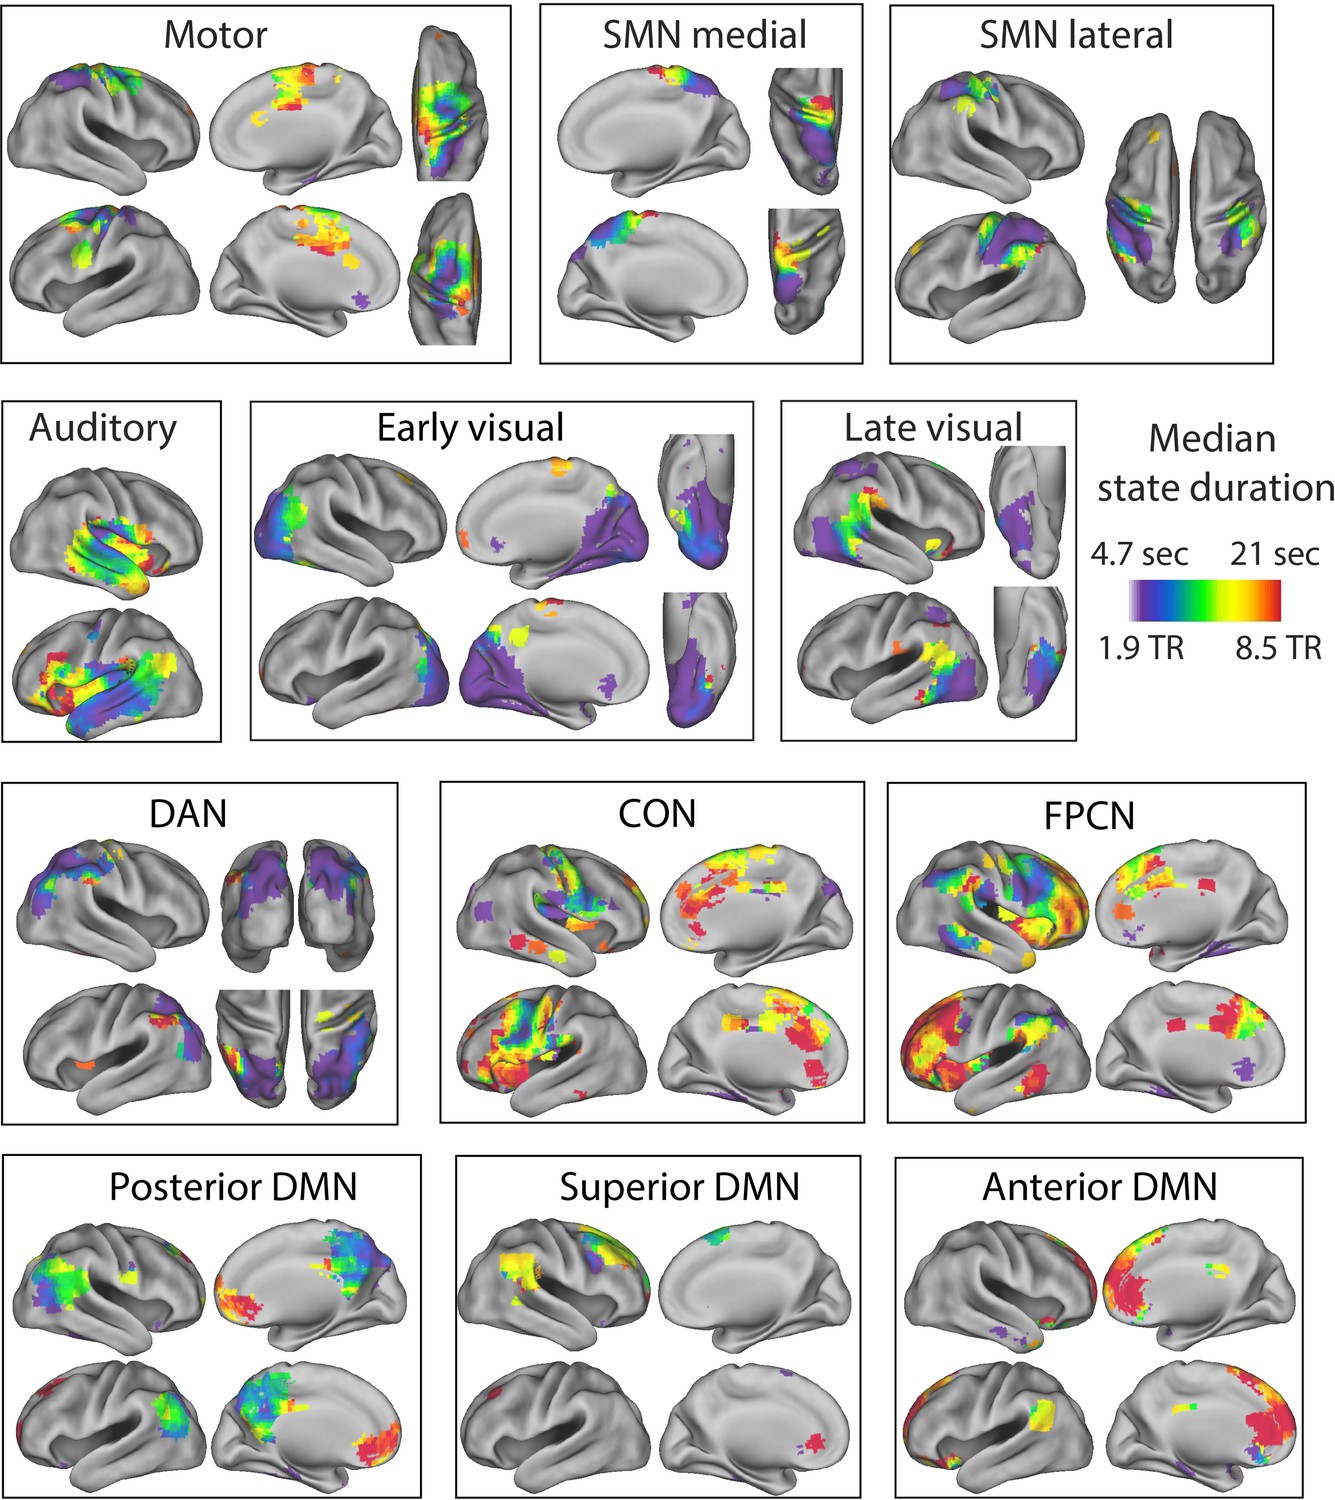
Separate visualizations for each of the identified functional networks.
The colors indicate the median state duration for each of the searchlights within the functional network. SMN, sensorimotor network; DMN, default mode network; FPCN, fronto-parietal control network; CON, cingulo-opercular network; DAN, dorsal attention network. The median state duration estimates are based on data averaged across all participants.
Figure 5
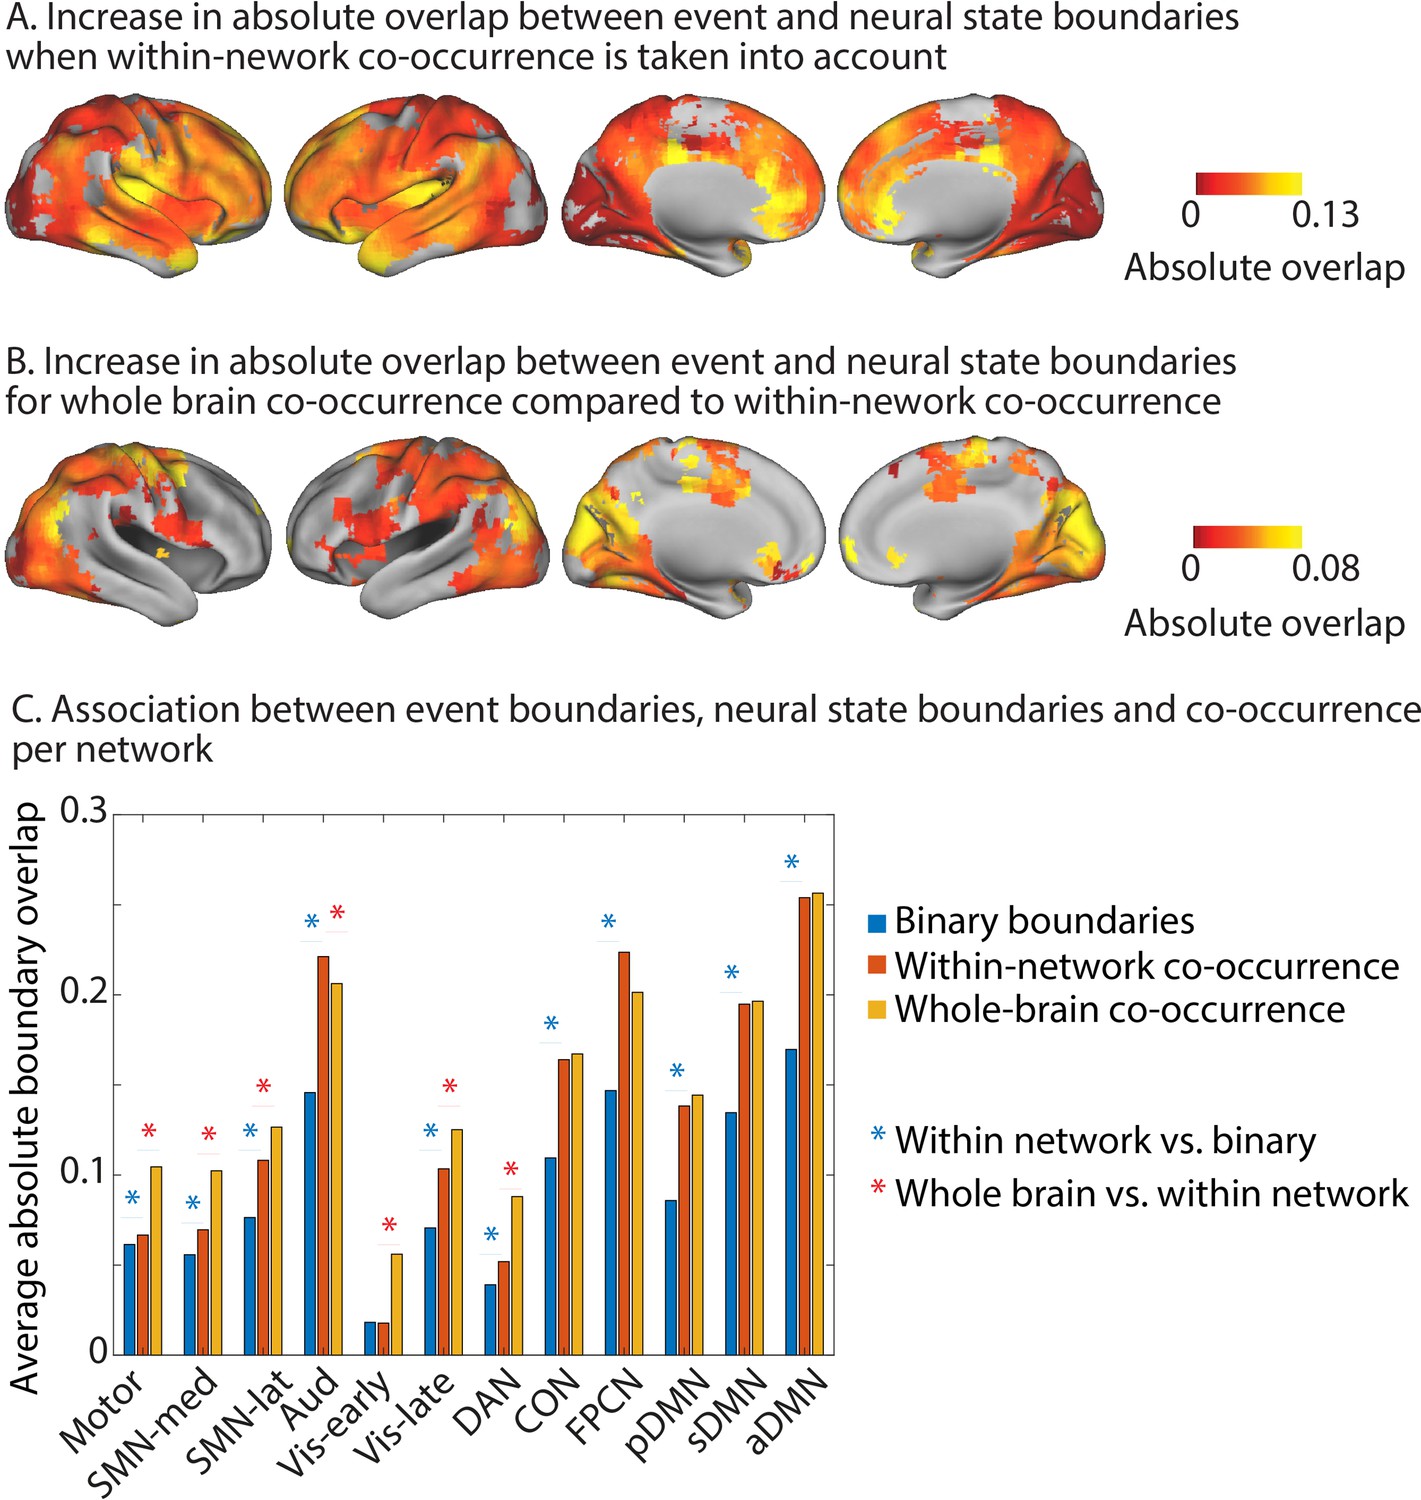
Increase in absolute overlap between neural state boundaries and event boundaries when boundary co-occurence is taken into account.
Increase in absolute overlap between neural state boundaries and event boundaries when neural state boundaries are weighted by the percentage of searchlights in the same functional networks or across the whole brain that also have a boundary at the same timepoint. (A) Within-network-weighted absolute overlap is compared to using binary boundaries (as in Figure 2A). (B) Whole-brain-weighted absolute overlap is compared to within-network-weighted absolute overlap. (C) The average absolute boundary overlap between events and neural states within each functional network. This is done for both binary boundaries, boundaries weighted by within-network co-occurrence, and boundaries weighted by whole-brain co-occurrence. A red star indicates a significant difference between binary boundaries and boundaries weighted by within-network co-occurrence. A blue star indicates a significant difference between boundaries weighted by whole-brain co-occurrence and boundaries weighted by within-network co-occurrence. The data shown in (A–C) are based on data averaged across all participants. The tests for statistical significance were performed with data of 15 independent groups of participants. All of the colored regions in (A, B) showed a significant association after false discovery rate (FDR) correction for multiple comparisons.
Figure 6
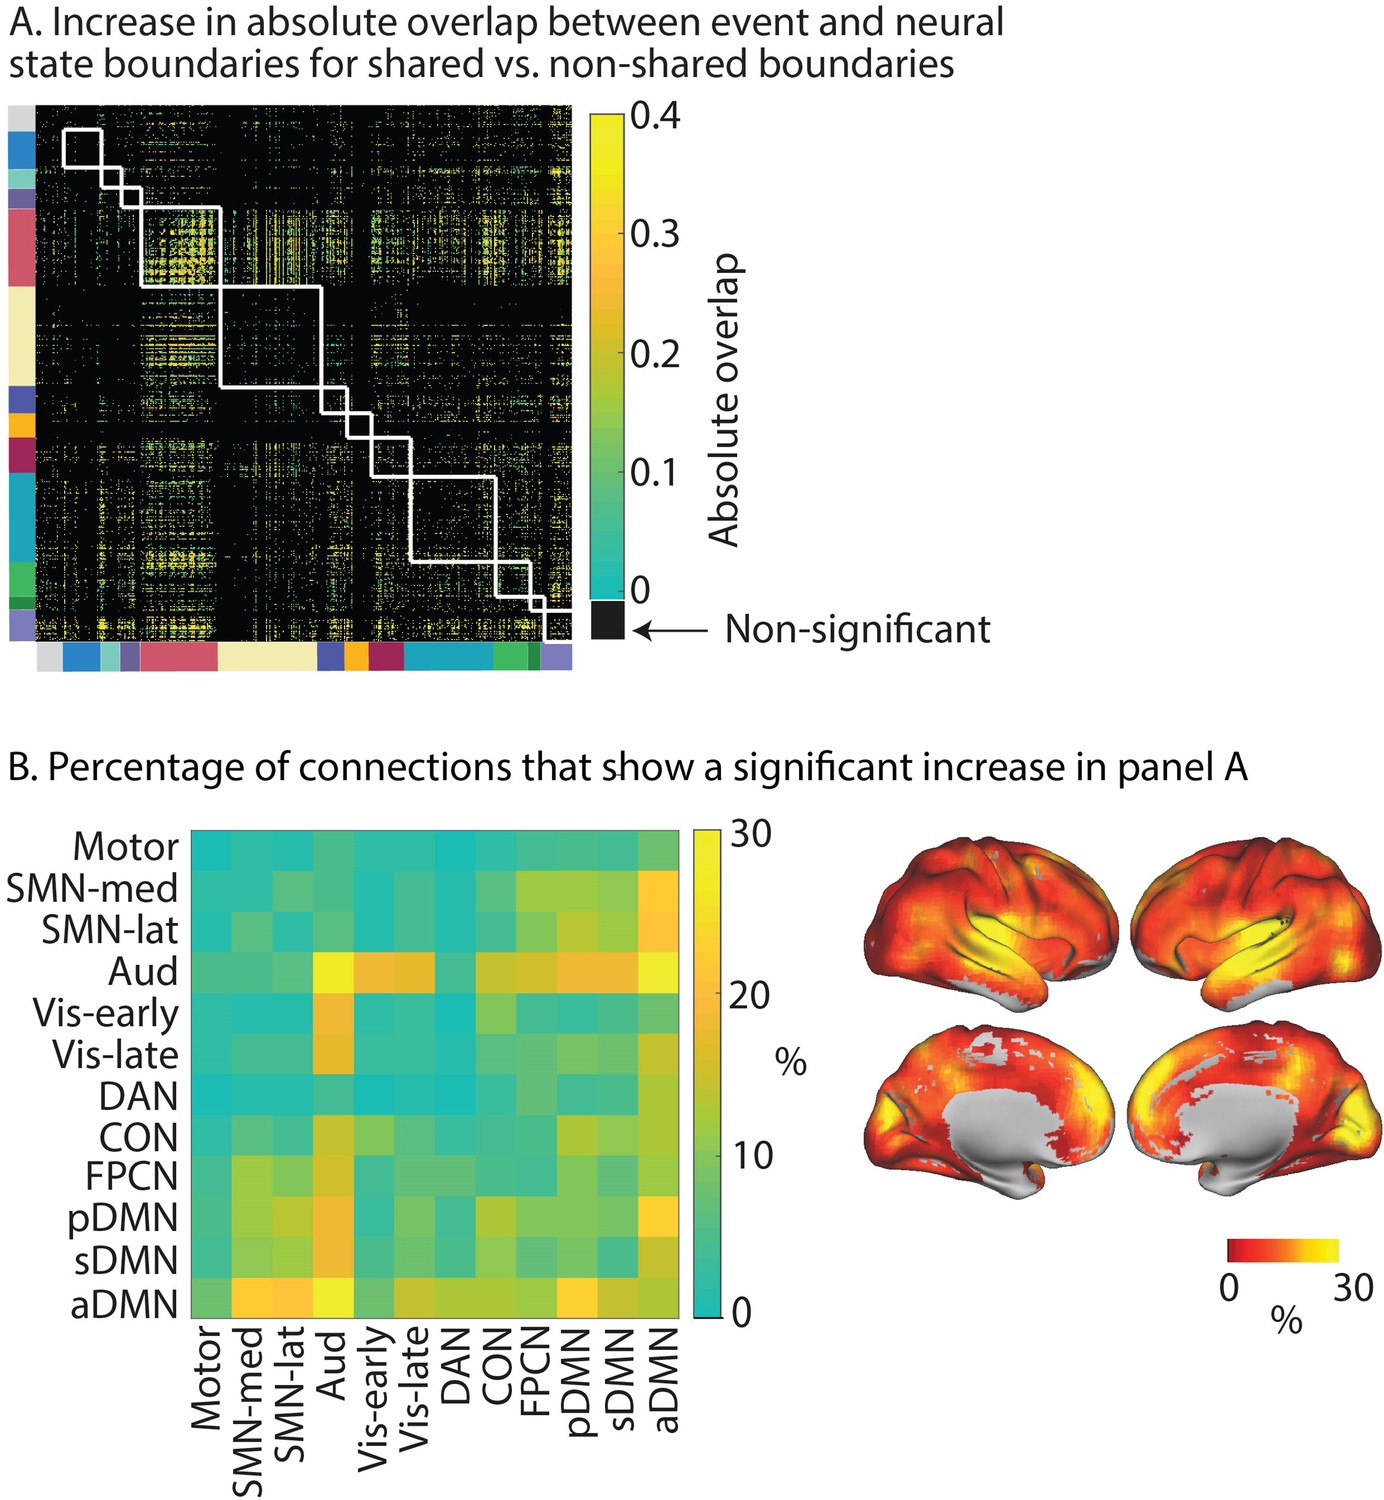
Increase in absolute overlap with event boundaries for shared vs. non-shared neural state boundaries.
(A) For each pair of searchlights, we compare the relative boundary overlap between neural state boundaries between boundaries that are shared and boundaries that are not shared. In particular, for each pair of searchlights, the searchlight with the highest relative boundary overlap with events is used as the reference in the comparison. The white lines show the boundaries between functional networks. (B) shows the percentage of connections in (A) that show a significant increase in relative boundary overlap with events for shared vs. non-shared neural state boundaries. Here, the data are summarized to a network-by-network matrix for ease of interpretation. The data shown in this figure are based on data averaged across all participants. The tests for statistical significance were performed with data of 15 independent groups of participants. All of the colored regions in (A) showed a significant association after false discovery rate (FDR) correction for multiple comparisons.
Figure 7
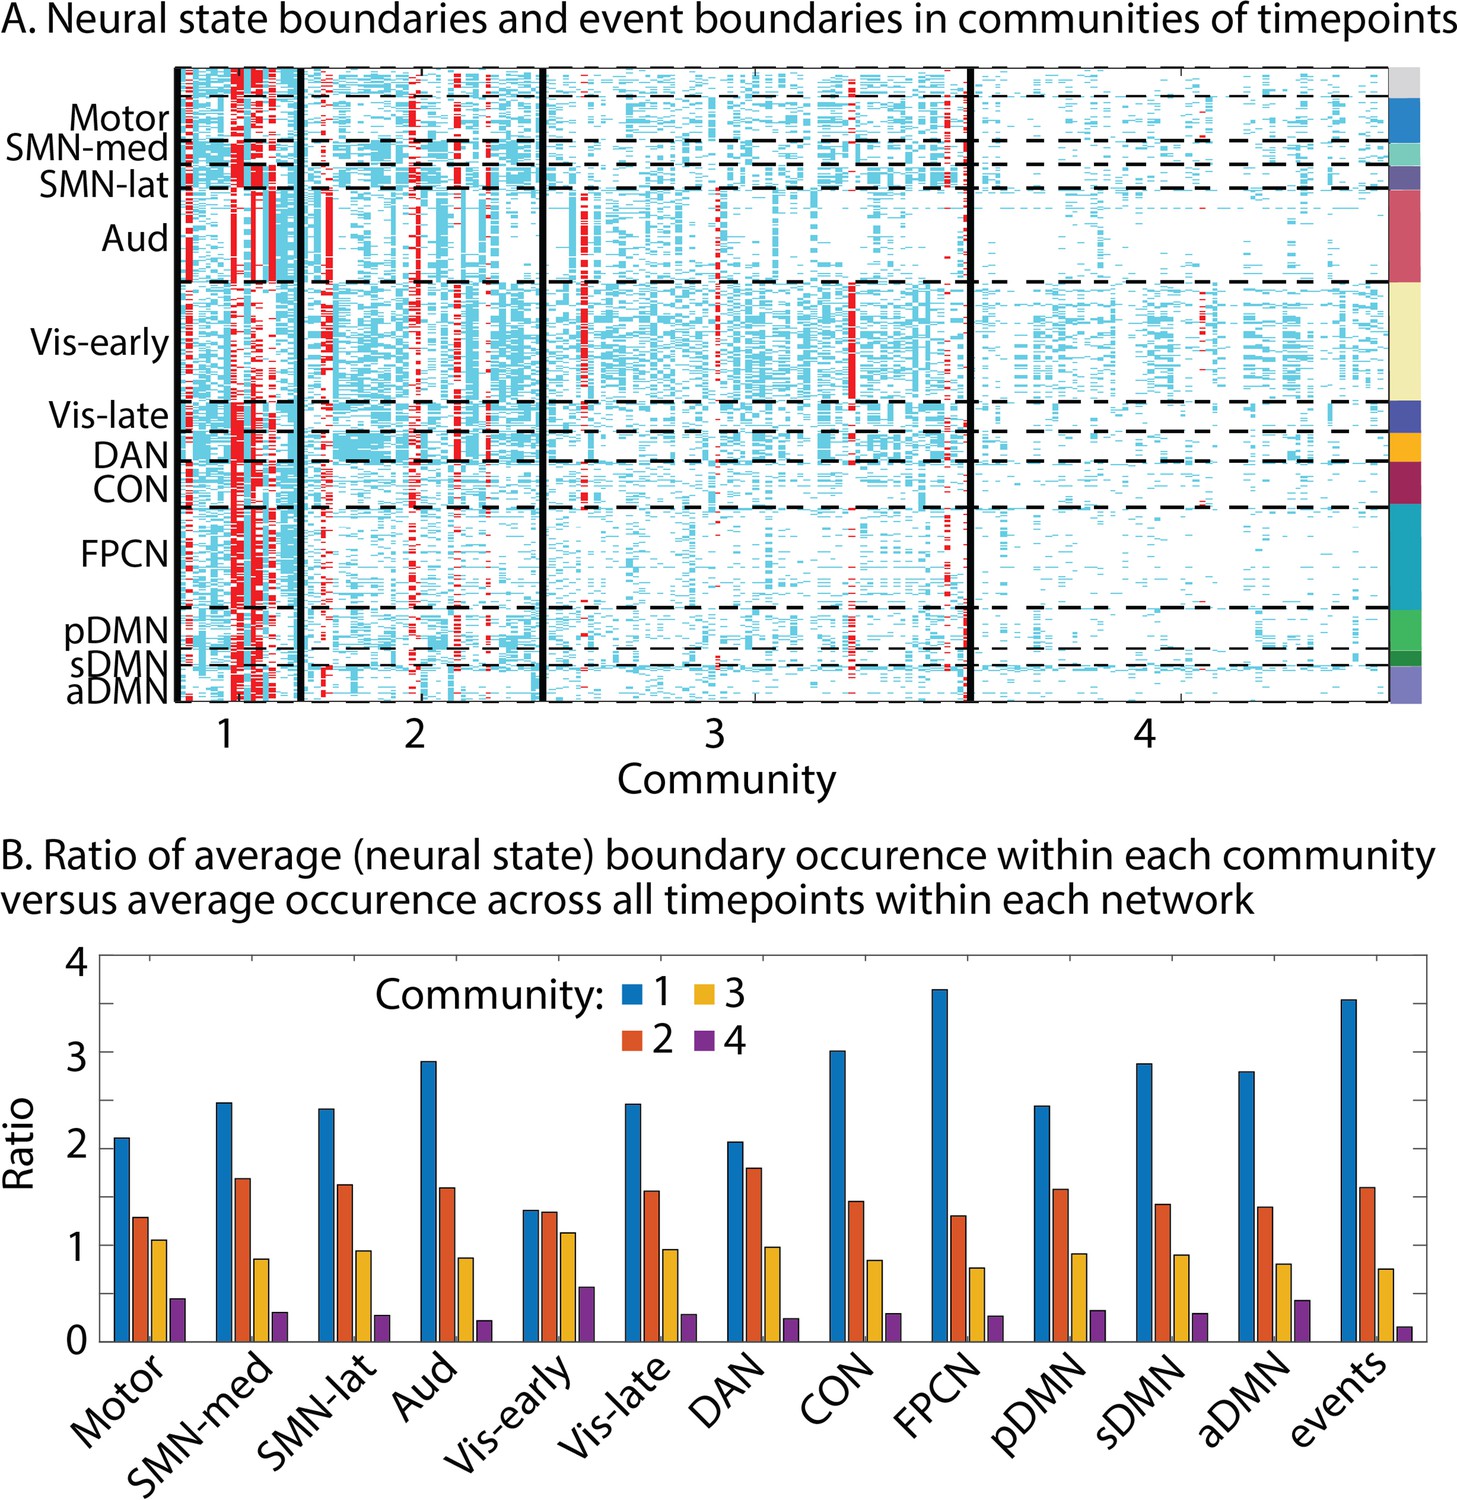
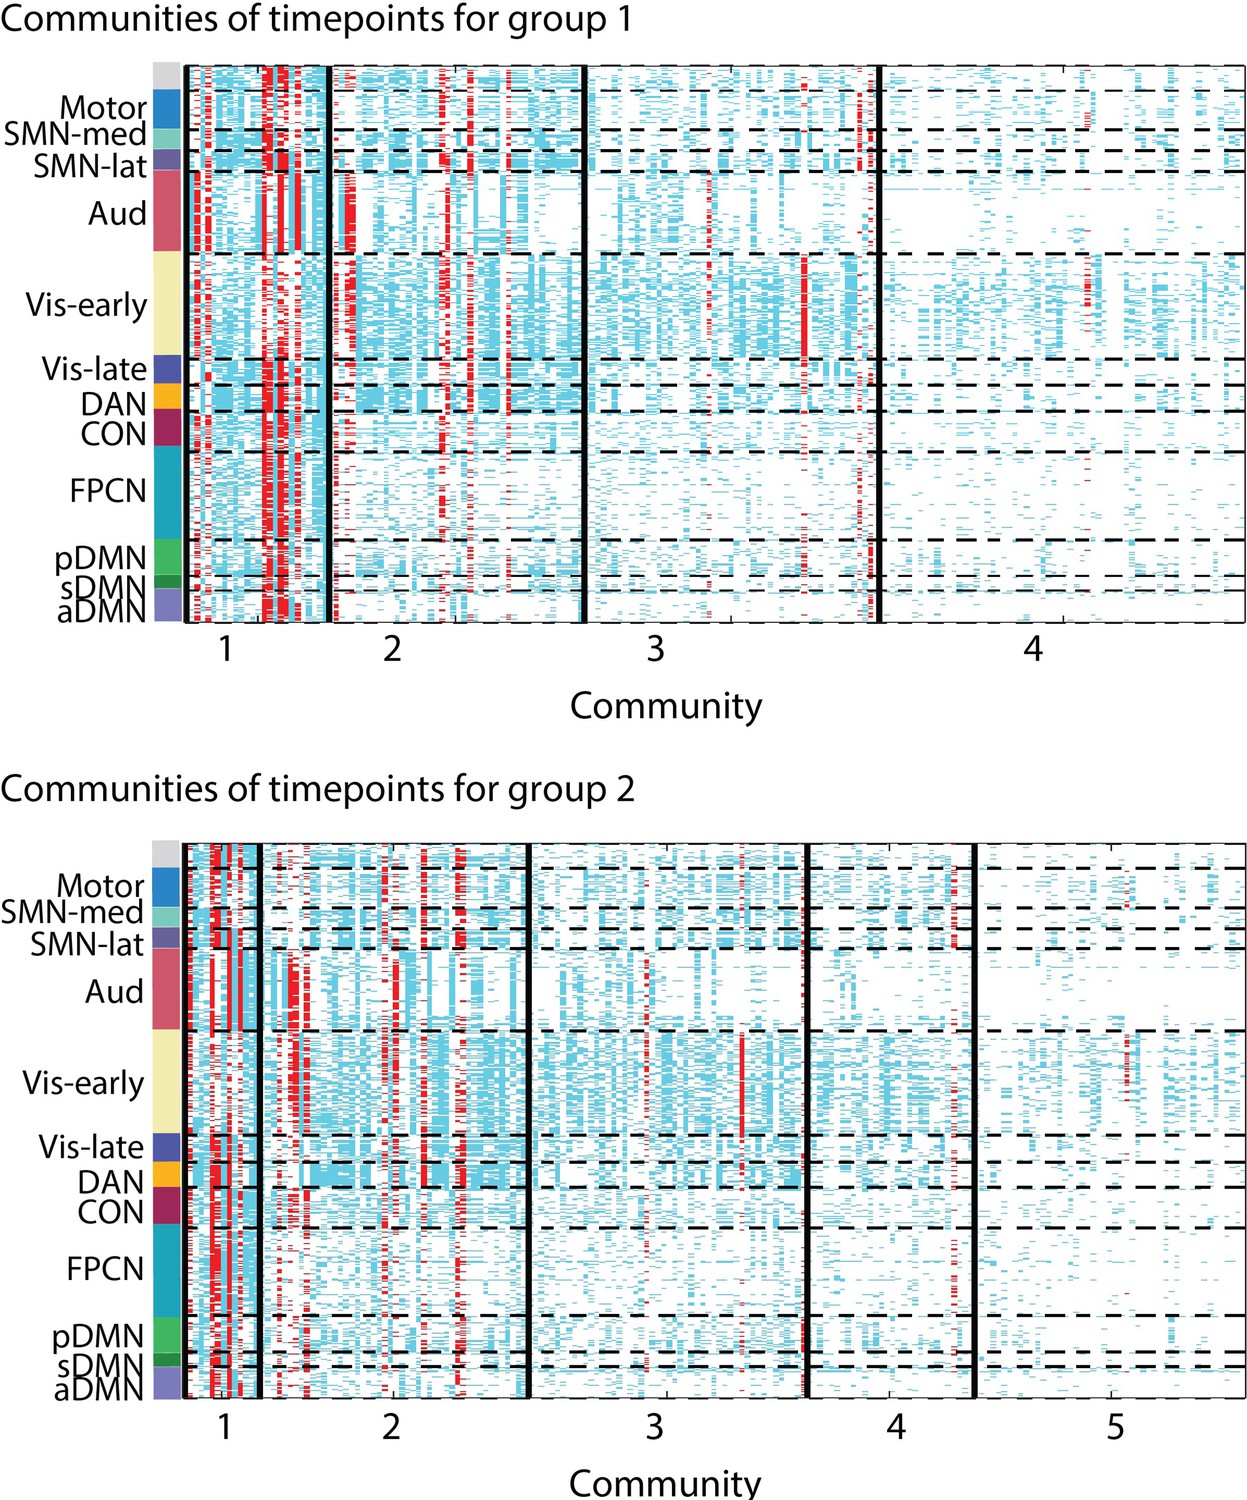
Communities of timepoints identified with weighted stochastic block model (WSBM).
This algorithm groups together timepoints that show similar boundary profiles (presence or absence of boundaries across searchlights). (A) Neural state boundaries are shown for each community per timepoint for each searchlight, grouped in functional networks. Boundaries shown in red coincide with an event boundary. (B) Per functional network, we show the ratio of the average state boundary occurrence within each community versus the average occurrence across all timepoints. The same is shown for the event boundaries. The data shown in this figure are based on data averaged across all participants.
Appendix 1—figure 1
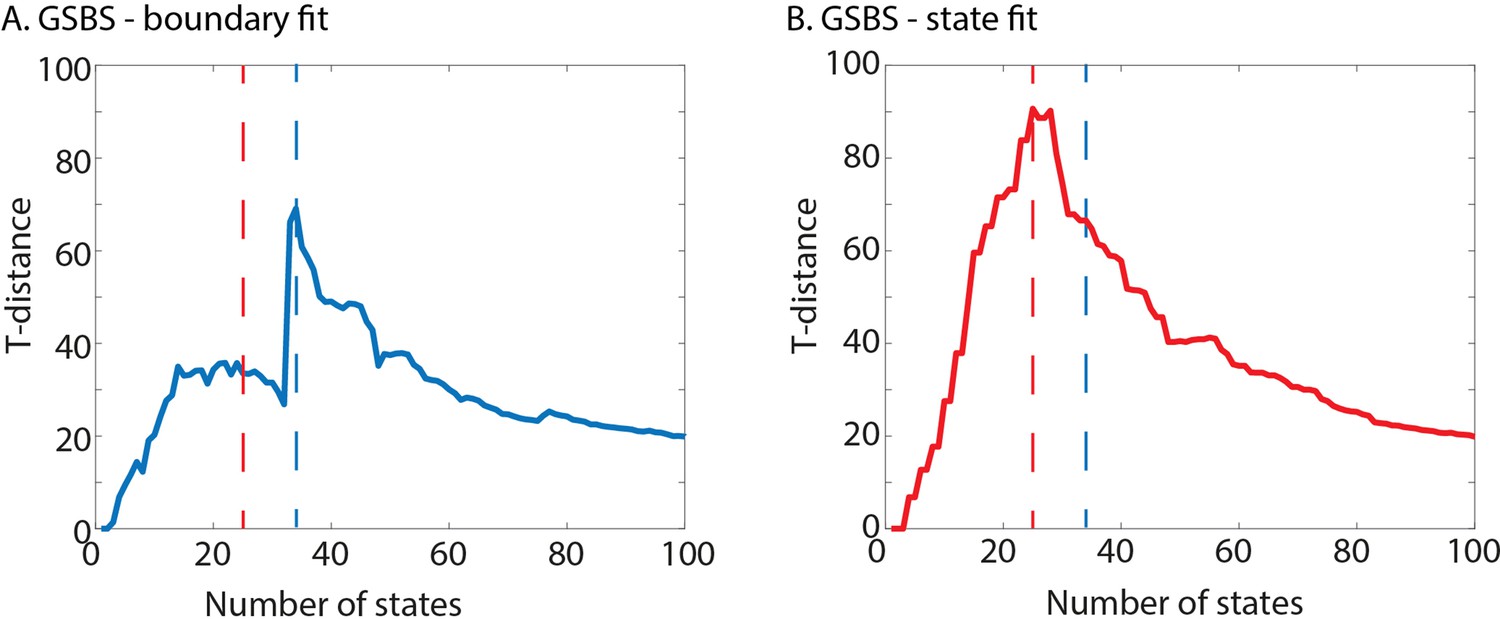
T-distance curves and the optimal number of states for the different versions of the greedy state boundary search (GSBS) algorithm.
(A) The t-distance curve for the original GSBS implementation for an example brain region. (B) The t-distance curve for the same brain region with the new option to place two boundaries in one iteration of the algorithm. The dotted lines indicated the optimal number of states for the original GSBS algorithm (blue line) and the states-GSBS algorithm (red line).
Appendix 1—figure 2
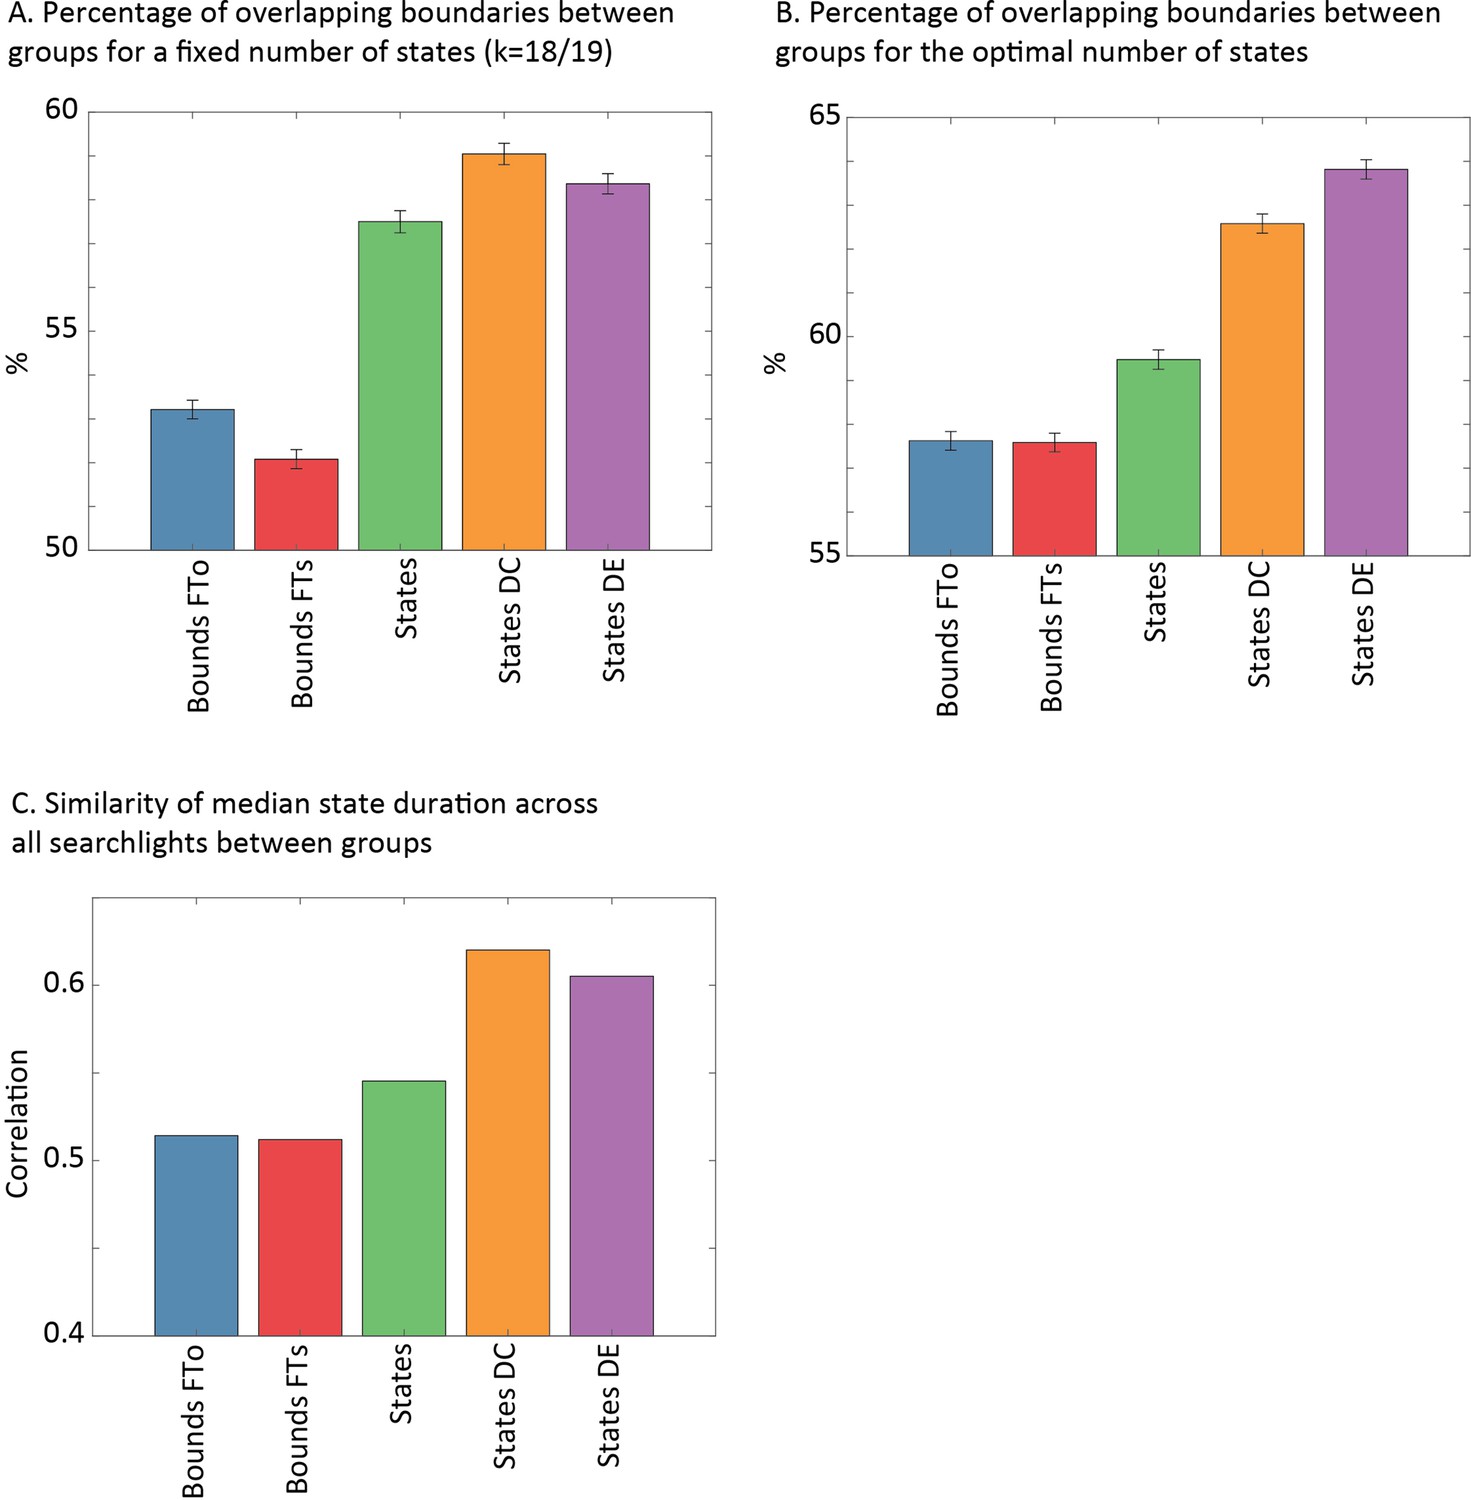
Comparing different implementations of the greedy state boundary search (GSBS) algorithm and different data preprocessing steps.
(A) The percentage of overlapping boundaries between two independent groups for each searchlight. The bar shows the mean across 5029 searchlights, while the error bar shows the standard error. The number of states was fixed to k = 18/19. (B) Same as (A) but now the number of states was determined by the optimal t-distance. (C) The correlation between the estimated median state lengths over all searchlights between two independent groups (correlation computed across 5029 searchlights). Bounds FTo = the original GSBS implementation; bounds FTs = the GSBS implementation with strength-ordered fine-tuning; states = the states-GSBS implementation that can place two boundaries at a time; states DC = states GSBS applied to data deconvolved with a canonical hemodynamic response function (HRF); states DE = states GSBS applied to data deconvolved with an estimated HRF.
Appendix 1—figure 3
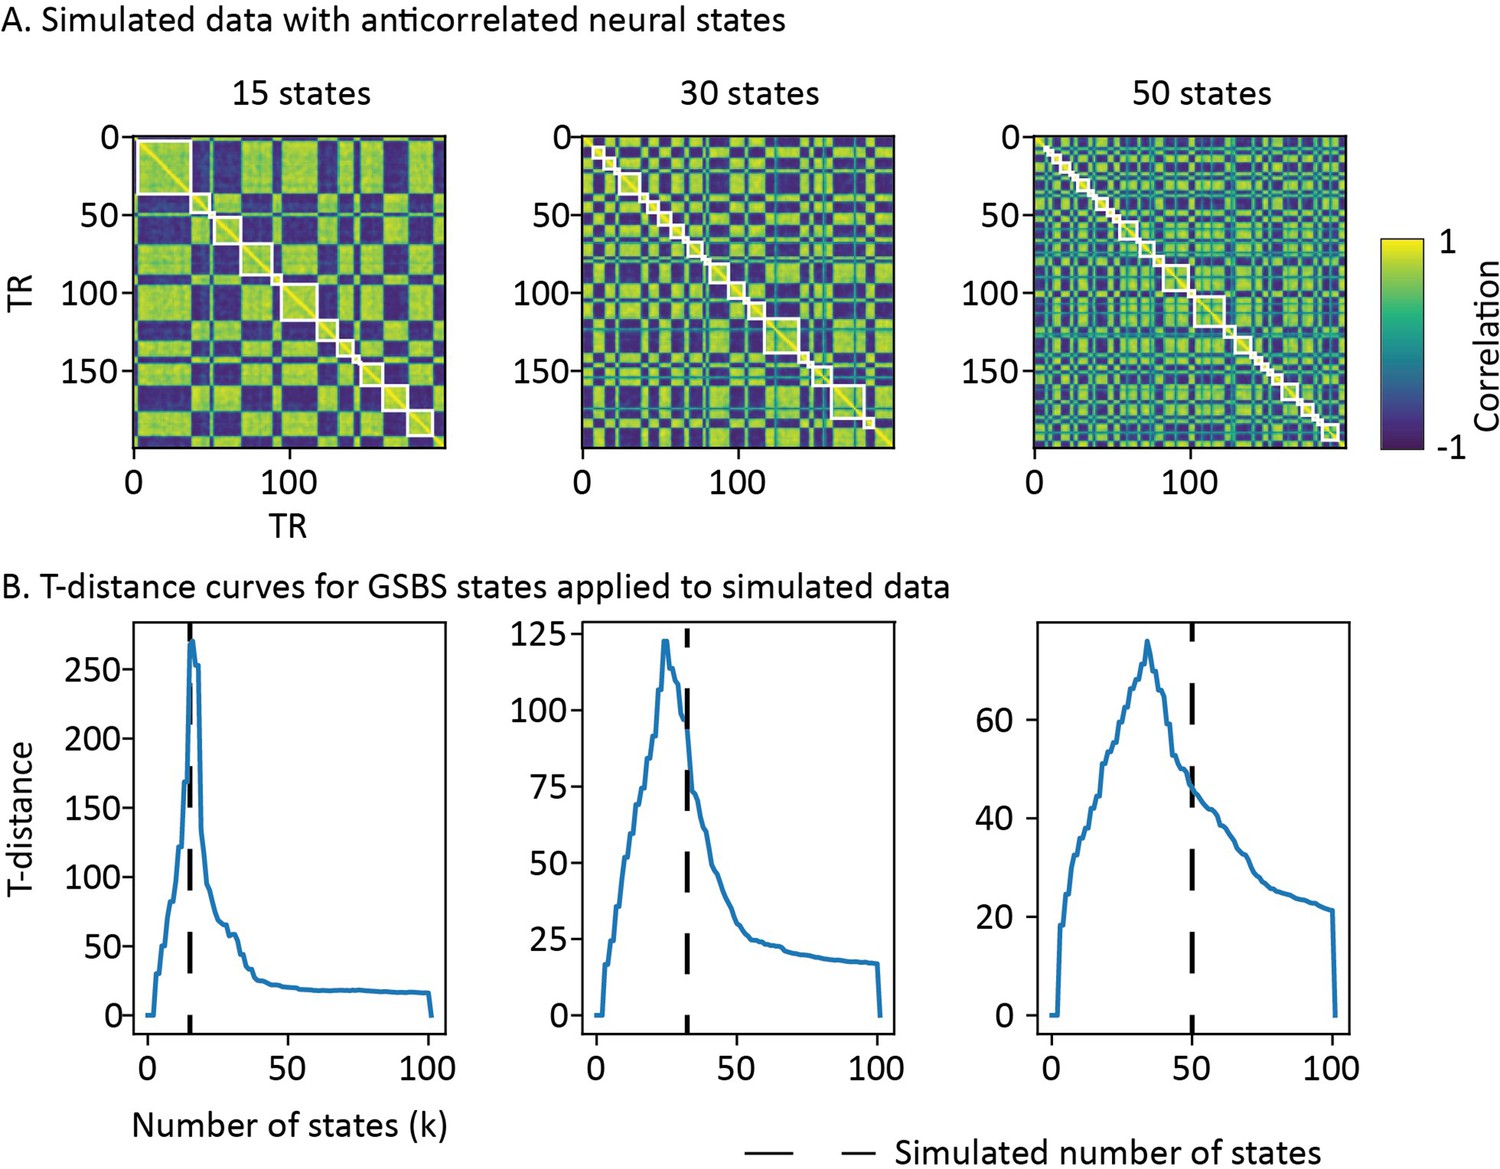
Performance of states-GSBS on simulated data with anticorrelated states and (from left to right) 15, 30, or 50 states.
(A) The correlation matrices with the detected neural state boundaries in white. (B) The t-distance curves, where the black line indicates the simulated number of states. For k = 30 and k = 50, the t-distance peaks at a number of states that is below the simulated number of states, suggesting that some of the boundaries of short-lasting neural states are not detected. GSBS, greedy state boundary search.
Appendix 1—figure 4

Estimated hemodynamic response function (HRF) peak delays and the impact of HRF peak delay on the estimated number of states in simulated data.
(A) The estimates of the HRF peak delays for all searchlights are shown in a histogram. The values are averaged across all participants within each of the independent groups. The distribution is highly similar for both groups. (B) t-distance curves are shown for simulated data with different HRF delays that are deconvolved with a canonical HRF. There is no systematic under- or overestimation of the number of states when the HRF peak delays are in the range of the empirical data.
Appendix 1—figure 5
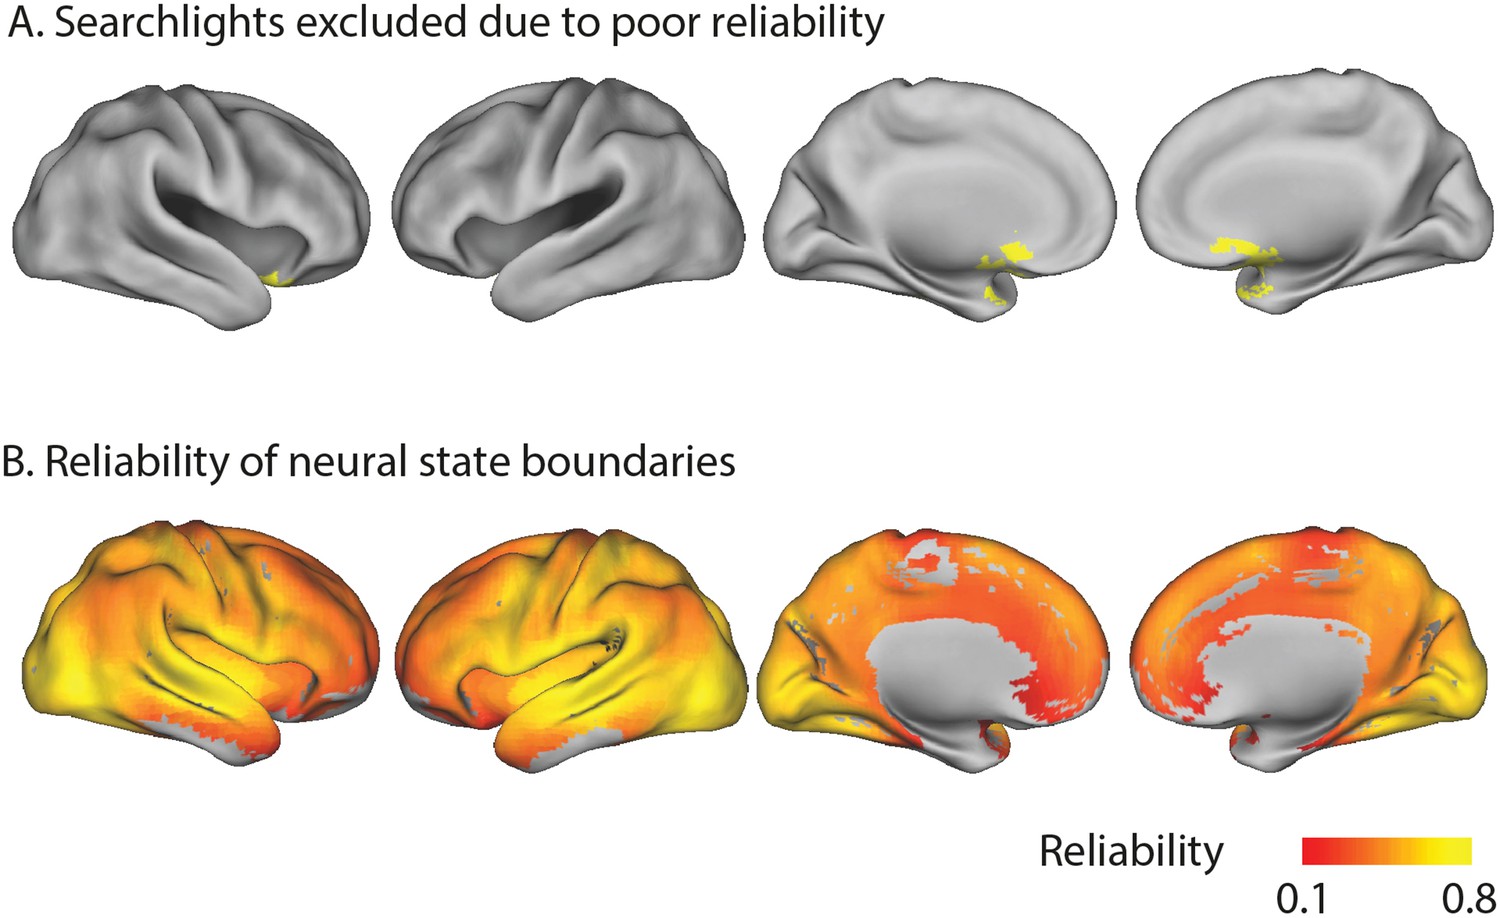
Reliability of neural states boundaries across the brain and an overview of searchlights that were excluded due to poor reliability.
(A) Searchlights that were excluded due to poor reliability. (B) A map of the reliability of neural state boundaries across the cortex.
Appendix 1—figure 6
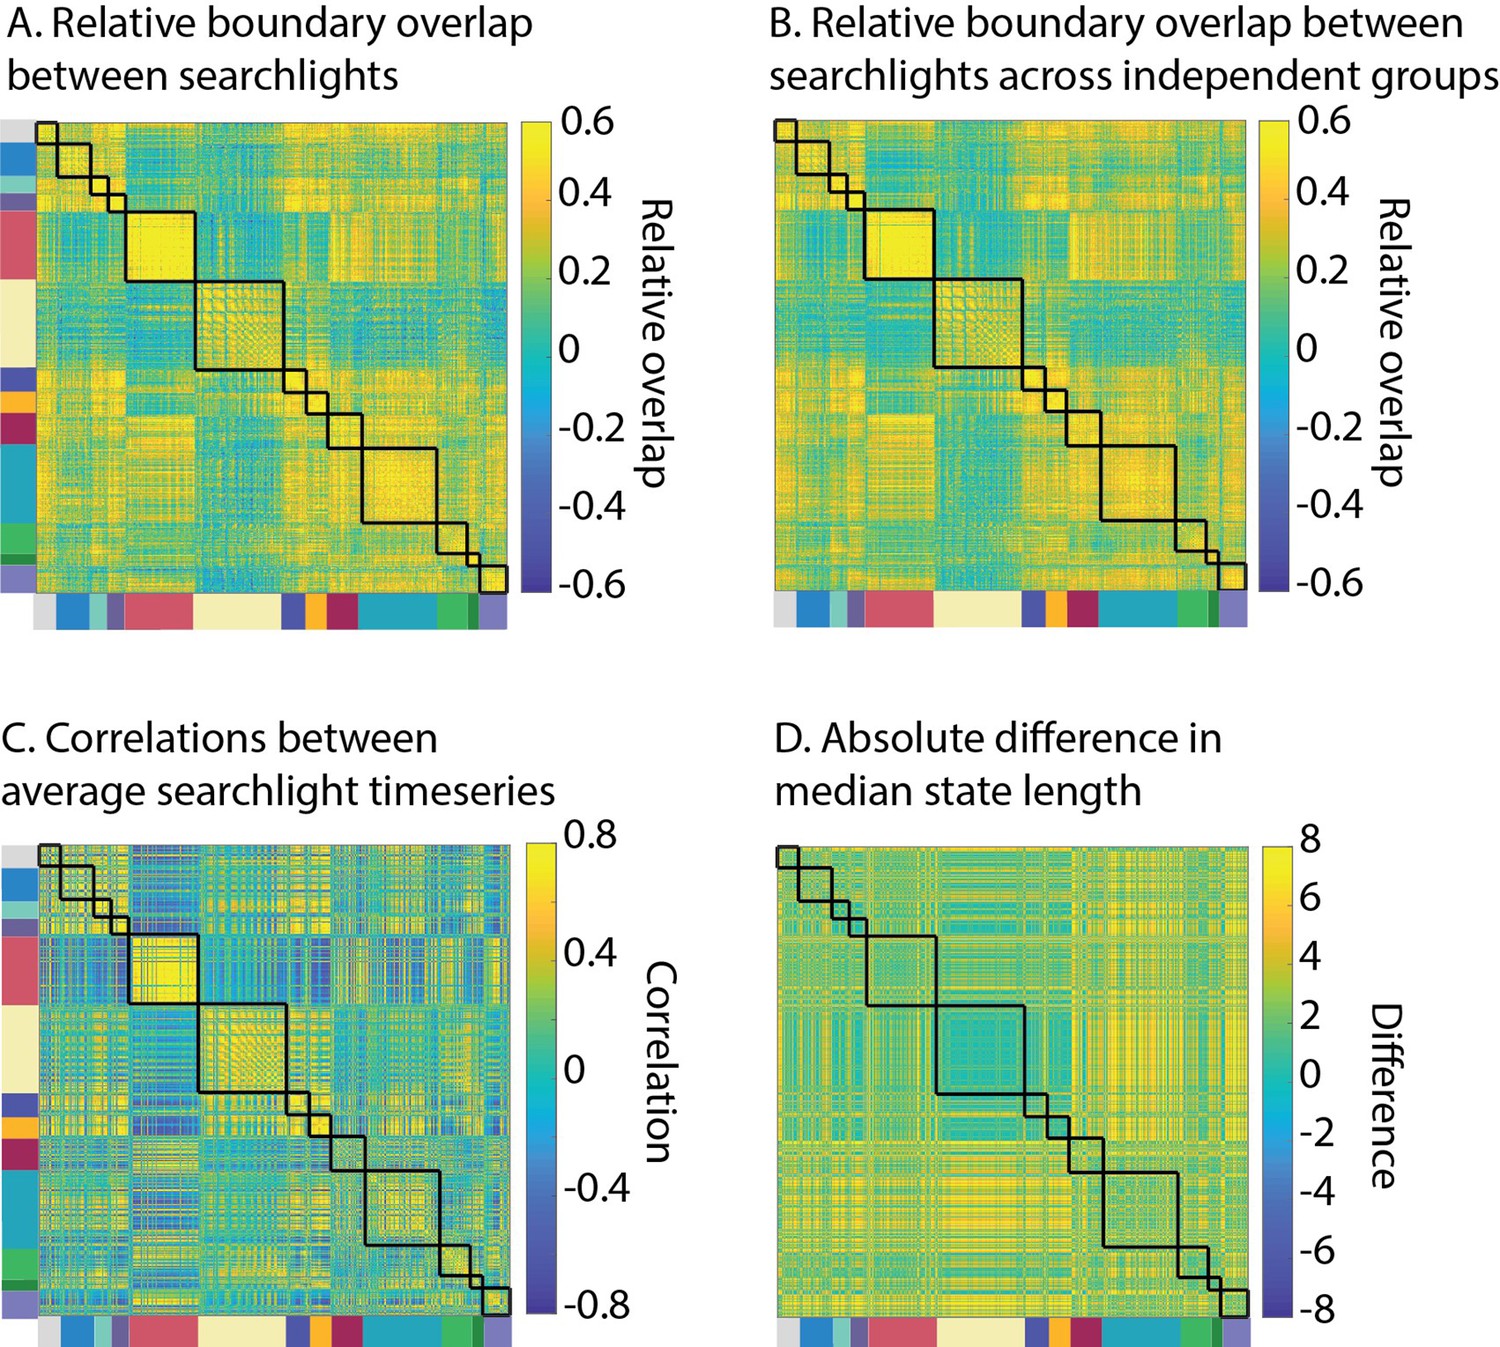
Investigating the role of shared noise, ‘ regular’ functional connectivity and regional differences in state length in shaping the boundary overlap between pairs of searchlights.
(A) The relative neural state boundary overlap between each pair of searchlights. (B) Same as (A), but computed between two independent groups of participants. This ensures that the overlap cannot be caused by noise shared across brain regions. (C) The correlation matrix based on the averaged brain activity time course in each searchlight (i.e., standard measure of functional connectivity). (D) The difference between each pair of searchlights in median state length was markedly different from the relative boundary overlap (shown in A), showing that the boundary overlap between different regions was not just due to regional differences in the optimal number of states.
Appendix 1—figure 7
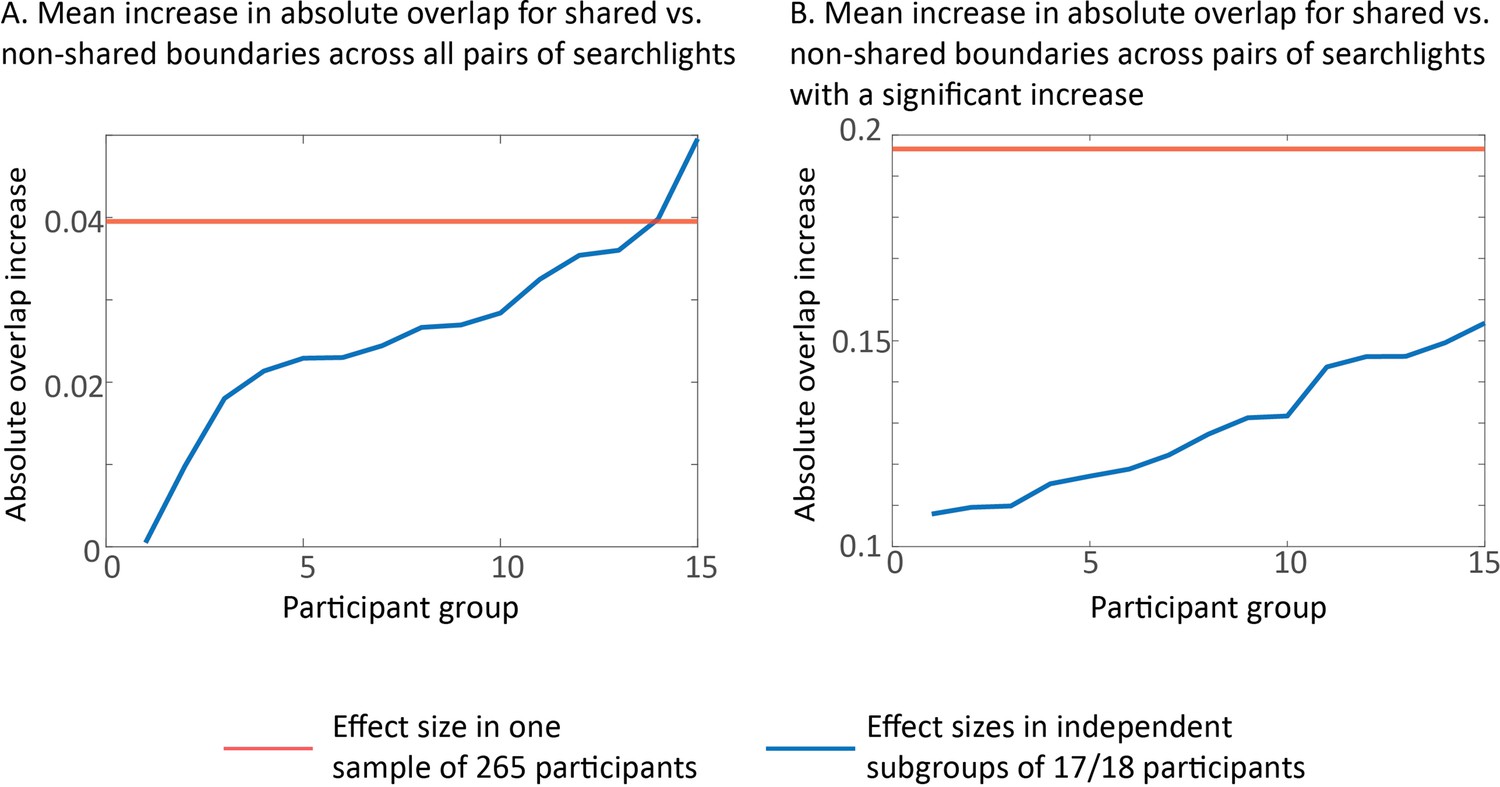
Mean increase in absolute overlap for shared vs. non-shared boundaries for large and small groups of participants.
(A) Mean increase in absolute overlap for shared vs. non-shared boundaries across all pairs of searchlights and (B) for the pairs of searchlights that showed a significant increase in overlap.The effect size for the full sample of 265 participants is shown by the red line, and the effect sizes for the independent subgroups of 17/18 participants are shown in blue. The effect size is larger in the data averaged across all 265 participants, suggesting that the increase in overlap is not due to noise reduction.
Appendix 1—figure 8
Stability of communities of timepoints across two independent groups of participants.
Tables
Appendix 1—table 1
For each network, the table lists the network defined by Power et al., 2011 that showed the highest overlap and the percentage of searchlights in the network that overlapped with that particular Power et al., 2011 network.
| Network name | Power network | Percentage of searchlights |
|---|---|---|
| Motor | Sensorimotor | 49 |
| Sensorimotor-medial | Sensorimotor | 45 |
| Sensorimotor-lateral | Sensorimotor | 37 |
| Auditory | Auditory | 24 |
| Visual early | Visual | 58 |
| Visual late | Visual | 20 |
| Dorsal attention network | Dorsal attention network | 27 |
| Cinglulo-opercular network | Cinglulo-opercular network | 23 |
| Fronto-parietal control network | Fronto-parietal task control | 24 |
| Posterior default mode network | Default mode network | 57 |
| Superior default mode network | Default mode network | 24 |
| Anterior default mode network | Default mode network | 68 |
Appendix 1—table 2
For the three separate default mode networks (DMNs) we identified, the table lists the overlap with the posterior and anterior DMN defined in Campbell et al., 2013.
| Network name | Percentage of searchlights that overlap with anterior DMN | Percentage of searchlights that overlap with posterior DMN |
|---|---|---|
| Posterior DMN | 39 | 70 |
| Superior DMN | 52 | 31 |
| Anterior DMN | 77 | 65 |
Additional files
Download links
A two-part list of links to download the article, or parts of the article, in various formats.
Downloads (link to download the article as PDF)
Open citations (links to open the citations from this article in various online reference manager services)
Cite this article (links to download the citations from this article in formats compatible with various reference manager tools)
A partially nested cortical hierarchy of neural states underlies event segmentation in the human brain
eLife 11:e77430.
https://doi.org/10.7554/eLife.77430


