Learning-related contraction of gray matter in rodent sensorimotor cortex is associated with adaptive myelination
- Department of Integrative Medical Biology, Umeå University, Sweden
- IMPACT, Centre de Recherche en Neurosciences de Lyon, France
- Aging Research Center, Department of Neurobiology, Care Sciences and Society, Karolinska Institute, Sweden
- Department of Psychology, University of Gothenburg, Sweden
Figures
Figure 1 with 2 supplements
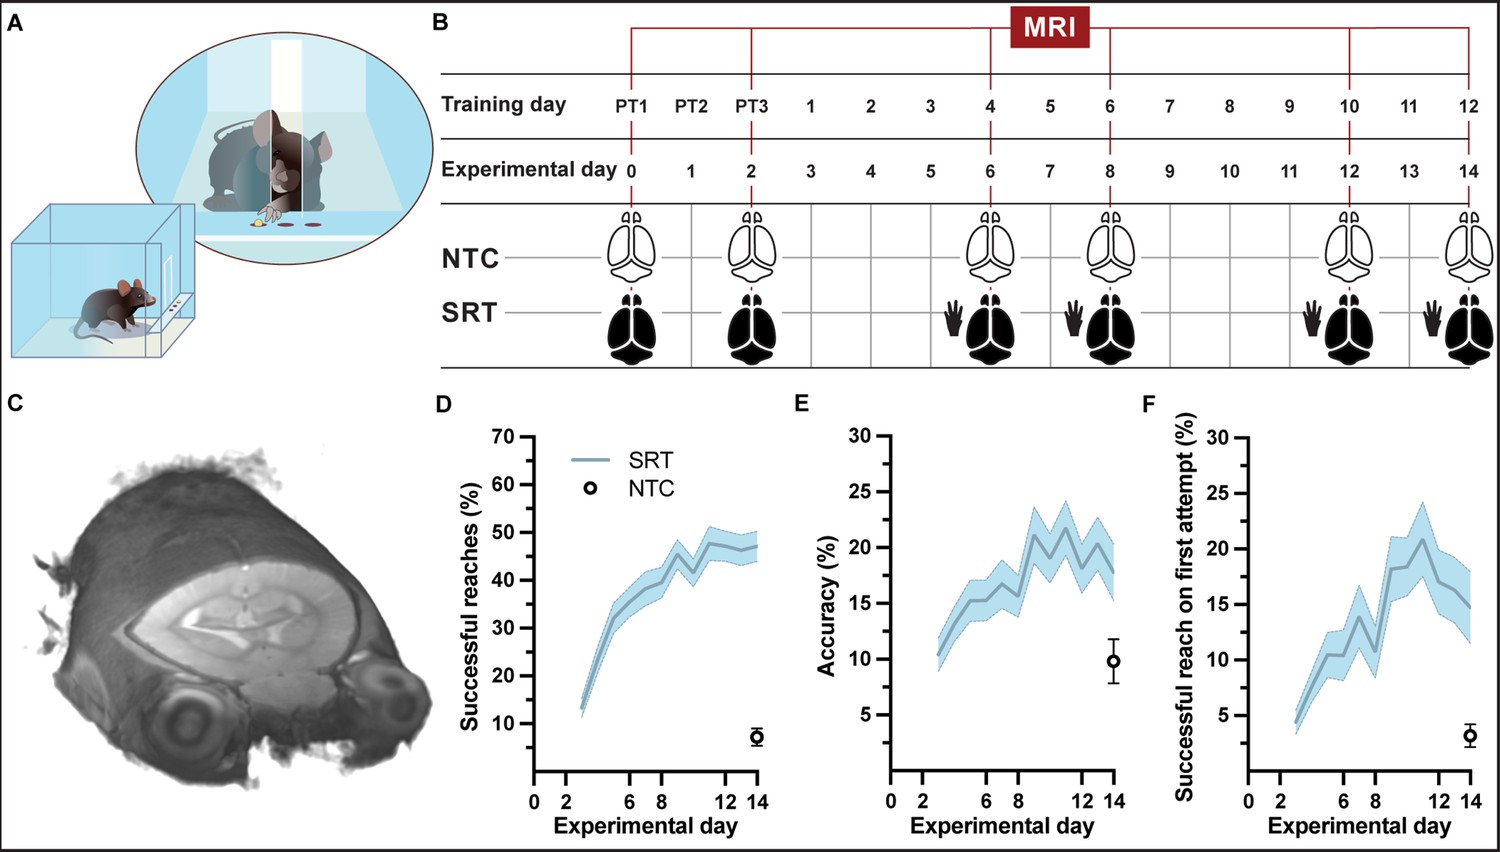
Experimental setup and forelimb reach-and-grasp skill learning.
(A, B) Illustration (A) and MRI timeline (B) during a motor skill behavioral paradigm (SRT: skill reaching trained; NTC: nontrained controls). (C) Example of an individual in vivo T1-weighted MRI at 9.4 T at native resolution (0.1 mm isotropic, radiological display). (D) Mean performance scores during training of a skilled, single-pellet forelimb reach task, calculated as percentage (47 ± 1) of successful reaches (D) and percent (18 ± 1) accuracy (E) or percentage of successful reaches on the first attempted reach (19 ± 1) (F), during the 12-day training paradigm. Plots (D–F) represent the mean and error (SEM) for each performance score of trained subjects; n=37 for experimental days 1-6, n=35 for days 7-8, n=33 for days 9-12, n=31 for days 13-14. Non-trained controls (n=16) were evaluated only at experimental day 14 and the mean and error (SEM) for each performance score is indicated.
Figure 1—figure supplement 1
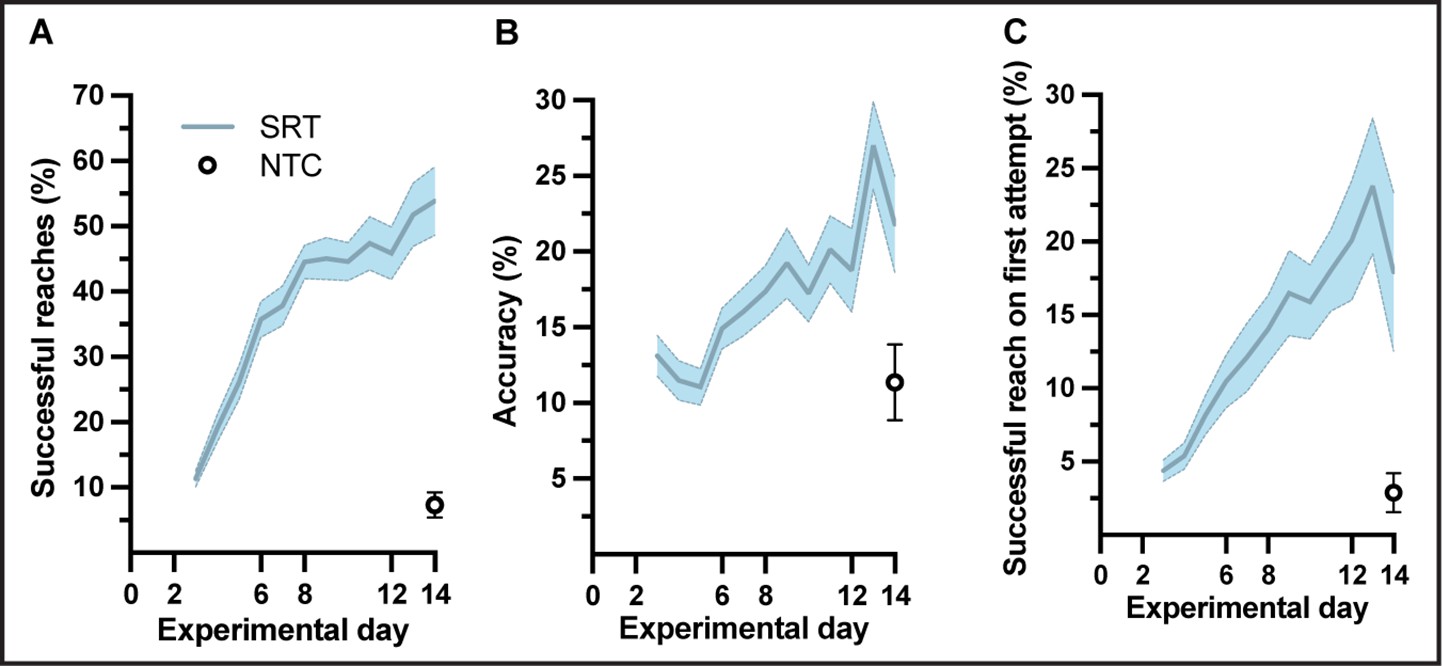
Mean performance scores of animals used for a cross-sectional myelin immunoreactivity during learning of a skilled, single-pellet forelimb reach task.
Performance calculated as percentage (54 ± 5) of successful reaches (A) and percent (22 ± 3) accuracy (B) or percentage of successful reaches on the first attempted reach (C), during the 12-day training paradigm. Plots represent the mean and error (SEM) for each performance score of trained subjects; n=37 for experimental days 1-6, n=35 for days 7-8, n=33 for days 9-12, n=31 for days 13-14. Non-trained controls (n=16) were evaluated only at experimental day 14 and the mean and error (SEM) for each performance score is indicated.
Figure 1—video 1
A forelimb-specific motor learning paradigm (single-pellet skilled reaching task) providing examples of successful skilled reaches as well as unsuccessful attempts to reach and grasp the pellet.
Figure 2 with 4 supplements
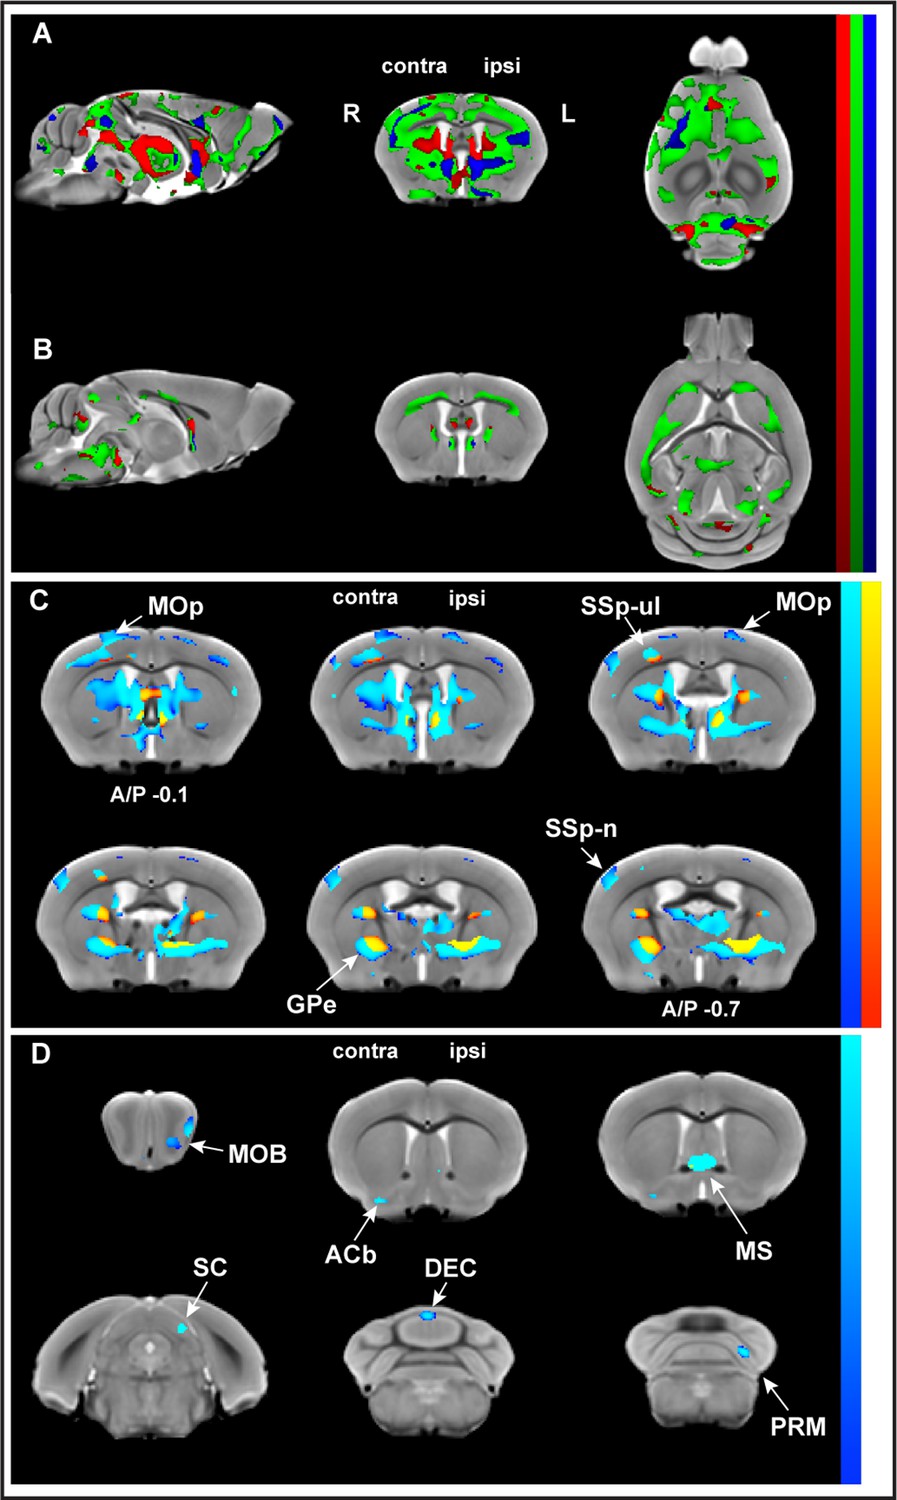
Whole-brain structural analysis revealed nonlinear decreases in gray matter volume (GMV) juxtaposed to nonlinear increases in white matter volume (WMV) with learning.
Significant changes were observed in GMV (A) and WMV (B) for which volumetric changes were modeled by three different time courses (linear model in red, asymptotic model in green, and quadratic model in blue) overlayed on the in vivo MRI template created from all subjects in this study. Decreases in volume (cold blue scale) and the increases in volume (warm red scale), in coronal sections ranging from A/P Bregma –0.1 to –0.7 mm, defined using the asymptotic model (pFDR corr<0.01) and thresholded at DAIC > 10 for asymptotic versus linear and/or quadratic models (C). Cortical and subcortical areas following an asymptotic model show decreases in GMV and increases in WMV and include primary motor cortex (MOp), primary somatosensory cortex for the forelimb (SSp-ul), and globus pallidus (GPe) contralateral to the trained limb, among others. Discrete clusters for which Akaike information criterion (AIC) values indicated a preferred quadratic model (D). Preferred quadratic clusters are observed in paramedian lobule of cerebellum (PRM), superior colliculus (SC), and main olfactory bulb (MOB) ipsilateral to the trained limb, medial septum and vermian lobule VI (DEC), and nucleus accumbens (ACb) contralateral to the trained limb.
Figure 2—figure supplement 1
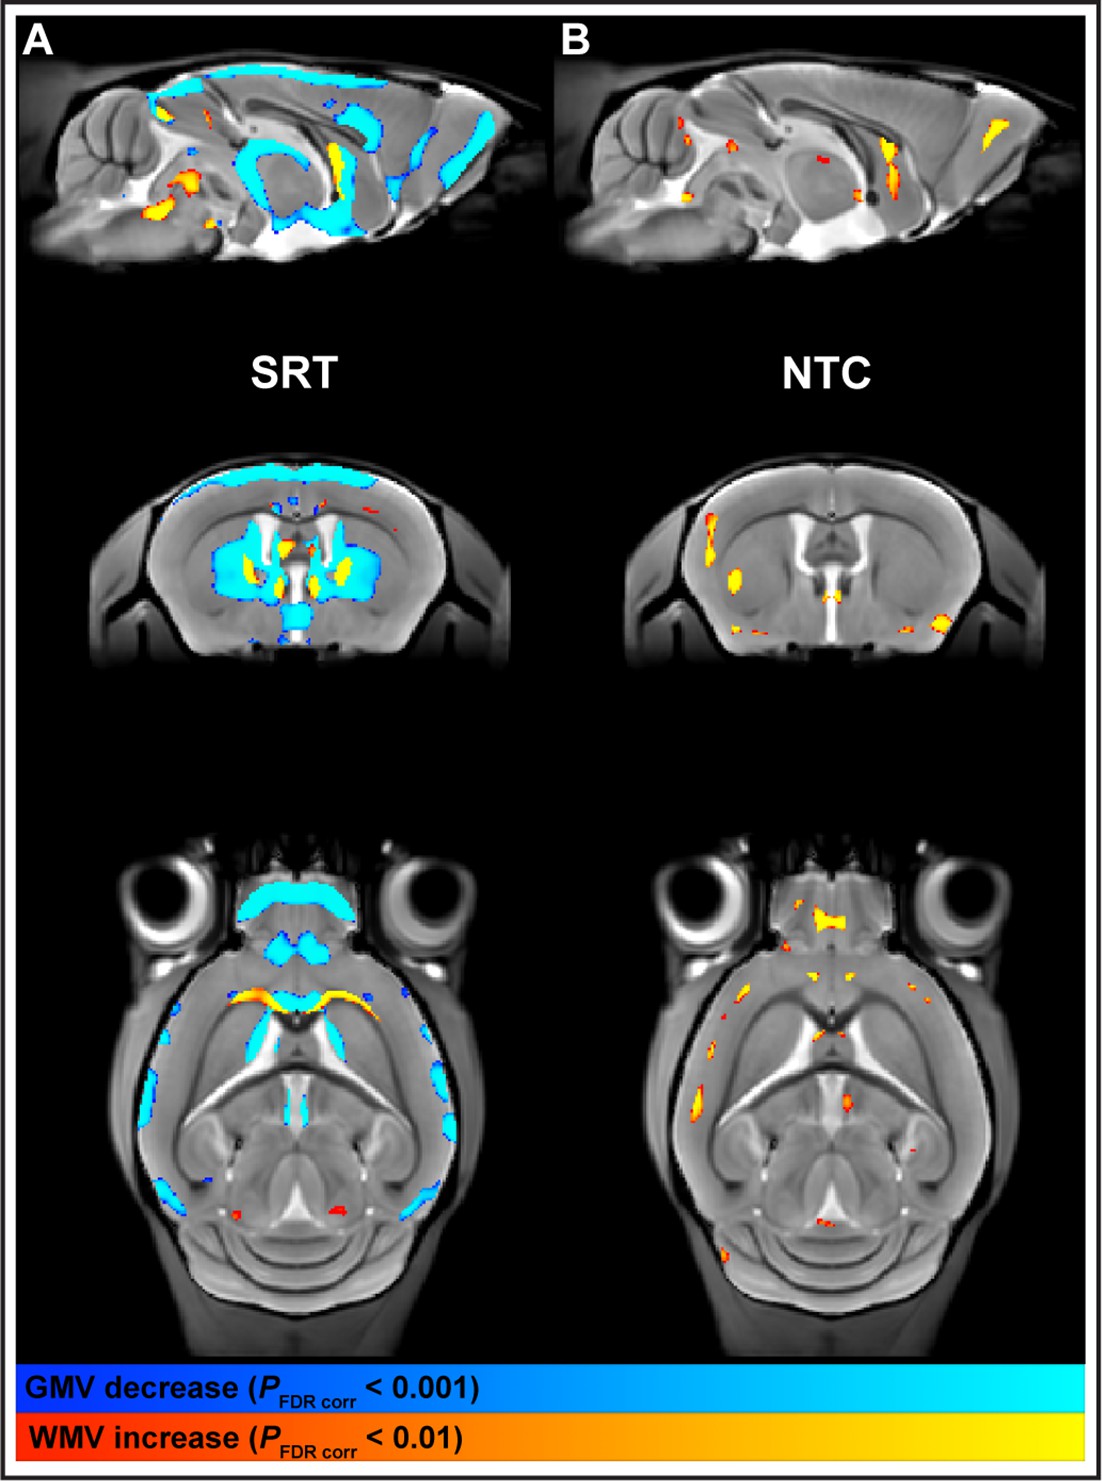
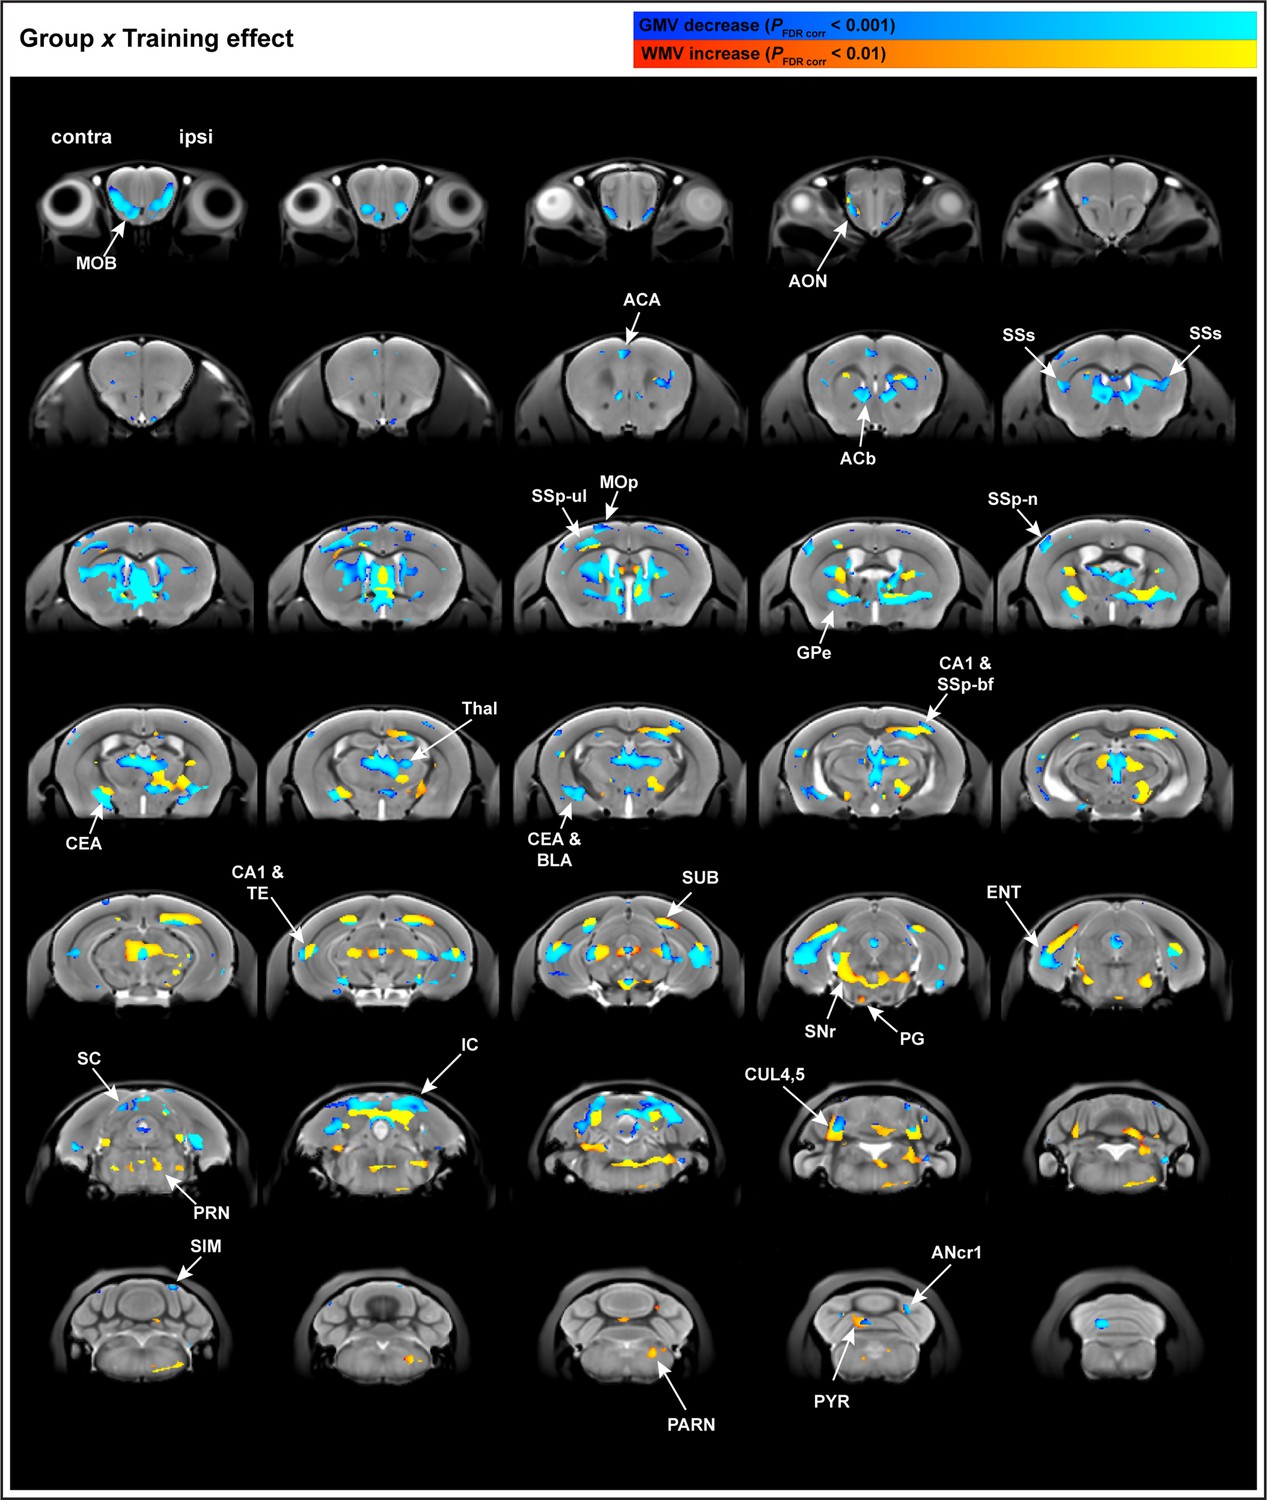
Forelimb reach-and-grasp training dynamically modulates macrostructural brain plasticity.
Training mice in the single-pellet forelimb reach task produces nonlinear decreases in gray matter volume (GMV) (pFDR corr<0.001) and nonlinear increases in white matter volume (WMV) (pFDR corr<0.01) (A), whereas a linear increase in GMV was observed in nontrained control animals with time (B), whole-brain statistical maps (pFDR corr<0.01) are represented on a study-specific in vivo template (AP –0.1 mm, DV –3.0 mm from Bregma; 0.08 mm isotropic, radiological display).
-
Figure 2—figure supplement 1—source data 1
Effect of training on gray matter volume (GMV) and white matter volume (WMV) in trained mice and the effect of time in nontrained control mice.
Whole-brain within-group analysis presenting the significant number of voxels (pFDR corr.<0.01 and < 0.001) together with the change in volume (mm3).
- https://cdn.elifesciences.org/articles/77432/elife-77432-fig2-figsupp1-data1-v2.docx
Figure 2—figure supplement 2
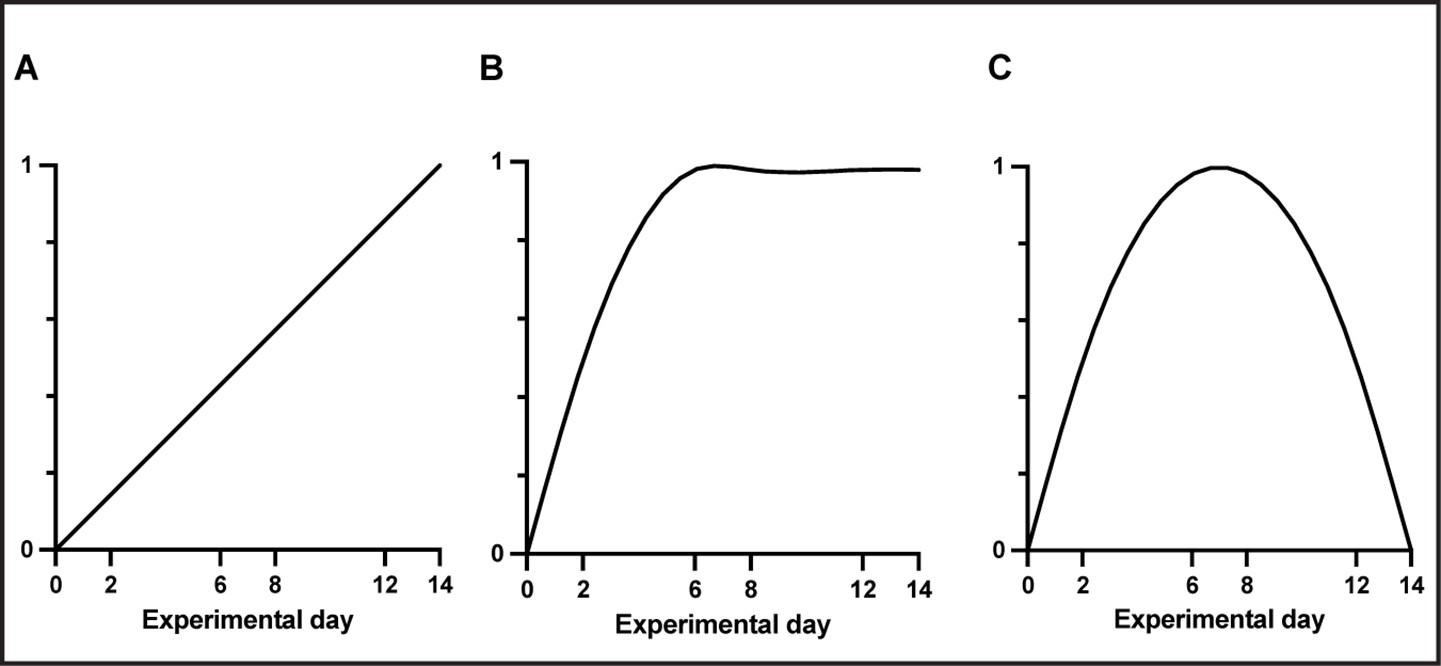
Three different regression models representing three different time courses were used to test for different patterns of change in gray matter (GM) and white matter (WM).
(A) Linear, (B) increase followed by a stabilization (inverse-quadratic-asymptotic), and (C) increase followed by a renormalization (inverse-quadratic).
Figure 2—figure supplement 3
Whole-brain structural analysis of nonlinear decreases in gray matter volume (GMV) juxtaposed to nonlinear increases in white matter volume (WMV) with learning.
Changes in GMV and WMV modeled using the asymptotic model and overlayed on the in vivo MRI template created from this study. Whole-brain decreases in GMV (cold blue scale) and the increases in WMV (warm red scale), in coronal sections ranging from A/P Bregma –4.3 to –7.5 mm.
Figure 2—figure supplement 4
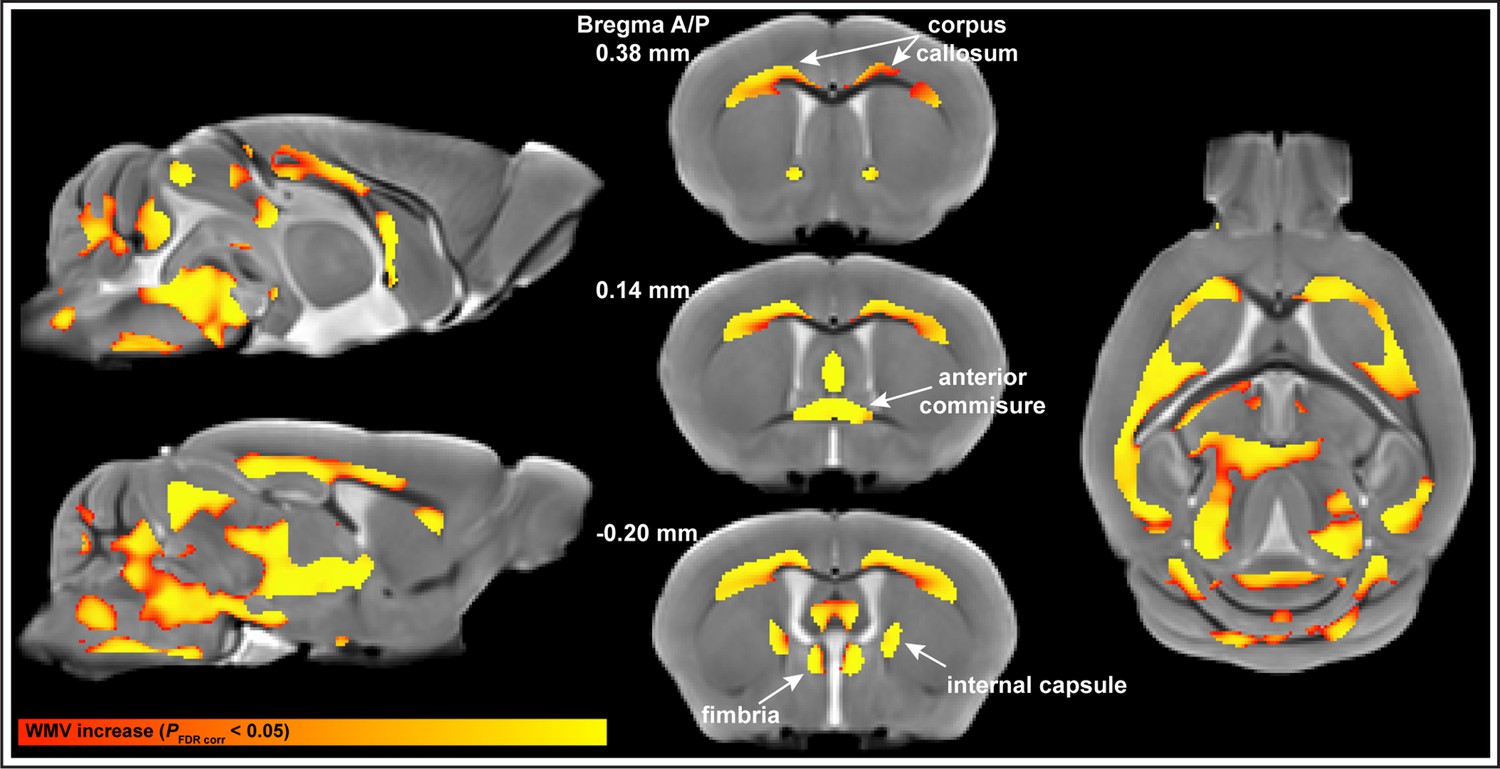
Nonlinear increases in white matter volume (WMV) in subcortical white matter regions of the brain (pFDR corr<0.05) follow an asymptotic model.
Figure 3 with 1 supplement

Sensorimotor-restricted voxel-based morphometry (VBM) analysis in cortex identified nonlinear decreases in gray matter volume (GMV) together with nonlinear increases in white matter volume (WMV) during motor learning.
(A) VBM analysis using an atlas-based bilateral mask for primary motor cortex (MOp), secondary motor cortex (MOs), and primary sensory areas (SSp) revealed significant decreases in GMV (cold blue scale) and increases in WMV (warm red scale) following an asymptotic model (pFDR corr<0.001 and <0.01, respectively). Non-linear decreases in GMV are observed together, and overlap (green), with non-linear increases in WMV. (B) 3D representations of the atlas-based mask for MOp + MOs + SSp together with the overlap of significant GMV and WMV changes (green). (C) GMV changes, relative to nontrained controls, in sensorimotor cortex contralateral to the trained forelimb extracted using a volume of interest (VOI) based on fMRI mapping of forepaw stimulation (VOI represented in green). (D) WMV changes, relative to nontrained controls, from the same VOI in (C). Plots in (C) and (D) represent the average extracted value, normalized to non-trained controls (n=16), of each VOI for every trained subject ± SEM; n=31 at 0, n=31 at 2, n=33 at 6, n=35 at 8, n=37 at 10 and n=39, at experimental day 14.
Figure 3—figure supplement 1
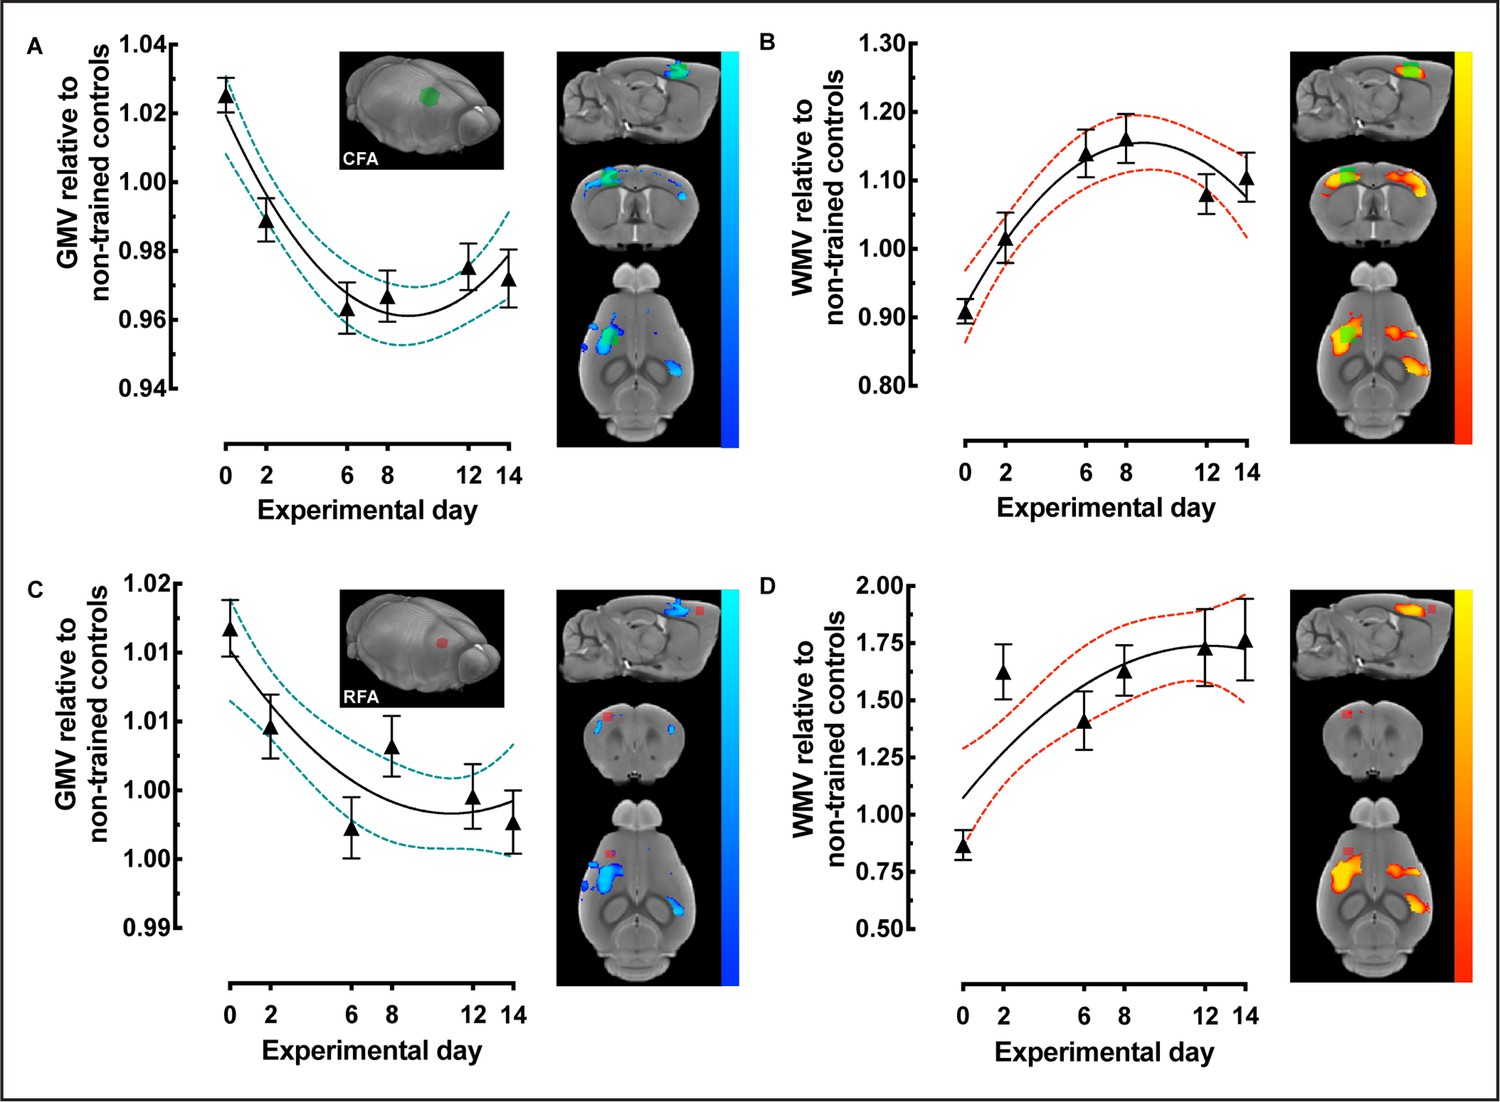
Caudal forelimb area (CFA)- and rostral forelimb area (RFA)-restricted voxel-based morphometry (VBM) analysis identified nonlinear decreases in gray matter volume (GMV) together with nonlinear increases in white matter volume (WMV) during motor learning.
(A) GMV, relative to nontrained controls, in CFA contralateral to the trained forelimb (volume of interest [VOI] represented in green). (B) WMV extracted and plotted from CFA VOI in (A). (C) GMV, relative to nontrained controls, in RFA contralateral to the trained forelimb (VOI represented in red). (D) WMV extracted and plotted from the same RFA VOI in (C) Plots represent the average extracted value, normalized to non-trained controls (n=16), of each VOI for every trained subject ± SEM; n=31 at 0, n=31 at 2, n=33 at 6, n=35 at 8, n=37 at 10 and n=39, at experimental day 14.
Figure 4
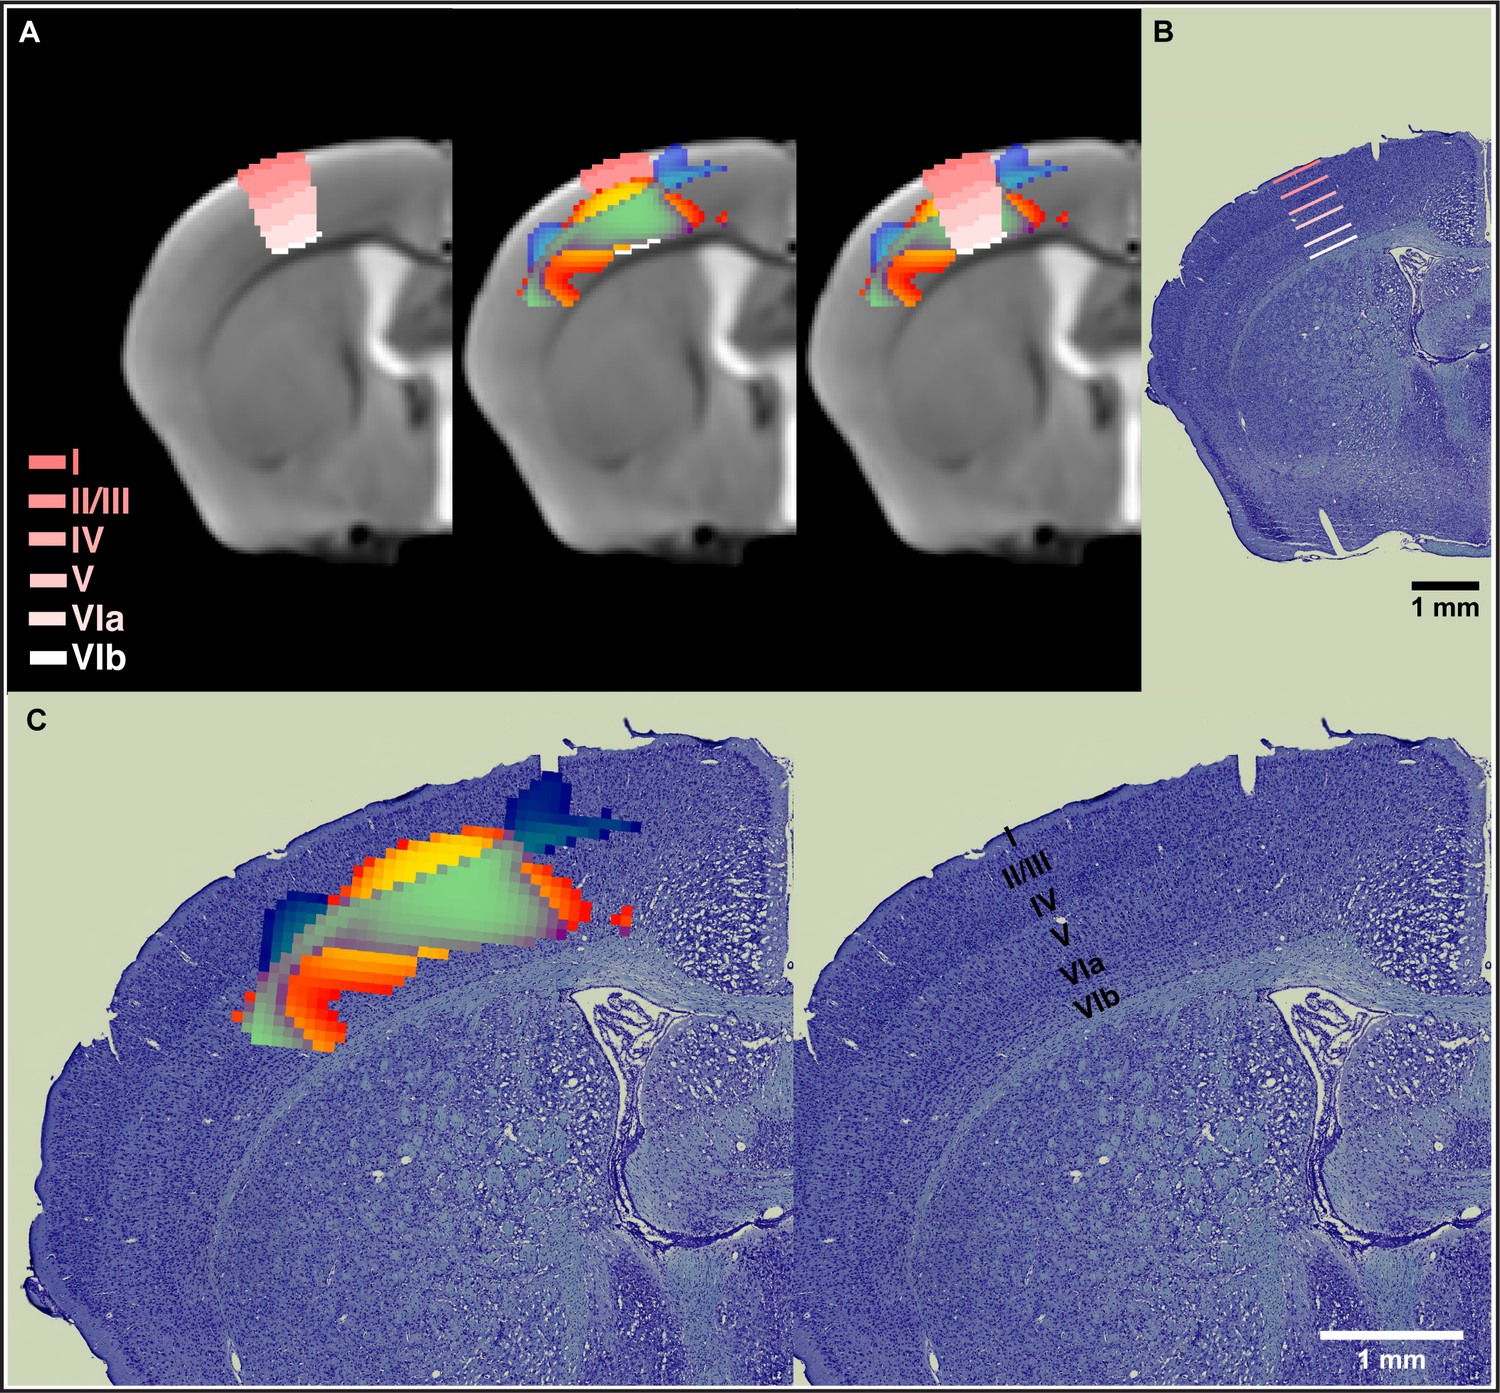
Nonlinear decreases in gray matter volume (GMV) together with nonlinear increases in white matter volume (WMV) observed during motor learning in somatosensory cortex span from layer IV through layer VIa.
(A) Normalization of the Allen Mouse Brain Atlas to the in vivo MRI template from this study allowed for an accurate location of the nonlinear changes in primary somatosensory cortex (SSp) within the different cortical layers. (B) The cortical layers disposition from the Allen Mouse Brain Atlas was confirmed using a combined staining of cells and fibers in coronal sections of mouse brain tissue. (C) Nonlinear changes in SSp were coregistered to ex vivo histological sections and confirmed observations obtained using the cortical layers from the Allen Mouse Brain Atlas. Nonlinear decreases in GMV (cold blue scale) together with nonlinear increases in WMV (warm red scale) and the overlap of significant GMV and WMV changes (green).
Figure 5 with 3 supplements

Motor learning evokes nonlinear plasticity of cortical white matter components that are associated with structural changes.
(A) Representative image of myelin immunohistochemistry. (B) Positive correlation between cortical white matter volume (WMV) values and myelin immunoreactivity at the individual level in trained animals (Pearson’s r = 0.75, p=.03) and nonsignificant negative correlation between gray matter volume (GMV) and myelin immunoreactivity (Pearson’s r = –0.38, p=–0.35). (C) Myelin immunoreactivity increases until experimental day 6, after which it decreases toward baseline levels. The changes detected in myelin immunoreactivity follow a quadratic model rather than a linear one (AICc > 2). Data are represented as mean ± SEM (n=12 for each experimental day) (D) Illustrative representative of the three measurements acquired at the sensorimotor cortex in the same area where myelin was quantified. (E) No significant changes were observed in sensorimotor cortical thickness between trained animals and nontrained controls, (unpaired t-test; t(98)=0.5561) and no differences in the cumulative distribution of cortical thickness were observed between groups in the primary somatosensory cortex for the forelimb (SSp-ul) (F). (G) Correlation between learning rate and the asymptotic fit (measured as AICc) for WMV on an individual level (Pearson’s r = –0.378, p=0.0360) in which animals with WMV that best fit an asymptotic model (lower AICc values) exhibited higher learning rates.
Figure 5—figure supplement 1
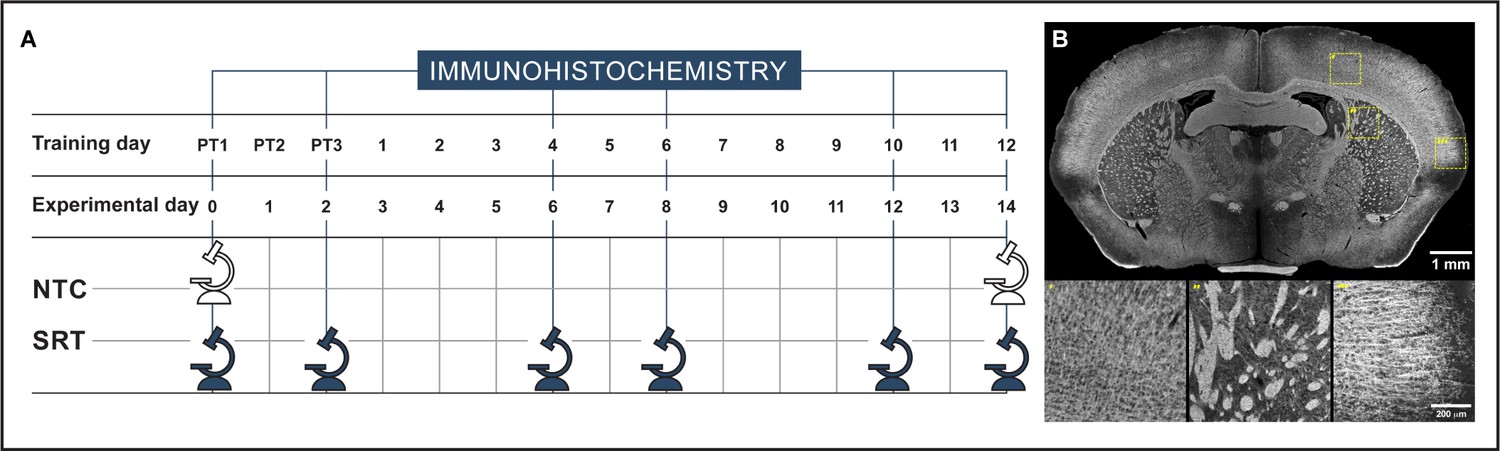
Experimental design for the cross-sectional immunohistochemistry analysis of myelin immunoreactivity (A) and representative image of myelin basic protein immunohistochemistry (B) highlighting the specificity of the immunodetection of myelin in cortex and striatum.
Figure 5—figure supplement 2
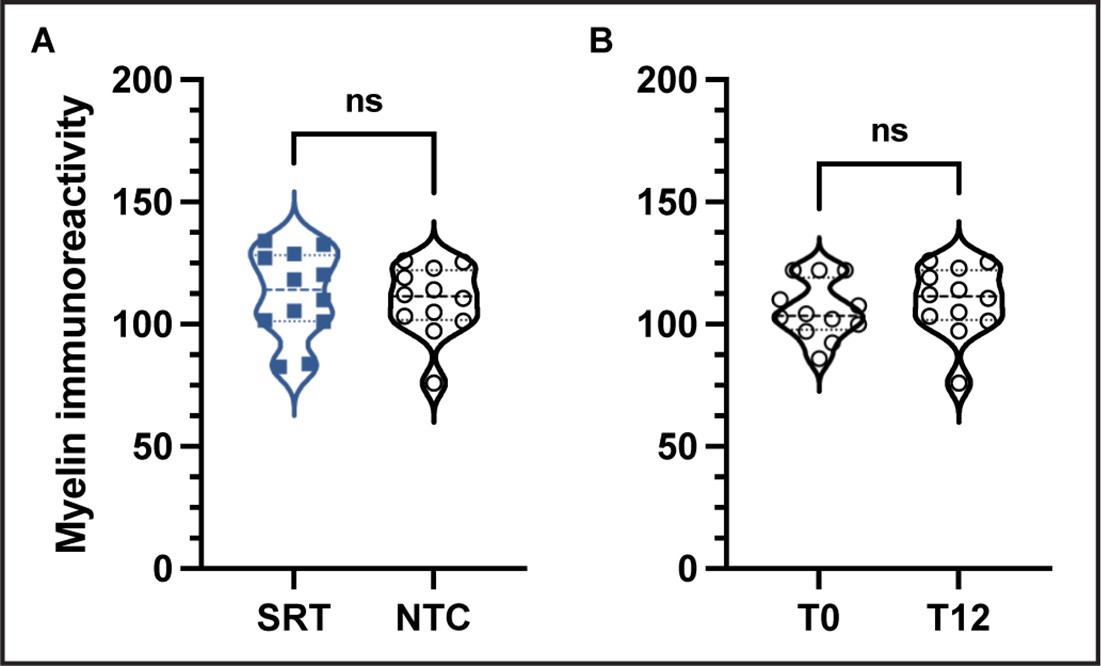
Comparison of myelin immunoreactivity between trained and non-trained controls or among non-trained controls.
No differences in myelin immunoreactivity were observed between trained animals (n=12) and non-trained control animals (n=12) (A) at the last experimental day (day 14); unpaired t-test, t(22)=0.4096, alpha level of 0.05. In addition, no differences in myelin immunoreactivity were observed between non-trained control animals at experimental day 0 and at training day 12 (experimental day 14) (B); n=12, paired t-test, t(11)=0.5865, alpha level of 0.05.
Figure 5—figure supplement 3
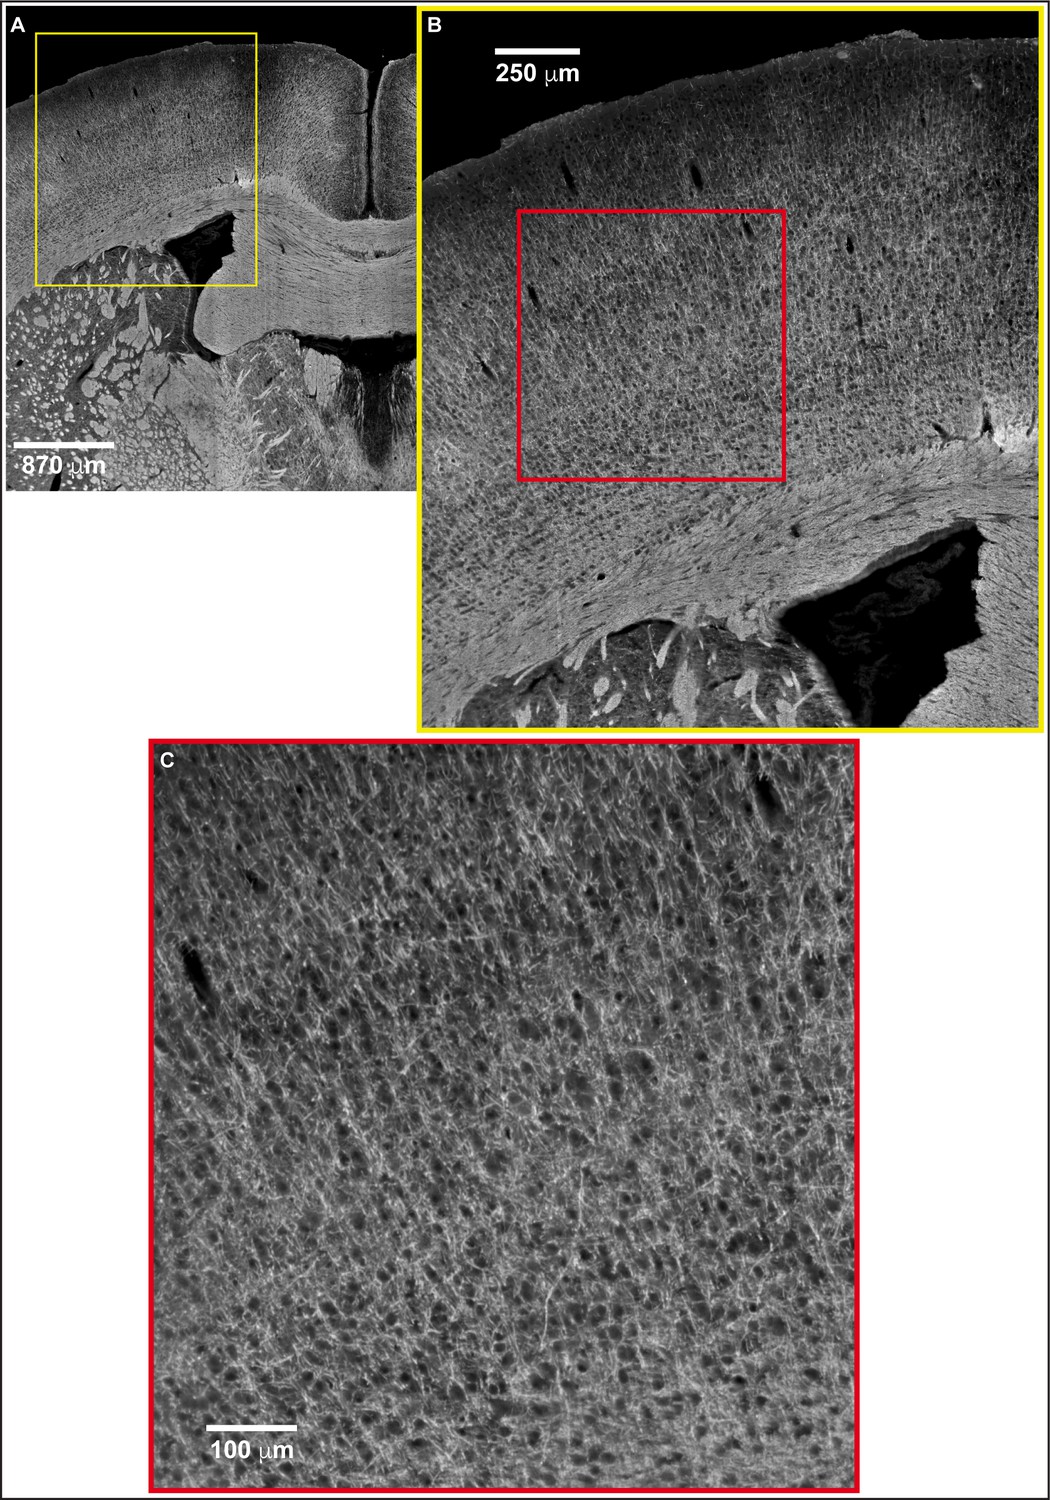
Higher magnification image of a representative myelin basic protein (MBP)-immunolabeled coronal section.
(A) MBP-immunolabeled coronal section at Bregma A/P –0.34. (B) Magnification of the cortical areas of the MBP-immunolabeled section in (A). (C) Enlargement of the area for which MBP immunoreactivity was quantified by densitometry. Individual myelinated axons can be appreciated.
Figure 6 with 2 supplements
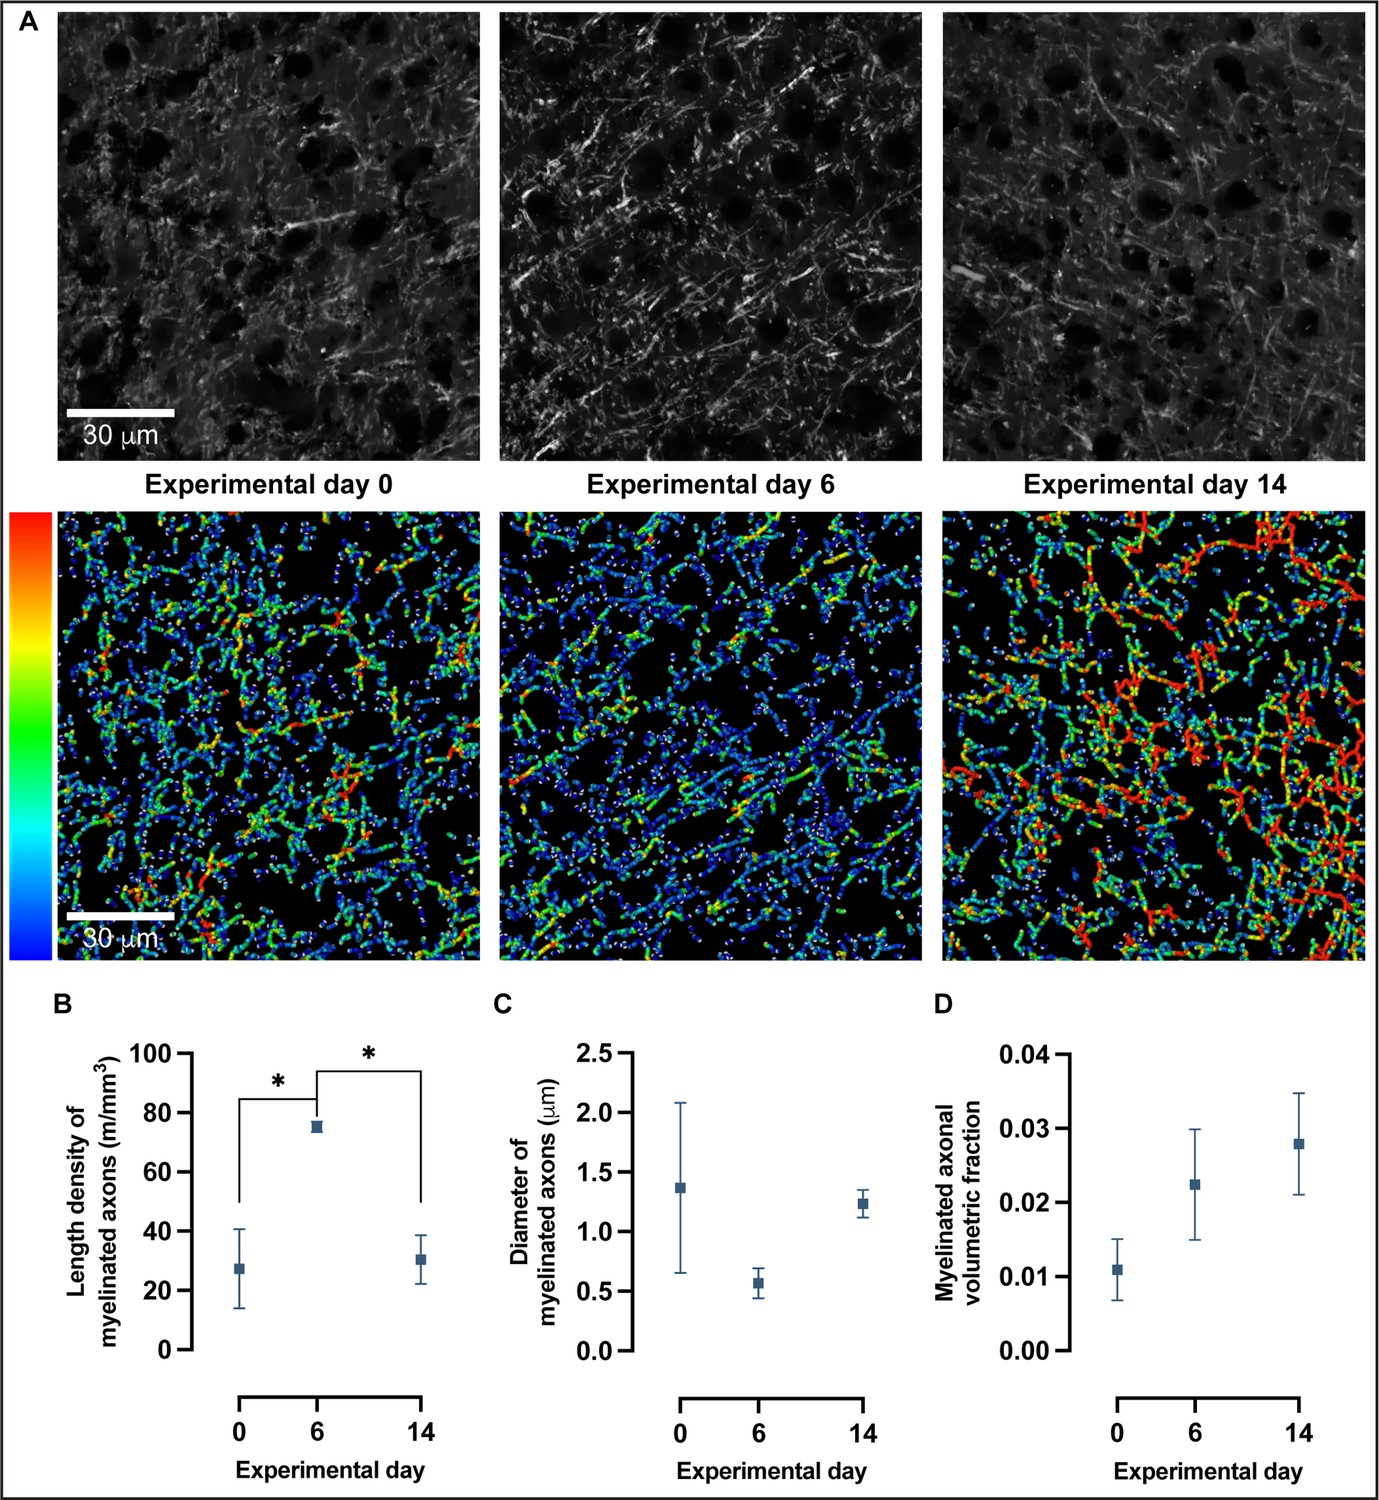
Confocal microscopy and 3D reconstruction of myelin basic protein (MBP)-labeled axons revealed nonlinear changes in myelinated axons with motor skill learning.
(A) Representative confocal images and skeleton reconstructions of myelinated axons at experimental days 0, 6, and 14; pseudo-colorized to reflect thickness. (B) Length density of myelinated axons follows a quadratic model rather than a linear one (Akaike information criterion [AIC] > 2) in which there is a 175% increase from baseline to experimental day 6, followed by a 60% decrease from experimental day 6 to experimental day 14 (one-way ANOVA, F2,7 = 8.249, P < .05). (C) There are no significant changes in diameter of myelinated axons with learning (one-way ANOVA, F2,7 = 1.196, alpha level of 0.05) nor in the volumetric fraction of myelinated axons in (D) (one-way ANOVA, F2,7 = 1.748, alpha level of 0.05). Plotted values represent the mean and error (SEM), n=3–4.
Figure 6—figure supplement 1
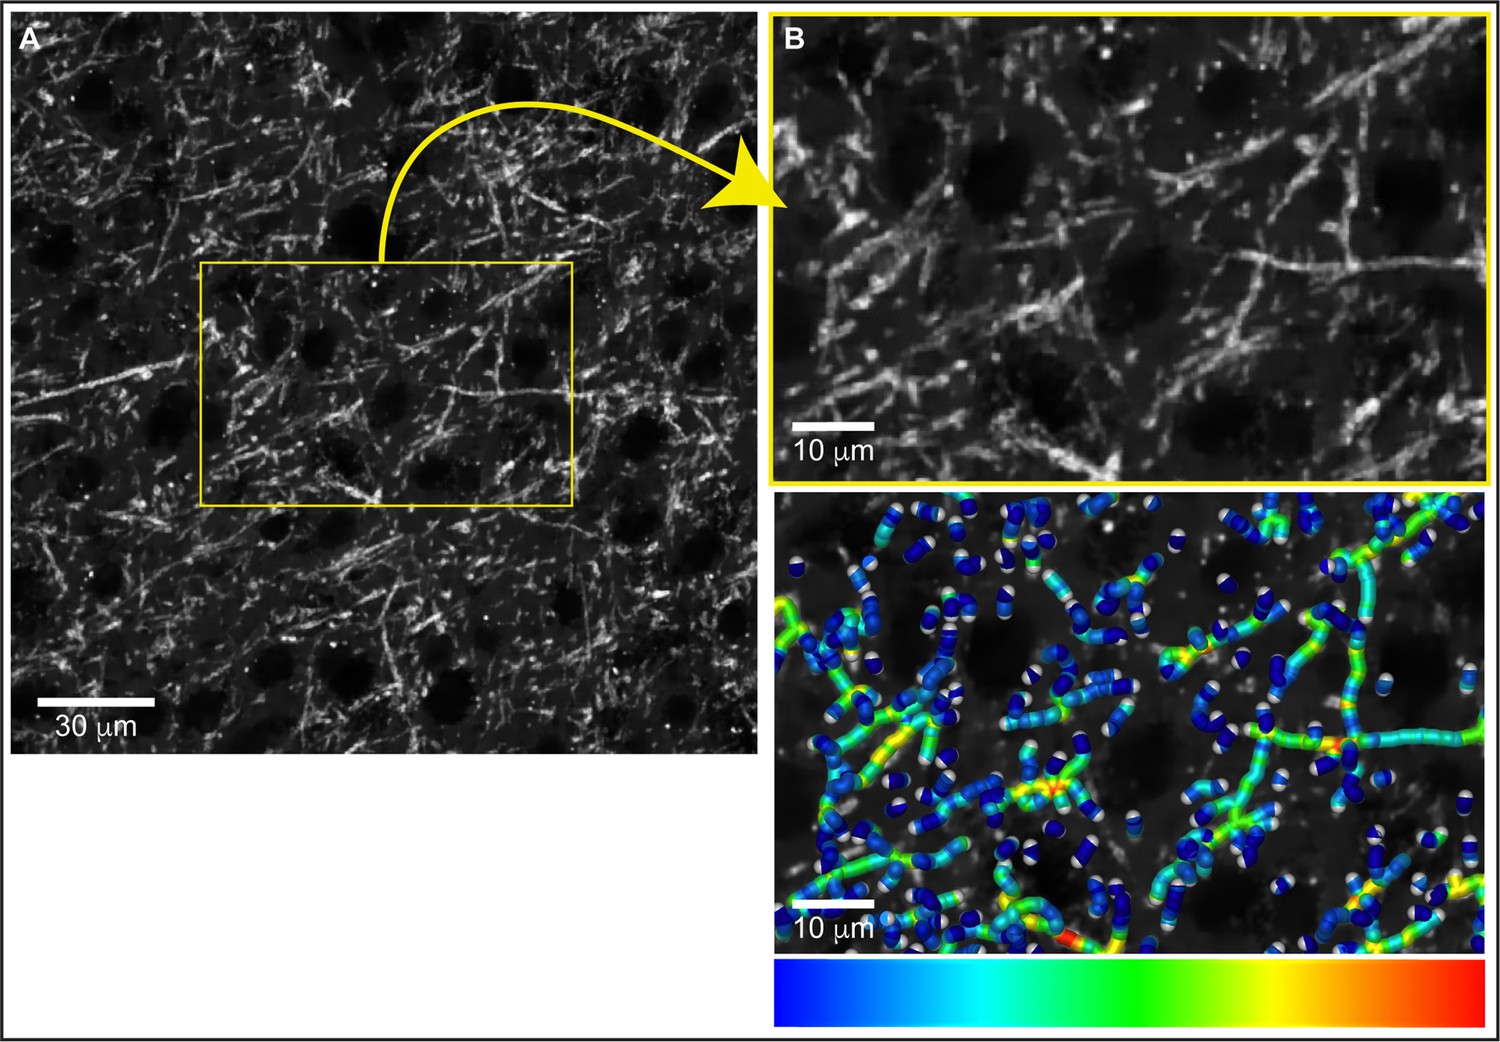
Confocal microscopy evaluation of myelinated axons.
(A) Confocal images (nine probes/animal) were acquired in myelin basic protein (MBP)-immunolabeled coronal sections of trained animals in the primary somatosensory cortex for the forelimb (SSp-ul) contralateral to the trained forelimb. (B) Skeleton reconstruction of myelinated axons from (A); pseudo-colorized to reflect thickness. (C) Magnification of a representative probe and its skeleton reconstruction in (D).
Figure 6—figure supplement 2
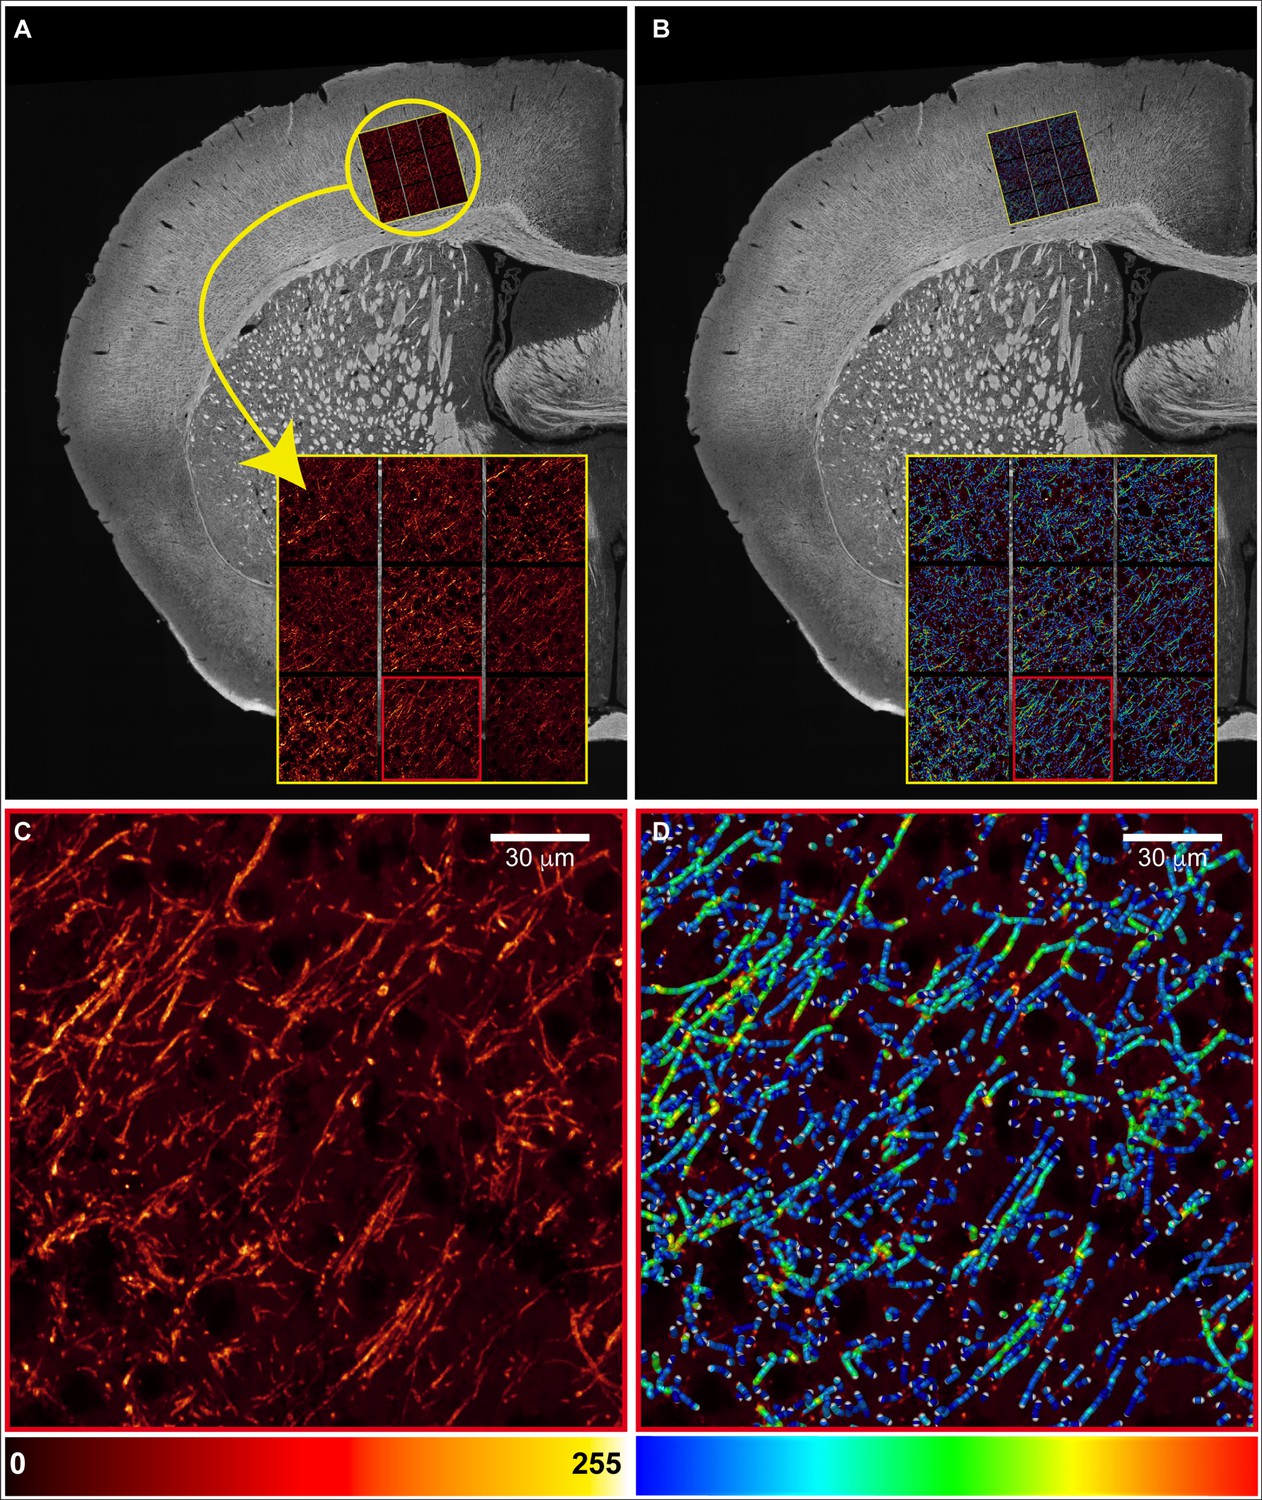
Confocal microscopy evaluation of myelinated axons and optical zoom of generated fiber skeletons.
(A) Confocal images were acquired in myelin basic protein (MBP)-immunolabeled coronal sections and fiber skeletons were generated using Amira software and the Auto Skeleton package. (B) Optical zoom magnification of MBP immunofluorescence and the generated fiber skeletons pseudo-colorized to reflect thickness. The skeleton structure consisted of myelinated axon segments with cylinders (called nodes) spaced at 0.5 µm along the fibers. The myelinated axonal radius is calculated within the ‘Auto Skeleton’ function in Amira at each cylinder (or node) between the center of the node and the myelin boundary, taking into account the magnification factor and dimensions of the input data. See ‘Materials and methods’ for additional details.
Appendix 1—figure 1
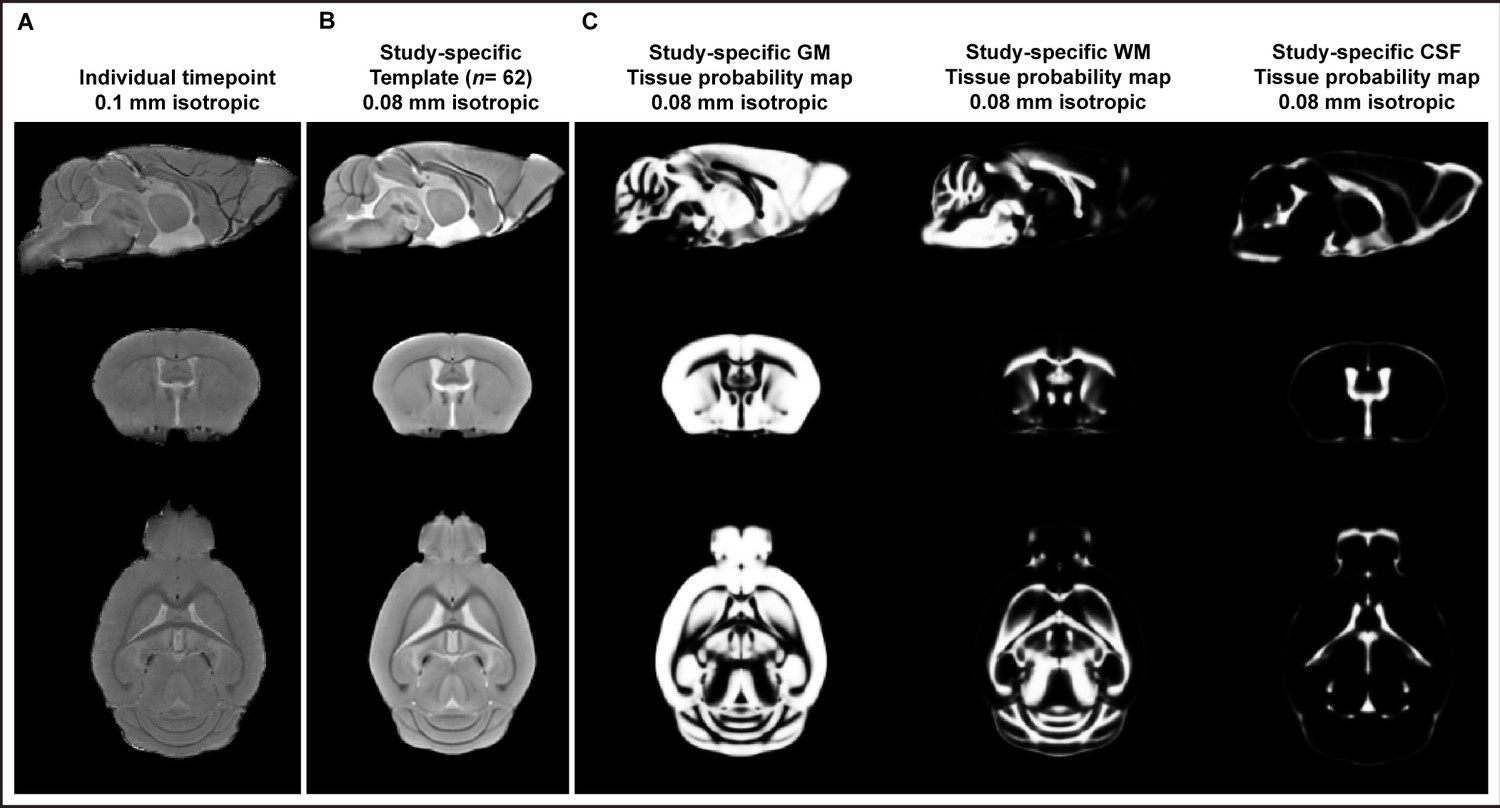
Figure depicting sagittal, coronal, and horizontal sections of an in vivo T1-weighted image from one individual scan during the longitudinal study (A) and the study-specific template created for mouse brain (B).
Study- and MR sequence-specific brain tissue probability maps (C). Sagittal, coronal, and horizontal sections of tissue probability maps (TPMs) of gray matter (GM), white matter (WM), and cerebrospinal fluid (CSF).
Tables
Table 1
Training by group interaction effects for gray matter volume (GMV) and white matter volume (WMV).
Whole-brain between-group analysis presenting the significant number of voxels (pFDR corr<0.01 and <0.001) together with the change in volume (mm3).
| Changes in GMV | Changes in WMV | |||
|---|---|---|---|---|
| Increase | Decrease | Increase | Decrease | |
| pFDR corr<0.01 | ||||
| Linear | - | 45,158 (23.12) | 12,407 (6.35) | - |
| Asymptotic | - | 241,549 (123.68) | 78,442 (40.16) | - |
| Quadratic | - | 28,615 (14.65) | 2250 (1.15) | - |
| pFDR corr <0.001 | ||||
| Linear | - | 1834 (0.94) | - | - |
| Asymptotic | - | 109,811 (56.22) | 22,095 (11.31) | - |
| Quadratic | - | 2780 (1.42) | 288 (0.15) | - |
Table 2
Gray matter volume (GMV) and white matter volume (WMV) training by group interaction effects.
Masked cortical areas (MOp + MOs + SSp) between-group analysis presenting the significant number of voxels (pFDR corr.<0.01) together with the change in volume (mm3).
| Changes in GMV | Changes in WMV | |||
|---|---|---|---|---|
| Increase | Decrease | Increase | Decrease | |
| pFDR corr<0.01 | ||||
| Linear | - | - | - | - |
| Asymptotic | - | 33,817 (17.31) | 13,356 (6.83) | - |
| Quadratic | - | - | - | - |
-
MOp, primary motor cortex; MOs, secondary motor cortex; SSp, primary somatosensory cortex.
Table 3
Comparison of Akaike information criterion (AIC) values for changes in gray and white matter taken from structural data extracted using three unbiased cortical volumes.
| fMRI VOI | RFA VOI | CFA VOI | ||||
|---|---|---|---|---|---|---|
| Linear | Quadratic | Linear | Quadratic | Linear | Quadratic | |
| Changes in GMV | ||||||
| AICc | –1271 | –1278 | –1833 | –1835 | –1337 | –1358 |
| Probability of correctness | 3.50% | 96.50% | 24.09% | 75.91% | <0.01% | >99.99% |
| Changes in WMV | ||||||
| AICc | –664.3 | –686.6 | –94.80 | –95.33 | –682.2 | –699.8 |
| Probability of correctness | <0.01% | >99.99% | 43.45% | 56.55% | 0.02% | 99.98% |
-
GMV, gray matter volume; WMV, white matter volume; VOI, volume of interest; RFA, rostral forelimb area; CFA, caudal forelimb area.
Key resources table
| Reagent type (species) or resource | Designation | Source or reference | Identifiers | Additional information |
|---|---|---|---|---|
| Strain, strain background (Mus musculus) | C57BL/6J | Jackson Laboratory | #000664 | |
| Antibody | Recombinant anti-myelin basic protein antibody (rat monoclonal) | Abcam | ab7349 | (1:400) |
| Antibody | Alexa Fluor 594 goat anti-rat IgG (H+L) (goat polyclonal) | Jackson ImmunoResearch Laboratories | 112-585-167 | (1:400) |
| Chemical compound, drug | Isoflurane | Piramal Critical Care B.V. | MTnr: 44821 (SE) | |
| Chemical compound, drug | Sodium chloride solution (9 mg/mL) | B.Braun | MTnr: 11054 (SE) | |
| Chemical compound, drug | Viscotears | Bausch & Lomb | MTnr: 12508 (SE) | |
| Chemical compound, drug | L-655,708 | Sigma-Aldrich | L9787 | 0.7 mg/kg |
| Chemical compound, drug | Pentobarbital sodium | Apotek Produktion & Laboratorier | 338327 | 100 mg/kg |
| Chemical compound, drug | Paraformaldehyde | VWR Chemicals | 28794.295 | |
| Chemical compound, drug | Luxol fast blue | Sigma-Aldrich | S3382 | |
| Chemical compound, drug | Cresyl violet | Merck | 1.05235.0025 | |
| Chemical compound, drug | Xylene | VWR Chemicals | 28975.291 | |
| Chemical compound, drug | Glacial acetic acid | Merck | 1.00063.1011 | |
| Chemical compound, drug | Absolute ethanol | VWR Chemicals | 20820.296P | |
| Chemical compound, drug | Lithium carbonate | Merck | Art. 5680 | |
| Chemical compound, drug | O.C.T. compound | VWR Chemicals | 361603E | |
| Chemical compound, drug | Entellan Neu | Merck | 1.07961.0500 | |
| Chemical compound, drug | Mowiol 4-88 | Sigma-Aldrich | 81381 | |
| Chemical compound, drug | DABCO | Sigma-Aldrich | D27802 | |
| Software, algorithm | GraphPad Prism | http://www.graphpad.com/ | RRID:SCR_002798 | |
| Software, algorithm | GraphPad Prism | http://www.graphpad.com/ | RRID:SCR_002798 | |
| Software, algorithm | MATLAB | http://www.mathworks.com/products/matlab/ | RRID:SCR_001622 | |
| Software, algorithm | SPM | http://www.fil.ion.ucl.ac.uk/spm/ | RRID:SCR_007037 | |
| Software, algorithm | SPMmouse toolbox | doi:10.1016/j.mri.2013.06.001 | ||
| Software, algorithm | ANTs software package | http://www.picsl.upenn.edu/ANTS/ | RRID:SCR_004757 | |
| Software, algorithm | RStudio (version 4.0.3) | http://www.rstudio.com/ (R Development Core Team, 2017) | RRID:SCR_000432 | |
| Software, algorithm | FSL | http://www.fmrib.ox.ac.uk/fsl/ | RRID:SCR_002823 | |
| Software, algorithm | Fiji | http://fiji.sc | RRID:SCR_002285 | |
| Software, algorithm | AMIRA (Advanced 3D Visualization and Volume Modeling) | http://www.fei.com/software/amira-3d-for-life-sciences/ | RRID:SCR_007353 | |
| Software, algorithm | ZEN Digital Imaging for Light Microscopy | http://www.zeiss.com/microscopy/en_us/products/microscope-software/zen.html#introduction | RRID:SCR_013672 | |
| Other | Purified Rodent Tablet | TestDiet | 5TUL | Food pellets used in the motor skill learning paradigm |
| Other | Superfrost plus objective slides | Thermo Scientific (Menzel-Gläser) | J1800AMNZ | Slides used for placement of histological sections |
| Other | Normal goat serum | Jackson ImmunoResearch Laboratories | 005-000-121 | Serum used to prevent nonspecific binding of antibody in immunohistochemistry |
Additional files
Download links
A two-part list of links to download the article, or parts of the article, in various formats.
Downloads (link to download the article as PDF)
Open citations (links to open the citations from this article in various online reference manager services)
Cite this article (links to download the citations from this article in formats compatible with various reference manager tools)
Learning-related contraction of gray matter in rodent sensorimotor cortex is associated with adaptive myelination
eLife 11:e77432.
https://doi.org/10.7554/eLife.77432


