Direct and indirect mortality impacts of the COVID-19 pandemic in the United States, March 1, 2020 to January 1, 2022
- Department of Ecology and Evolutionary Biology, Princeton University, United States
- School of Public Health, Yale University, United States
- New York City Department of Health and Mental Hygiene, United States
- Department of Science and Environment, Roskilde University, Denmark
- Princeton School of Public Affairs, Princeton University, United States
- Division of International Epidemiology and Population Studies, Fogarty International Center, National Institutes of Health, United States
Figures
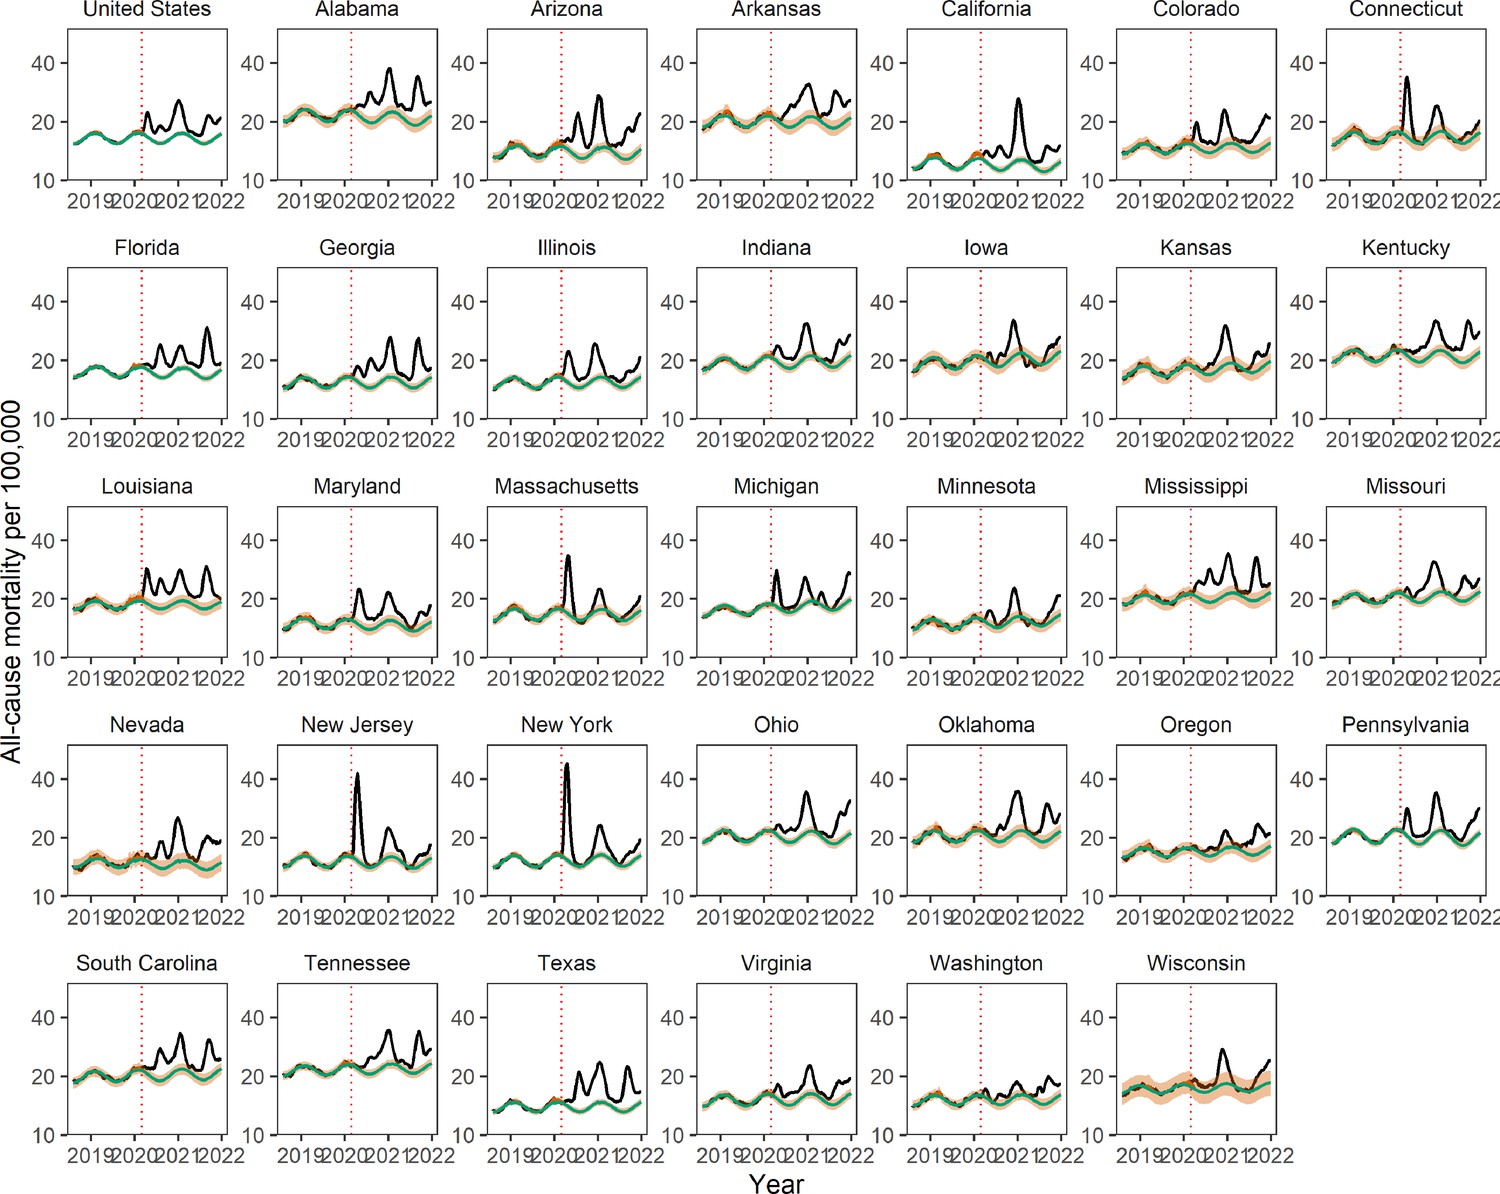
Figure 1

Weekly mortality rates (per 100,000) for select US jurisdictions and validation of COVID-19 excess mortality estimates against serology.
(A) Weekly all-cause mortality rate per 100,000 in the United States and top five most populated states, August 2, 2014 to January 1, 2022. Black lines show observed data. Green line shows the seasonal model baseline. The red solid line shows the seasonal variation accounting for influenza circulation. The orange shaded areas show the upper and lower 95% confidence intervals (CIs). The dotted vertical red line marks the start of the pandemic on March 1, 2020. (B) Comparison between estimated excess respiratory mortality rates and cumulative COVID-19 seroprevalence estimates from the Centers for Disease Control and Prevention (CDC) as of December 31, 2021. Each point corresponds to a state; observations are shown for 16 states which have enough resolution in respiratory mortality data. Error bars represent 95% CIs on serology and excess mortality estimates. The black line and dotted region represent a linear regression fit and the associated 95% CI for a model without intercept.
Figure 2
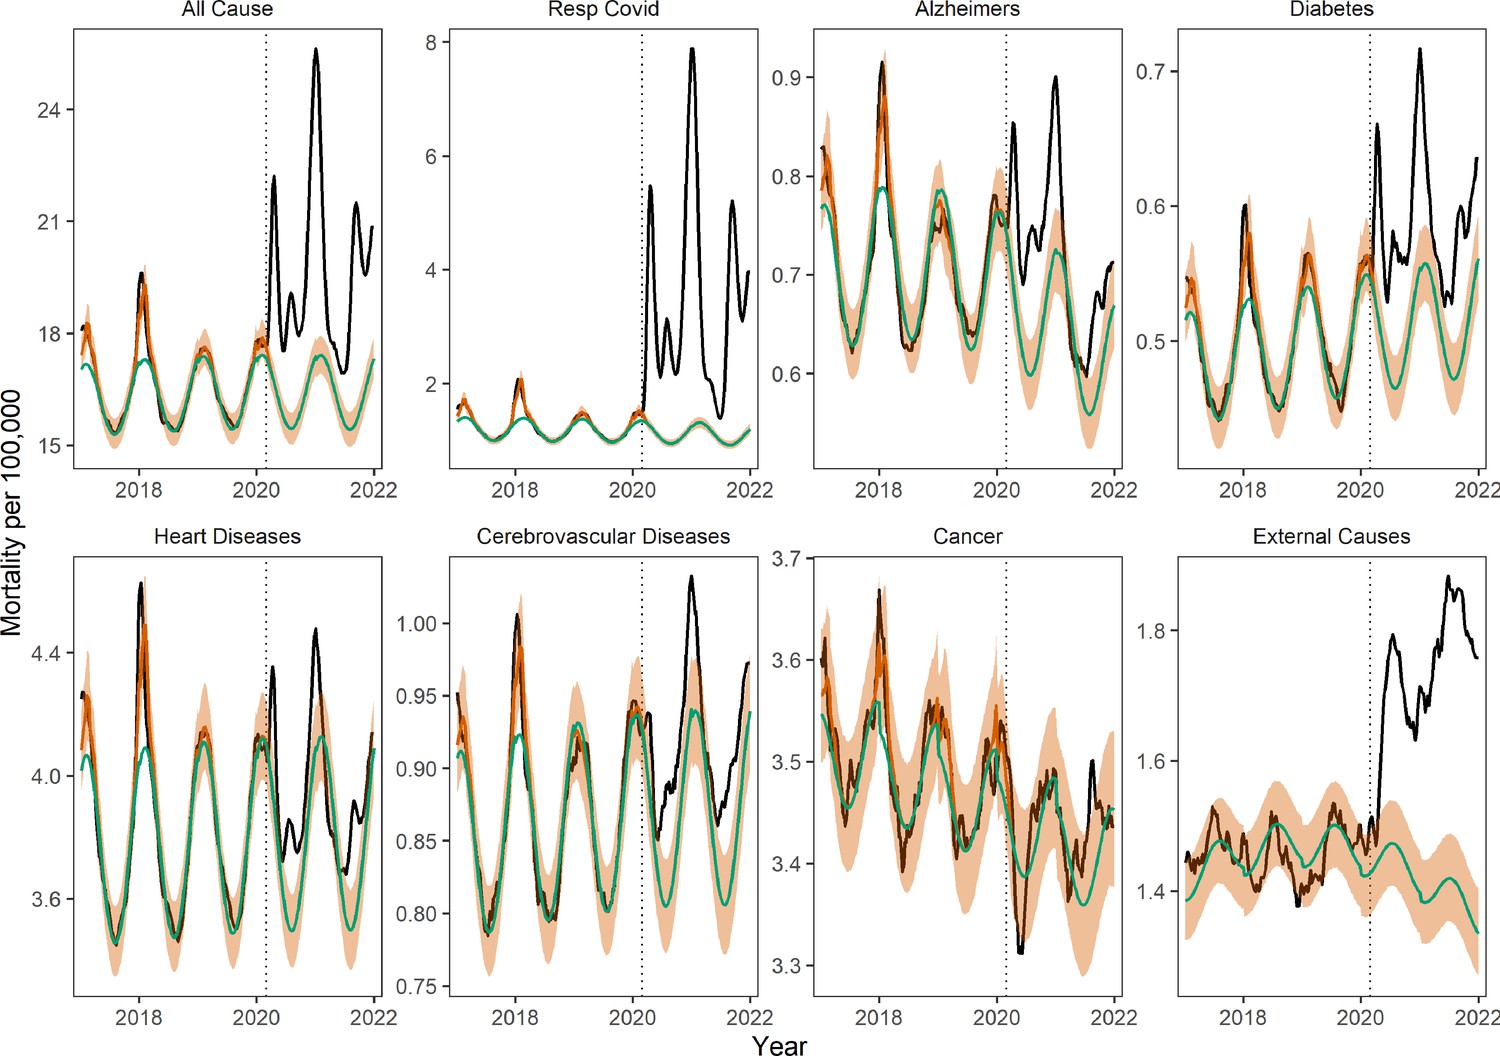
Weekly national mortality rates and model baselines (per 100,000) for eight causes of death.
The black line shows observed data, the green line shows the seasonal model baseline, the orange shaded areas the 95% Confidence Interval (CI) on the seasonal baseline, and the red line shows model predictions with seasonal variation and influenza circulation. Excess mortality attributed to the COVID-19 pandemic is defined as the area between the black and green line from March 1, 2020 onwards. The dotted black vertical line marks the start of the pandemic on March 1, 2020.
Figure 3

Monthly national deaths by subcategory of external causes of death from January 2014 to December 2021.
The black line shows observed data, the green line shows the seasonal model baseline, and the orange shading represents the 95% Confidence Interval (CI) on the seasonal baseline. The dotted red vertical line marks the start of the pandemic period of excess mortality on March 1, 2020.
Figure 4
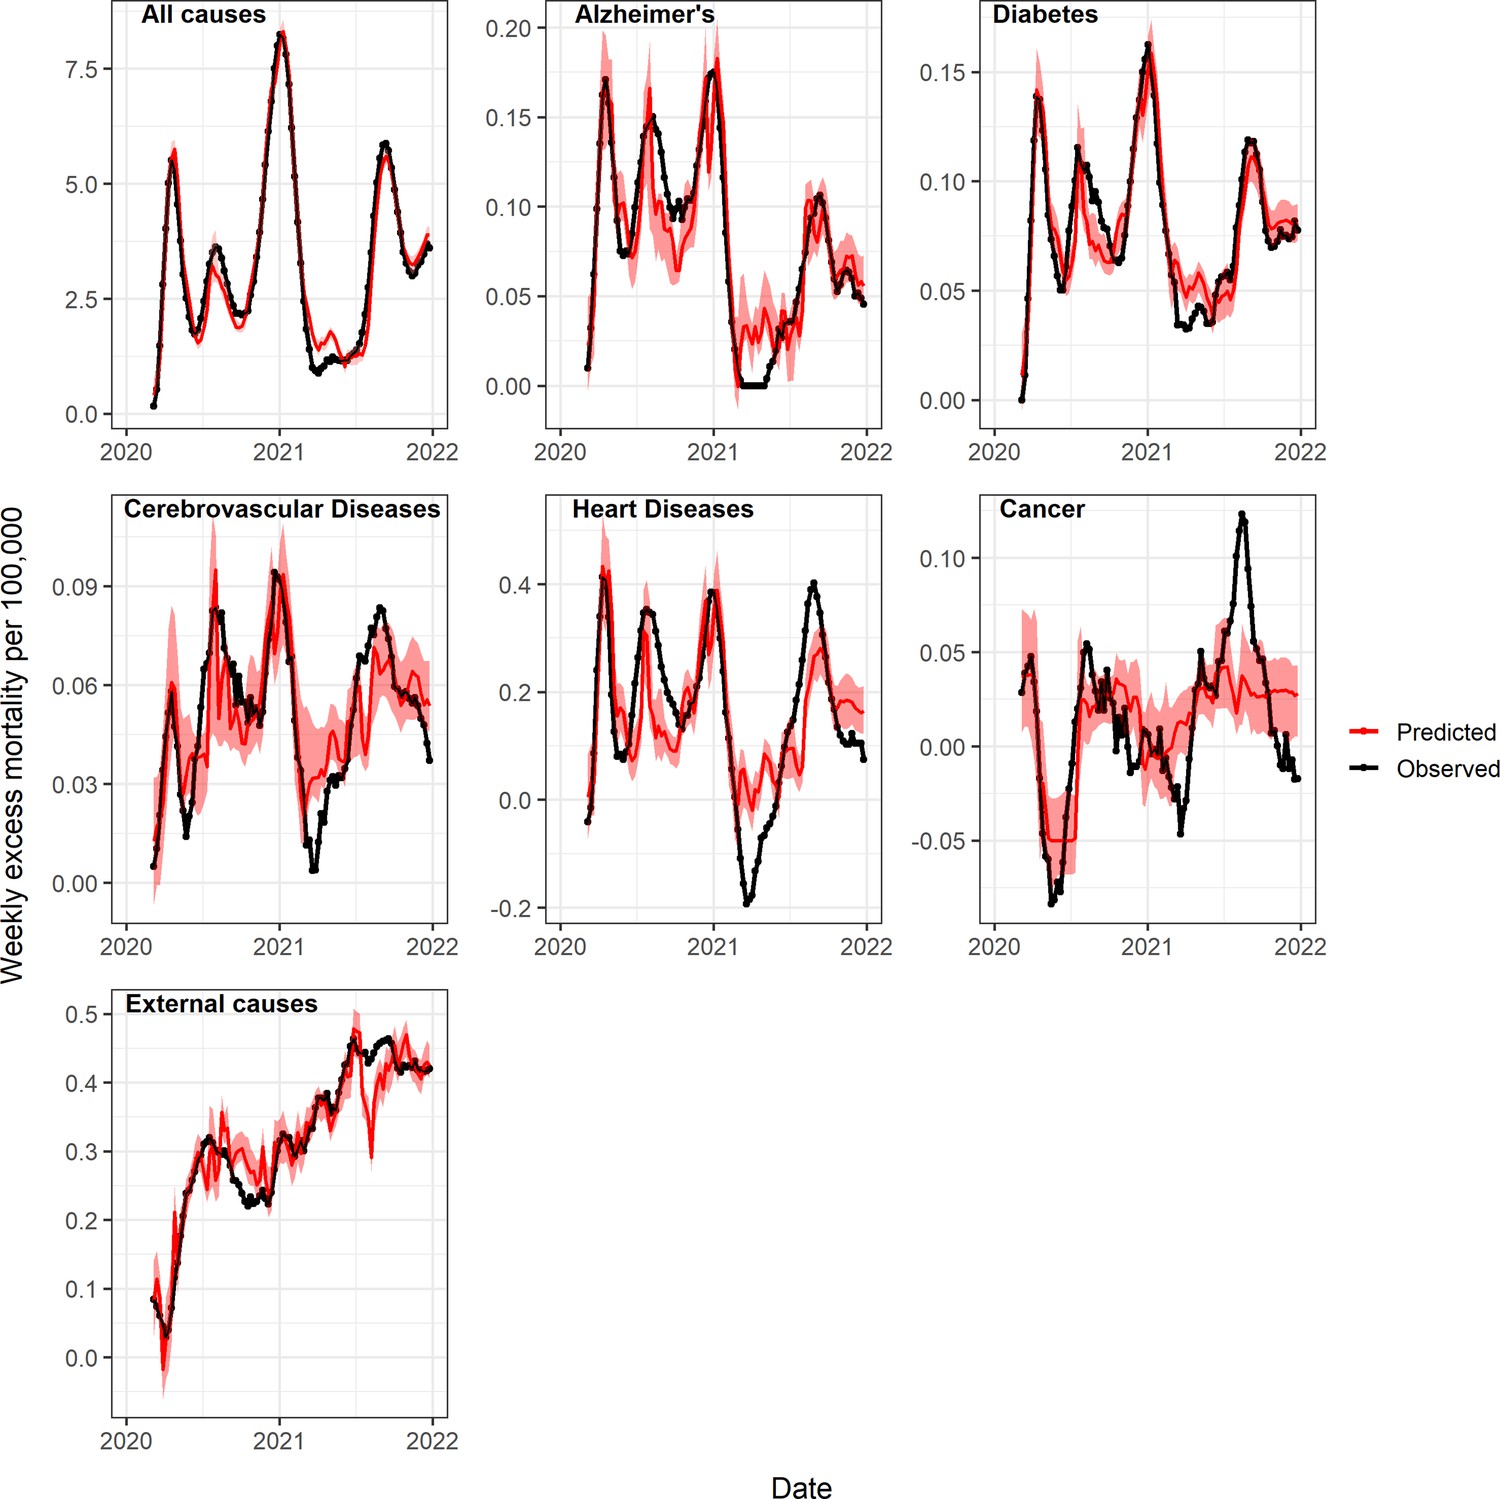
Observed and predicted excess death rates by condition, United States, March 1, 2020 to January 1, 2022, using generalized additive models (GAM) with weekly COVID-19 deaths, intensive care unit (ICU) occupancy, and a proxy for the strength of interventions as covariates.
Observed values are in black and predicted values are in red (mean=dark red, 95% Confidence Interval (CI) in lighter red). See also Appendix 1—figure 16 for a comparison of predicted and observed values, and Appendix 1—figures 18 and 19 for age-specific models.
Figure 5
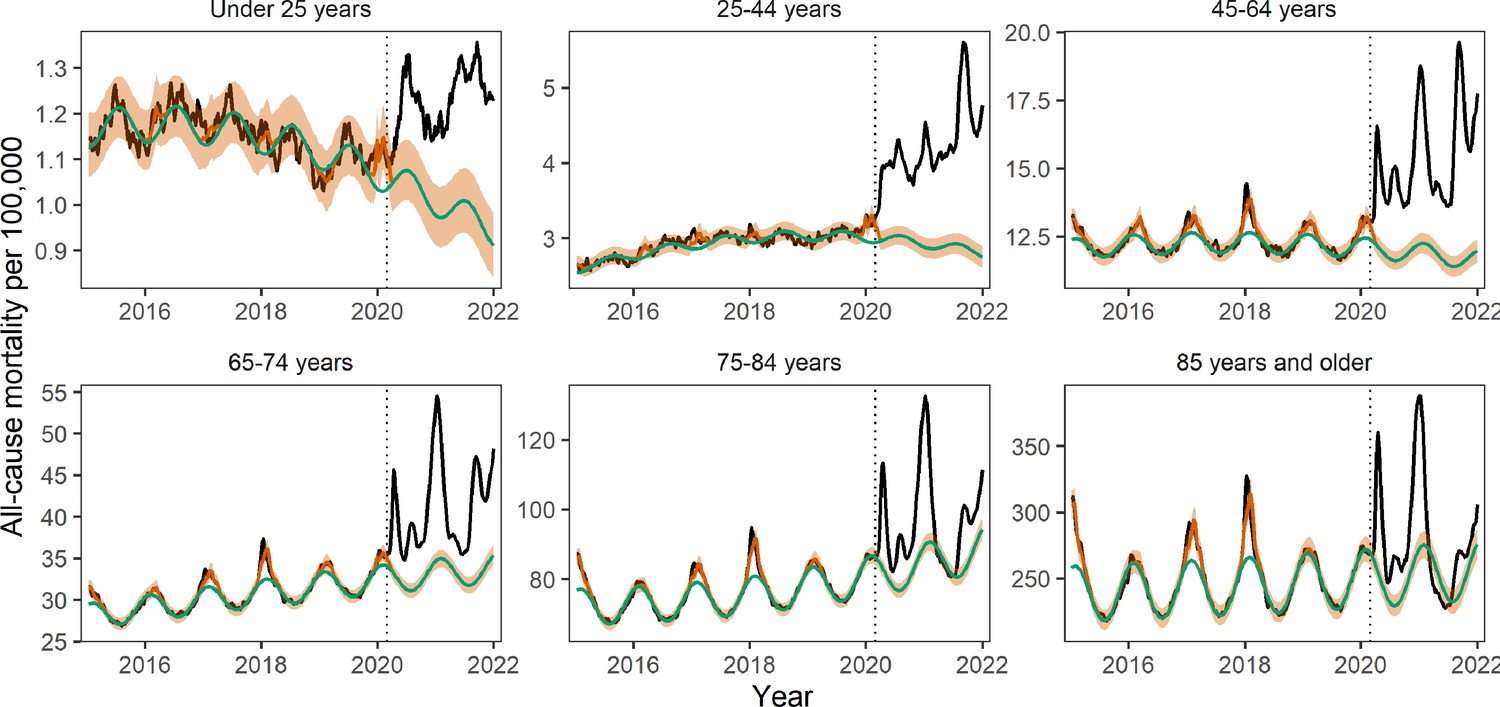
Age-specific weekly all-cause mortality rates time series per 100,000.
The black line shows observed data, the green line shows the seasonal model baseline, the orange shaded areasthe 95% Confidence Interval (CI) on the seasonal baseline, and the red line shows model predictions with seasonal variation and influenza circulation. Excess mortality attributed to the COVID-19 pandemic is defined as the area between the black and green line from March 1, 2020 onwards. The dotted black vertical line marks the start of the pandemic on March 1, 2020.
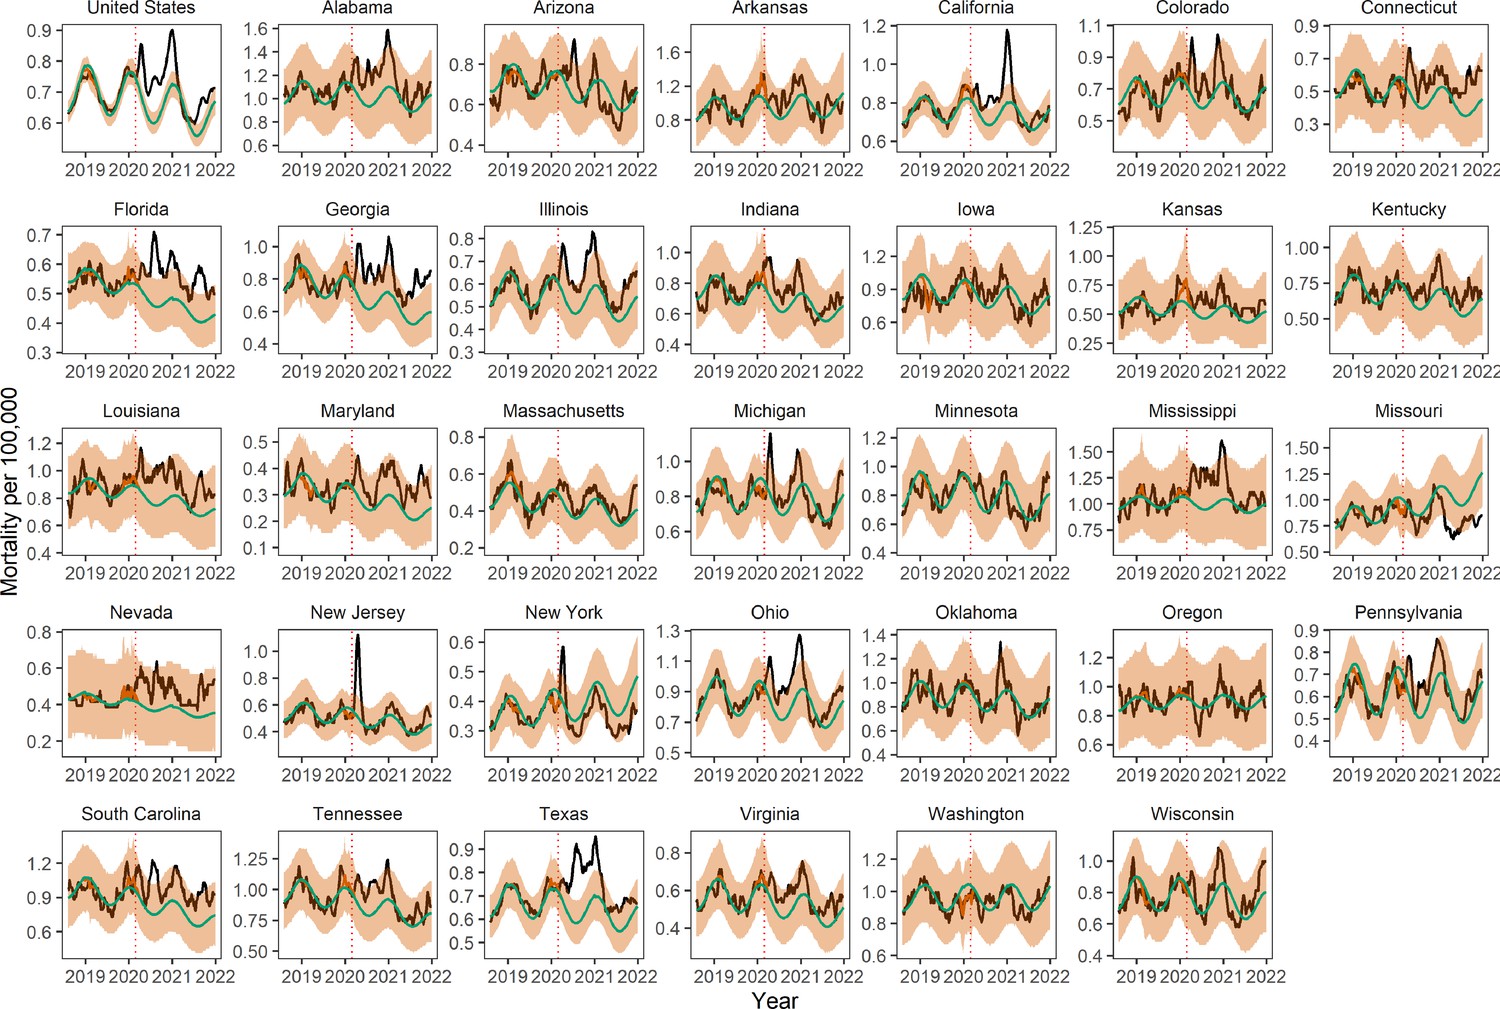
Appendix 1—figure 1
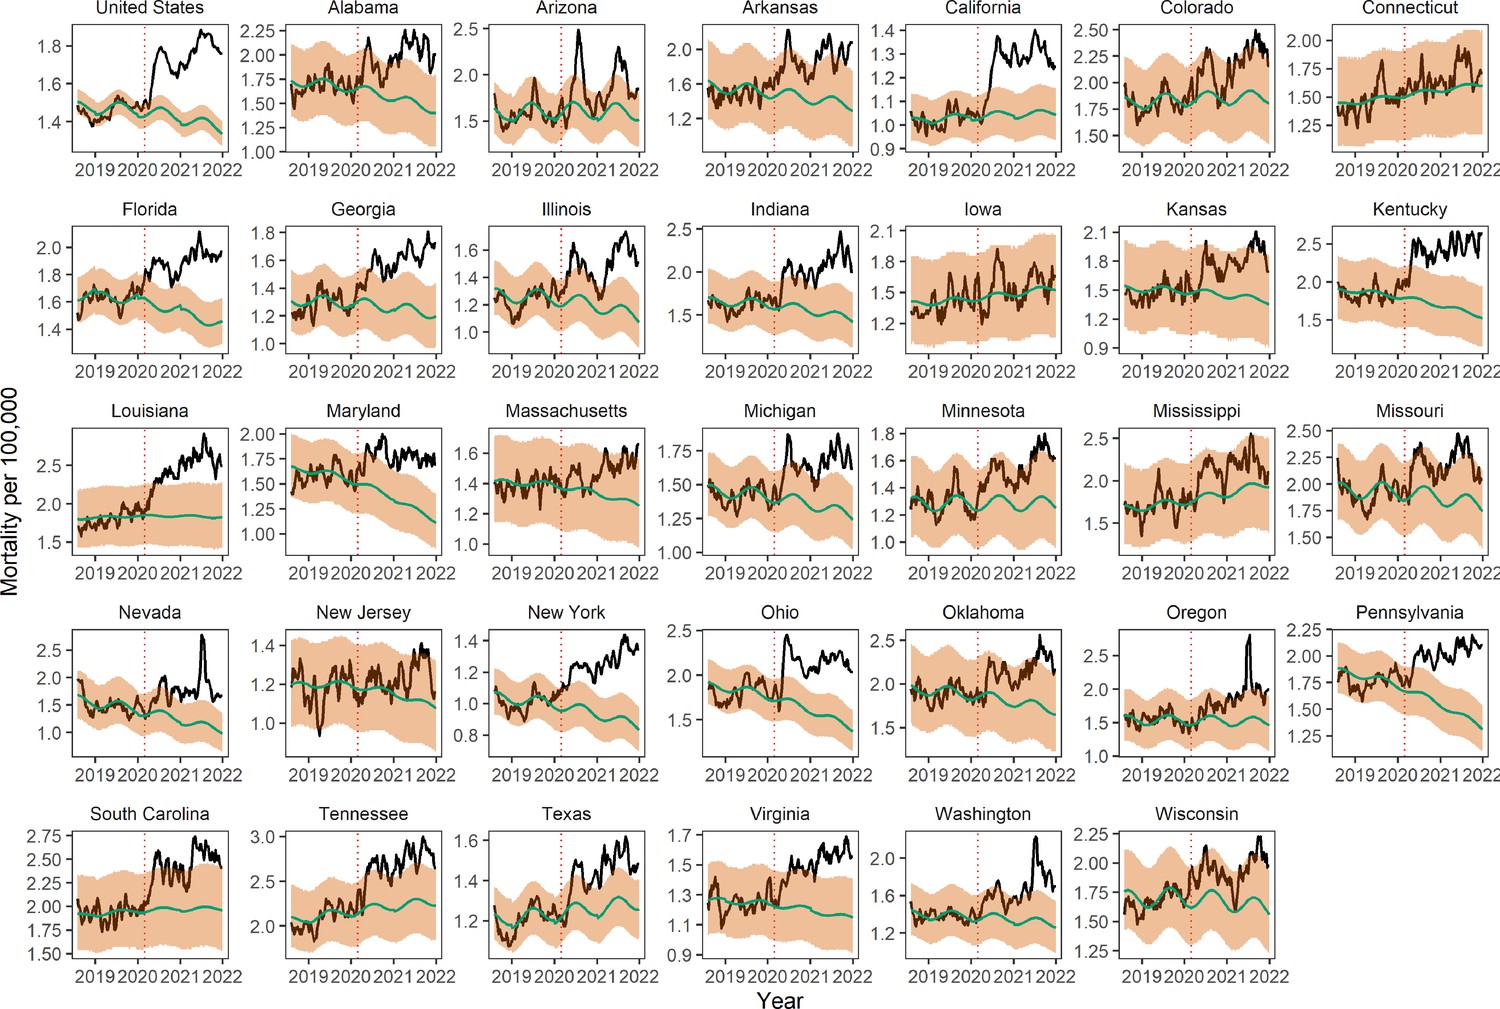
Trends in weekly all-cause mortality, nationally, and by state, August 1, 2018 to Janaury 1, 2022 Black lines show observed weekly death rates.
Green lines show the seasonal baseline estimated based on time series regression of pre-pandemic data from August 1, 2014 to March 1, 2020 (the graph below truncates earlier years for sake of clarity). The red solid line shows the seasonal variation accounting for influenza circulation. The orange shading shows the upper and lower 95% confidence intervals (CIs) on the baseline. The dotted vertical line marks March 1, 2020. 33 states were selected for analysis of non-respiratory mortality causes based on completeness patterns.
Appendix 1—figure 2
Trends in weekly Alzheimer’s mortality, nationally, and by state.
Legend as in Appendix 1—figure 1
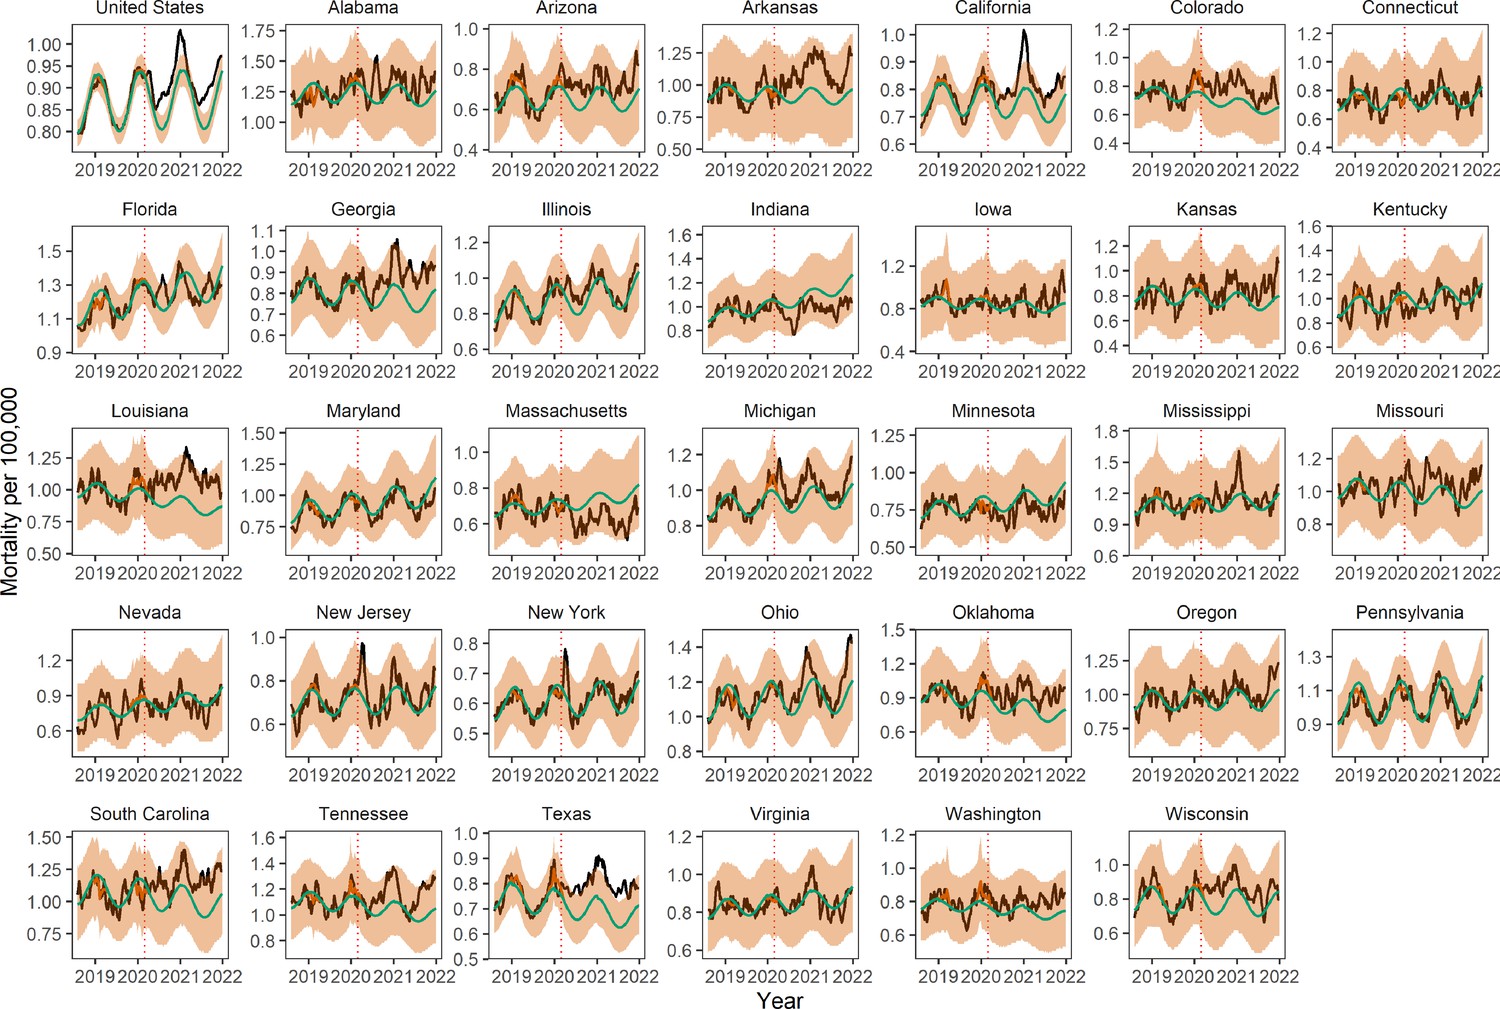
Appendix 1—figure 3

Trends in weekly cancer mortality, nationally, and by state.
Legend as in Appendix 1—figure 1
Appendix 1—figure 4
Trends in weekly cerebrovascular disease mortality, nationally, and by state.
Legend as in Appendix 1—figure 1
Appendix 1—figure 5
Trends in weekly diabetes mortality, nationally, and by state.
Legend as in Appendix 1—figure 1
Appendix 1—figure 6
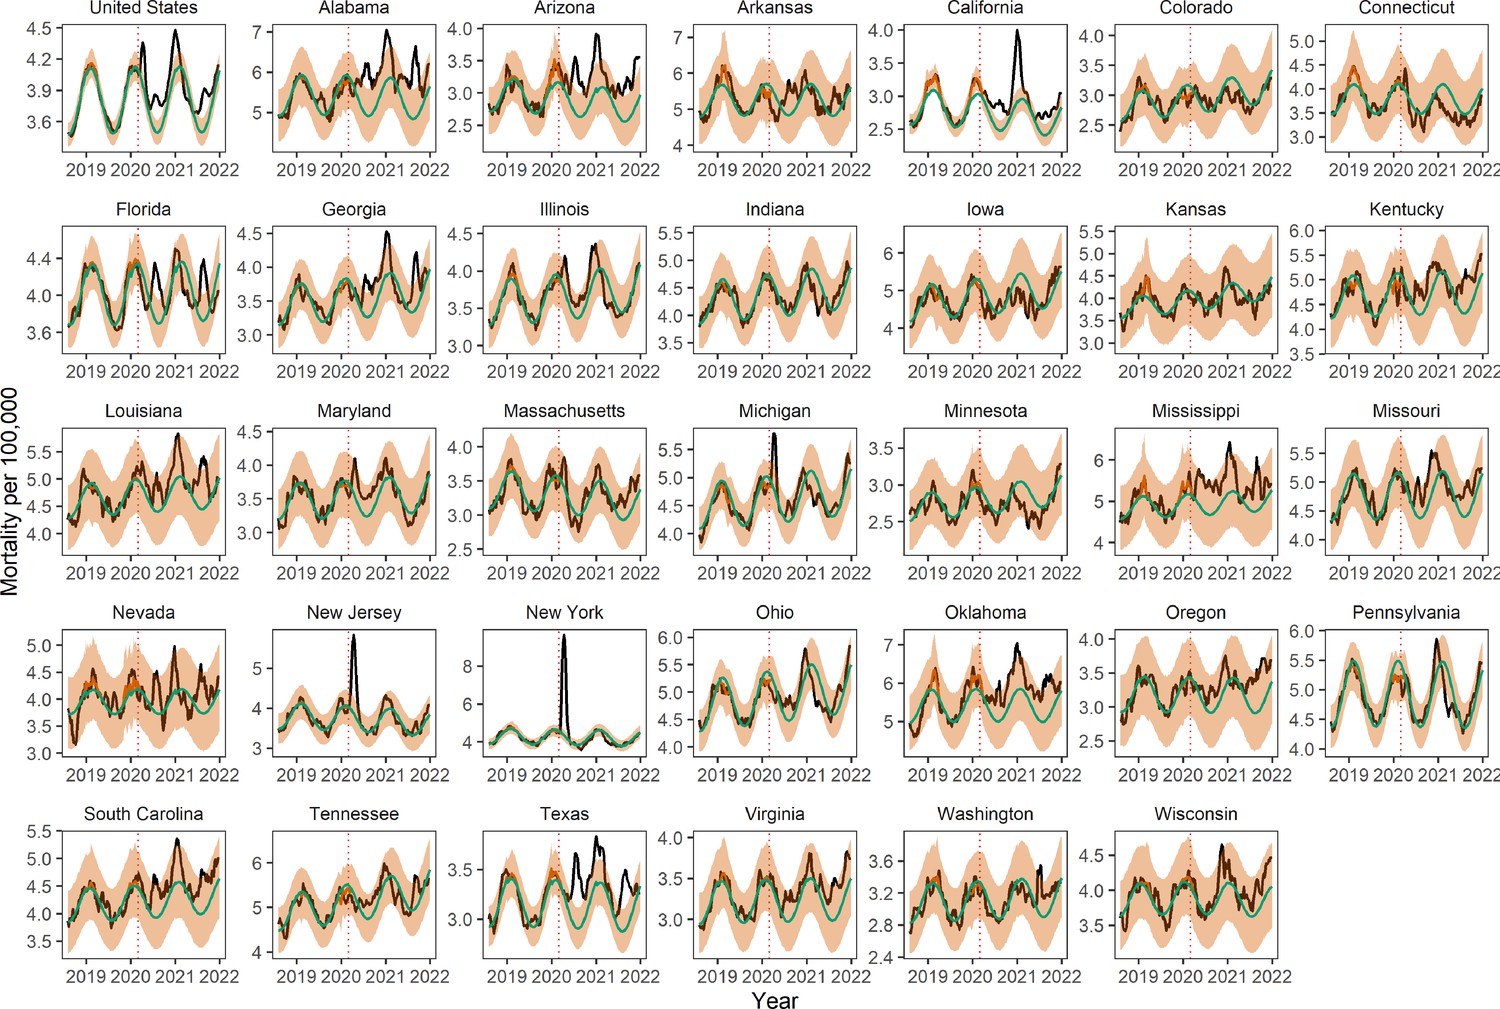
Trends in weekly heart disease mortality, nationally, and by state.
Legend as in Appendix 1—figure 1
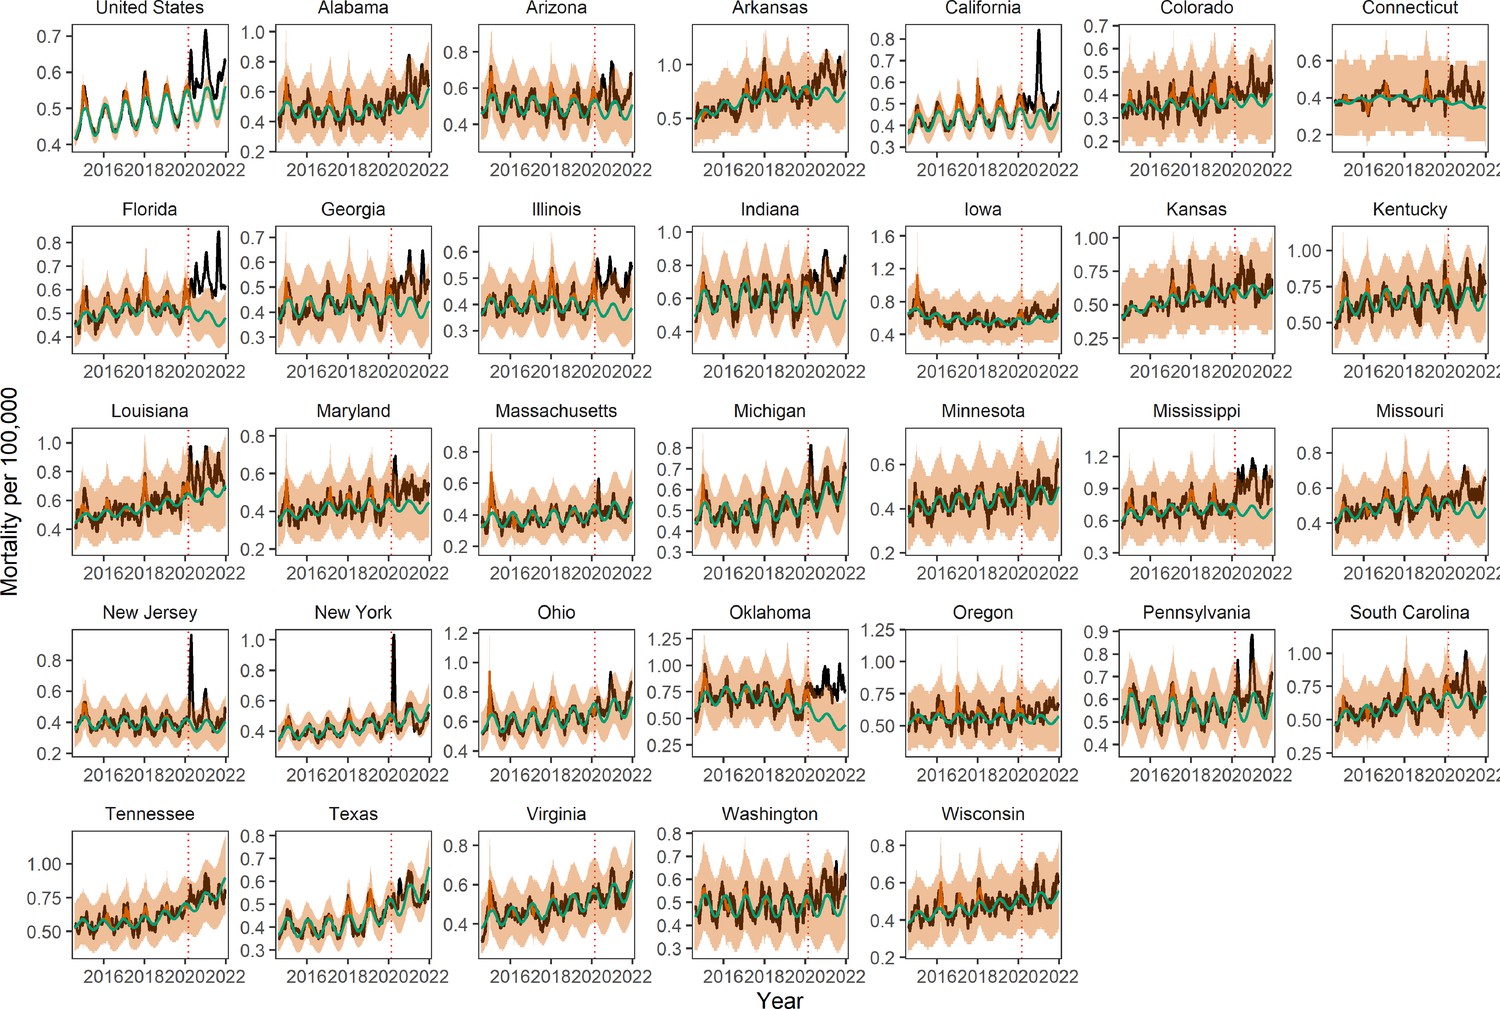
Appendix 1—figure 7
Trends in weekly mortality from external causes (opioids, suicides, accidents, etc.), nationally and by state.
Legend as in Appendix 1—figure 1.
Appendix 1—figure 8
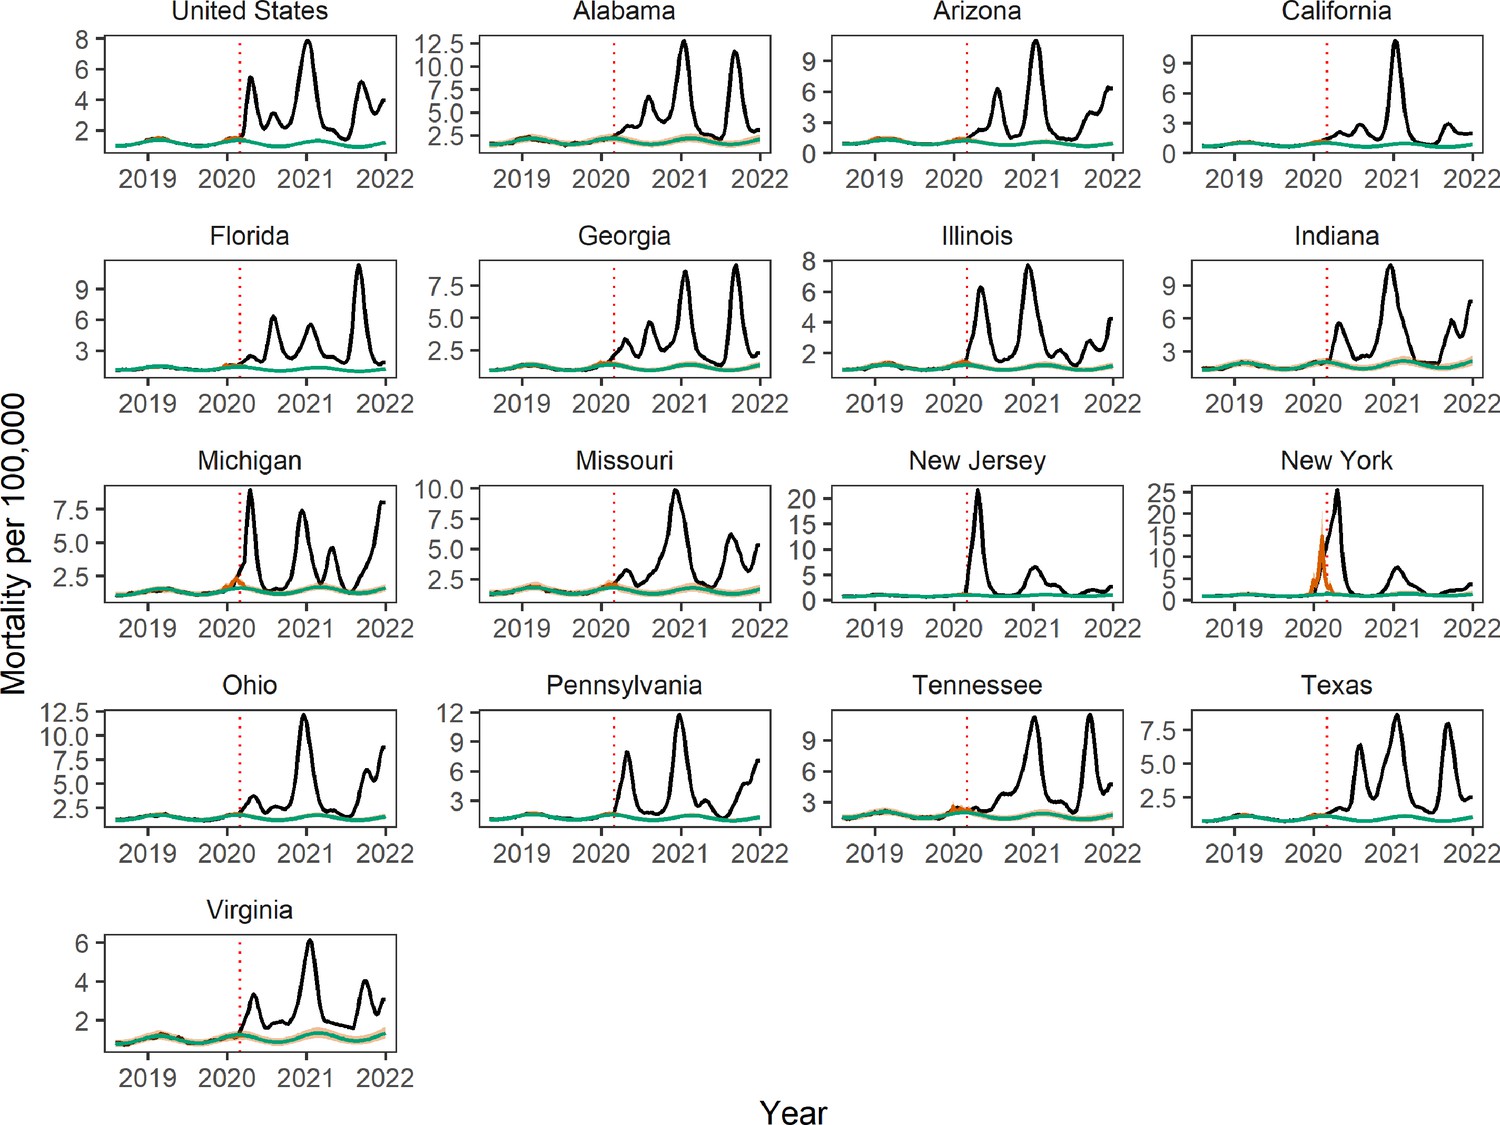
Trends in weekly respiratory and COVID-19 mortality, nationally, and by state.
Legend as in Appendix 1—figure 1 (only 16 states had sufficient weekly data for these conditions).
Appendix 1—figure 9
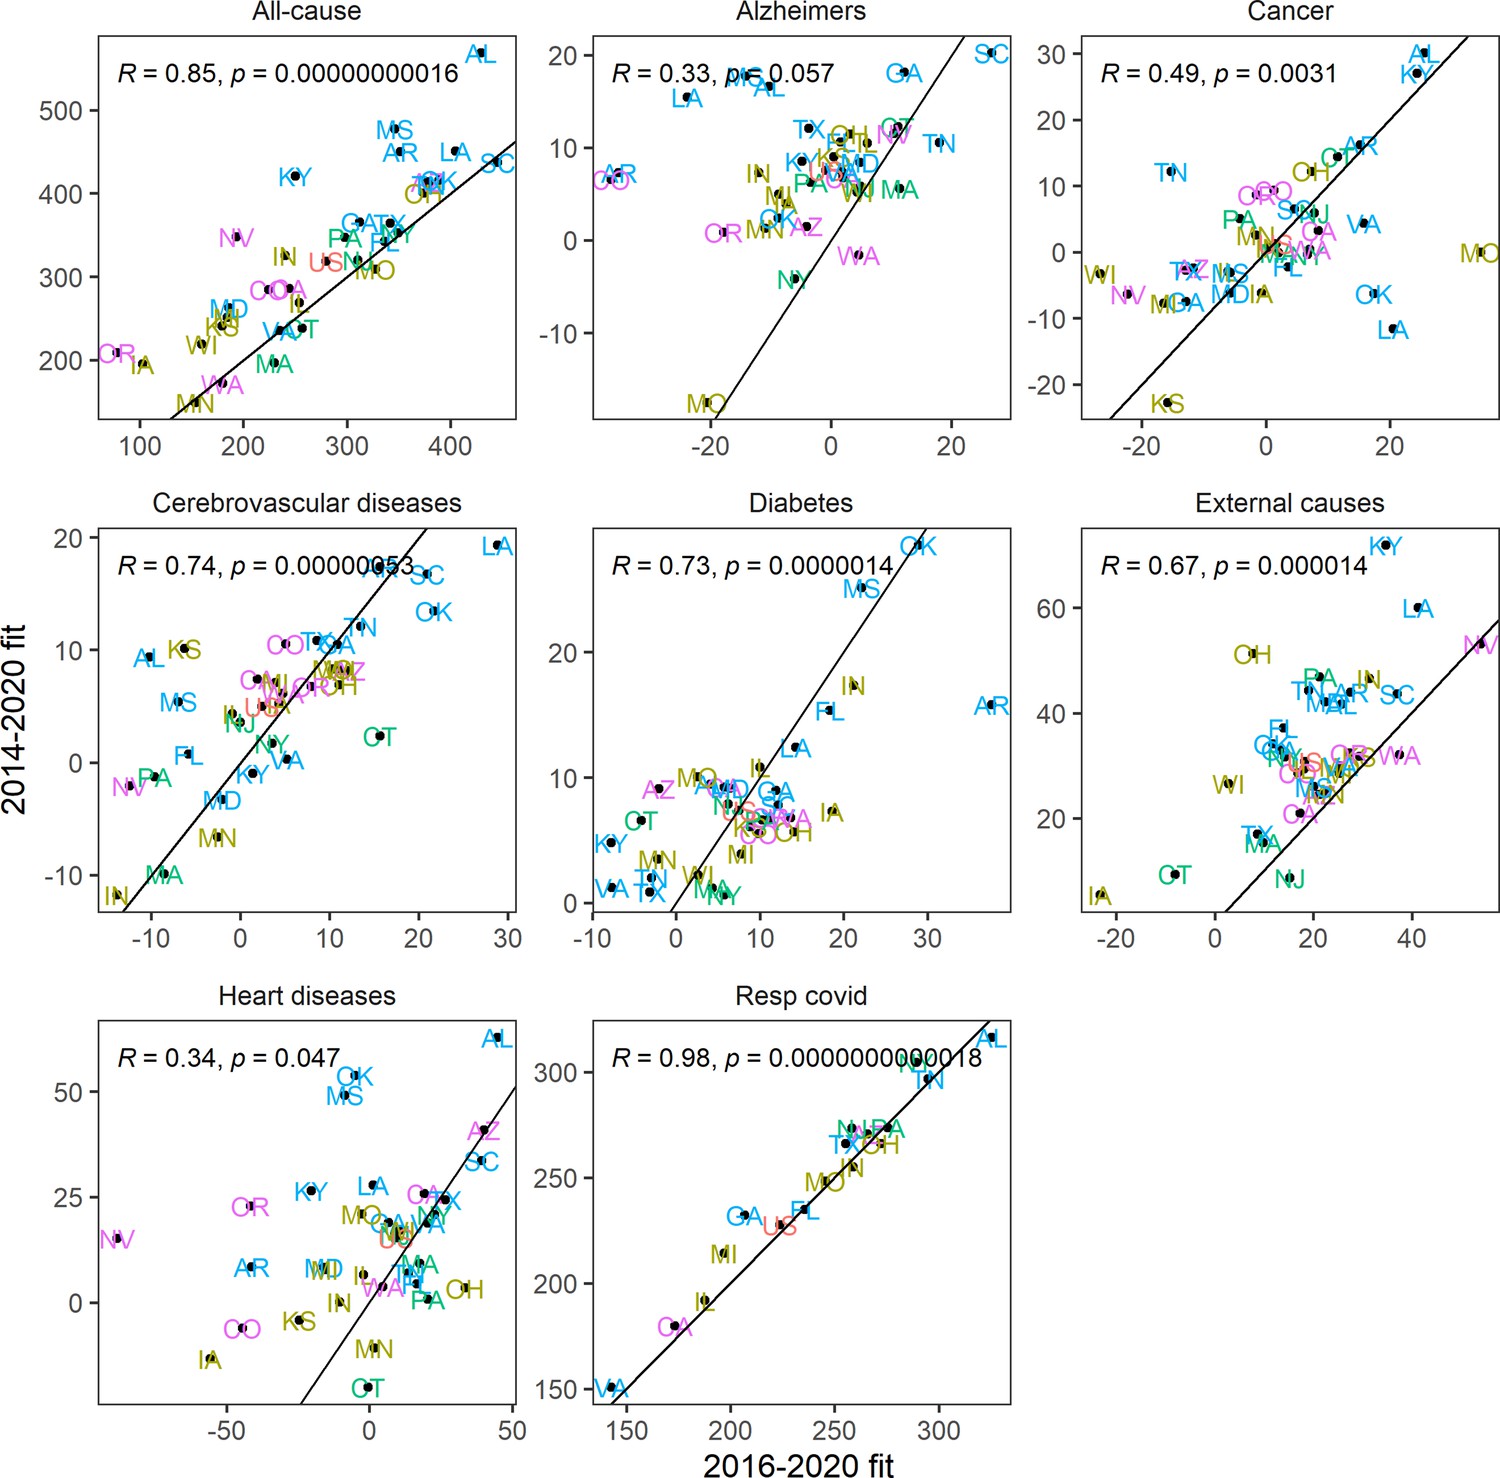
Sensitivity analysis using a shorter historic time series (August 1, 2016 to March 1, 2020) than in the main analysis to calibrate the model baseline.
Graph displays estimates of cumulative excess mortality rates for the pandemic period, March 1, 2020 to January 1, 2022, by state and cause of death. Correlation is shown with estimates from the main analyses, which use calibration data going back to August 2014.
Appendix 1—figure 10
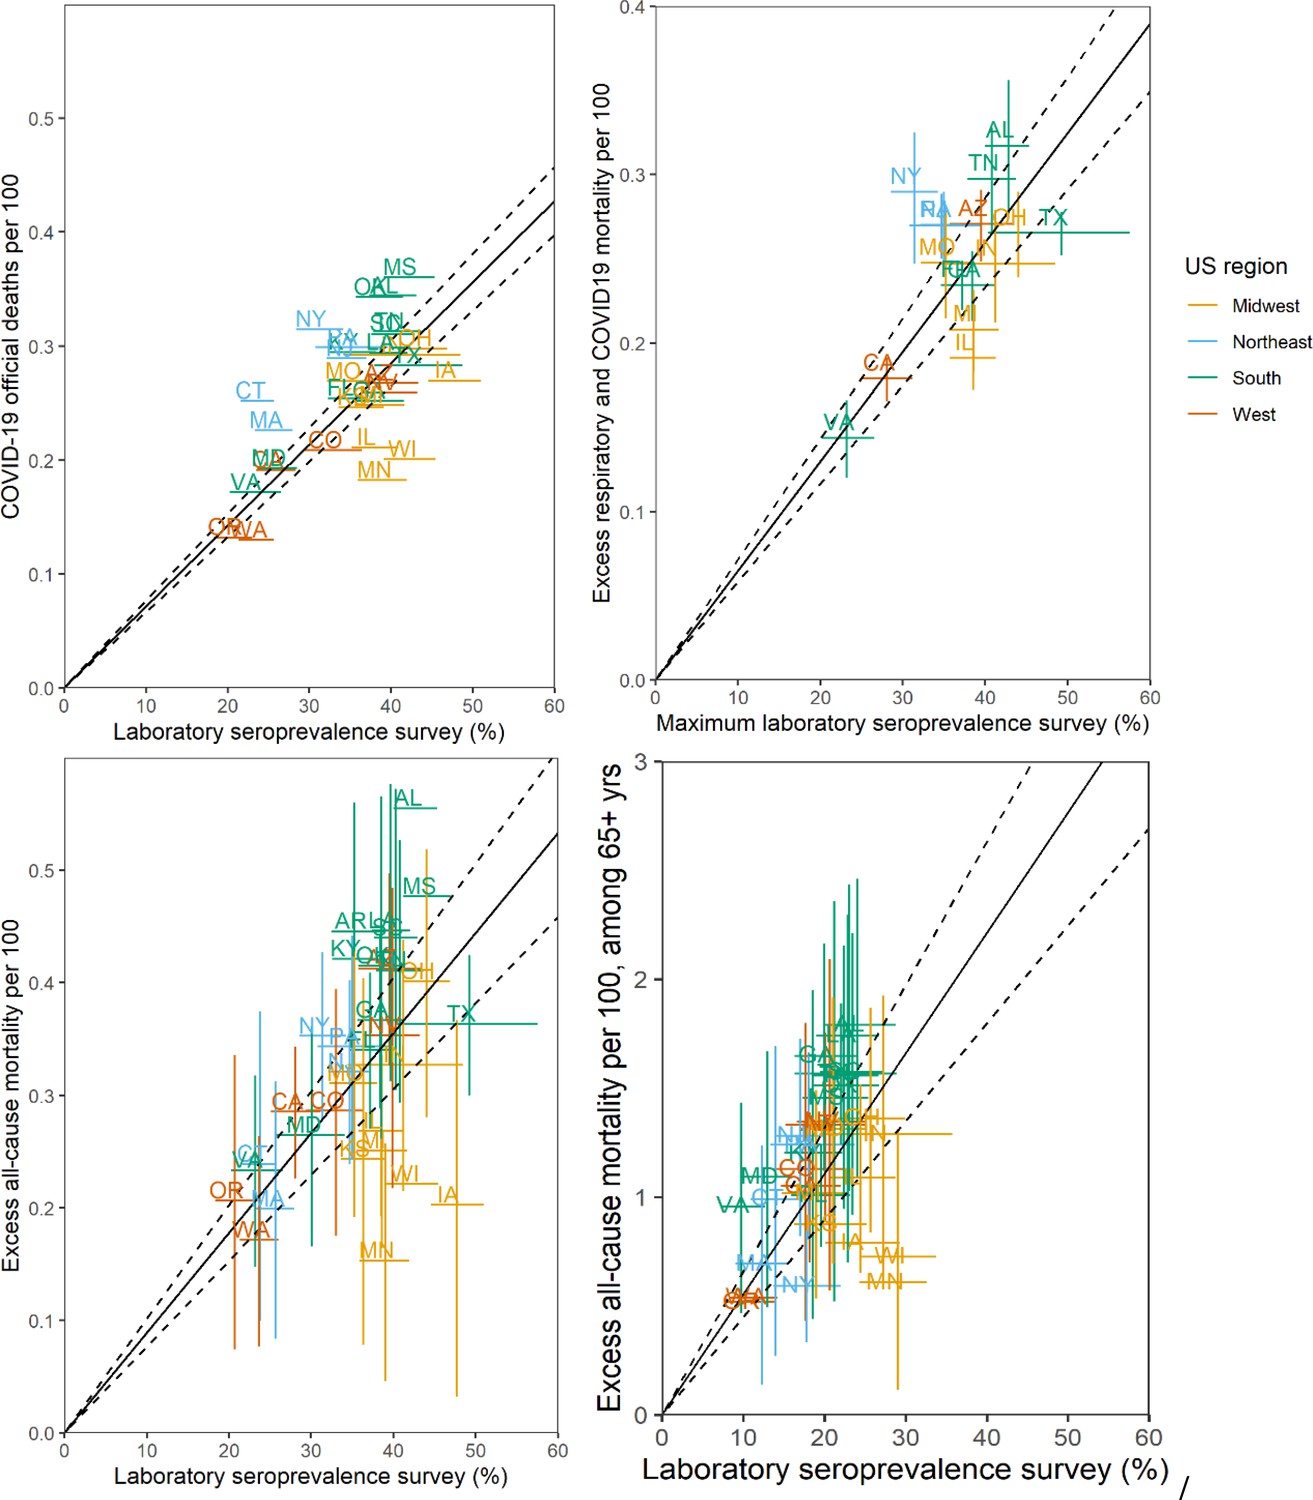
Sensitivity Analyses of Infection Fatality Rate (IFR, ratio of deaths/infections), March 1, 2020 to January 1, 2022.
The main analysis (Figure 1B in main text) is based on a comparison of excess respiratory deaths with Centers for Disease Control and Prevention (CDC) laboratory seroprevalence survey of SARS-CoV-2 N antigen by December 2021. Sensitivity analyses are based on: top left: official COVID-19 death tallies; top right: maximum seroprevalence estimates during study period; bottom left: excess all-cause deaths; bottom right: ages over 65 years (excess all-cause mortality in 65+ vs. seroprevalence in 65+). Each point corresponds to a state, annotated by their acronym. Error bars represent 95% confidence intervals (CIs). The black line and dotted region represent a linear regression fit and the associated 95% CI. IFR estimates, based on the slope of the regression, are: official COVID-19: 0.71% (0.66–0.76%); maximum serology estimates: 0.65% (0.58–0.72%); all-cause mortality 0.90% (0.76–1.01%); 65+ years: 5.5% (4.5–6.6%).
Appendix 1—figure 11
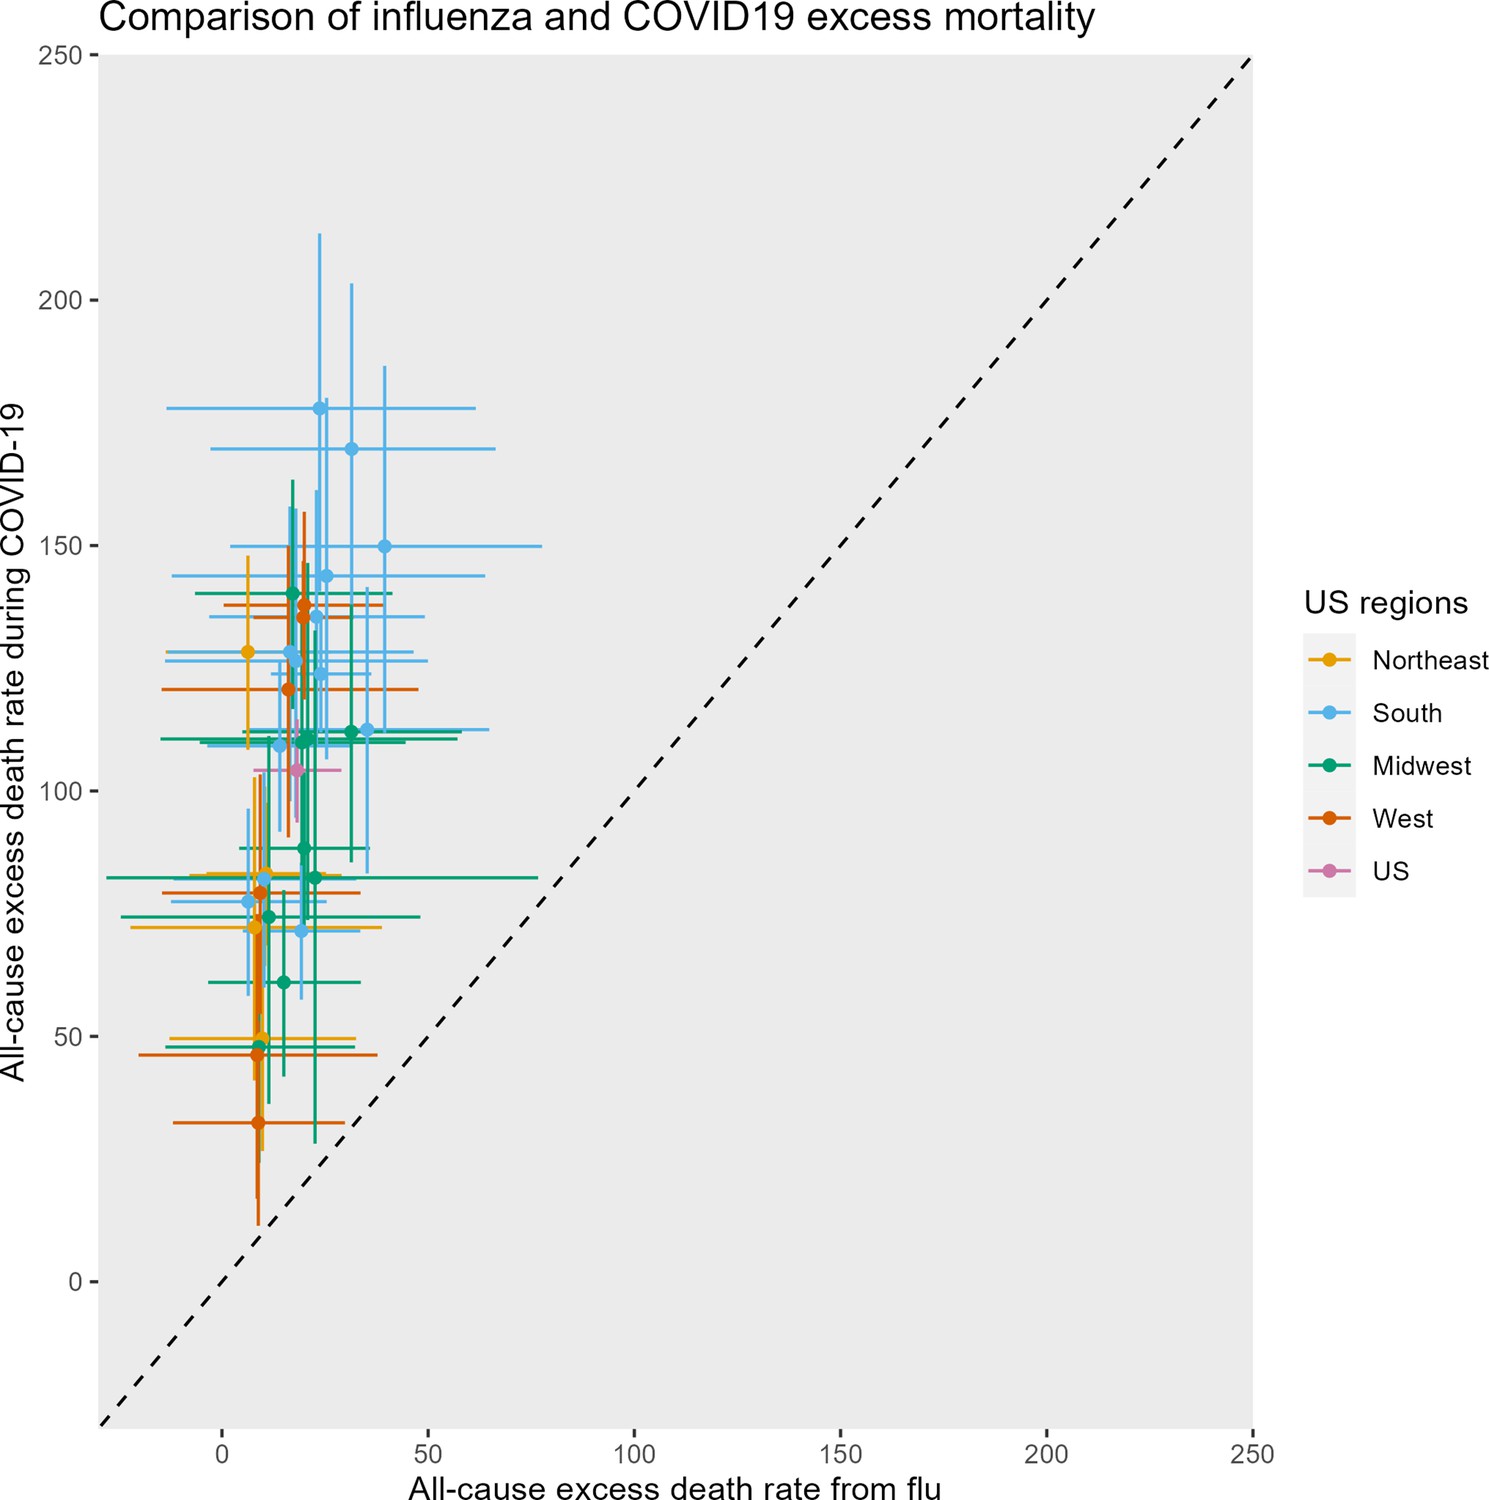
Comparison of excess mortality from a severe influenza season (2017–2018) and the most severe of the COVID-19 waves (2020–2021 winter wave) across United States.
For the sake of comparability, we estimated all-cause excess mortality for the November tto March period for each pathogen. All rates are per 100,000. Each symbol represents a state, color-coded by region, with the horizontal and vertical bars representing 95% confidence intervals (CIs) on excess estimates. Note that some of the lower bounds of the CIs on the flu estimates were negative. The diagonal represents the line where the influenza and COVID-19 mortality burden would be equal. The median ratio of excess COVID-19 to excess flu is 5.8 across United States.
Appendix 1—figure 12
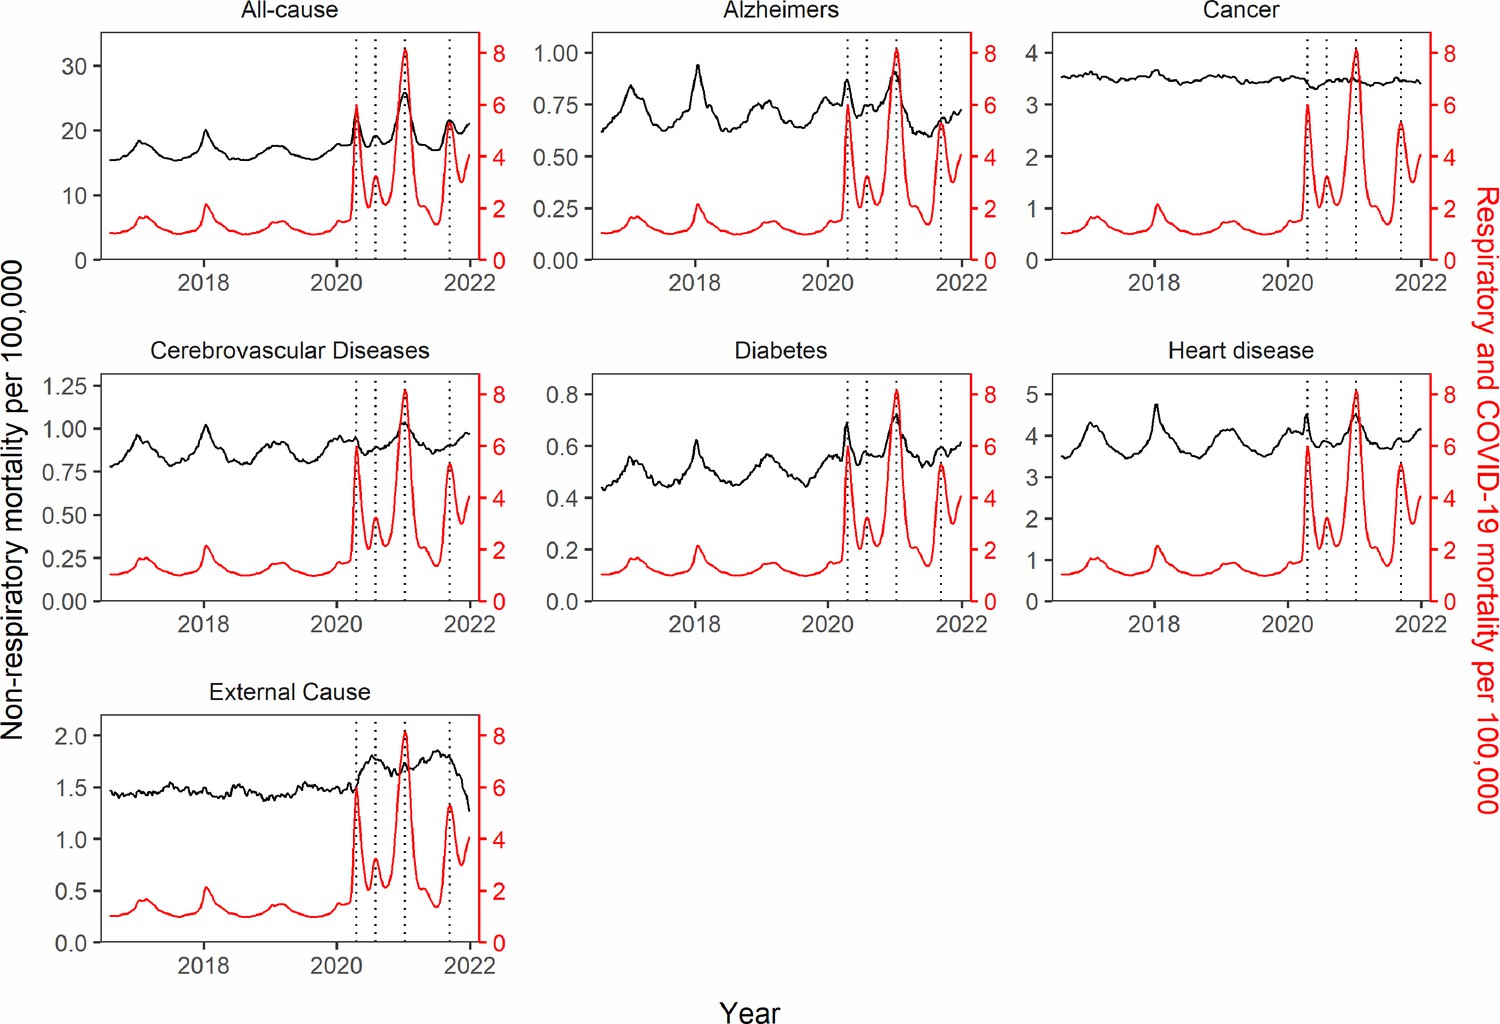
Synchrony between respiratory and non-respiratory mortality patterns on a national scale.
The black lines show the time-series of mortality rates (before excess mortality modeling) for each non-respiratory mortality cause. The red line represents respiratory and COVID-19 mortality rate. The dotted black vertical lines mark the dates of peak respiratory and COVID-19 mortality for each of the four national pandemic waves in the study period (April 18, 2020; August 1, 2020; January 9, 2021; September 11, 2021). Synchrony with respiratory and COVID-19 mortality is most pronounced for all-cause, Alzheimer’s, Heart Disease, Diabetes, and in the first three waves (before vaccination). Synchrony is intermediate for cerebrovascular diseases and absent for cancer and external causes.
Appendix 1—figure 13
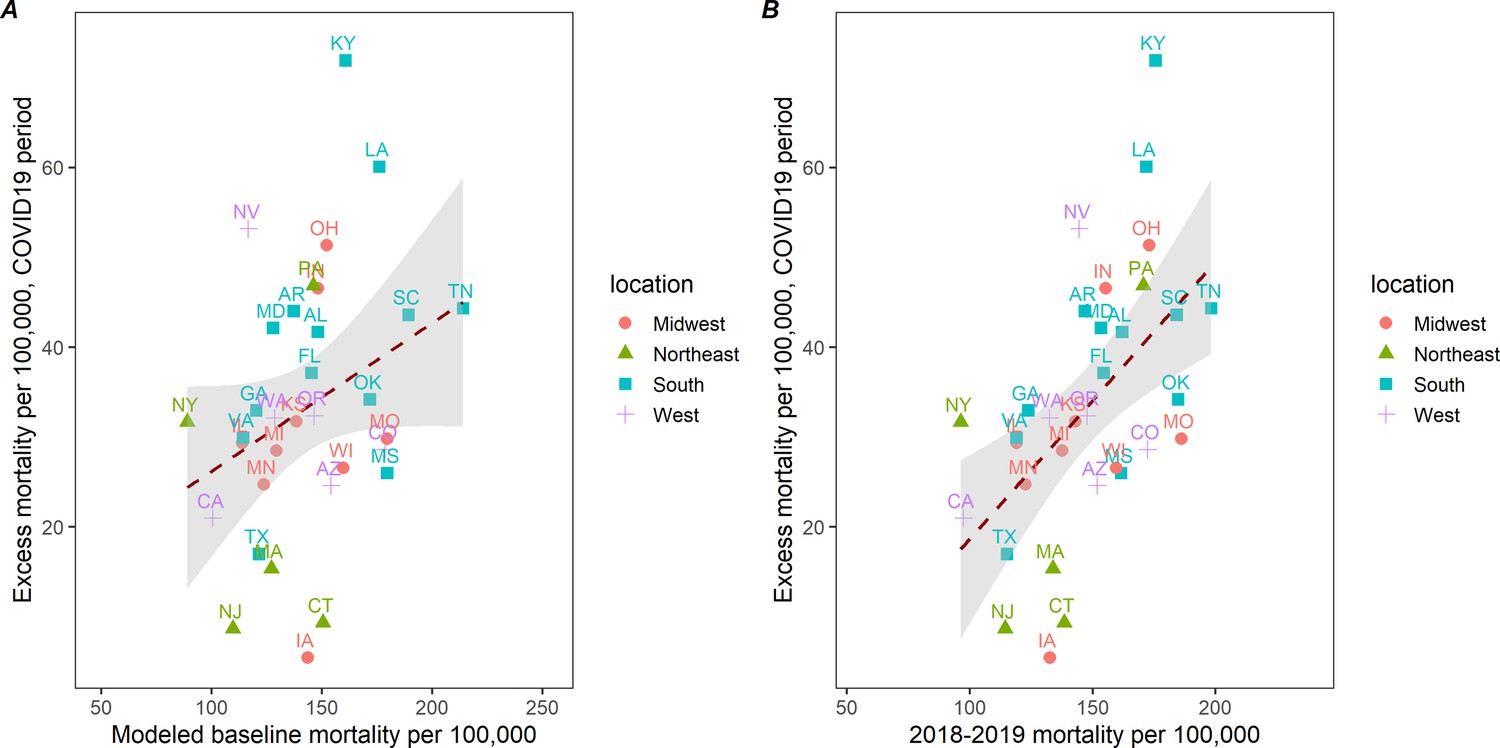
Correlation between cumulative excess death rates due to external causes (opioids, suicide, accidents, etc.) during March 1, 2020 to January 1, 2022 and baseline death rates of external causes, across 33 states.
(A) Baselinedeath rates from external causes are based on the seasonal regression model shown in Figure 3. (B) Baselines death rates are based on observed mortality rates from external causes for a comparable pre-pandemic period, March 2018 to December 2020. The correlation is non-significant on the left (corr=0.30, p=0.09) and moderate on the right (corr=0.54, p=0.001). This suggests that states that had high rates of mortality from external causes in the 2 years before COVID-19 saw a more pronounced mortality elevation during the pandemic.
Appendix 1—figure 14
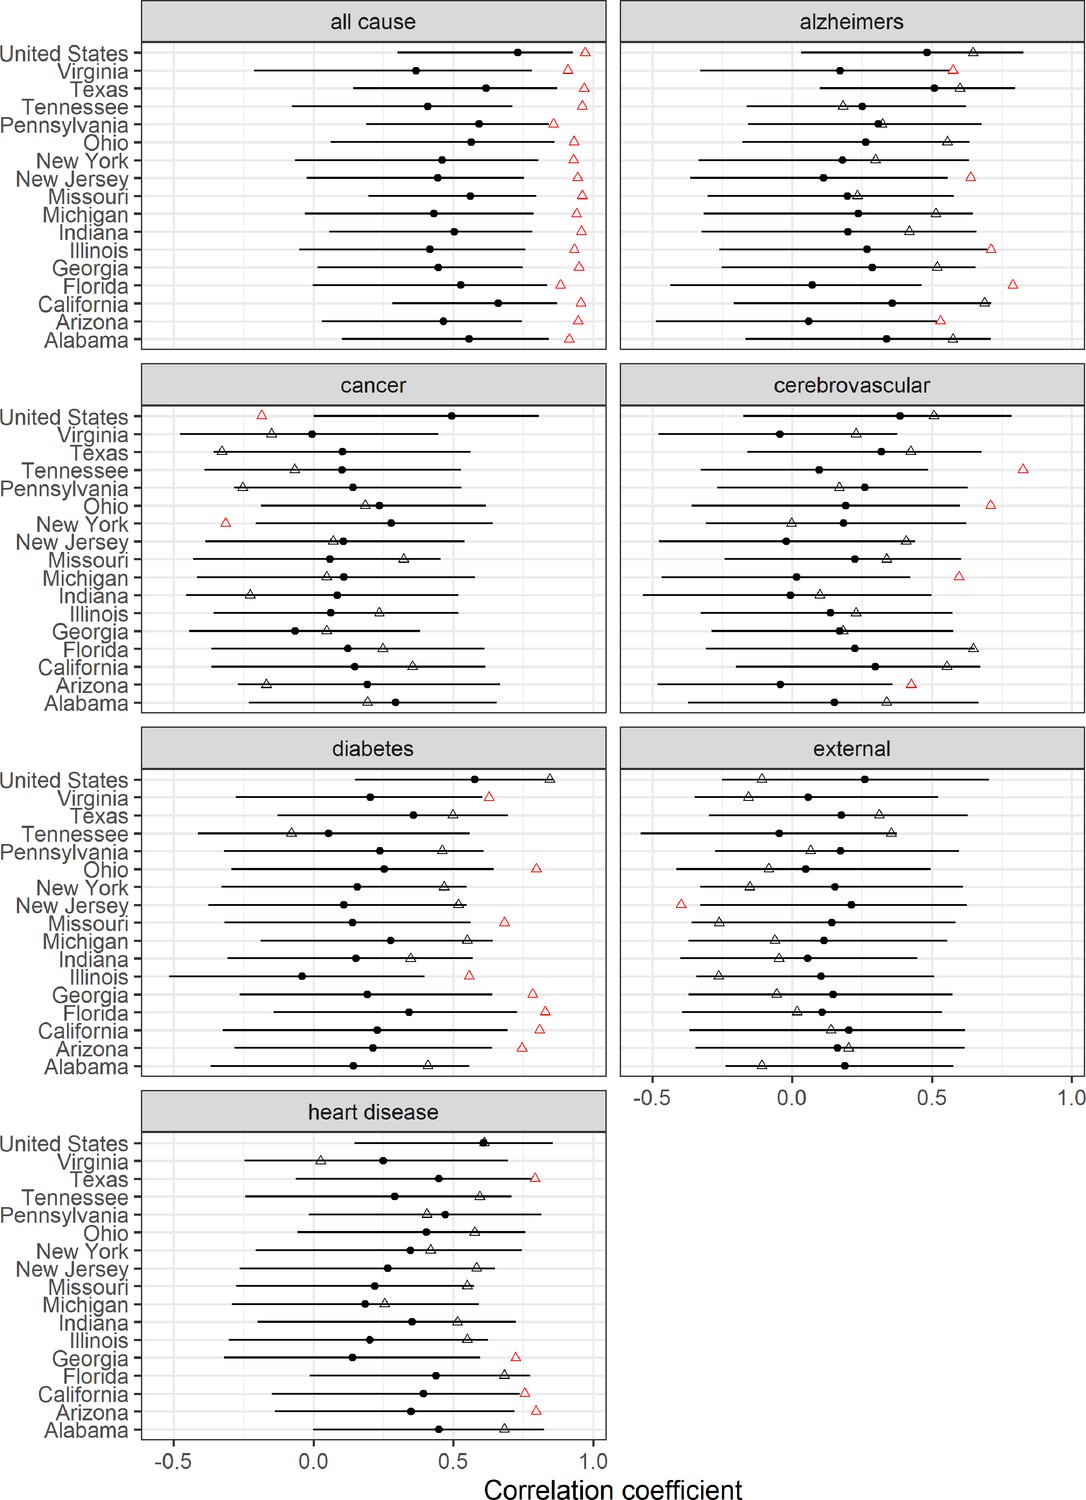
Changes in weekly synchrony between respiratory and non-respiratory mortality causes during the pandemic.
Graph compares correlations during 96 weeks of any baseline pre-pandemic period and in the 96 weeks of the pandemic (March 2020 1 to January 1, 2022). Black points represent estimated pre-pandemic correlations (96 weeks selected before March 2020 by block of 2 weeks). Black error bars represent 95% bootstrap confidence intervals (CI) accounting for multiple comparisons using Bonferroni correction. Triangles represent estimated pandemic correlations. Red color indicates significant deviation from pre-pandemic correlation. Correlation is highest for all-cause and is more pronounced during the pandemic period (red triangle), which suggests a direct impact of the virus on these conditions.
Appendix 1—figure 15
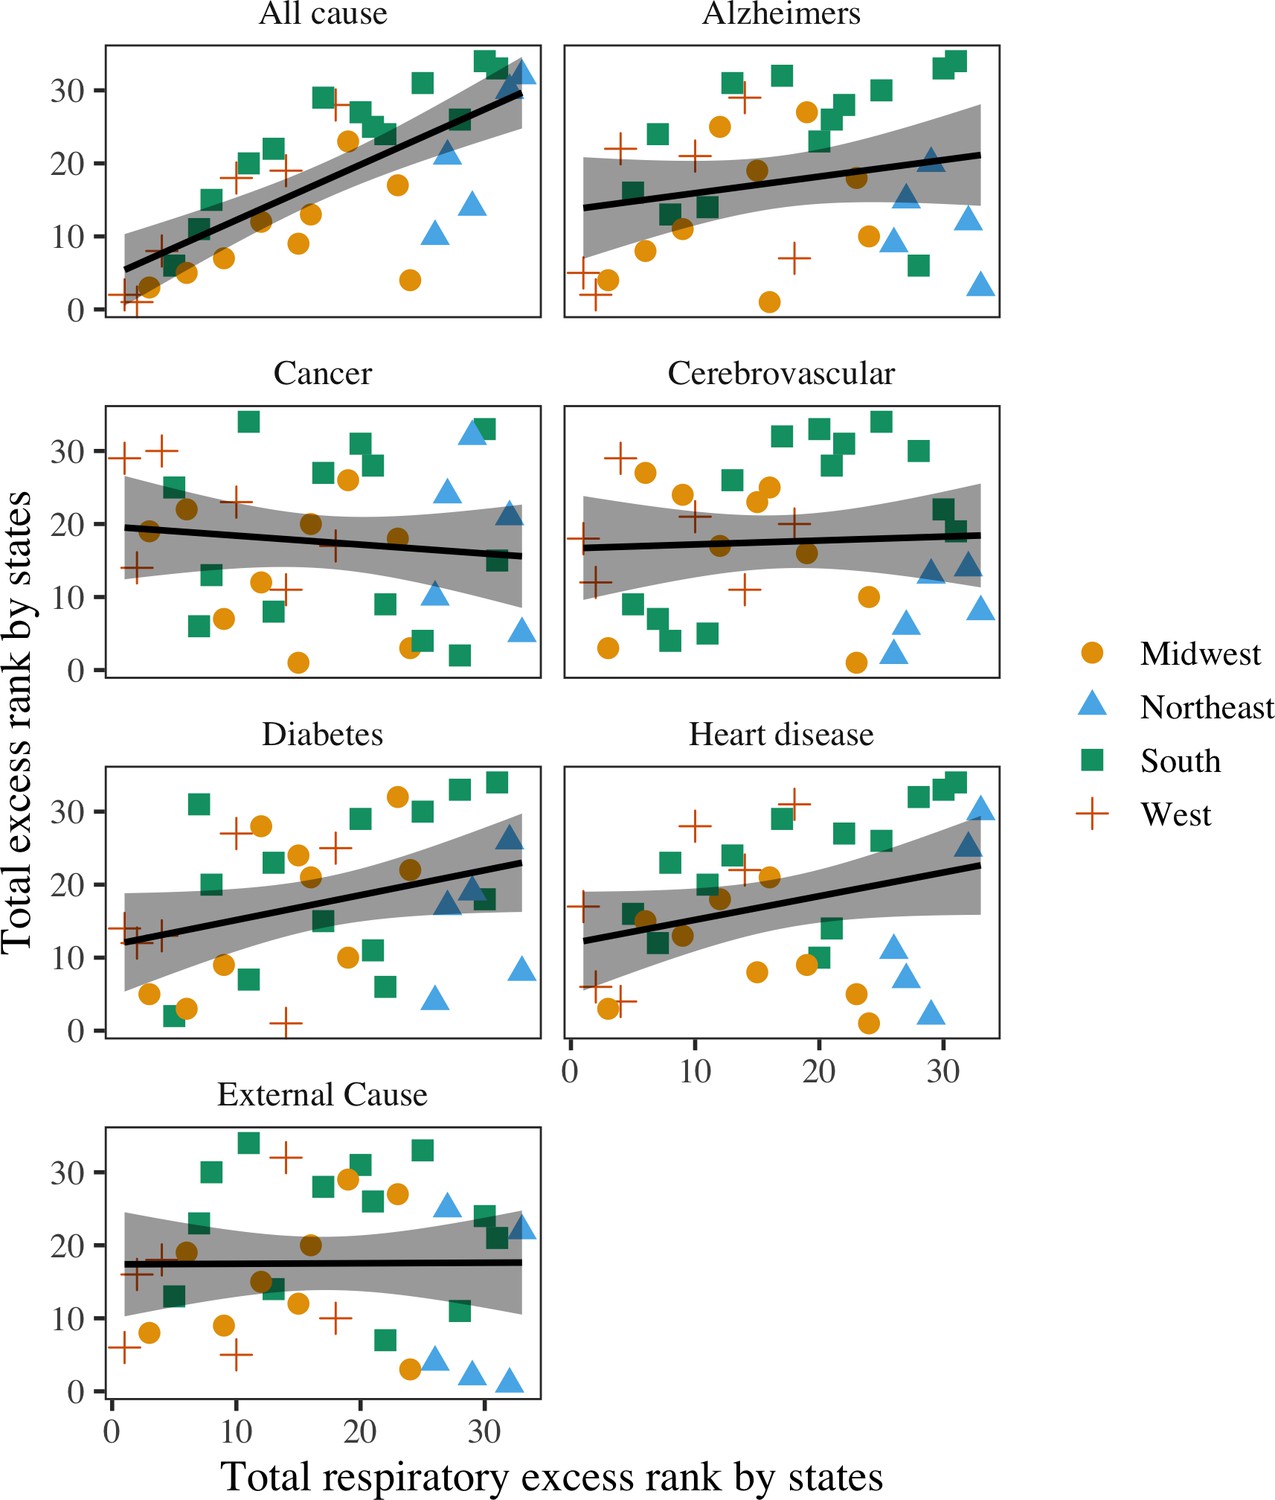
Rank correlation between total COVID-19 mortality and total excess mortality for other causes, across 33 states.
Black lines represent the best fit regression lines. Shaded areas represent the 95% confidence intervals (CI). The states have been categorized into the Midwest, Northeast, South, and West. Respiratory deaths are moderately to highly correlated with all-cause (rho=0.73, 95% CI: 0.47–0.90).
Appendix 1—figure 16
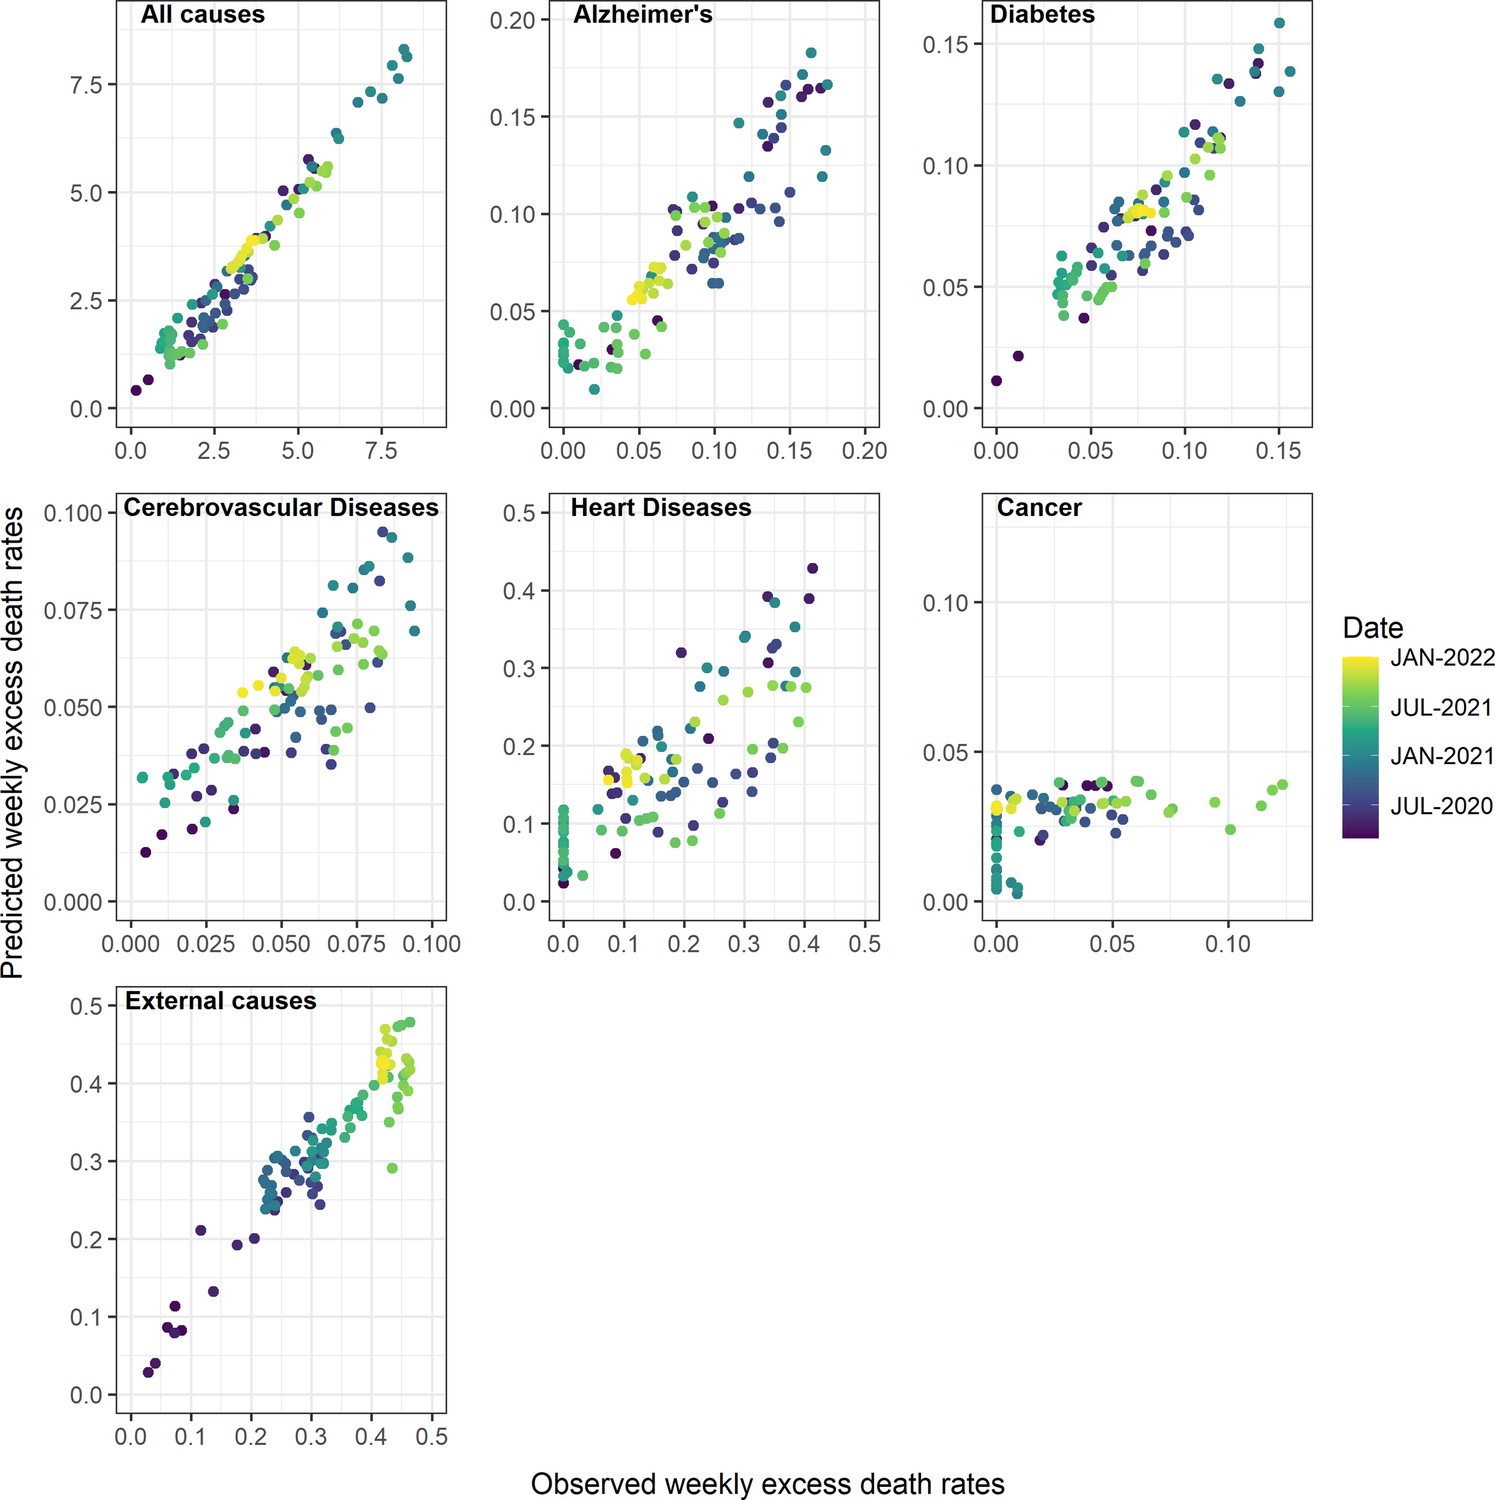
Observed and predicted excess death rates by condition, United States, March 1, 2020 to January 1, 2022, using Generalized Additive Model (GAM) models with weekly COVID-19 intensity, intensive care unit (ICU) occupancy, and strength of interventions as covariates.
Observed values are on the x-axis and predicted on the y-axis, with colors representing different time periods.
Appendix 1—figure 17
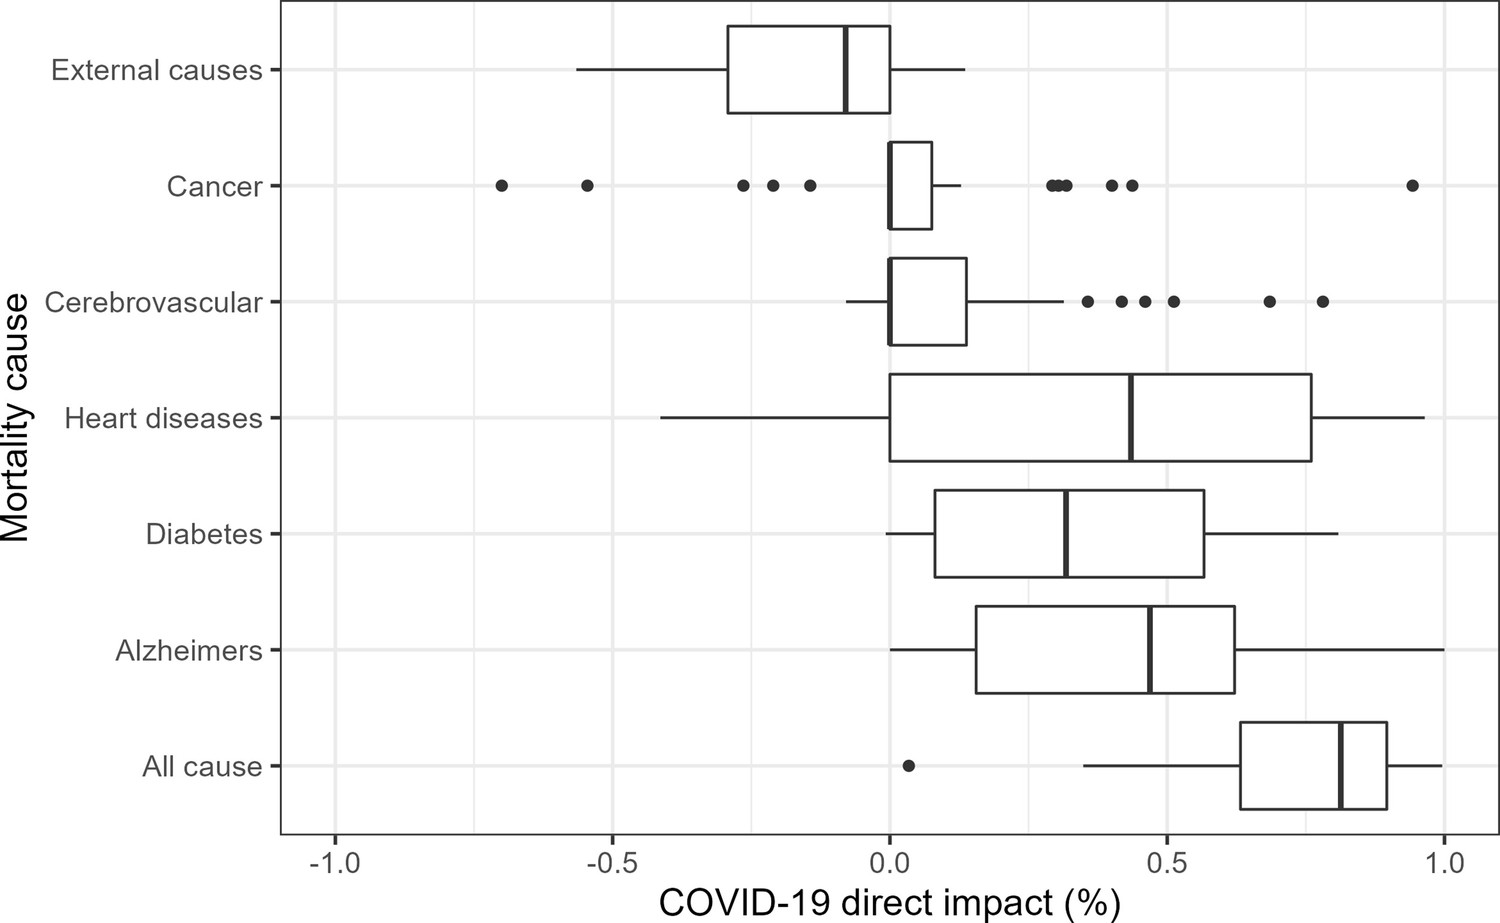
State-level analyses of the direct contribution of COVID-19 on weekly mortality from different causes, March 1, 2020 to January 1, 2022.
Results as based on Generalized Additive Model (GAM) with weekly excess mortality as the outcome, and weekly COVID-19 intensity, intensive care unit (ICU) occupancy and strength of interventions as covariates. Models are fit separately to each state. The box plots represent the proportions of excess deaths attributed to COVID-19 across states (i.e. the direct impact of SARS-CoV-2 infection). These proportions can be compared to national estimates displayed in Table 2. As in national data, we see that the state-level contribution of COVID-19 on all-cause, Alzheimers, diabetes, and heart diseases is substantial. Furthermore, the contribution to external causes is typically negative, indicating that excess mortality from these conditions tends to be high when COVID-19 activity is low. There is no or low contribution to cancer and cerebrovascular diseases.
Appendix 1—figure 18
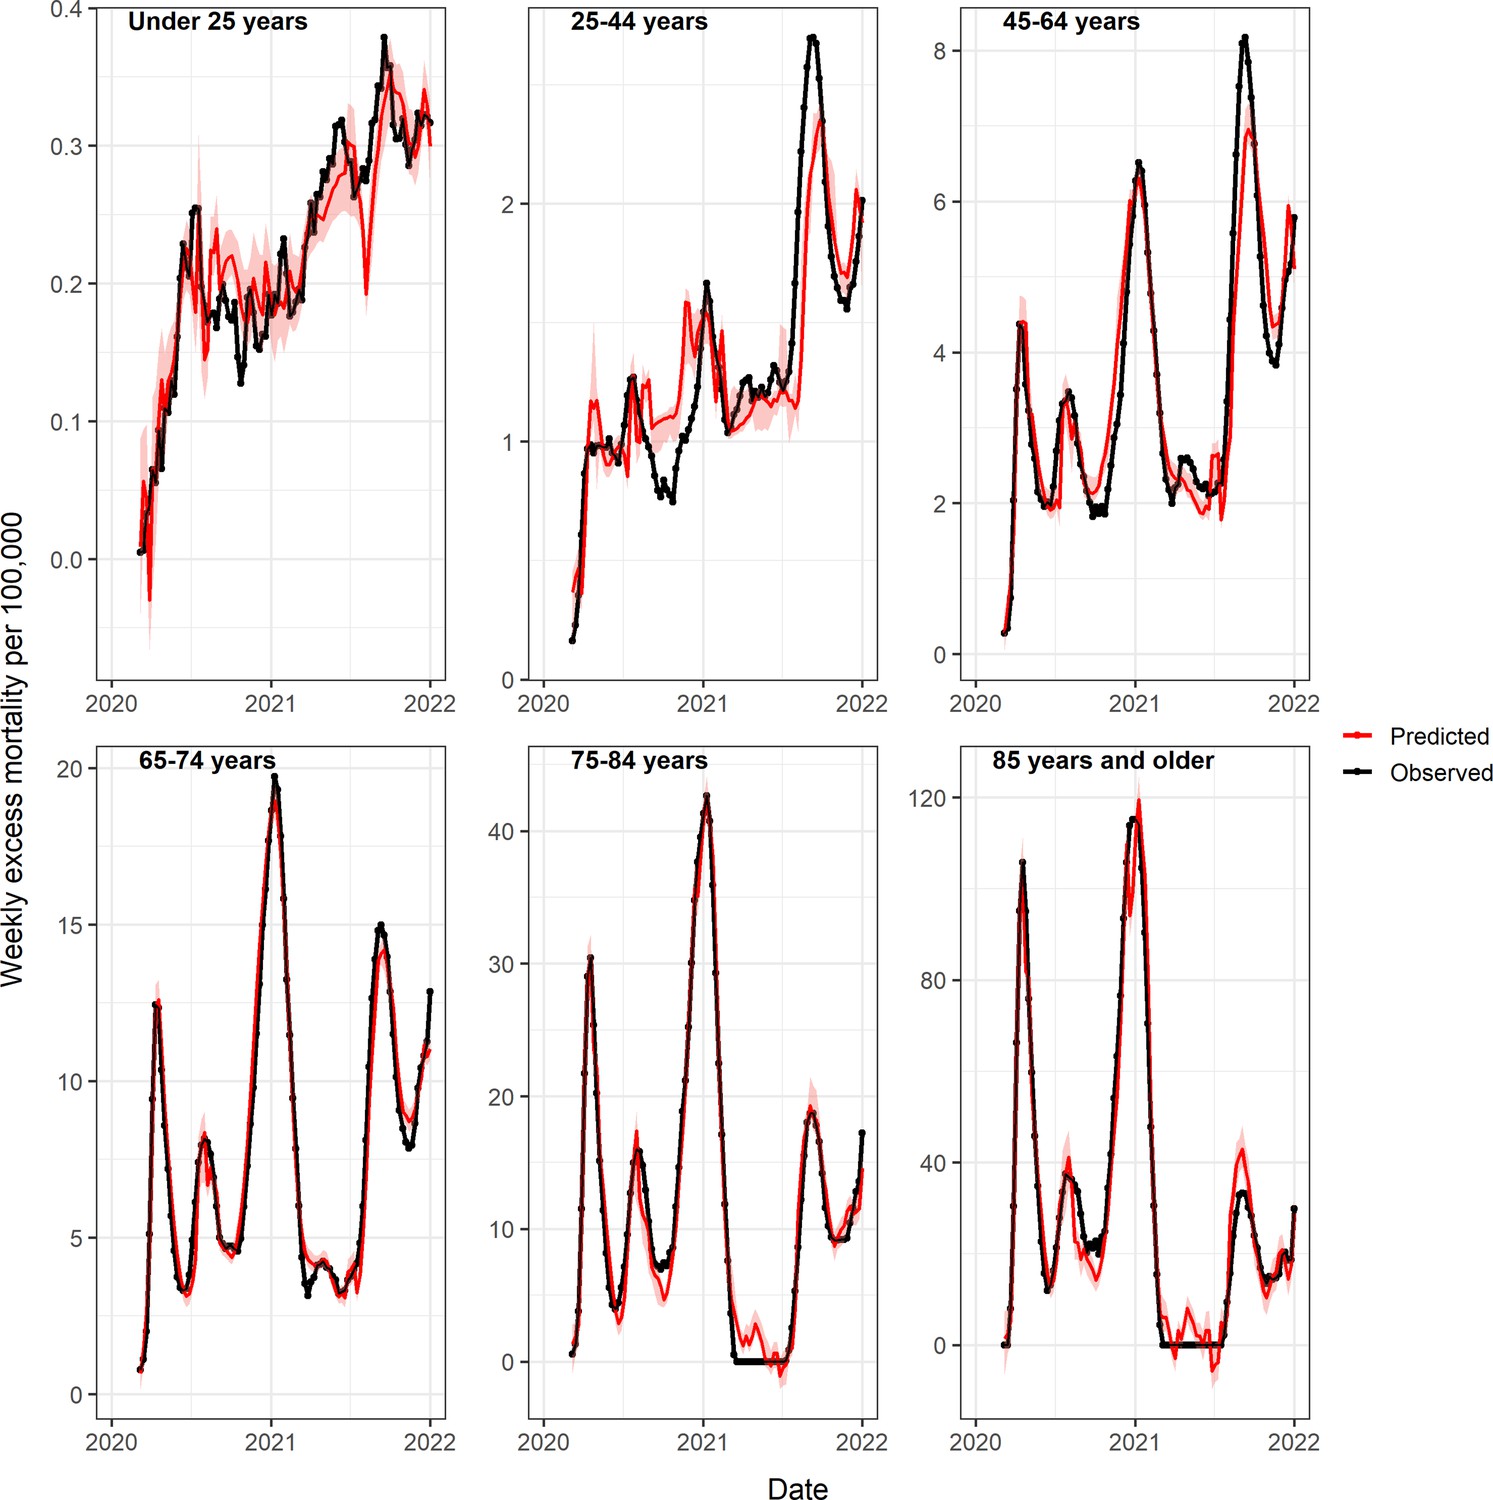
Observed and predicted excess death rates by age group, United States, March 1, 2020 to January 1, 2022, using Generalized Additive Model (GAM) models with weekly COVID-19 intensity, intensive care unit (ICU) occupancy and strength of interventions as covariates.
Observed values are in black and predicted values in red (mean=dark red, 95% CI in lighter red).
Appendix 1—figure 19
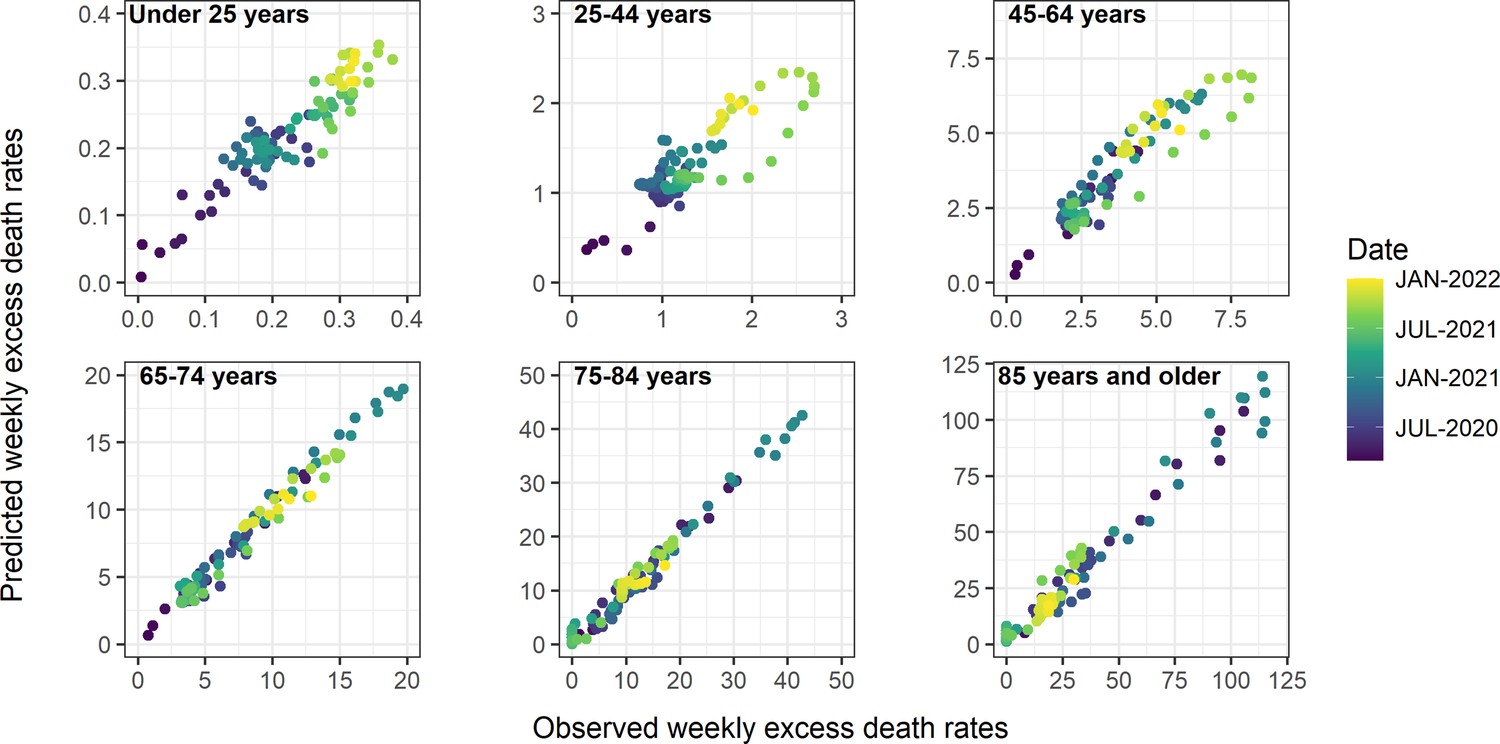
Observed and predicted excess death rates by age group, United States, March 1, 2020 to January 1, 2022, using Generalized Additive Model (GAM) models with weekly COVID-19 intensity, intensive care unit (ICU) occupancy, and interventions as covariates.
Observed values are on the x-axis and predicted on the y-axis, with colors representing different time periods.
Appendix 1—figure 20
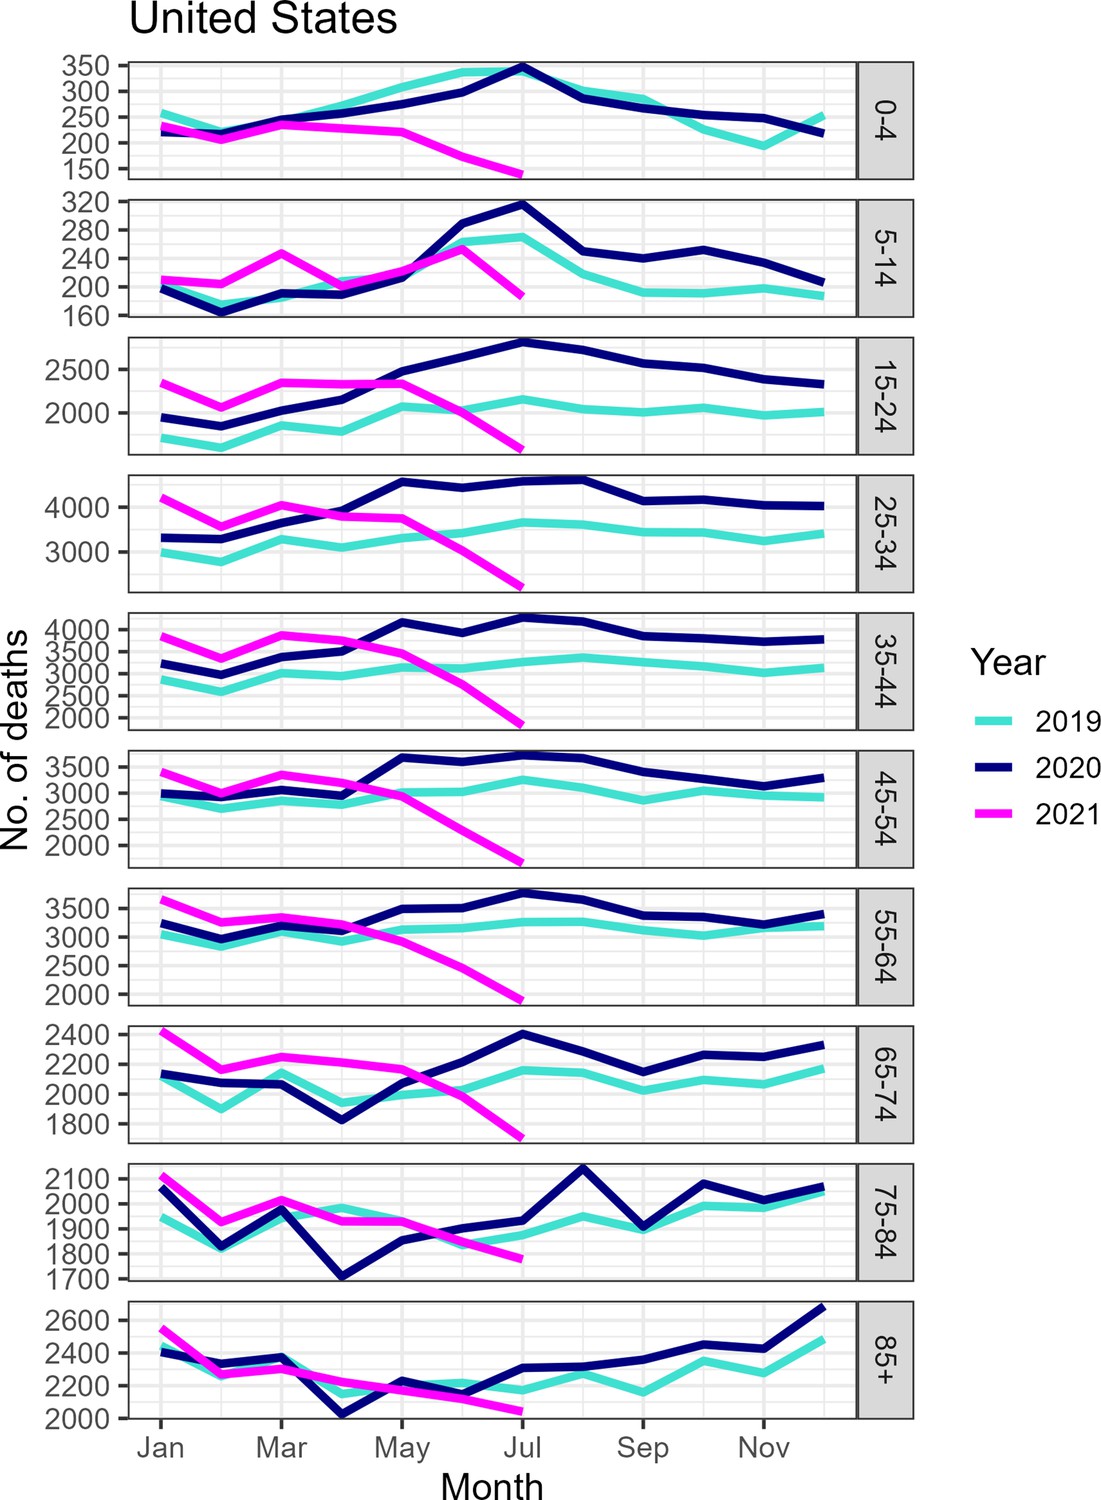
Monthly number of deaths from external causes by age group, United States, January 2019 to July 2021.
Although mortality appears to have decreased substantially by June to July 2021, some of the decrease is likely attributable to reporting delays as the underlying dataset does not appear to have been updated recently.
Tables
Table 1
Reported COVID-19 deaths by US jurisdiction, Compared with Excess Deaths from All-Causes and Respiratory Diseases: March 1, 2020 to January 1, 2022.
| Jurisdiction | Estimated excess all-cause deaths per 100,000, (95% prediction interval) | No. estimated excess all-cause deaths (95% prediction interval) | No. estimated excess respiratory deaths (95% prediction interval) | No. reported COVID-19 deaths* | Ratio of COVID-19 deaths to all-cause excess deaths | Ratio of COVID-19 deaths to respiratory excess deaths |
|---|---|---|---|---|---|---|
| United States | 318 (272–364) | 1,065,200 (909,800–1,218,000) | 757,600 (725,200–788,100) | 848,886 | 0.80 | 1.12 |
| Alabama | 569 (406–727) | 26,900 (19,200–34,400) | 15,000 (13,000–16,800) | 16,425 | 0.61 | 1.09 |
| Arizona | 414 (328–498) | 35,000 (27,700–42,100) | 22,900 (21,000–24,600) | 23,381 | 0.67 | 1.02 |
| Arkansas | 450 (283–612) | 13,800 (8700–18,700) | NA | 9363 | 0.68 | NA |
| California | 286 (234–336) | 120,500 (98,700–141,800) | 75,500 (69,800–80,700) | 81,910 | 0.68 | 1.08 |
| Colorado | 284 (173–393) | 15,000 (9100–20,800) | NA | 11,280 | 0.75 | NA |
| Connecticut | 238 (98–374) | 8700 (3600–13,700) | NA | 9451 | 1.08 | NA |
| Florida | 342 (279–404) | 80,200 (65,400–94,600) | 54,900 (51,400–58,200) | 60,704 | 0.76 | 1.11 |
| Georgia | 366 (287–443) | 39,600 (31,100–48,000) | 25,400 (23,100–27,600) | 27,763 | 0.70 | 1.09 |
| Illinois | 269 (198–339) | 35,600 (26,200–44,800) | 25,300 (22,800–27,600) | 28,509 | 0.80 | 1.13 |
| Indiana | 325 (213–436) | 21,600 (14,100–28,900) | 16,400 (14,100–18,500) | 19,830 | 0.92 | 1.21 |
| Iowa | 195 (26–361) | 5900 (800–10,900) | NA | 8295 | 1.41 | NA |
| Kansas | 241 (75–401) | 7000 (2200–11,600) | NA | 7316 | 1.05 | NA |
| Kentucky | 421 (278–560) | 18,600 (12,300–24,800) | NA | 13,313 | 0.71 | NA |
| Louisiana | 451 (317–581) | 21,300 (15,000–27,400) | NA | 13,984 | 0.66 | NA |
| Maryland | 262 (163–360) | 17,000 (10,600–23,400) | NA | 12,832 | 0.75 | NA |
| Massachusetts | 196 (95–297) | 13,500 (6500–20,300) | NA | 15,799 | 1.17 | NA |
| Michigan | 251 (165–336) | 26,800 (17,600–35,900) | 22,200 (19,600–24,700) | 27,287 | 1.02 | 1.23 |
| Minnesota | 149 (42–253) | 8800 (2500–14,900) | NA | 11,015 | 1.25 | NA |
| Mississippi | 477 (305–645) | 14,500 (9300–19,600) | NA | 11,069 | 0.76 | NA |
| Missouri | 309 (190–426) | 19,200 (11,800–26,400) | 15,400 (13,300–17,200) | 17,005 | 0.89 | 1.11 |
| Nevada | 348 (211–479) | 12,000 (7300–16,500) | NA | 9172 | 0.76 | NA |
| New Jersey | 320 (238–401) | 30,300 (22,500–38,000) | 25,500 (23,600–27,300) | 27,770 | 0.92 | 1.09 |
| New York | 353 (287–416) | 69,000 (56,300–81,500) | 56,700 (48,400–63,600) | 62,339 | 0.90 | 1.10 |
| Ohio | 400 (296–502) | 46,600 (34,500–58,500) | 30,900 (27,800–33,700) | 35,633 | 0.77 | 1.15 |
| Oklahoma | 416 (263–566) | 15,600 (9800–21,100) | NA | 13,098 | 0.84 | NA |
| Oregon | 209 (76–338) | 8900 (3200–14,400) | NA | 5801 | 0.65 | NA |
| Pennsylvania | 347 (259–434) | 44,400 (33,100–55,500) | 34,500 (31,800–37,000) | 38,954 | 0.88 | 1.13 |
| South Carolina | 437 (301–570) | 21,100 (14,500–27,500) | NA | 15,202 | 0.72 | NA |
| Tennessee | 411 (292–526) | 27,800 (19,800–35,700) | 20,200 (18,000–22,200) | 21,580 | 0.78 | 1.07 |
| Texas | 364 (311–417) | 104,300 (89,000–119,400) | 76,000 (72,200–79,500) | 82,328 | 0.79 | 1.08 |
| Virginia | 236 (149–320) | 21,000 (13,300–28,500) | 12,800 (10,700–14,800) | 15,824 | 0.75 | 1.22 |
| Washington | 172 (77–264) | 12,800 (5700–19,600) | NA | 9868 | 0.77 | NA |
| Wisconsin | 219 (−23–43) | 13,100 (−1400–26,600) | NA | 12,362 | 0.94 | NA |
-
*
As reported by National Center for Health Statistics. States are ordered alphabetically. No. of reported COVID –19 deaths (any death with COVID-19 as underlying cause) until December 31, 2021 as available on June 14, 2022, were obtained from the NCHS website (Centers for Disease Control and Prevention, 2022d).
Table 2
Estimation of the direct impacts of COVID-19 on non-respiratory conditions.
| Cause of Death | No. estimated excess deaths (95% prediction interval) | % of excess deaths directly attributable to COVID-19 (95% prediction interval)* |
|---|---|---|
| All-cause | 1,065,200 (909,800–121,8000) | 84% (65, 94) |
| Alzheimer’s | 25,300 (12,600–37,600) | 70% (45, 89) |
| Diabetes | 24,700 (15,900–33,300) | 70% (45, 93) |
| Heart diseases | 51,300 (7,400–94,300) | 73% (32, 94) |
| Cerebrovascular diseases | 16,600 (5,300–27,800) | 26% (−17, 62) |
| External causes | 102,800 (81,400–123,700) | −48% (−64, −23)† |
| Cancer | 4,300 (−18,100–26,500) | N/A‡ |
-
*
Regression estimates of the direct impact of COVID-19 on cause-specific excess mortality, where weekly cause-specific excess mortality is regressed against COVID-19 intensity, strength of interventions, and ICU occupancy, using gam models. Estimates are based on comparison of predictions from the full model with counterfactual predictions where the COVID-19 term is set to zero.
-
†
COVID-19 intensity is significant but negatively associated with excess mortality from external causes, hence the estimated attributable fraction is negative.
-
‡
COVID-19 intensity is not retained in the cancer model.
Table 3
Excess mortality for different subcategories of external deaths during the COVID-19 pandemic period, March 2020 to December 2021.
Estimates are based on a seasonal regression model fitted to monthly data (as shown in Figure 3).
| Underlying cause of death | No of excess deaths (95% prediction intervals) | Ratio of excess deaths to baseline deaths (95% confidence intervals)* |
|---|---|---|
| Accidents (unintentional injuries) | 43,600 (17,200–70,000) | 0.12 (0.05–0.2) |
| Motor vehicle accidents† | 9,600 (1,000–18,200) | 0.13 (0.01–0.24) |
| Drug overdoses | 25,300 (12,000–38,700) | 0.16 (0.07–0.24) |
| Assaults and homicides | 8,000 (3,700–12,200) | 0.2 (0.09–0.31) |
| Suicides | 3,000 (−7,000–13,100) | 0.04 (−0.08–0.16) |
-
*
This should be interpreted as the percent increase over baseline. For instance, mortality from accidents increased by 12% (95% CI, 5–20%) during the period March 2020 to December 2021 (p<0.05), relative to baseline pre-pandemic levels.
-
†
Motor vehicle accidents are a subcategory of accidents.
Table 4
Age specific mortality patterns from March 1, 2020 to January 1, 2021: excess all-cause deaths, official COVID-19 deaths, and direct contribution of COVID-19 to mortality estimated by statistical model.
| Age | No. estimated excess all-cause deaths (95% prediction interval) | Estimated excess all-cause deaths per 100,000 (95% prediction interval) | Official statistics on the no. reported COVID-19 deaths* | Percent of excess deaths coded as COVID-19 in official statistics (%)† | Model estimate of % of excess deaths directly attributed to COVID-19‡ |
|---|---|---|---|---|---|
| Under 25 years | 22,400 (15,400–29,000) | 21.4 (14.7–27.7) | 2853 | 0.13 (0.1–0.19) | −0.45 (−0.63, 0.07) |
| 25–44 years | 112,200 (100,200–123,100) | 125 (112–138) | 34,048 | 0.30 (0.28–0.34) | 0.02 (−0.09, 0.11) |
| 45–64 years | 286,500 (255,100–315,600) | 342 (304–376) | 183,284 | 0.64 (0.58–0.72) | 0.43 (0.35, 0.49) |
| 65–74 years | 254,900 (222,600–285,400) | 771 (673–863) | 194,436 | 0.76 (0.68–0.87) | 0.67 (0.59, 0.76) |
| 75–84 years | 189,200 (149,400–228,400) | 1137 (898–1373) | 217,479 | 1.15 (0.95–1.46) | 1.02 (0.88, 1.32) |
| 85 years and over | 182,200 (120,400–242,500) | 2708 (1789–3605) | 218,464 | 1.20 (0.9–1.82) | 1.20 (1.02, 1.41) |
-
*
Death certificates have multiple causes of death listed; here COVID-19 can be listed anywhere on the death certificate. These are deaths reported between March 1, 2020 to January 1, 2022, as available on June 14, 2022.
-
†
Estimated as the proportion of excess all-cause deaths captured by official COVID-19 statistics (column 4 divided by column 2).
-
‡
Proportion of all-cause excess mortality that is attributable to SARS-CoV-2 infection (direct pandemic impact) based on GAM models, where all-cause excess mortality is regressed against COVID-19 intensity, strength of interventions, and ICU occupancy each week. Estimates are based on comparison of predictions from the full model with counterfactual predictions where the COVID-19 term is set to zero.
Additional files
Download links
A two-part list of links to download the article, or parts of the article, in various formats.
Downloads (link to download the article as PDF)
Open citations (links to open the citations from this article in various online reference manager services)
Cite this article (links to download the citations from this article in formats compatible with various reference manager tools)
Direct and indirect mortality impacts of the COVID-19 pandemic in the United States, March 1, 2020 to January 1, 2022
eLife 12:e77562.
https://doi.org/10.7554/eLife.77562


