Rapid transgenerational adaptation in response to intercropping reduces competition
- Institute of Agricultural Sciences, ETH Zurich, Switzerland
- Plant Production Systems, Agroscope, Switzerland
- Área de Biodiversidad y Conservación, Universidad Rey Juan Carlos, Spain
Figures
Figure 1 with 1 supplement
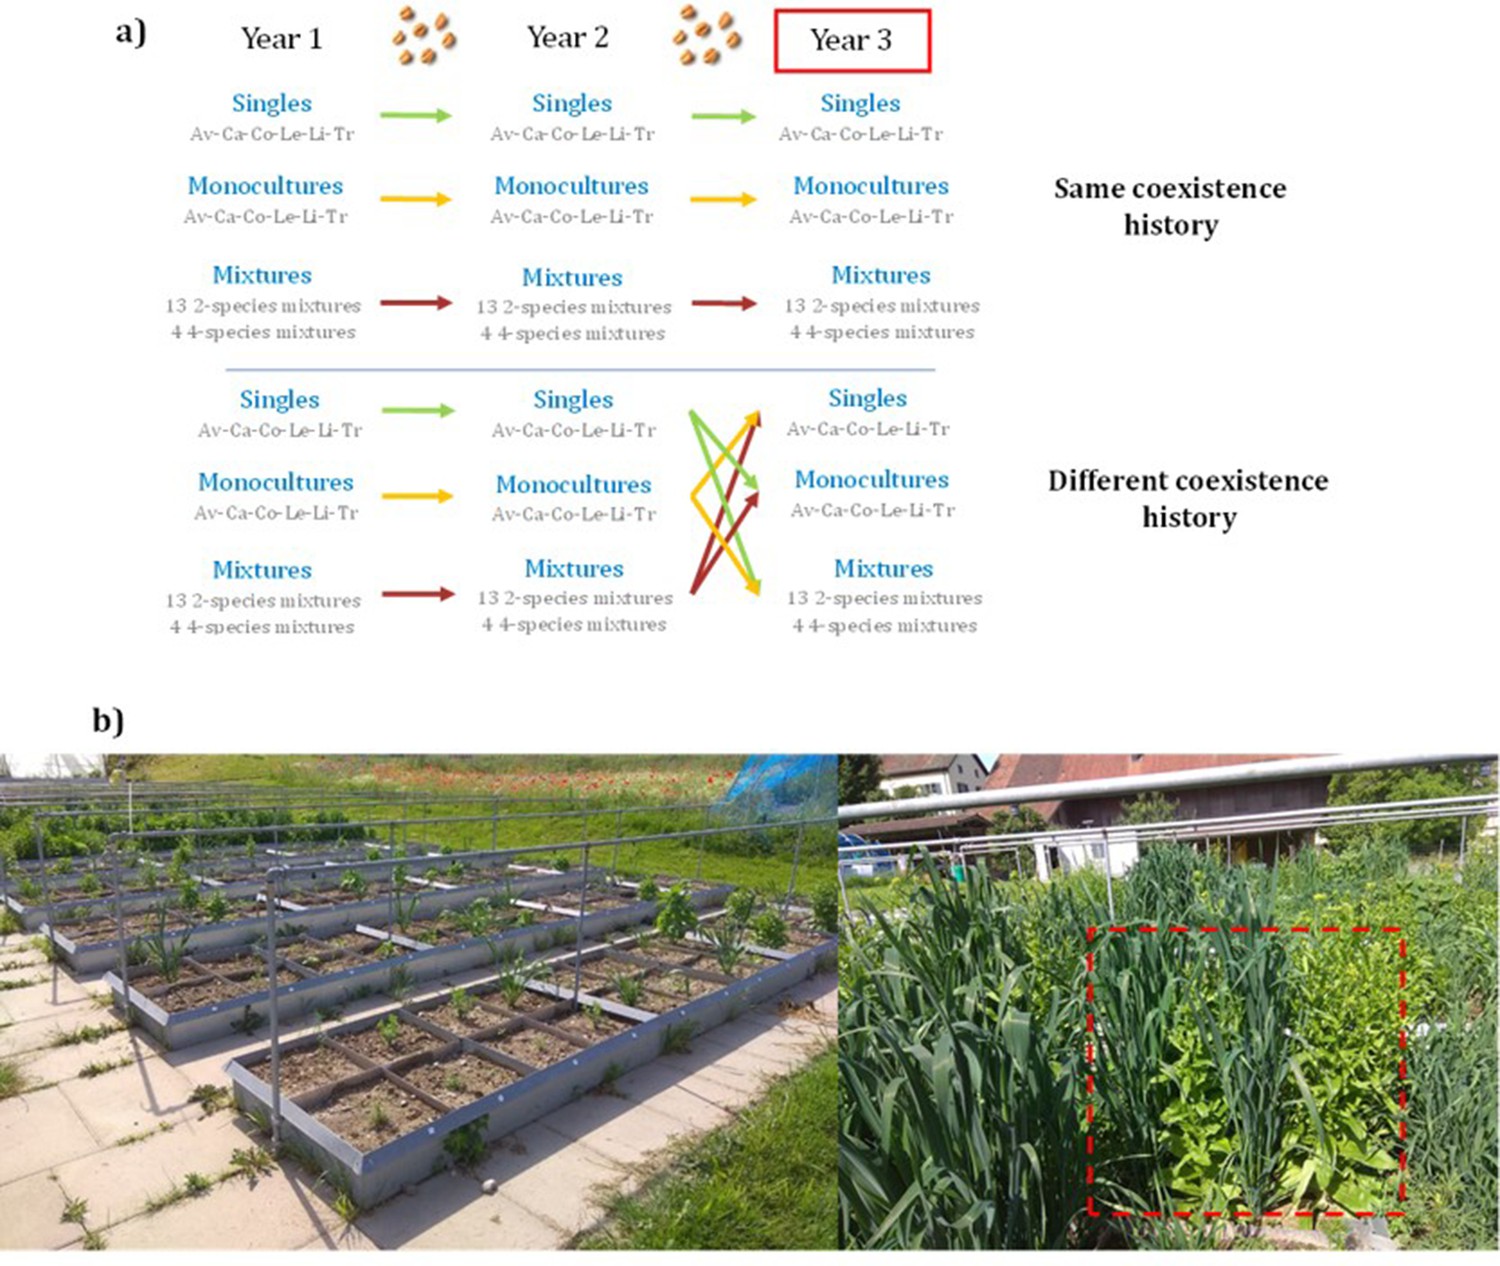
Experimental design.
(a) Six crop species were used to sow single plant individuals (Loreau and Hector, 2001), monocultures (Loreau and Hector, 2001), 2-species mixtures (Schöb et al., 2018) and 4-species mixtures (Brooker et al., 2015) in 2018 (Year 1) (see Supplementary file 1s for the list of species mixtures); seeds were collected at the end of the growing season and resown in 2019 (Year 2) in the same diversity setting as their previous generation. Seeds were collected again and resown in 2020 (Year 3), this time either in the same community their seeds were collected from [same coexistence history], or in a community different to the one of their parents [different coexistence history] (n=468 plots). This process was replicated in two different fertilizing conditions. We expected that crops growing in the same community as their parents would have adapted over the two generations, and therefore would exhibit less competition and have higher productivity than crops growing in a community different to the one of their parents. Av: Avena sativa; Ca: Camelina sativa; Co: Coriandrum sativum; Le: Lens culinaris; Li: Linum usitatissimum; Tri: Triticum aestivum (b) Left: part of the experimental garden, showing the plots within beds, and planted with single individuals. Right: a plot is outlined in red, showing a 2-species mixture, with oat alternated with camelina.
Figure 1—figure supplement 1
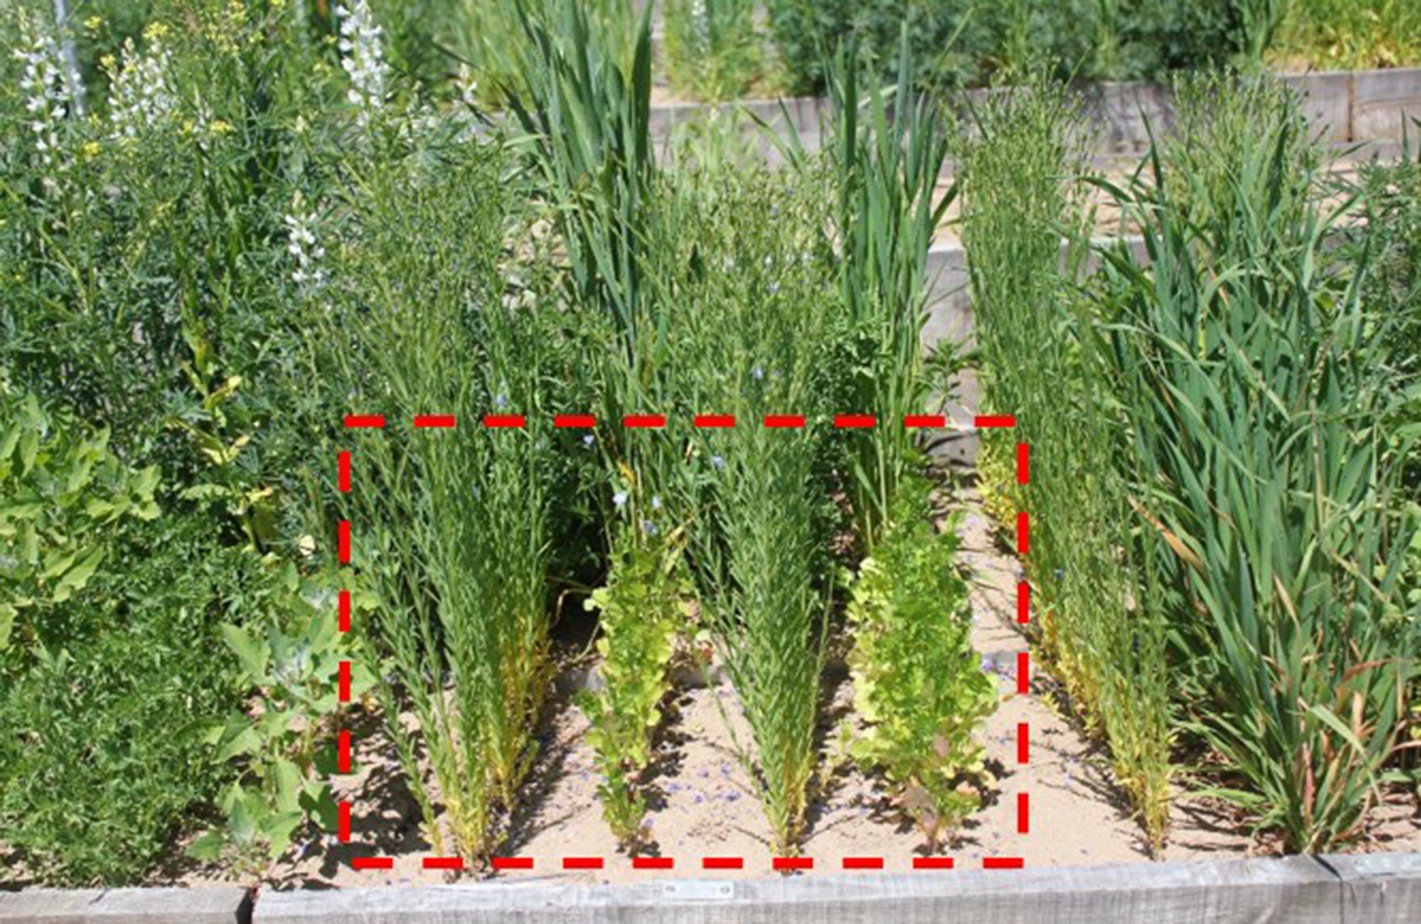
Pictures of the experimental plots.
Bottom-left: a plot is outlined in red, showing a 2-species mixtures, with flax alternated with coriander.
Figure 2 with 1 supplement
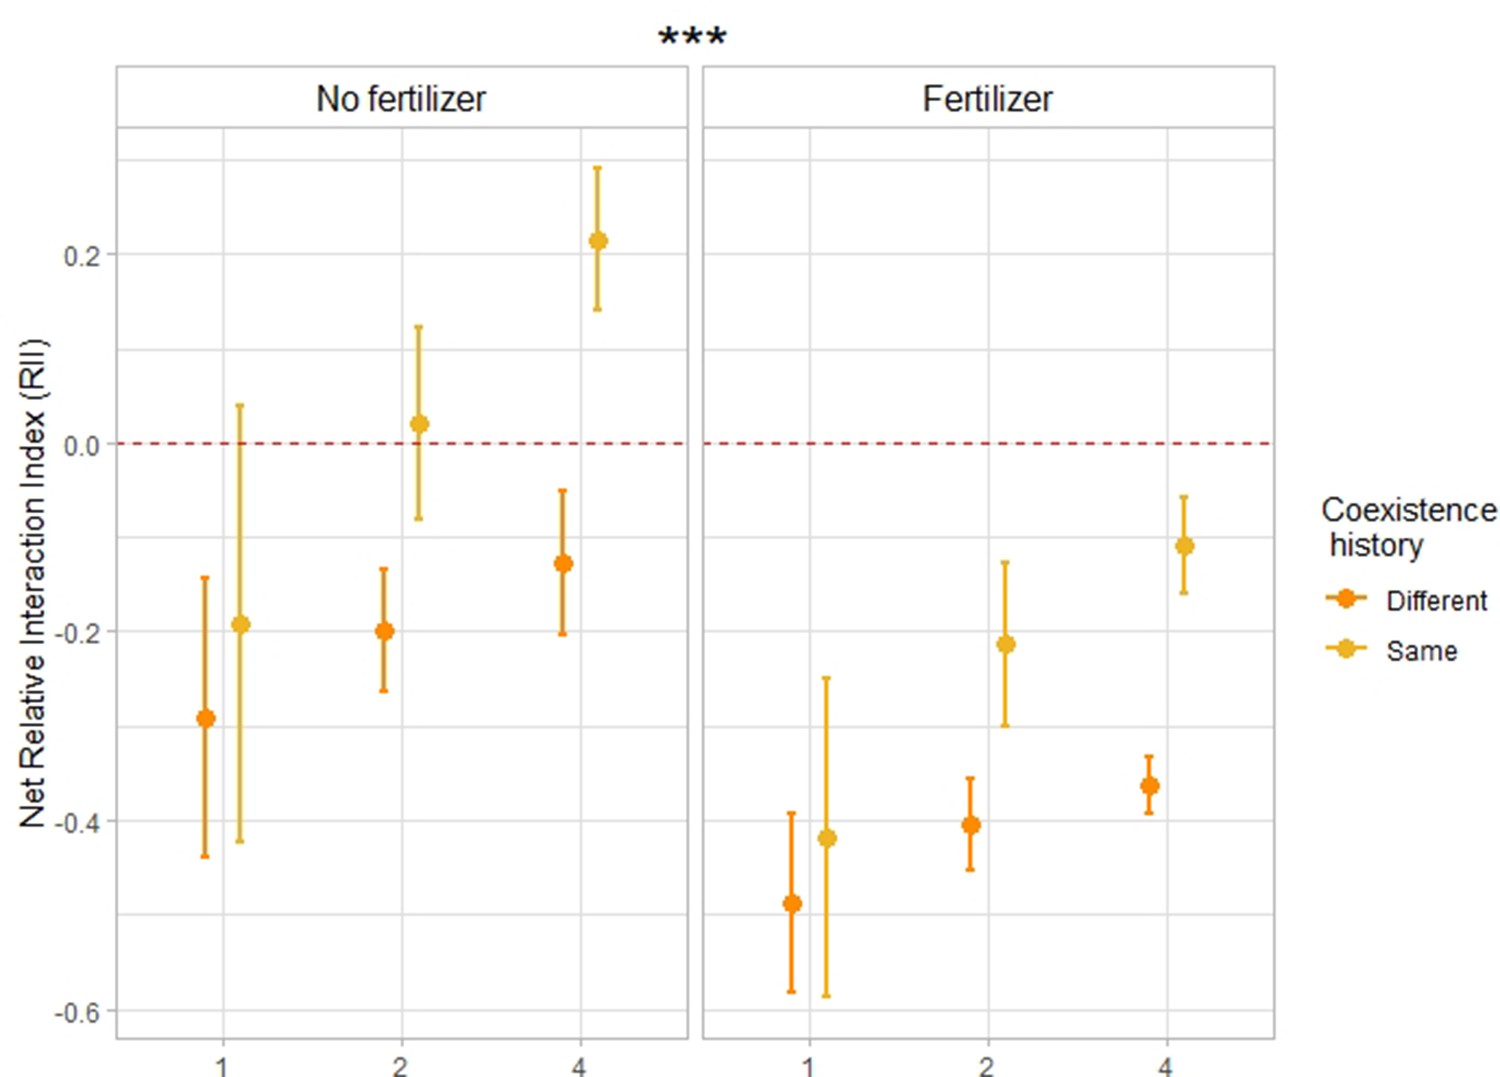
Relative Interaction Index in response to coexistence history and fertilization.
Net relative interaction index of monocultures, 2- and 4-species mixtures in response to coexistence history, for fertilized and unfertilized conditions. n=276. Dots represent the mean values across plots; lines represent the standard error. Stars placed above or next to the results represent the significance of the coexistence history effect. The net Relative Interaction Index (RII) compares the performance of plants growing in communities to the performance of single plants growing alone, with the same coexistence history treatment as the focal plant (see Methods). Negative RII indicates competition within a community, positive RII indicates facilitation. The closer this index gets to 1, respectively –1, the stronger the facilitation, respectively competition. ‘Same coexistence history’ indicates that crops were grown in the same community type as their parents (i.e. monocultures with seeds coming from monocultures, 2-species mixtures with seeds coming from the same 2-species mixtures [e.g. oat-lentil with seeds coming from oat-lentil], 4-species mixtures with seeds coming from the same 4-species mixtures [e.g. oat-lentil-coriander-flax with seeds coming from oat-lentil-coriander-flax]). “Different coexistence history” refers to crops grown in a community type different to the one of their parents (i.e. monocultures with seeds coming from singles, monocultures with seeds coming from mixtures, mixtures with seeds coming from singles, mixtures with seeds coming from monocultures). See Supplementary file 1a for the complete statistical analysis, and Figure 2—figure supplement 1 for the corresponding boxplots.
Figure 2—figure supplement 1
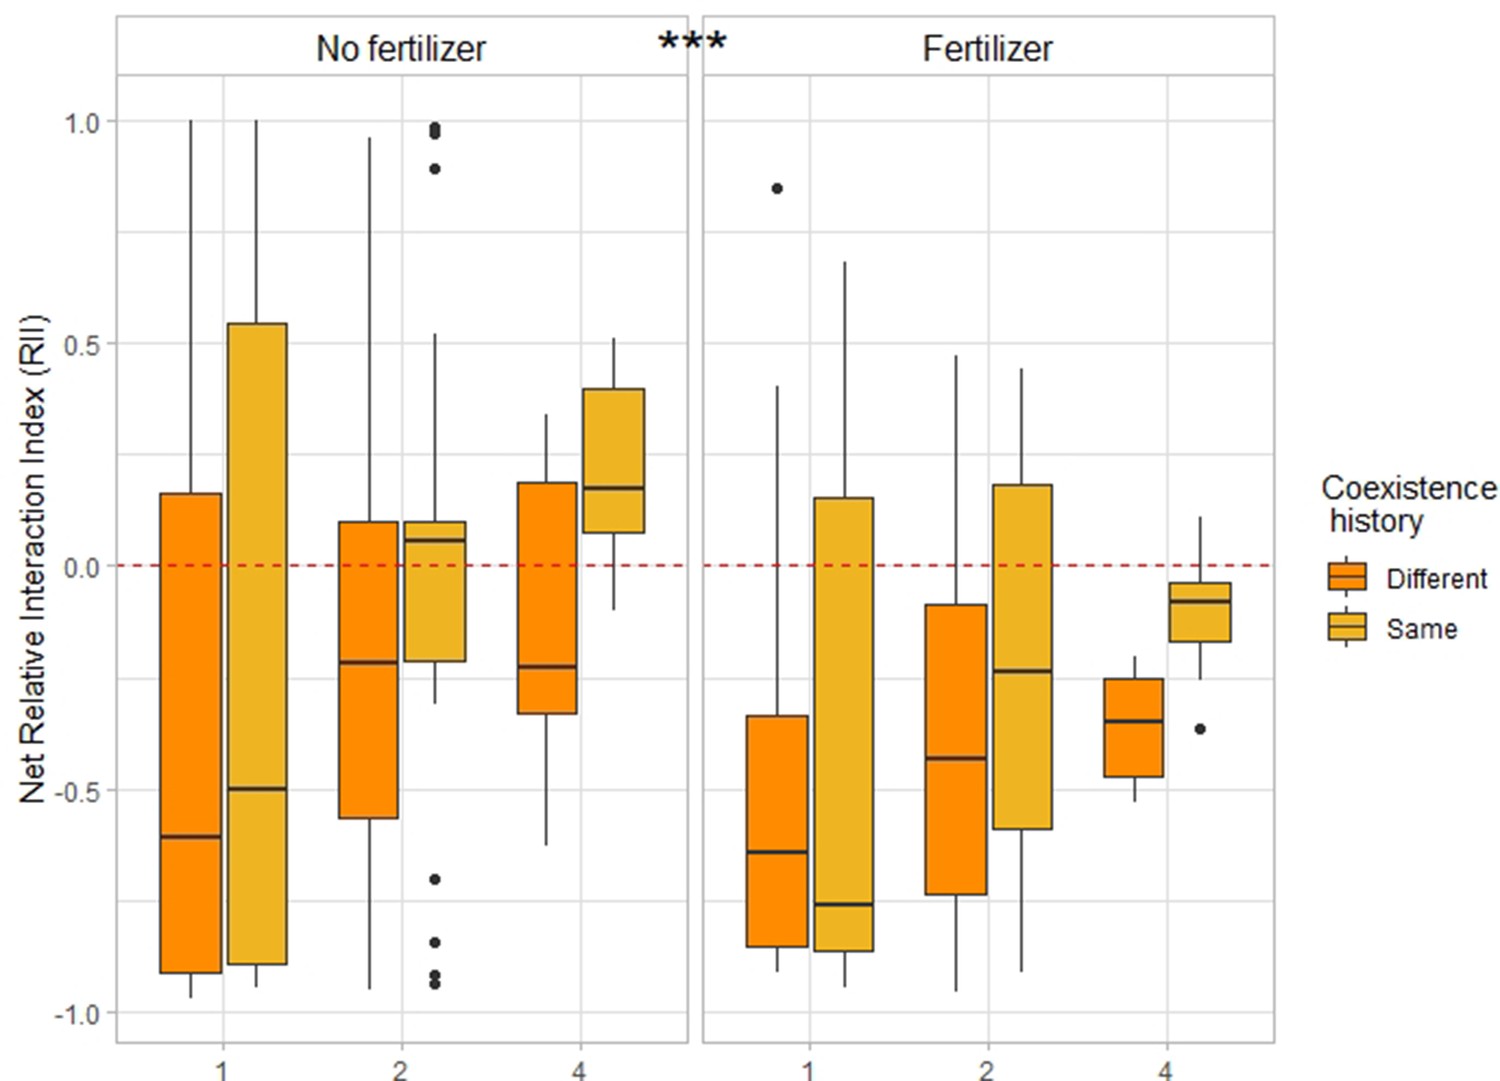
Effects of coexistence history and crop species number on net Relative Interaction Index (RII), for fertilized and unfertilized conditions.
“Same coexistence history” indicates that crops were grown in the community their seeds were collected from. ‘Different coexistence history’ refers to crops grown in a community different to the one of their parents. See methods for the index calculation. Horizontal lines represent the median of the data, boxes represent the lower and upper quartiles (25% and 75%), with vertical lines extending from the hinge of the box to the smallest and largest values, no further than 1.5 * the interquartile range. Data beyond the end of the whiskers are outlying and plotted individually. n=276.
Figure 3 with 4 supplements

Effects of coexistence history on net biodiversity effects (a) and total yield per plot (b).
Effects of coexistence history and crop species number on (a) net biodiversity effect – reflecting the yield advantage of mixtures compared to monocultures – and (b) total yield per plot in fertilized and unfertilized plots. (a) n=204; (b) n=276. Dots represent the mean values across plots; lines represent the standard error. Stars or dots placed above or next to the legend represent the significance of the coexistence history effect. ‘Same coexistence history’ indicates that crops were grown in the community their seeds were collected from. ‘Different coexistence history’ refers to crops grown in a community different to the one of their parents. See SI Supplementary file 1c-f for the complete statistical analysis, Figure 3—figure supplement 1 for complementarity and selection effects, and Figure 3—figure supplements 2 and 3 for the corresponding boxplots.
Figure 3—figure supplement 1
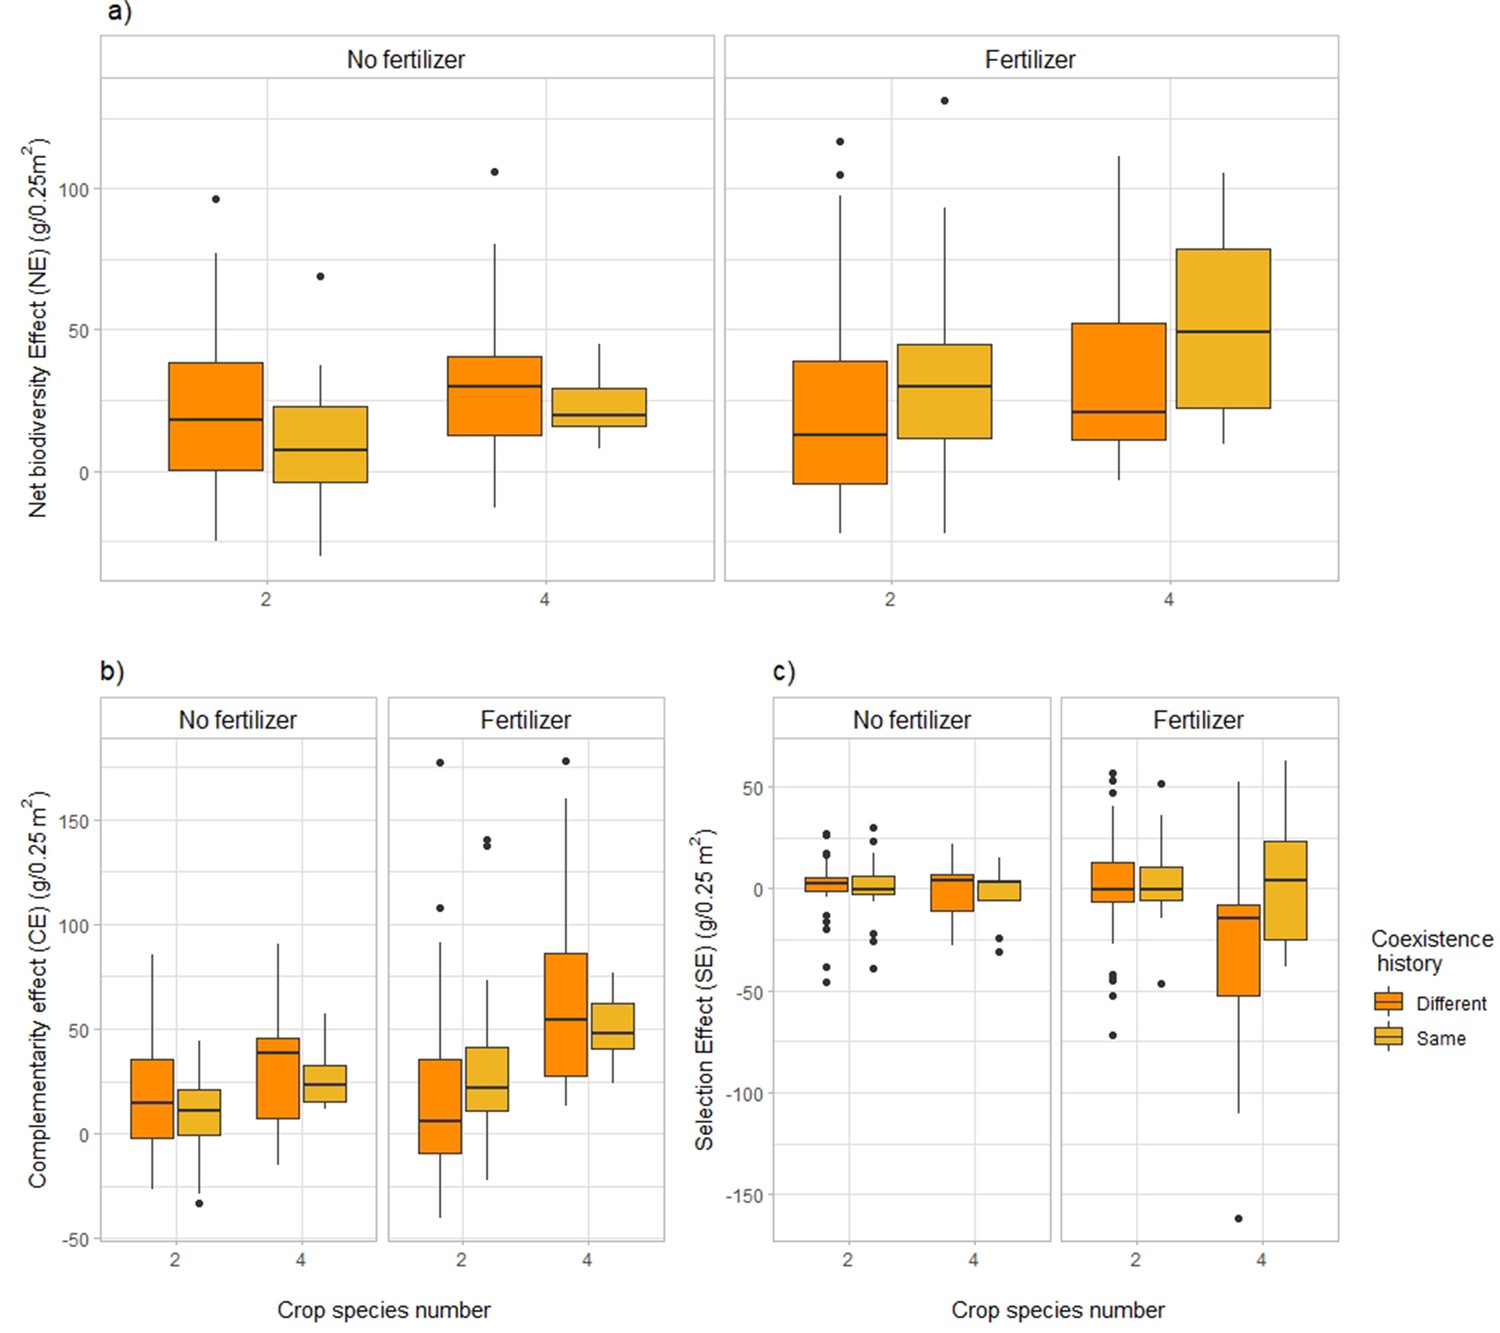
Effects of coexistence history and crop species number on net biodiversity effect.
(a), complementarity effect (b) and selection effect (c) in fertilized and unfertilized plots. Horizontal lines represent the median of the data, boxes represent the lower and upper quartiles (25% and 75%), with vertical lines extending from the hinge of the box to the smallest and largest values, no further than 1.5 * the interquartile range. Data beyond the end of the whiskers are outlying and plotted individually. n=204.
Figure 3—figure supplement 2

Effects of coexistence history and crop species number on complementarity effect (a) and selection effect (b) in fertilized and unfertilized plots.
Dots represent the mean values across plots; lines represent the standard error.
Figure 3—figure supplement 3
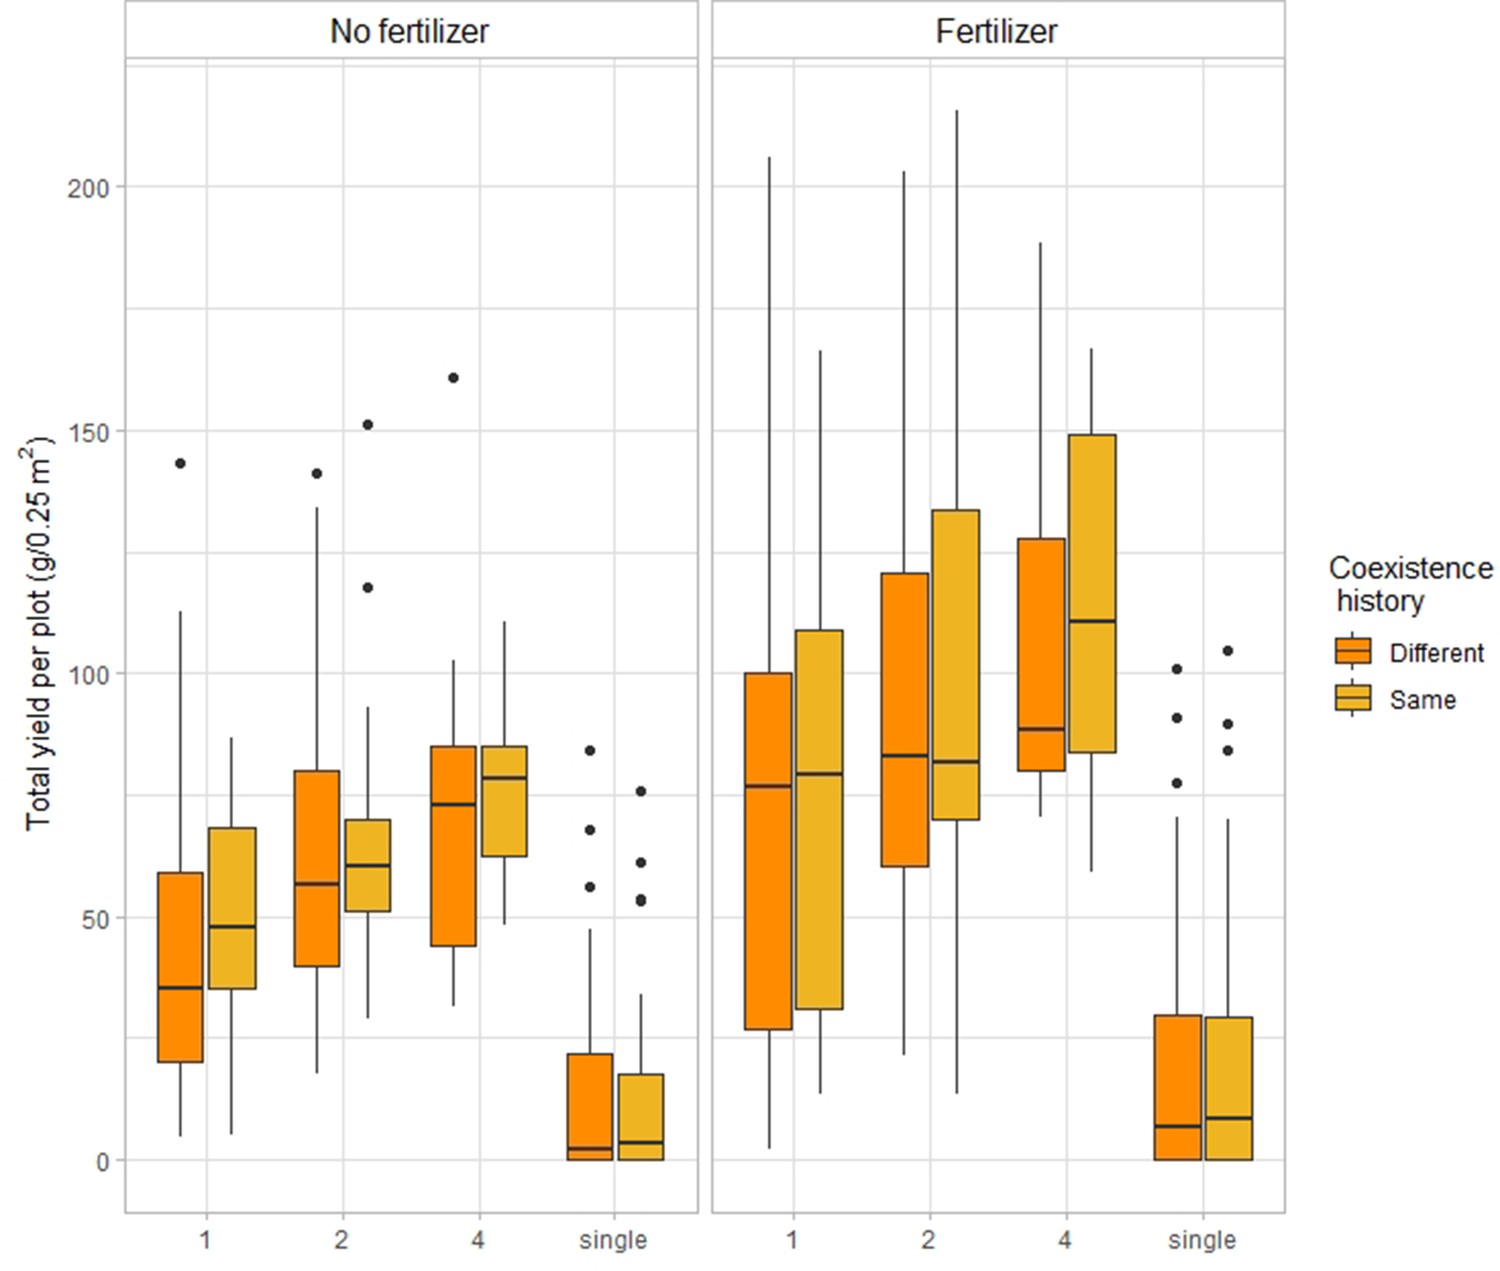
Effects of coexistence history and crop species number on total yield per plot.
Horizontal lines represent the median of the data, boxes represent the lower and upper quartiles (25% and 75%), with vertical lines extending from the hinge of the box to the smallest and largest values, no further than 1.5 * the interquartile range. Data beyond the end of the whiskers are outlying and plotted individually. n=276.
Figure 3—figure supplement 4
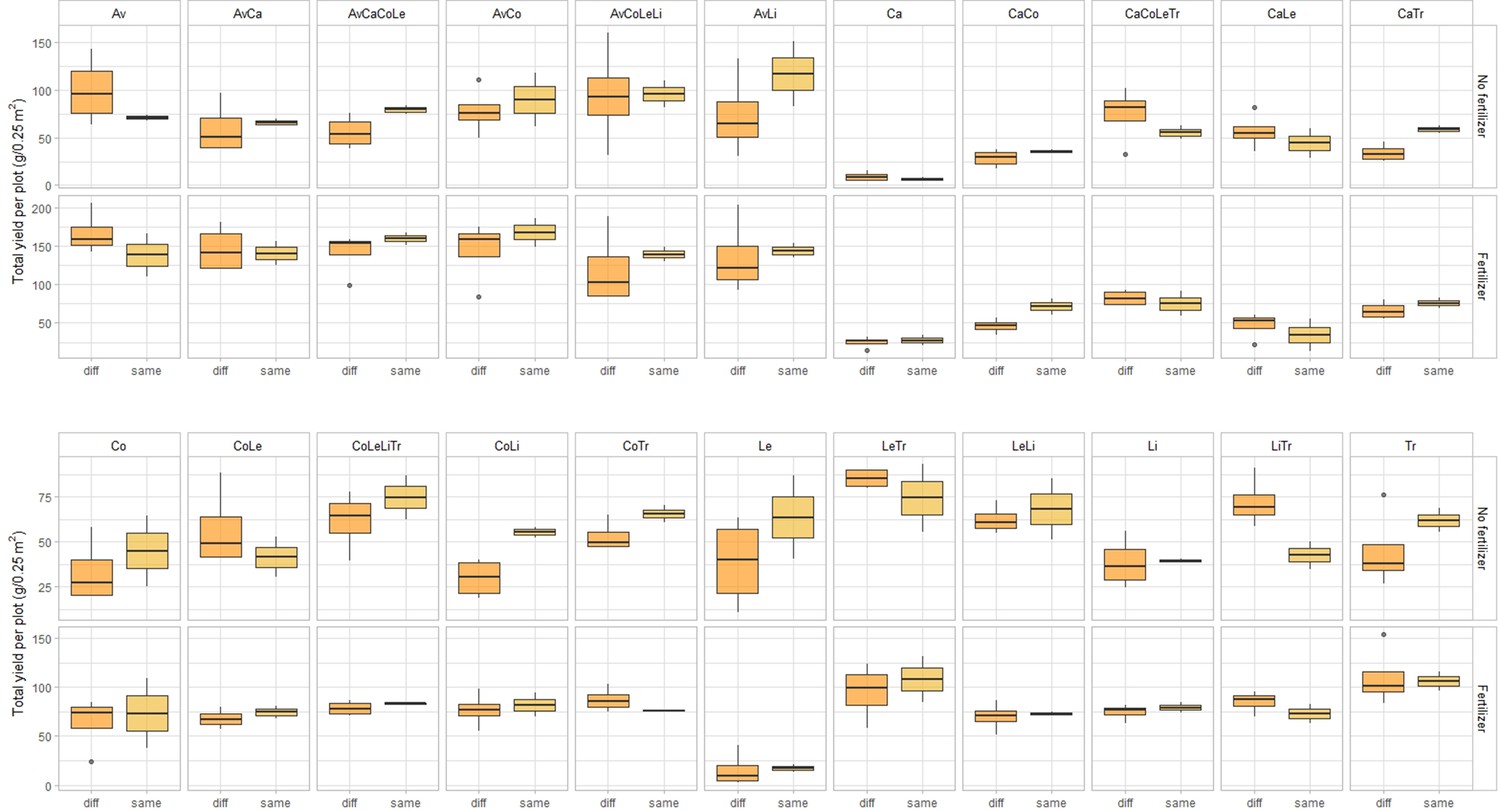
Effects of coexistence history of total yield per plot, per species combination.
‘Same coexistence history’ indicates that crops were grown in the community their seeds were collected from. ‘Different coexistence history’ refers to crops grown in a community different to the one of their parents. Av: Avena monoculture. Ca: Camelina monoculture. Co: Coriander monoculture. Le: Lentil monoculture. Li: Linum monoculture. Tr: Triticum monoculture. AvCa: Avena-Camelina. AvCaCoLe: Avena-Camelina-Coriander-Lentil. AvCo: Avena-Coriander. AvCoLeLi: Avena-Coriander-Lentil-Linum. AvLe: Avena-Lentil. AvLi: Avena-Linum. CaCo: Camelina-Coriander. CaCoLeTr: Camelina-Coriander-Lentil-Triticum. CaLe: Camelina-Lentil. CaTr: Camelina-Triticum. CoLe:Coriander-Lentil. CoLeLiTr: Coriander-Lentil-Linum-Triticum. CoLi: Coriander-Linum. CoTr: Coriander-Triticum. LeTr: Lentil-Triticum. LeLi: Lentil-LinumLiTr: Linum-Triticum.
Figure 4 with 2 supplements

Community-level trait responses to coexistence history.
Effects of coexistence history and crop species number on community-weighted mean (CWM) of height (in cm) (a), Leaf Dry Matter Content (LDMC) (b), and mass per seed (in g) (c), and on coefficient of variation at the community level of height (d), LDMC (e), and mass per seed (f). n=271. Dots represent the mean values across plots; lines represent the standard error. Stars placed above represent the significance of the coexistence history effect. See Supplementary file 1l-p for the complete statistical analyses, and Fig. S6-7 as well as Supplementary file 1g-k for responses at the species level.
Figure 4—figure supplement 1
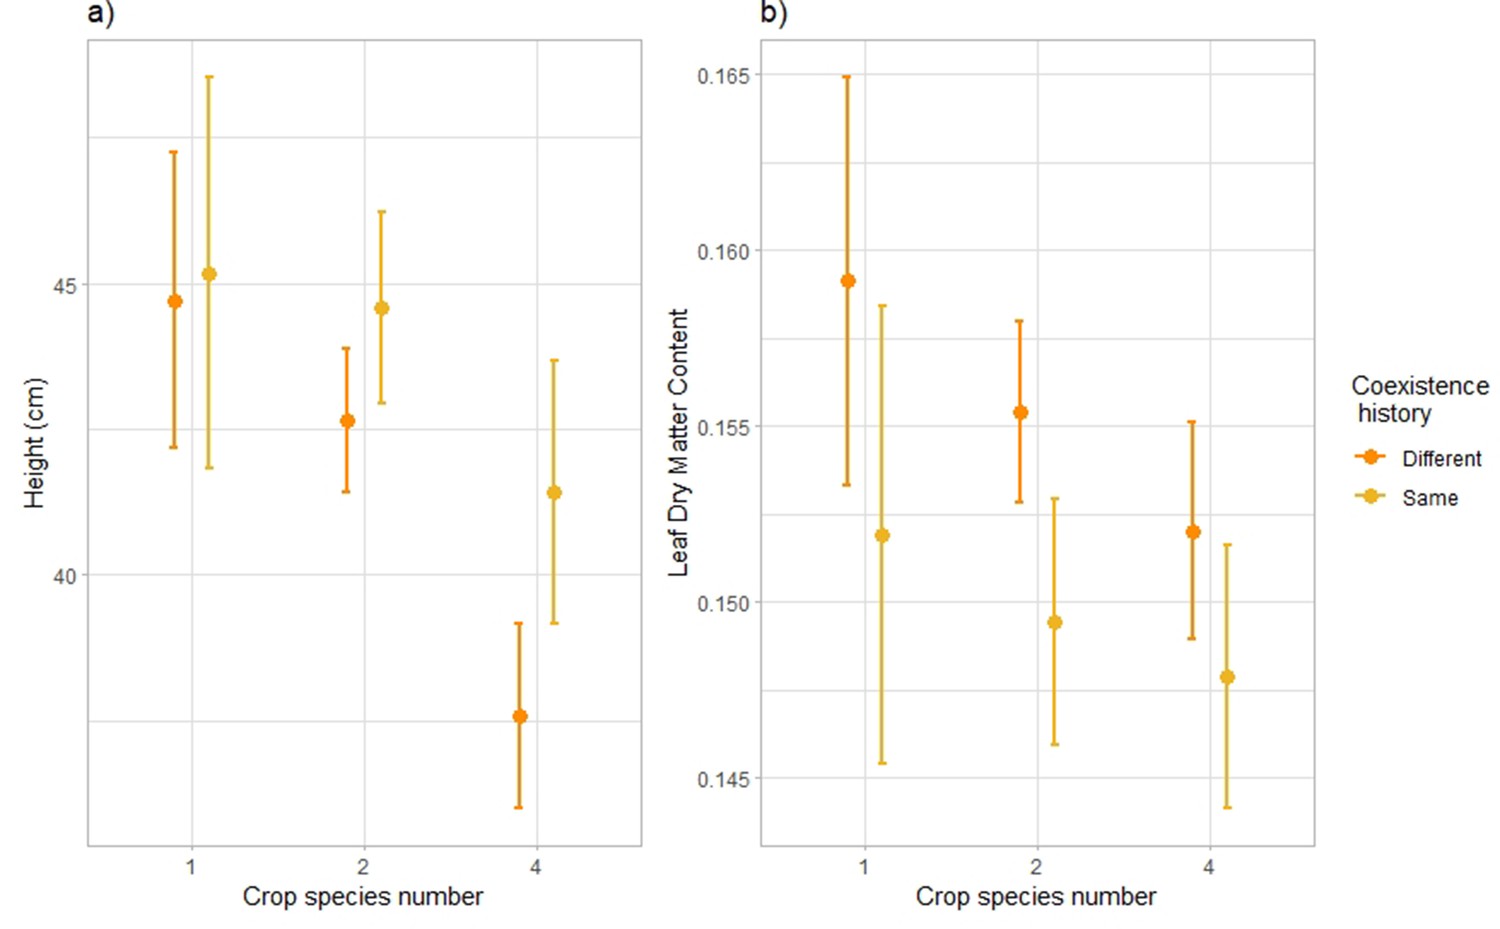
Effects of coexistence history and crop species number on mean height (in cm) (a) and LDMC (b) Dots represent the averaged values across species and plots; lines represent the standard error.
n=1726.
Figure 4—figure supplement 2

Mean height (cm) (a) and LDMC (b) according to their coexistence history, for the six species considered in our study.
Dots represent the averaged values across species and plots; lines represent the standard error. n=1726.
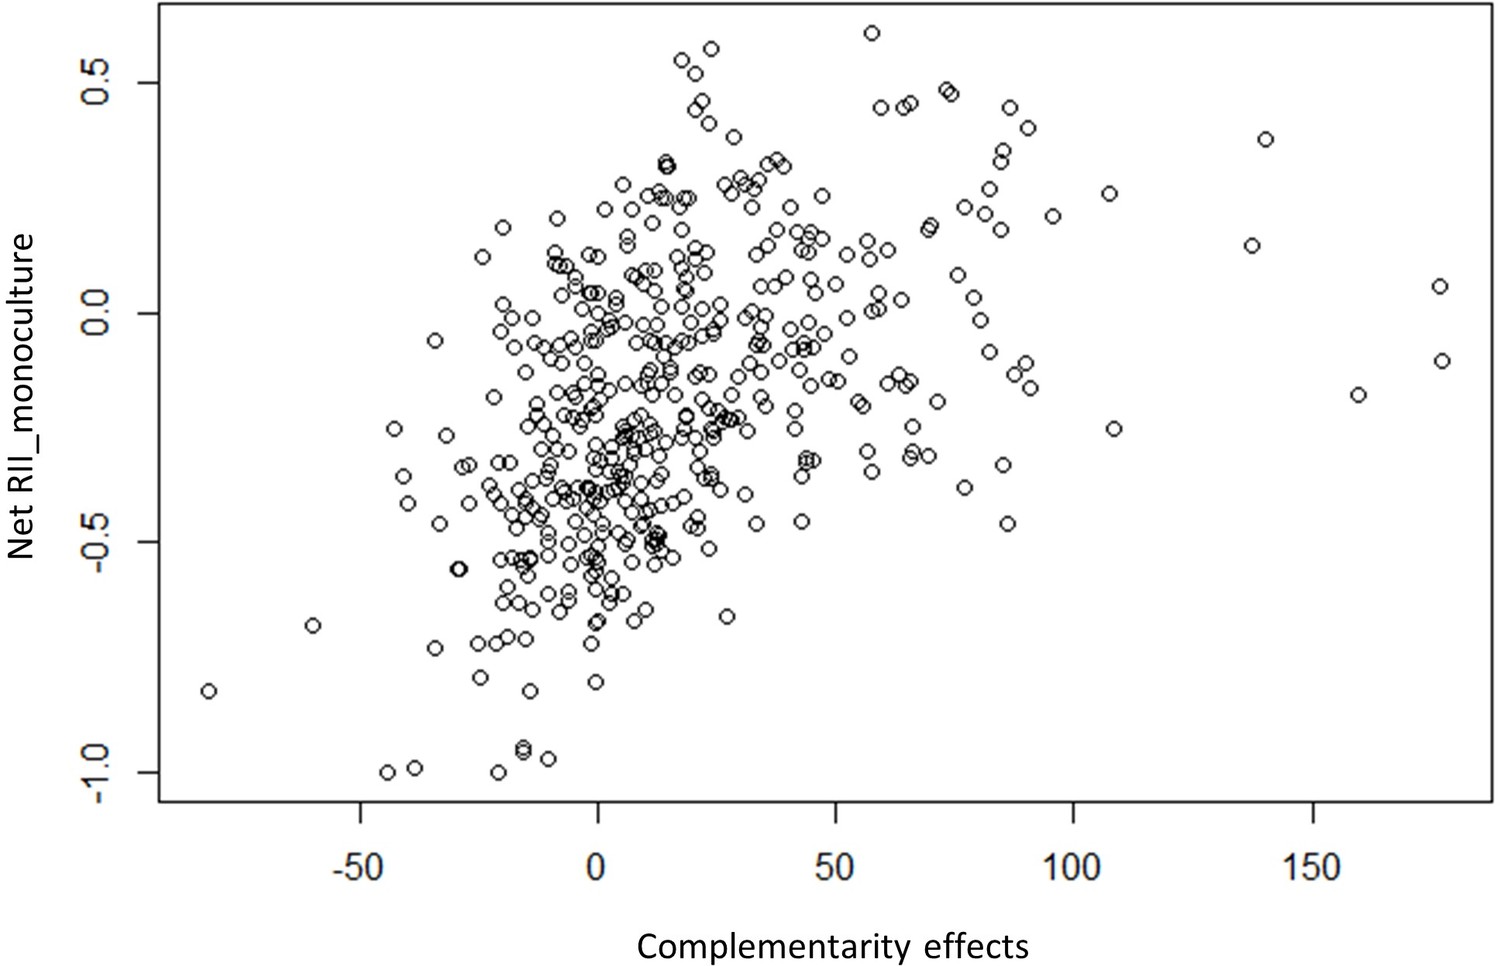
Figure 5 with 2 supplements
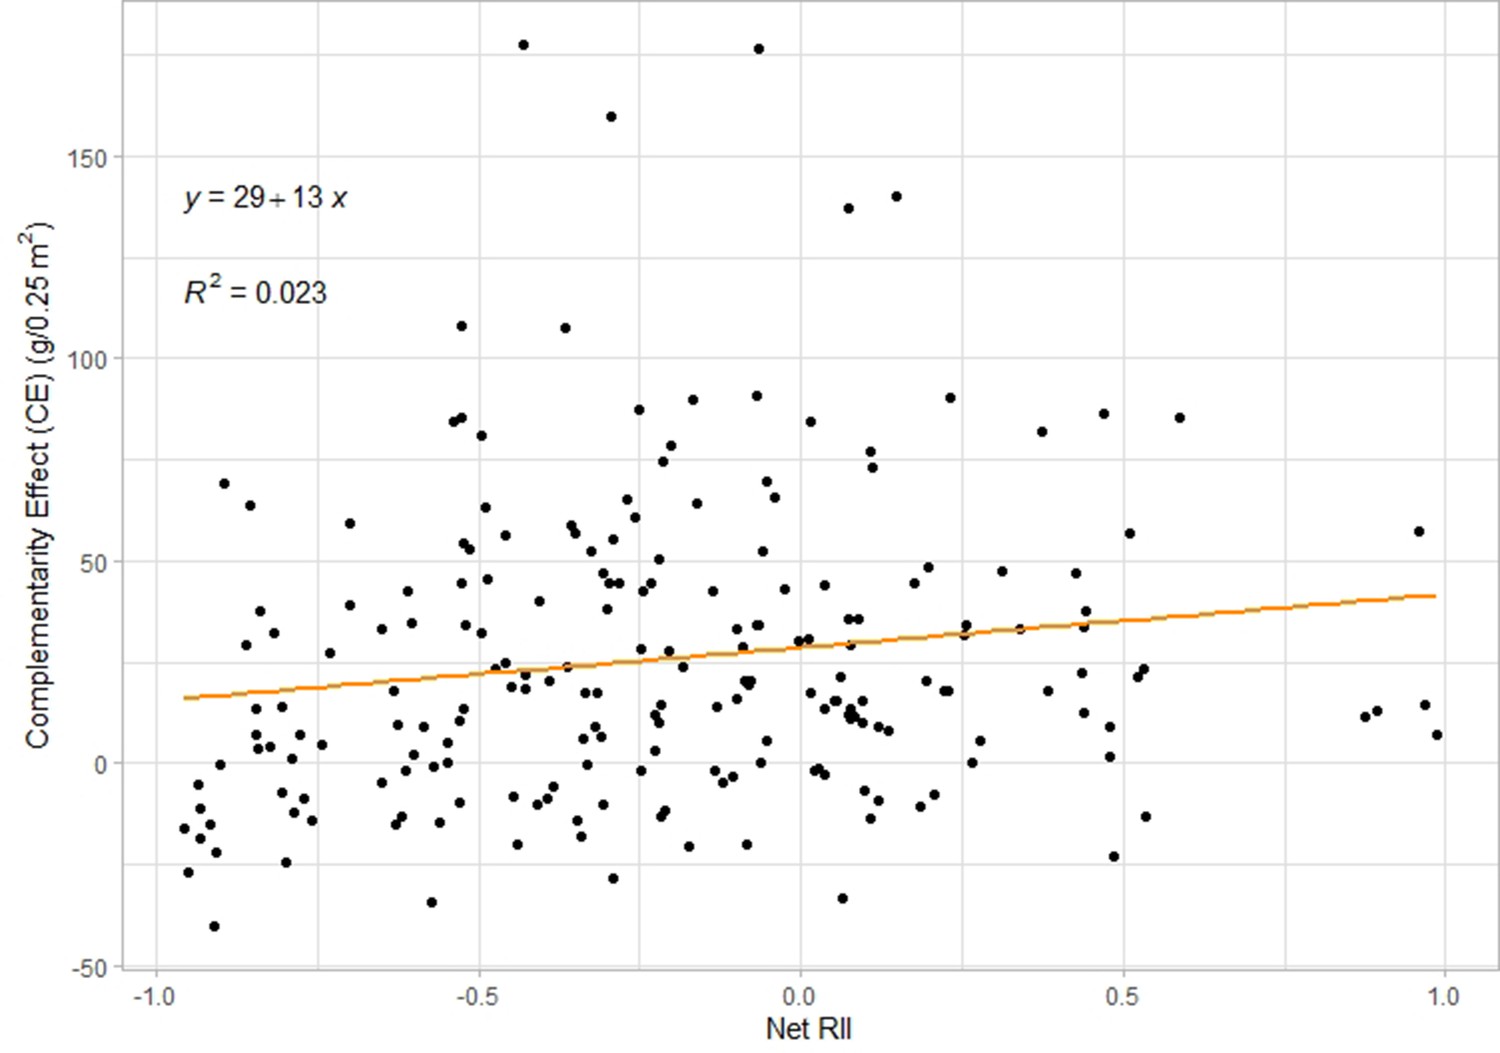
Correlation plot between Net RII index and complementarity effect across all plots.
There is a significant positive correlation (F=4.62, p-value = 0.033, n=204).
Figure 5—figure supplement 1
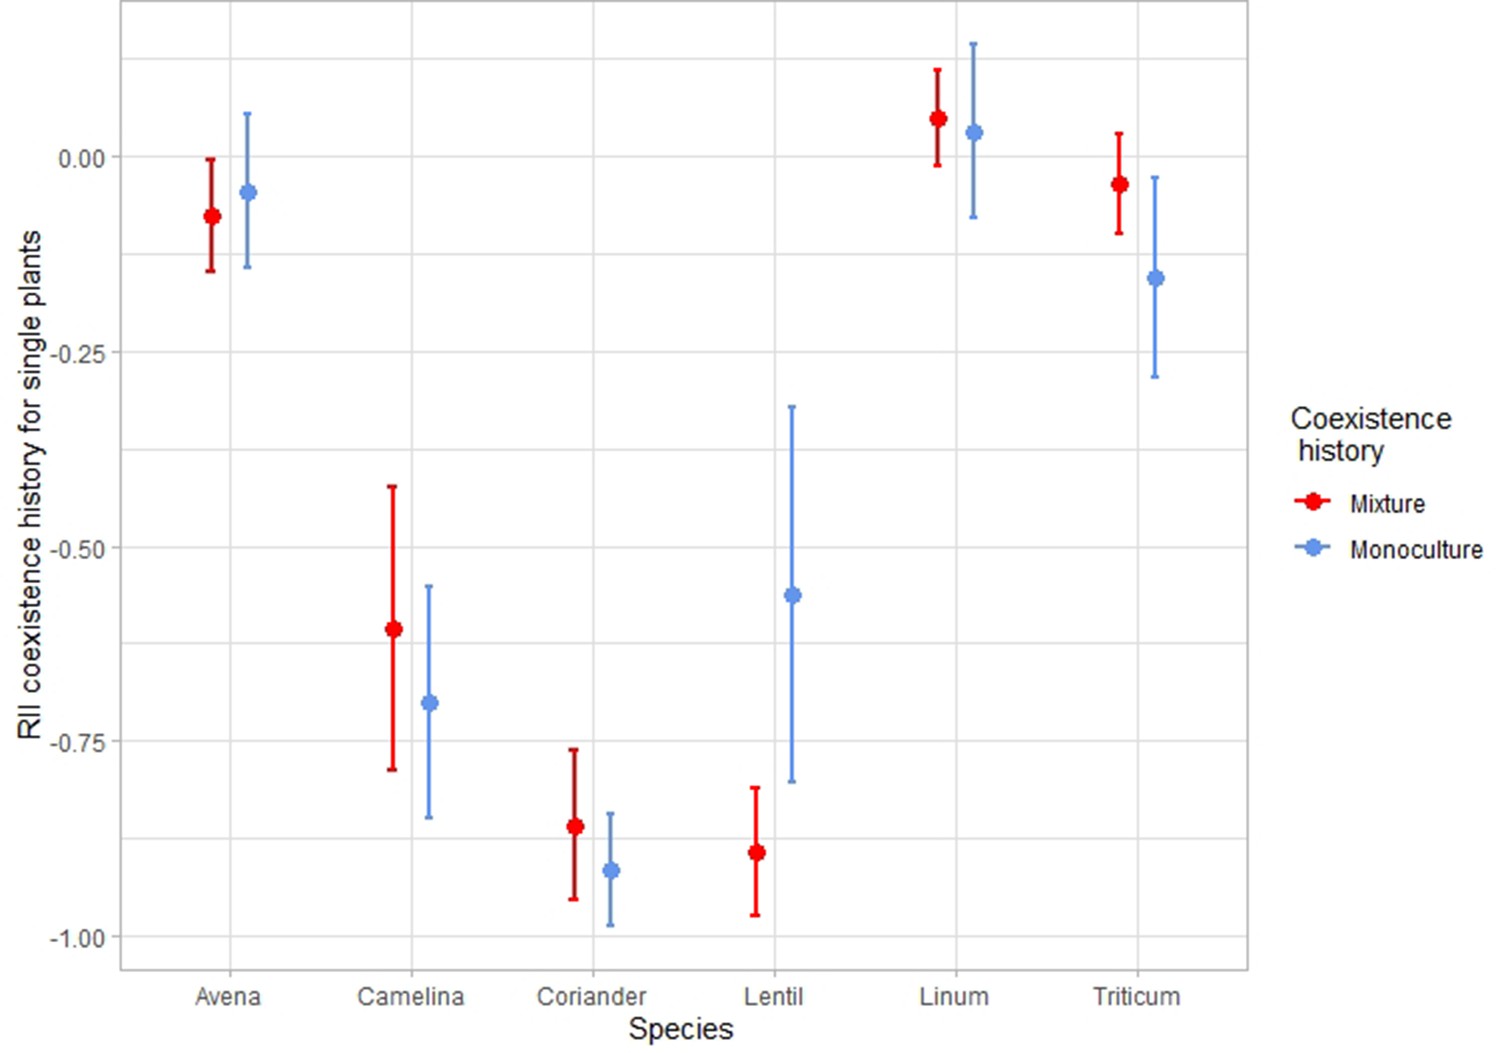
Relative effect of coexistence history on single plant growth, with the single plant history as the reference value.
RII coexistence history for single plants is calculated as: Yield(community history)-Yield(single history)/ Yield(community history)+Yield(single history). This additional index allows to see that the effect of coexistence history on the performance of single plants varies across species: in the case of oat, flax and wheat, coexistence history does not change the performance of single individuals. In the case of camelina, coriander and lentil, the single plants grew worse when they had a community history than when they had a single history, which corroborates our results regarding adaptation in response to coexistence history. Indeed, the fact that single plants coming from single plants perform better than single plants coming from communities already suggests that plants have adapted to their surrounding community. Therefore, we believe that changes in these reference plants are already an effect of coexistence history, and that they should not be ignored by taking the same reference for all coexistence history treatments.
Figure 5—figure supplement 2

Relative effect of coexistence history on monoculture plant growth, with the monoculture plant history as the reference value.
RII coexistence history for monoculture plants is calculated as: Yield(mixture or single history)-Yield(monoculture history)/ Yield(mixture or single history)+Yield(monoculture history). When calculating changes in plant performance in response to coexistence history within monocultures, we see again that this “RII monoculture” index is mostly negative, which means that the performance of plants with a mixture or single history is lower than plants with a monoculture history. This corroborates our adaptation results: in monocultures, plants coming from monocultures do better than plants coming from singles or mixtures. It also shows that coexistence history has an effect of plant performance per se and justifies the choice to take this effect into account when calculating the effect of neighbour on plant-plant interactions (i.e. by taking the appropriate reference).
Figure 6 with 1 supplement
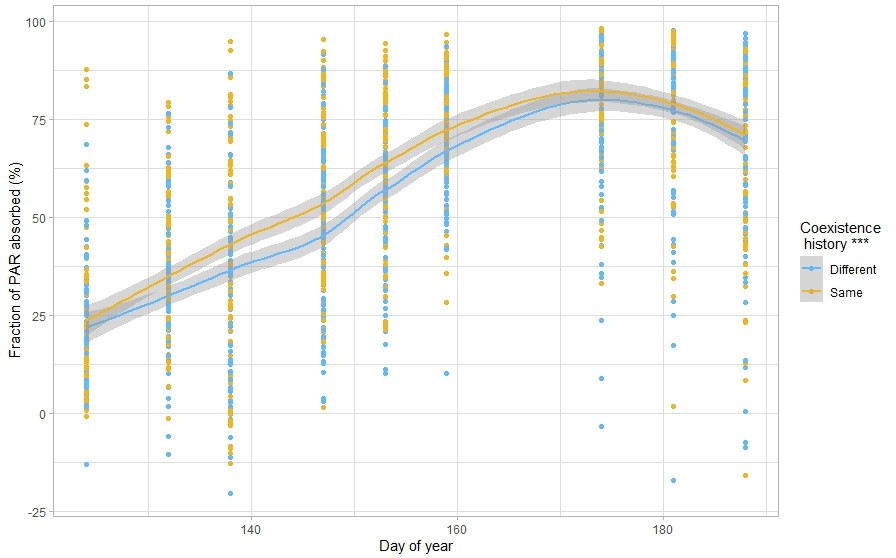
Response of absorbed photosynthetically active radiation to coexistence history.
n=271. Fraction of PAR absorbed (in %) according to the day of year, for plants with the same or different coexistence history. The lines represent local polynomial regression fittings, with the grey area representing the 0.95 confidence interval. Stars placed next to the legend represent the significance of the result. n=2484. See Supplementary file 1r for the complete statistical analysis.
Figure 6—figure supplement 1
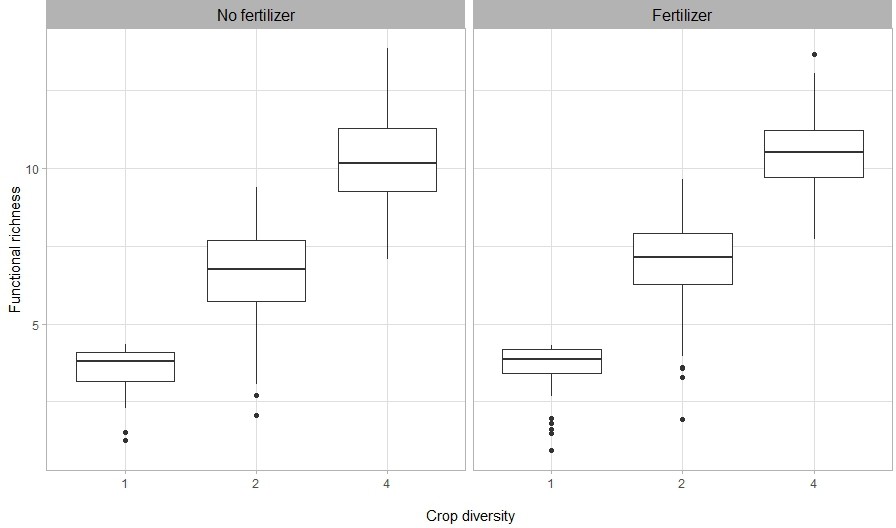
Functional richness in response to crop species diversity, in fertilized and unfertilized plots.
n=271.
Author response image 1
Complementarity effects.
Tables
Table 1
List of crop species ecotypes and their suppliers.
Avena sativa (oat) is mainly self-pollinating, with outcrossing rates of around 1% (Shorter et al., 1978). The variety Canyon was acquired in 2014 through conventional selection processes.
| Species | Switzerland | |
|---|---|---|
| Ecotype | Supplier | |
| Avena sativa | Canyon | Sativa Rheinau |
| Triticum aestivum | Fiorina | DSP, Delley |
| Coriandrum sativum | Indian | Zollinger Samen, Les Evouettes |
| Lens culinaris | Anicia | Agroscope, Reckenholz |
| Camelina sativa | n.a. | Zollinger Samen, Les Evouettes |
| Linum usitatissimum | Lirina | Sativa Rheinau |
Author response table 1
Anova table for RII_monoculture.
| NumDF | DenDF | F value | Pr(>F) | |
|---|---|---|---|---|
| Fertilizer | 1 | 7.883 | 1.306 | 0.286645 |
| History | 1 | 180.459 | 0.9898 | 0.321121 |
| Diversity | 1 | 15.098 | 0.1488 | 0.705034 |
| Fertilizer x history | 1 | 180.367 | 7.8531 | 0.005628 ** |
| Fertilizer x diversity | 1 | 175.703 | 0.217 | 0.641907 |
| History x diversity | 1 | 175.84 | 0.9712 | 0.325747 |
| Fertilizer x history x diversity | 1 | 175.641 | 0.2465 | 0.620166 |
Author response table 2
Posthoc test for the significant interaction on fertilizer x history.
| estimate | SE | df | t.ratio | p.value | |
|---|---|---|---|---|---|
| no diff – yes diff | 0.129 | 0.0651 | 13.2 | 1.981 | 0.2436 |
| no diff – no same | 0.0964 | 0.0562 | 180.7 | 1.715 | 0.3187 |
| no diff – yes same | 0.059 | 0.0724 | 19.6 | 0.815 | 0.8466 |
| yes diff – no same | -0.0327 | 0.0728 | 19.7 | -0.449 | 0.9691 |
| yes diff – yes same | -0.07 | 0.0546 | 177 | -1.284 | 0.5745 |
| no same – yes same | -0.0374 | 0.0794 | 27.1 | -0.471 | 0.9649 |
Author response table 3
Author response table.
| Sum Sq Mean Sq NumDF | DenDF F | value | Pr(>F) | ||
|---|---|---|---|---|---|
| history | 2801.42 2801.42 1 | 81.814 | 5.3175 | 0.02364 | * |
| diversity | 580.76 580.76 1 | 14.804 | 1.1024 | 0.31059 | |
| history:diversity | 41.19 41.19 1 | 80.246 | 0.0782 | 0.78048 |
Author response table 4
Author response table.
| Sum Sq Mean Sq NumDF | DenDF F | value | Pr(>F) | ||
|---|---|---|---|---|---|
| history | 2801.42 2801.42 1 | 81.814 | 5.3175 | 0.02364 | * |
| diversity | 580.76 580.76 1 | 14.804 | 1.1024 | 0.31059 | |
| history:diversity | 41.19 41.19 1 | 80.246 | 0.0782 | 0.78048 |
Additional files
-
Transparent reporting form
- https://cdn.elifesciences.org/articles/77577/elife-77577-transrepform1-v2.docx
-
Supplementary file 1
Supplementary statistical analyses.
(a) Type-I Analysis of Variance Table of the experimental treatment effects on net, competition and facilitation indexes (RII), in year 3 (2020).
(b) Pairwise comparisons of the effect on net interaction index (RII) between fertilizer (yes, no), coexistence history (diff [different], same), and monoculture vs mixture (mix [mixture], mono [monoculture]).
(c) Type-I Analysis of Variance Table of the experimental treatment effects on net, complementarity, and selection effects in year 3 (2020).
(d) Pairwise comparisons of the effect on net biodiversity effects between fertilizer (yes, no) and coexistence history (diff [different], same).
(e) Pairwise comparisons of the effect on selection effects between fertilizer (yes, no), coexistence history (diff [different], same), and planted diversity (2 vs 4).
(f) Type-I Analysis of Variance Table of the experimental treatment effects on total crop yield per plot (square-root transformed).
(g) Type-I Analysis of Variance Table of the experimental treatment effects on mean and coefficient of variation of height, per species per plot (species level) in year 3 (2020).
(h) Type-I Analysis of Variance Table of the experimental treatment effects on mean and coefficient of variation of width, per species per plot (species level) in year 3 (2020).
(i) Type-I Analysis of Variance Table of the experimental treatment effects on mean and coefficient of variation of SLA, per species per plot (species level) in year 3 (2020).
(j) Type-I Analysis of Variance Table of the experimental treatment effects on mean and coefficient of variation of LDMC, per species per plot (species level) in year 3 (2020).
(k) Type-I Analysis of Variance Table of the experimental treatment effects on mean and coefficient of variation of mass per seed, per species per plot (species level) in year 3 (2020).
(l) Type-I Analysis of Variance Table of the experimental treatment effects on community-weighted mean and coefficient of variation of height, per plot (community level) in year 3 (2020).
(m) Type-I Analysis of Variance Table of the experimental treatment effects on community-weighted mean and coefficient of variation of width, per plot (community level) in year 3 (2020).
(n) Type-I Analysis of Variance Table of the experimental treatment effects on community-weighted mean and coefficient of variation of SLA, per plot (community level) in year 3 (2020).
(o) Type-I Analysis of Variance Table of the experimental treatment effects on community-weighted mean and coefficient of variation of LDMC, per plot (community level) in year 3 (2020).
(p) Type-I Analysis of Variance Table of the experimental treatment effects on community-weighted mean and coefficient of variation of mass per seed, per plot (community level) in year 3 (2020).
(q) Type-I Analysis of Variance Table of the experimental treatment effects on functional richness in year 3 (2020).
(r) Type-I Analysis of Variance Table of the experimental treatment effects on FPAR in year 3 (2020).
(s) List of species mixture combinations.
- https://cdn.elifesciences.org/articles/77577/elife-77577-supp1-v2.docx
Download links
A two-part list of links to download the article, or parts of the article, in various formats.
Downloads (link to download the article as PDF)
Open citations (links to open the citations from this article in various online reference manager services)
Cite this article (links to download the citations from this article in formats compatible with various reference manager tools)
Rapid transgenerational adaptation in response to intercropping reduces competition
eLife 11:e77577.
https://doi.org/10.7554/eLife.77577


