Rate and oscillatory switching dynamics of a multilayer visual microcircuit model
- Center for Brain and Cognition, Computational Neuroscience Group, Department of Information and Communication Technologies, Universitat Pompeu Fabra, Spain
- Computational Science and Technology, School of Electrical Engineering and Computer Science, KTH Royal Institute of Technology, Sweden
- Brain Networks Group, Max Planck Institute for Human Cognitive and Brain Sciences, Germany
- Institute of Biomedical Engineering and Informatics, Department of Computer Science and Automation, Technische Universität Ilmenau, Germany
- Institució Catalana de la Recerca i Estudis Avançats, Spain
- Department of Neuropsychology, Max Planck Institute for Human Cognitive and Brain Sciences, Germany
- School of Psychological Sciences, Turner Institute for Brain and Mental Health, Monash University, Australia
Figures
Figure 1
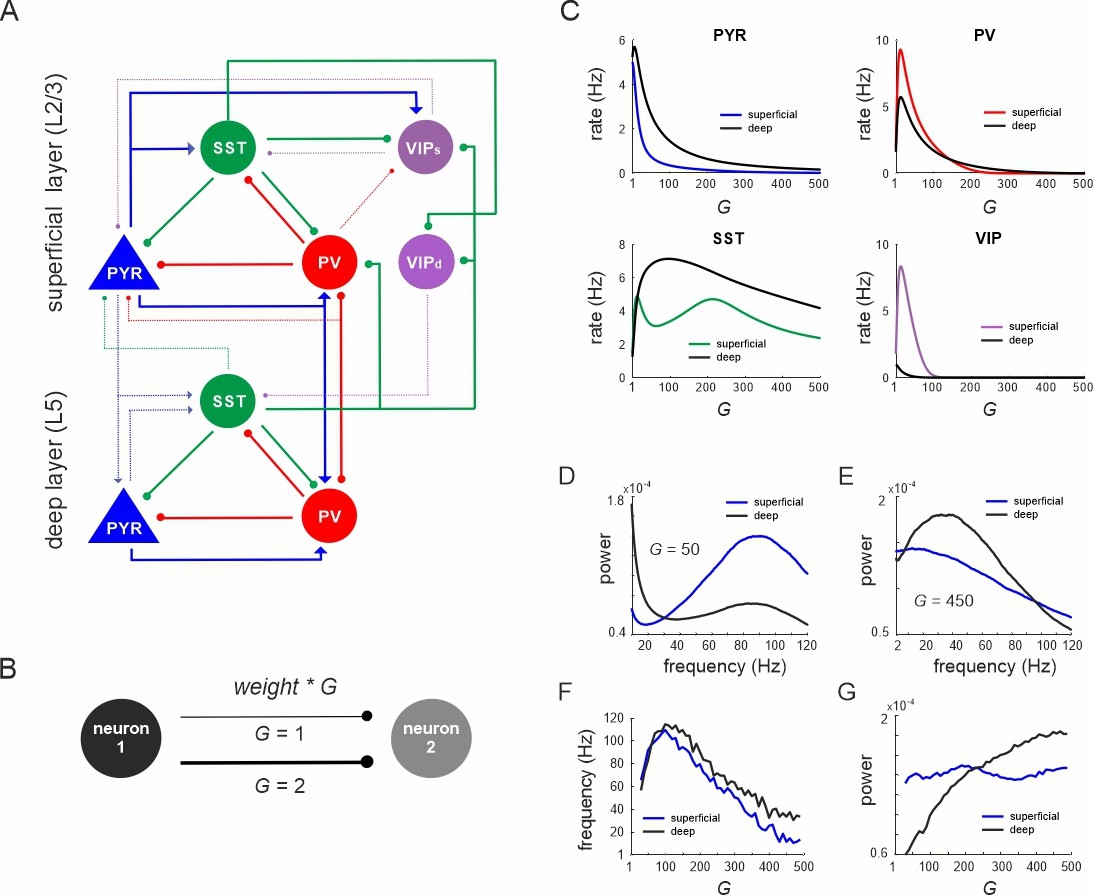
Network anatomy and spontaneous activity.
(A) Layout of the local network with a superficial layer that includes four different cell types in layer 2/3 of the mouse visual cortex and three cell types in a deep layer representing L5. Even though residing in the superficial layer, the VIPd cell type was functionally associated with the deep layer, as it mainly innervates L5. The connectivity strength (w) is represented by the thickness of the lines. Solid lines: w > 0.1, dashed lines: intermediate weights: 0.04 > w < 0.1, weak weights (w < 0.04) are not shown. (B) Schematic showing the scaling of a connection by a coupling parameter G. (C) Mean spontaneous rate for all cell types in superficial and deep layers as a function of the coupling parameter G. (D, E) Example power spectra of local field potential (LFP) in superficial and deep layers for two different values of G. (F, G) Frequency and power of oscillatory peaks in LFP spectra as a function of G for both layers.
Figure 2 with 2 supplements
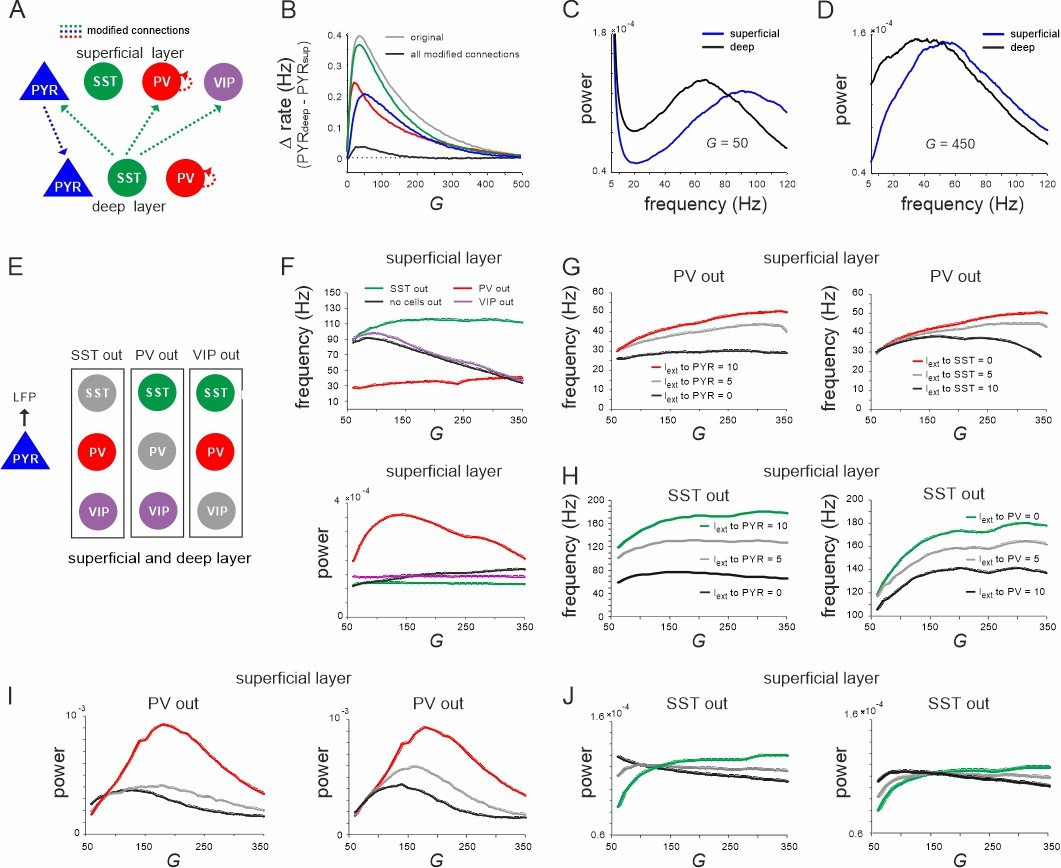
Effect of connectivity lesions on rate and spectral properties across layers.
(A) Schematic two-layer network. The blue and green translaminar connections were removed, while the weights of the red connections were set to the same value of the deep recurrent parvalbumin (PV) connection. (B) Effect of connectivity modification on rate difference between superficial and deep layer as a function of G. (C, D) Power spectra of both layers for two values of G after all connectivity modifications were applied. (E) Diagram depicting three different cell lesion simulations. Gray circles: connections of this cell type to all other cells were set to zero. (F) Peak local field potential (LFP) frequency (top) and power (bottom) as a function of G for different cell lesions in the superficial layer. (G) Peak frequency in the superficial layer as a function of G after PV cell inactivation and different levels of input to PYR (left) or somatostatin (SST) cells (right). (H) Superficial layer peak frequency after SST lesion as a function of G and varying input to PYR or PV cells. (I, J) Same as in (G, H) for oscillatory peak power in the superficial layer.
Figure 2—figure supplement 1

Comparison of the evolution of somatostatin (SST) and parvalbumin (PV) rates with increasing G.
Figure 2—figure supplement 2

Effect of silencing specific cell types on rate and spectral properties in the deep layer.
(A) Peak local field potential (LFP) frequency (left) and power (right) as a function of G for different cell lesions in the deep layer. (B) Peak frequency (top) and power (bottom) in the deep layer as a function of G after parvalbumin (PV) cell inactivation and different levels of input to PYR (left) or somatostatin (SST) cells (right). (C) Deep layer peak frequency (top) and power (bottom) after SST lesion as a function of G and varying input to PYR or PV cells.
Figure 3 with 4 supplements
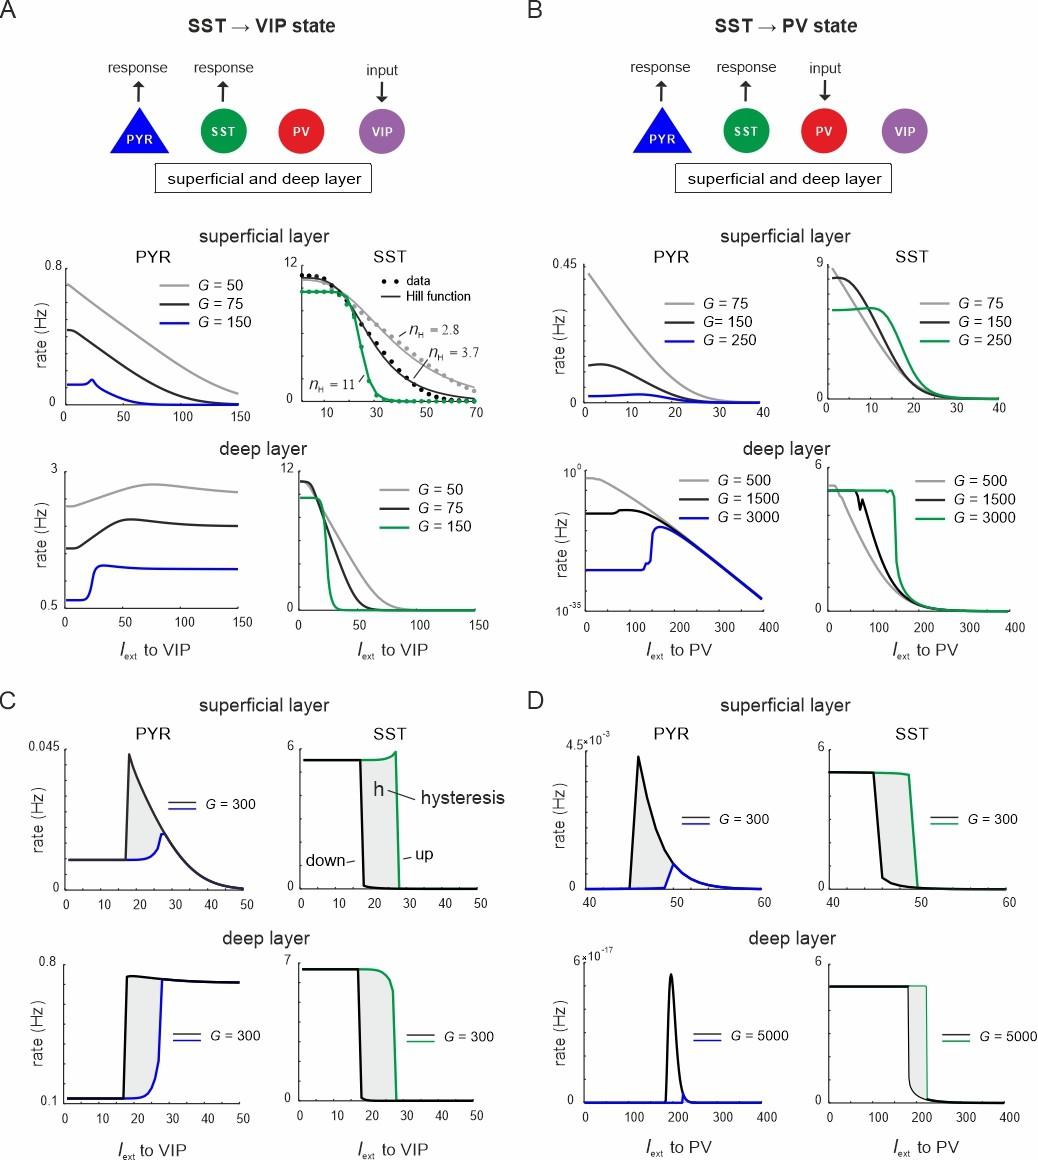
Ultrasensitivity and hysteresis in the visual microcircuit.
(A) Response of PYR and somatostatin (SST) cells in superficial and deep layers after input to superficial and deep vasoactive intestinal polypeptide (VIP) cells (top), mimicking cortical feedback. SST cells were driven with a constant input Iext = 5 5Hz to enhance SST activity. Responses are shown for three different values of G (bottom). SST response curves were fitted with the Hill function, yielding a different Hill coefficient (nH) for each curve. (B) Same as in (A) for simultaneous input to superficial and deep parvalbumin (PV) cells, simulating feedforward inhibition. (C) PYR and SST cell response to increasing (up branch, in blue/green) and decreasing input (down branch, in black) to VIP cells for an exemplary value of G and both layers. Note that G is higher than in (A). The network displays hysteresis in each layer (shaded region h). (D) Same as in (C) for simultaneous input to PV cells in both layers.
Figure 3—figure supplement 1

Ultrasensitivity in parvalbumin (PV) and vasoactive intestinal polypeptide (VIP) cells.
(A) Rate of PV and VIP cells in superficial and deep layers after input to superficial and deep VIP cells. Somatostatin (SST) cells were driven with a constant input Iext = 5Hz to increase SST activity. Responses are shown for three different values of G. (B) Rate of PYR cells in superficial layers as a function of different SST cell drive after input to VIP cells in both layers (left). Disinhibition, defined as the peak of the PYR response divided by the baseline (left panel), as a function of SST input. (C) Same as in (A) for simultaneous input to superficial and deep PV cells. (D) Suppression threshold of PYR cells in different layers as function of G, when input was given to VIP or PV cells. The threshold was defined as the necessary input rate to PV/VIP cells, applied simultaneously to both layers, to suppress PYR rate to <0.001. Note that no threshold exists for PYR cells in the deep layer, as they are not targeted by VIP cells.
Figure 3—figure supplement 2
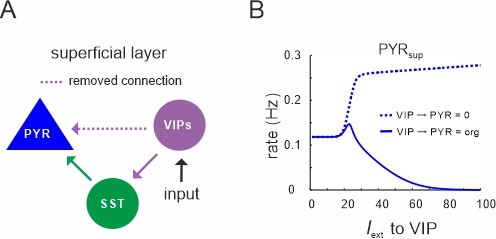
Vasoactive intestinal polypeptide (VIP) cells only inhibit superficial PYR cells.
(A) Diagram in which the connection between superficial VIP cells and PYR cells was selectively removed. (B) Comparison between original response of PYR cells to VIP input (solid line) and after removal of the connection, as shown in (A).
Figure 3—figure supplement 3

Hysteresis in parvalbumin (PV) and vasoactive intestinal polypeptide (VIP) cells.
(A) PV and VIP cell response to increasing (up branch) and decreasing input (down branch) to VIP cells for an exemplary value of G and both layers. The network displays hysteresis in each layer (shaded region h). (B) Same as in (A) for simultaneous input to PV cells in both layers. (C) Response of somatostatin (SST) cells in the deep layer to PV input and G = 1500.
Figure 3—figure supplement 4

Mutual inhibitory connectivity weights control ultrasensitivity and hysteresis.
(A) Schematic showing the scaling of the connections between somatostatin (SST) and vasoactive intestinal polypeptide (VIP)/parvalbumin (PV) cells with a constant k. (B) Response of SST cells to PV input for different values of k and a constant value of G. (C) Same as in (B) for input to VIP cells.
Figure 4 with 2 supplements
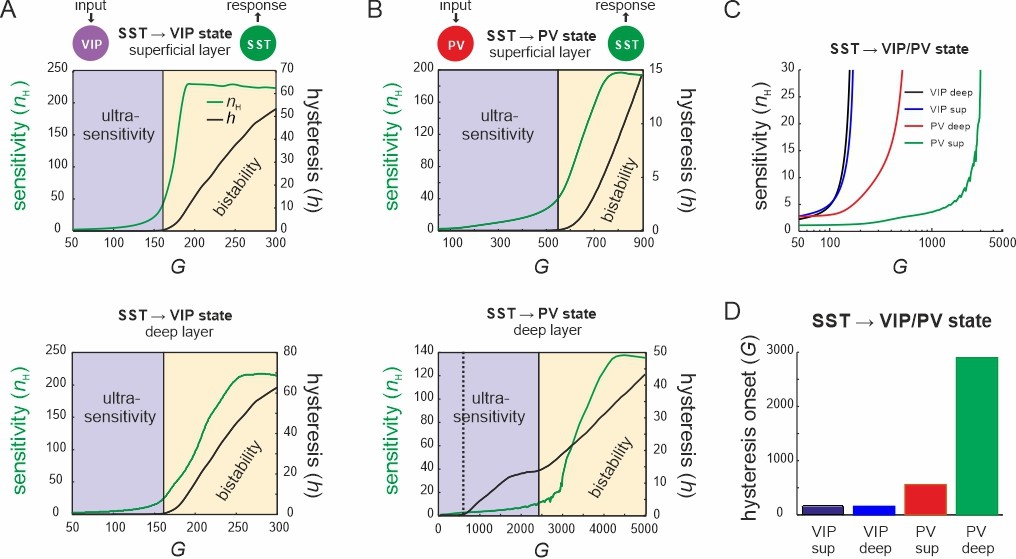
Bifurcation diagrams of the microcircuit switches.
(A) Bifurcation diagram of the superficial (top) and deep layer (bottom) depicting sensitivity, as measured by the Hill coefficient (nH), and hysteresis area (h) of somatostatin (SST) cell responses to vasoactive intestinal polypeptide (VIP) cell input as a function of G. The shaded areas show a purely ultrasensitive and a bistable region, where both ultrasensitivity and hysteresis are present. (B) Same as in (A) for input to parvalbumin (PV) cells. Bottom dotted line: onset of hysteresis in the superficial layer (top) is also seen in the deep layer (bottom). (C) Sensitivity of SST responses to VIP or PV input in superficial and deep layers as a function of G. (D) G values of hysteresis onset in SST responses in both layers after input to VIP and PV cells.
Figure 4—figure supplement 1

Vasoactive intestinal polypeptide (VIP) switch properties in the presence of varying levels of baseline input (Ibase).
(A) All cells were driven with constant baseline input, while switch properties were assessed by measuring the response of superficial PYR and somatostatin (SST) cells to VIP cell input. (B) PYR response to VIP input with three different baseline input levels. (C) Same as in (B) for the SST response and a G value that showed ultrasensitivity. (D) Same as in (C) for a G value that showed hysteresis.
Figure 4—figure supplement 2

Vasoactive intestinal polypeptide (VIP) switch properties in the presence of varying levels of noise and different transfer function parameters.
(A) SST responses to VIP input for 50 trials and added Gaussian noise to all cell types (gray curves) and their average (green curve). (B) Somatostatin (SST) response after all circuit connection weights were jittered (50 trials, gray traces, average: green trace, no jitter: black trace). (C) Histogram of sensitivity values (Hill coefficients nH of response curves in (B)). (D, E) Response of SST cells after varying parameters (A) and (B) of the model transfer function.
Figure 5
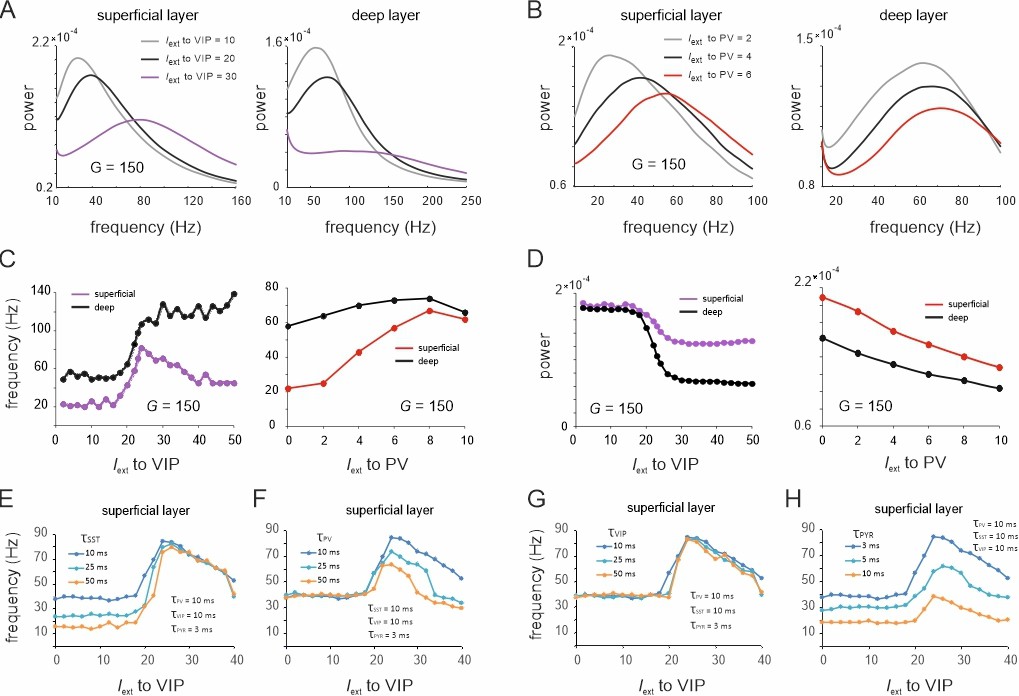
Spectral properties of the microcircuit switches.
(A) Local field potential (LFP) power spectra of superficial and deep layers with three different inputs to vasoactive intestinal polypeptide (VIP) cells and a constant drive Iext = 5Hz to somatostatin (SST) cells. (B) Same as in (E) for input to parvalbumin (PV) cells. Peak frequency (C) and power (D) in superficial and deep layers as a function of VIP and PV input. (E–H) Peak frequency in the superficial layer as a function of VIP input and varying time constants of different cell types.
Figure 6

Lateral inhibition switches dynamics from vasoactive intestinal polypeptide (VIP)/parvalbumin (PV) to somatostatin (SST) dominated states.
(A) Schematic showing input to SST cells in both layers and measuring response in all other cell types. (B) Response curves of PYR, PV, and VIP cells as a function of SST drive for superficial and deep layers, and three different values of G. (C) Power spectra of superficial and deep layers for different levels of SST input. (D) Peak frequency and power as a function of SST input for two levels of PYR drive. (E) Same as in (D) for the deep layer.
Figure 7 with 4 supplements

Input to PYR cells poises the microcircuit to somatostatin (SST) dominated dynamics.
(A) Schematic of PYR cell input (top) and response of SST cells to increasing PYR drive in both layers for three values of G (top and bottom). (B) Same as in (A) with vasoactive intestinal polypeptide (VIP) cells being driven with a constant current Iext = 40Hz. (C) Same as in (A) with constant input Iext = 40Hz to parvalbumin (PV) cells.
Figure 7—figure supplement 1

Response of different cell types to PYR cell input during the somatostatin (SST) dominated state.
(A) Input was only provided to both superficial and deep PYR cells. (B) Peak frequency and power in both layers as a function of PYR drive for an exemplary G value. (C) Response of PYR, parvalbumin (PV), and vasoactive intestinal polypeptide (VIP) cells to PYR input for different values of G in superficial (top) and deep layers (bottom).
Figure 7—figure supplement 2

Response of different cell types to PYR cell input during the vasoactive intestinal polypeptide (VIP) dominated state.
(A) Superficial and deep PYR cells were driven with a variable input, while a constant input of Iext = 40Hz was given to VIP cells. (B) Peak frequency and power in both layers as a function of PYR drive for an exemplary G value. (C) Response of PYR, parvalbumin (PV), and VIP cells to PYR input for different values of G in superficial and deep layers.
Figure 7—figure supplement 3

Response of different cell types to PYR cell input during the parvalbumin (PV) dominated state.
(A) Superficial and deep PY cells were driven with a variable input, while a constant input of Iext = 40Hz was given to PV cells. (B) Peak frequency and power in both layers as a function of PYR drive for an exemplary G value. (C) Response of PYR, PV, and vasoactive intestinal polypeptide (VIP) cells to PYR input for different values of G in superficial and deep layers.
Figure 7—figure supplement 4

VIP switch properties with different recurrent connectivity strength of PYR cells.
(A) The recurrent connectivity weight between PYR cells was scaled by a factor k. (B) Somatostatin (SST) response in superficial layers with three different values of k. (C) Power spectrum of the superficial layer during the high-frequency state of the vasoactive intestinal polypeptide (VIP) switch for three values of k.
Figure 8

State changes propagate across layers.
(A) Input was only given to vasoactive intestinal polypeptide (VIP) cells targeting the superficial layer and the PYR response was measured in the deep layer after all connection from superficial PYR or somatostatin (SST) cells to deep layer cells (dashed lines) were severed (left). The PYR response is shown for the case with intact connections (gray dashed line), all indicated connections cut (black solid line) or individual connections removed (colored lines). (B–H) Same as in (A) for input to different cells and different layers. Only connections were removed that had a visible influence on the PYR response as compared to the case where all connections were left intact.
Figure 9
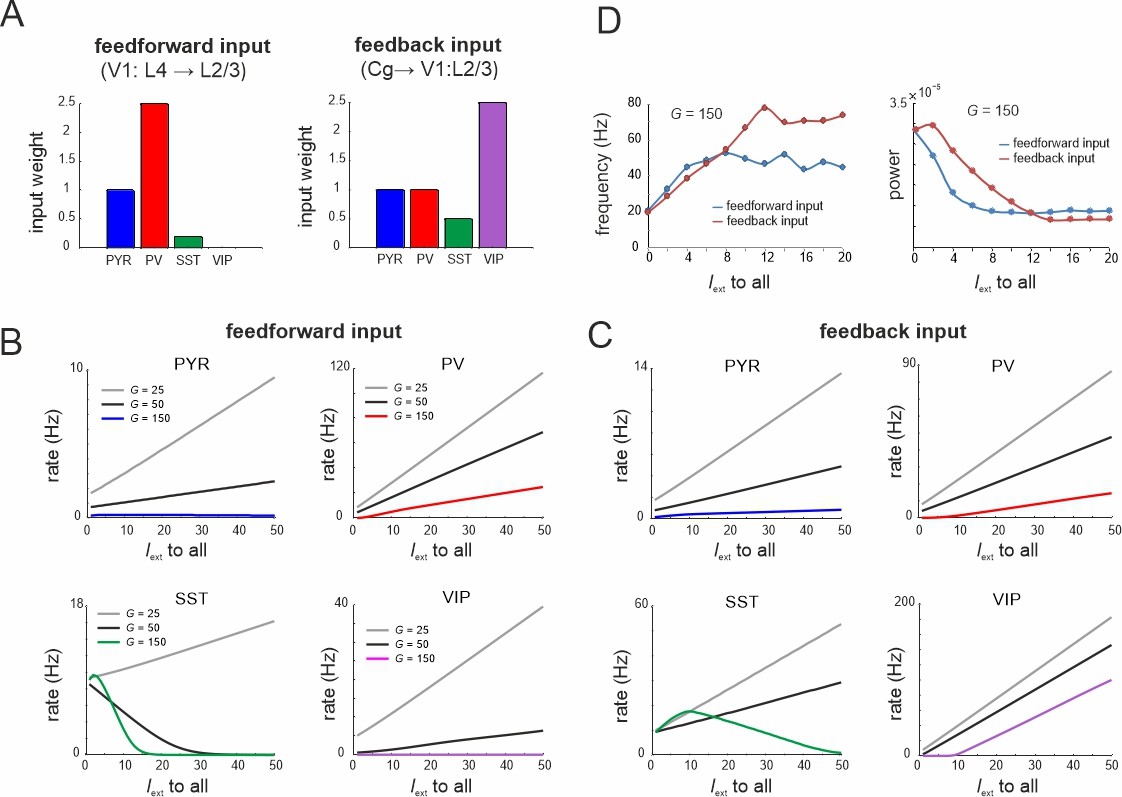
Microcircuit response to feedforward and feedback input.
(A) Relative feedforward and feedback input weights of cell types normalized to PYR cells (weight = 1) with which external input Iext to all cells was scaled. (A) has been adapted from Figure 2C from Adesnik et al., 2012 (left) and Figure 6D from Zhang et al., 2014 (right). (B) Response of different cell types to input Iext scaled by feedforward weights and different values of G. (C) Same as in (B) for feedback input. (D) Peak oscillation frequency and power as a function of feedforward and feedback input strength.
Figure 10 with 2 supplements
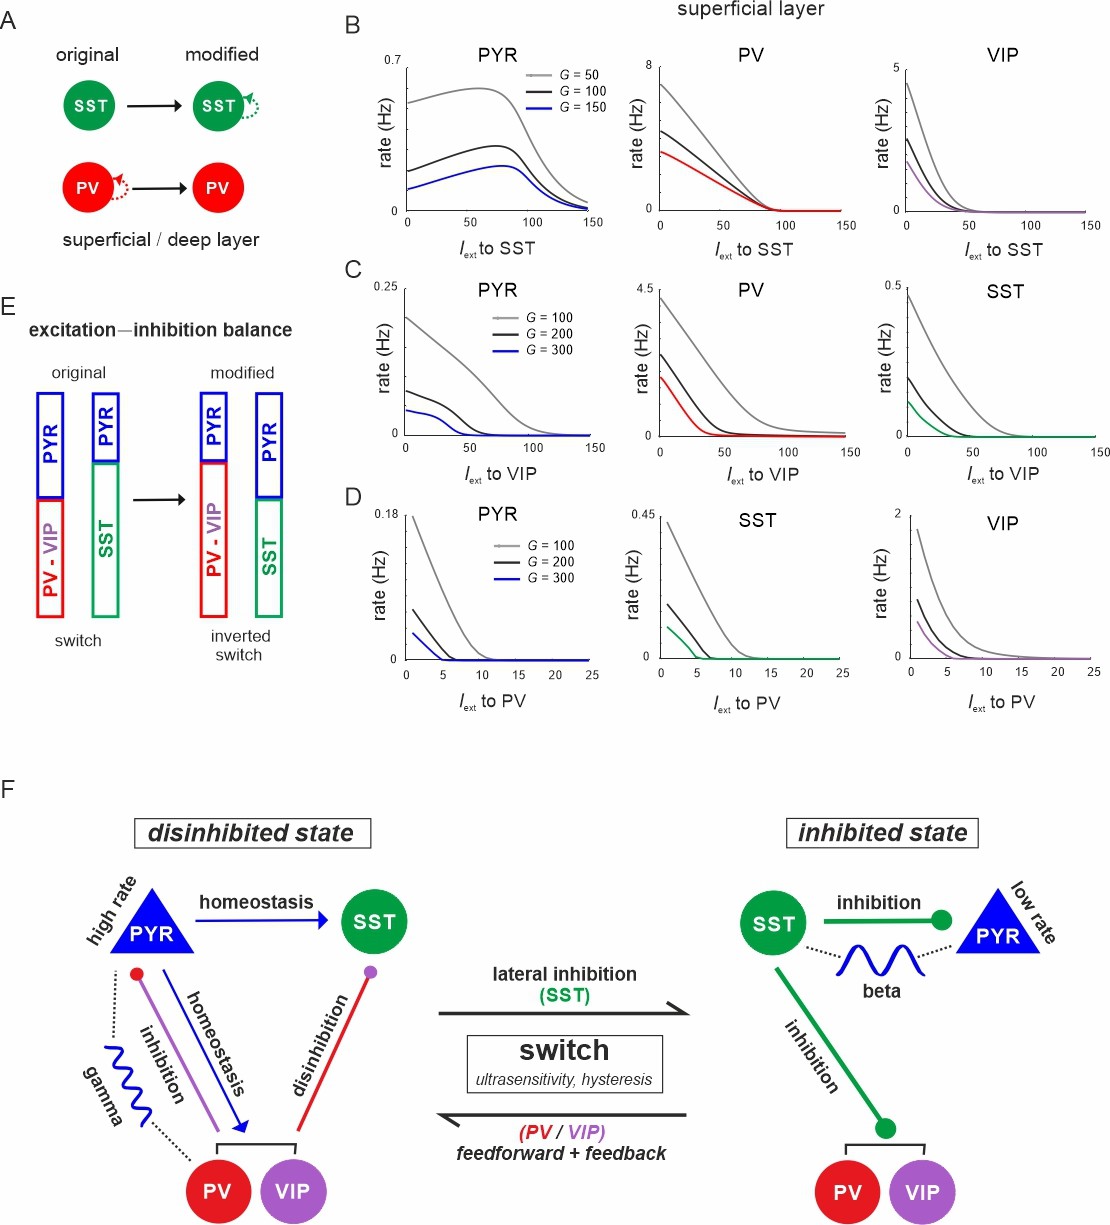
The microcircuit acts as a homeostatic switch between different levels of excitation and inhibition balance.
(A) Schematic showing the typical pattern of strong recurrent connections between parvalbumin (PV) cells and their absence in somatostatin (SST) cells in superficial and deep layers (left). The pattern was inverted in the modified connectivity matrix (right). (B) Response of PYR, PV, and vasoactive intestinal polypeptide (VIP) cells to SST input using the modified connectivity matrix and three different values of G. Note the increase in PYR activity with moderate SST input. (C) Same as in (B) for input to VIP cells and response of PYR, PV, and SST cells. (D) Same as in (A) for response of PYR, SST, and VIP cells to PV input. (E) Schematic showing how the excitation–inhibition balance changes between PV/VIP and SST dominated states using the original (left) or modified connectivity matrix, as shown in (A). Excitation is mediated by PYR cells and inhibition by VIP/PV or SST cells. (F) Summary diagram displaying the principles of the homeostatic switch implemented in the connectivity matrix of the studied microcircuit.
Figure 10—figure supplement 1

Response of somatostatin (SST), parvalbumin (PV), and vasoactive intestinal polypeptide (VIP) cells to input to the same cell type for three different values of G in the superficial layer after exchange between PV and SST recurrent connectivity.
Figure 10—figure supplement 2

Responses to input to different cells after exchange between parvalbumin (PV) and somatostatin (SST) recurrent connectivity.
(A) Response of all cell types to SST input in the deep layer for different values of G. Recurrent connectivity between PV cells was removed and enhanced between SST cells. (B) Same as in (A) for input to vasoactive intestinal polypeptide (VIP) cells. (C) Same as in (A) for input to PV cells.
Additional files
-
Supplementary file 1
Anatomical connectivity parameters.
(a) Connection probabilities for different morphologically defined cell types, as described in Jiang et al., 2015. BC: basket cells; ChC: chandelier cells; MC: Martinotti cells; BTC: bitufted cells; SC: shrub cells; HEC: horizontally elongated cells; BPC: bipolar cells. (b) EPSP/IPSP strength for different morphologically defined cell types, as described in Jiang et al., 2015. BC: basket cells; ChC: chandelier cells; MC: Martinotti cells; BTC: bitufted cells; SC: shrub cells; HEC: horizontally elongated cells; BPC: bipolar cells. (c) Morphological interneuron types, their genetic marker and proportion. (d) Connectivity matrix corrected for cell proportions and scaled up by G = 100. (e) Time constants for different neuron types.
- https://cdn.elifesciences.org/articles/77594/elife-77594-supp1-v1.docx
-
Transparent reporting form
- https://cdn.elifesciences.org/articles/77594/elife-77594-transrepform1-v1.docx
-
Source code 1
The code provides ascending and descending input to vasoactive intestinal polypeptide VIP cells and plots the response of all cell types in superficial and deep layers, as shown in Figure 3.
- https://cdn.elifesciences.org/articles/77594/elife-77594-code1-v1.zip
-
Source code 2
This code provides a function that implements the Wilson–Cowan model used to simulate the dynamics of each neuron population.
- https://cdn.elifesciences.org/articles/77594/elife-77594-code2-v1.zip
Download links
A two-part list of links to download the article, or parts of the article, in various formats.
Downloads (link to download the article as PDF)
Open citations (links to open the citations from this article in various online reference manager services)
Cite this article (links to download the citations from this article in formats compatible with various reference manager tools)
Rate and oscillatory switching dynamics of a multilayer visual microcircuit model
eLife 11:e77594.
https://doi.org/10.7554/eLife.77594


