Emergent regulation of ant foraging frequency through a computationally inexpensive forager movement rule
- Department of Physics of Complex Systems, Weizmann Institute of Science, Israel
Figures
Figure 1

Example of a forager’s trajectory in the experimental nest.
A single frame from an experimental video shows the nest on the right and a foraging arena on the left, where a fluorescent food source was presented. The food source is marked as a red oval and the nest entrance is marked by a white rectangle at the bottom left corner of the nest. Ant IDs are presented next to their tags, and the imaged food in their crops is overlaid in red. A single forager is highlighted in yellow, and her trajectory from when she last entered the nest is presented in cyan. Arrows on the trajectory mark the directionality of her path, and yellow diamonds mark locations of trophallactic interactions that she performed in her unloading bout.
Figure 2 with 2 supplements
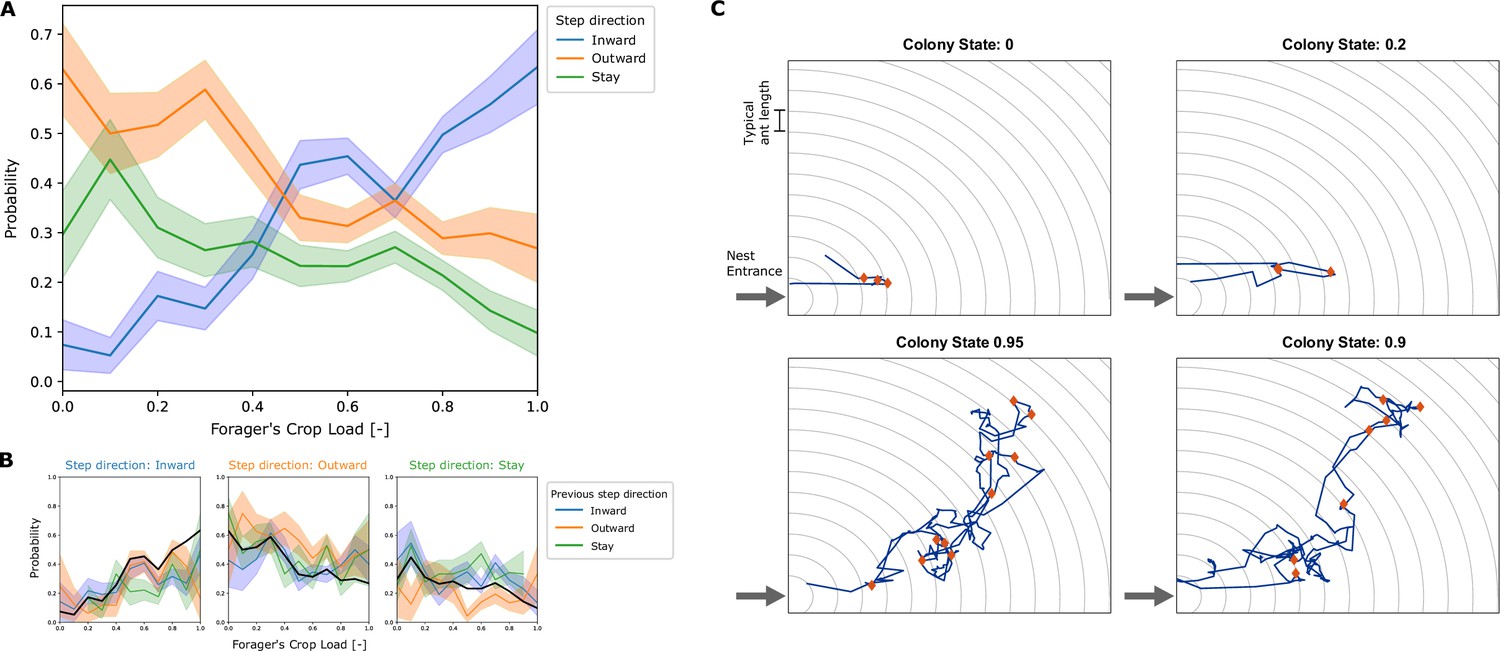
Empirical movement of foragers in the nest.
(A) All locations in the nest were binned according to distance from the entrance, with bin width of 1 typical ant length (as visualized by circular grid lines in panel C). At each interaction of a forager, her crop load at the end of the interaction and the location bin of her next interaction was recorded. Pooled data from all foragers was used to calculate the probability of the next interaction to be in a deeper location bin (inward), in the same location bin (stay), or in a location bin closer to the entrance (outward), as a function of their crop load. Probabilities and standard deviations were calculated for each one of 10 crop load bins. Standard deviation was calculated by the formula for multinomial STD: , and is represented by the error bars in the plot. Sample sizes for each one of the 10 crop load bins () are {27, 38, 58, 68, 78, 103, 185, 192, 187, 77, 41}. (B) The data described in panel A was grouped according to the direction of the previous step. The plots show the probability to step inward (left), outward (middle) and stay (right), for cases where the previous step was inward, outward or stay as different curves. The pooled probability for all previous directions is presented as a thick black curve, equivalent to the curves presented in panel A. Standard deviations were calculated as in panel A, sample sizes for each crop load bin () for each previous step direction are “inward”: {11, 23, 26, 34, 46, 81, 73, 79, 26, 15}, “outward”: {8, 16, 17, 17, 23, 43, 36, 37, 13, 6}, “stay”: {19, 18, 24, 24, 19, 36, 51, 35, 9, 4}. (C) Examples of trajectories of single unloading bouts of a forager in the nest. Nest entrance is at the bottom left corner. Grid-lines spaced by a typical ant length are presented in gray. These are the spatial bins used to define the distance from the entrance for calculating the foragers’ biases (panels A-B). The trajectory of the unloading bout is plotted in blue, and locations of trophallaxis events are presented as red diamonds. The top two plots present trajectories from low colony states, and the bottom two plots present trajectories from high colony states.
-
Figure 2—source data 1
Empirical data.
Data used for calculation of the foragers’ empirical crop-dependent bias. All foragers’ interactions are pooled from the 3 experiments presented in Greenwald et al., 2018. Each interaction entry includes information on its location in the nest, the direction of the next interaction of the forager, and the forager’s crop load.
- https://cdn.elifesciences.org/articles/77659/elife-77659-fig2-data1-v1.csv
Figure 2—video 1
Forager 421’s 12th unloading bout, when the colony was 90% full.
Figure 2—video 2
Forager 421’s 4th unloading bout, when the colony was 20% full.
Figure 3

Examples of two unloading bouts of a forager in the 2D simulation.
The 89 nest-ants are depicted by colored circles at their positions at the beginning of the bout. The color represents the ant’s crop state (purple represents an empty crop, yellow represents a full crop). The nest entrance is marked by a gray area at the bottom left corner of the nest. All the forager’s positions during the unloading bout are presented as a black trajectory through the nest, with arrows representing the forager’s direction.
Figure 4

Foraging frequency scales linearly with empty colony state.
Foraging frequency was calculated as the inverse of the duration of the forager’s unloading bout in the nest. Unloading bouts were binned into five equally spaced bins of colony state, and the mean and SEM of foraging frequency was calculated for each bin. (A) Experimental data, figure taken from figure 4B of Greenwald et al., 2018. Data was grouped into equally-spaced bins of colony state (n = 57, 39, 28, 26, 26, for bins 1–5, respectively). (B) Data from 200 repeats of the 2D model simulation. Data from all repeats was pooled and grouped into equally-spaced bins of colony state (n = 3869, 4183, 4489, 4895, 6248, for bins 1-5, respectively). (C) Data from 200 repeats of the 1D model simulation. Data from all repeats was pooled and grouped into equally-spaced bins of colony state (n = 1770, 1989, 2222, 2531, 3189, for bins 1-5, respectively).
-
Figure 4—source data 1
Data from 1D model.
Output data from 200 runs of the 1D agent-based model. The file contains 3 spreadsheets: (1) Forager data. Includes data on the forager’s crop load and position in the nest at every step of the simulation. (2) Trophallaxis data. Includes data on the forager’s and the receiver’s crop loads, and the amount of food transferred at every interaction. (3) Trip data. Aggregated data on each trip of the forager inside the nest, including trip length and forager’s crop load upon exiting.
- https://cdn.elifesciences.org/articles/77659/elife-77659-fig4-data1-v1.xlsx
-
Figure 4—source data 2
Data from 2D model.
Output data from 200 runs of the 2D agent-based model. Data within the file is as described for the 1D model data. Python code for the agent-based model is available on GitHub (Frankel et al., 2022).
- https://cdn.elifesciences.org/articles/77659/elife-77659-fig4-data2-v1.xlsx
Figure 5
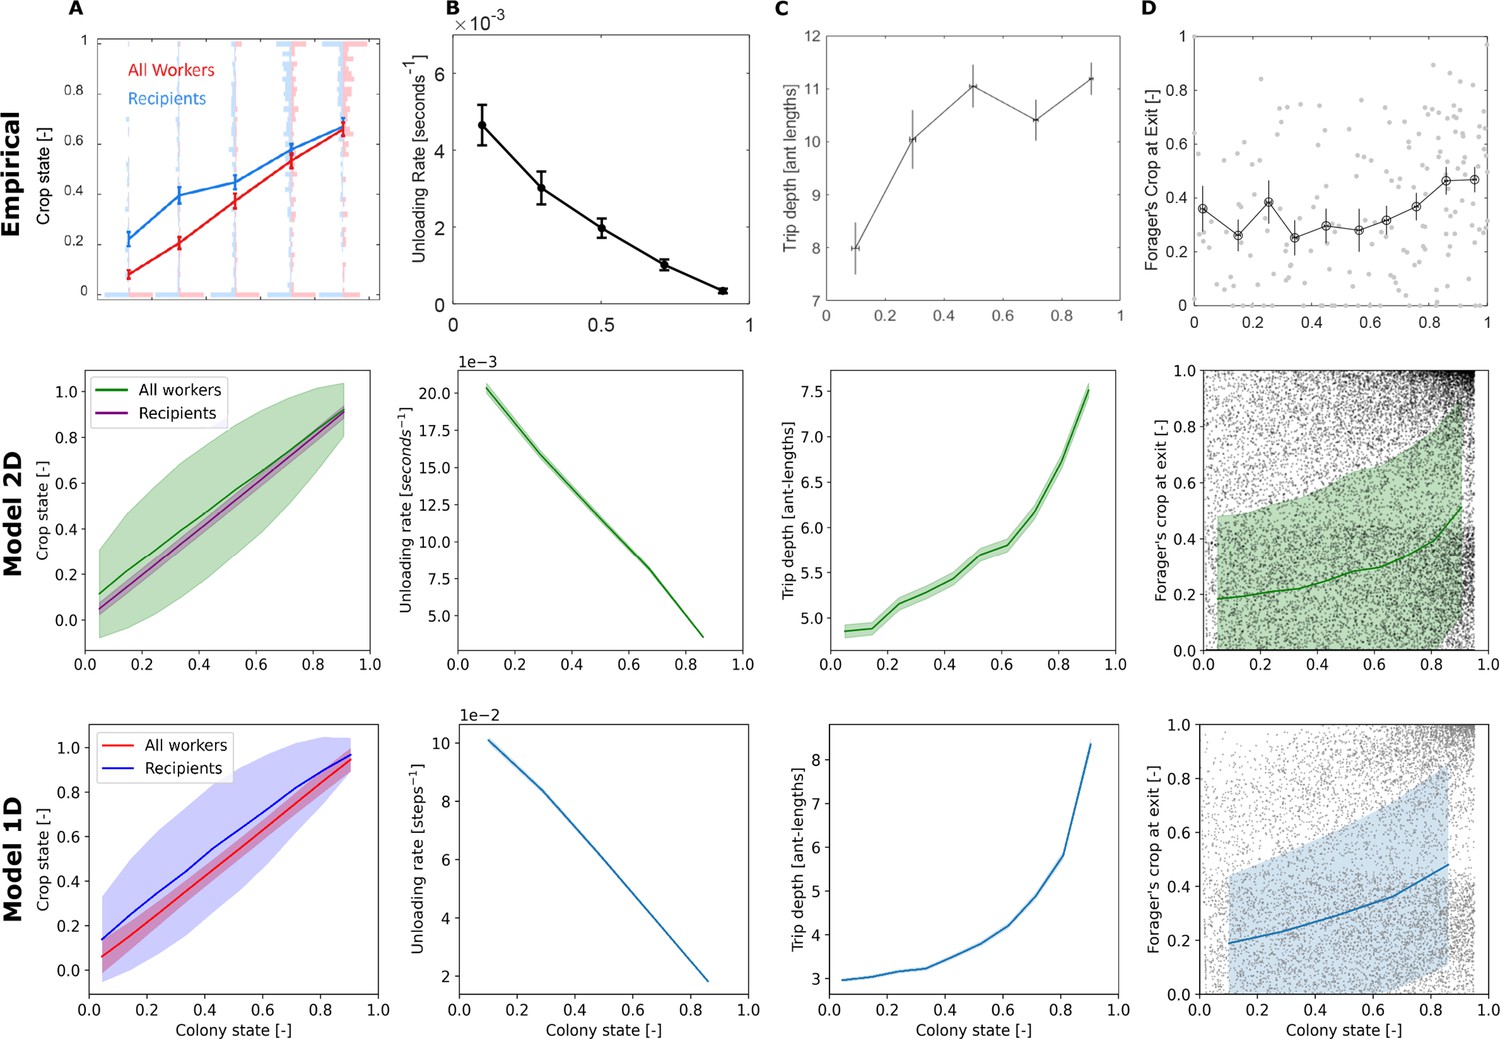
Comparison between empirical and simulation data of forager unloading bout dynamics.
Unloading bouts were binned into equally-spaced bins of colony state. Means and SEMs of different measures were calculated for each bin. Plots of the empirical data were taken from Figures 3D and 2B (model predictions were removed), 5D (units were converted from mm to ant-lengths for comparability to simulation data), and 5A of Greenwald et al., 2018, respectively. Simulation data is from 200 replicates of each model. Sample sizes for each colony state bin are as specified in the caption of Figure 4. (A) The crop states of the nest-ants that interacted with the forager compared to the crop states of all nest-ants, averaged per unloading bout. Error bars for the simulated data represent STDs to better appreciate the variance of the distributions. (B) The forager’s unloading rate, calculated as the amount of food she delivered in the unloading bout divided by the duration of the unloading bouts. (C) Depth, the maximal distance of the forager from the nest entrance in the unloading bout. (D) Forager’s crop load at the end of the unloading bout. Error bars for the simulated data represent STDs to better appreciate the variance of the distributions.
Figure 6
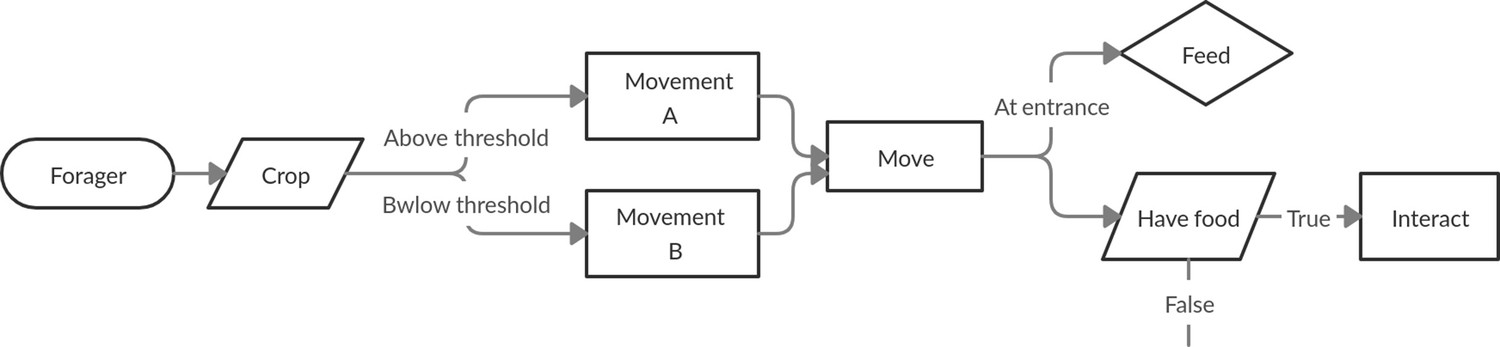
Schematic detailing the process of a forager at every step of the simulation.
The forager first moves according to a crop-dependent movement rule. Then either feeds, if at the entrance, or attempts to interact with another agent.
Appendix 1—figure 1
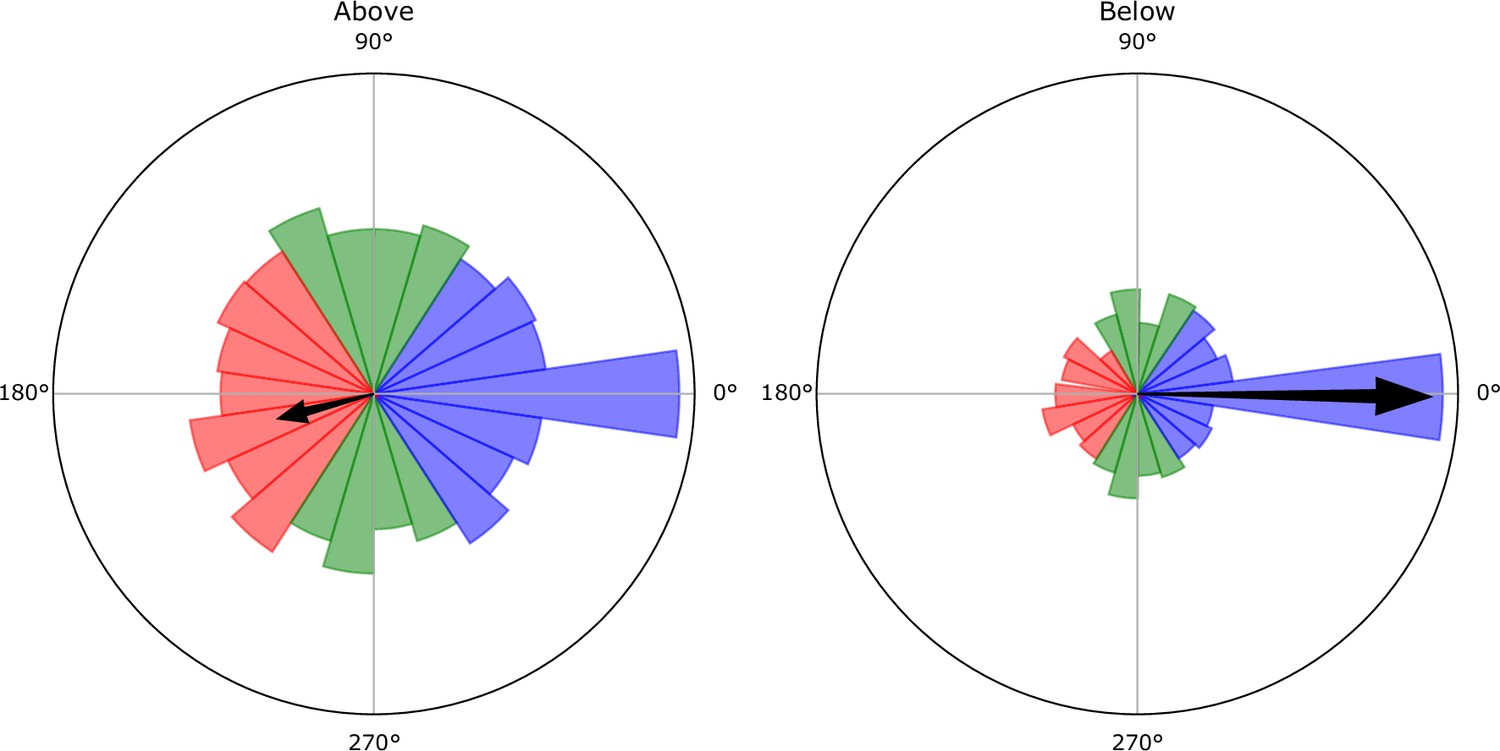
Empirical distributions of the angles between the foragers’ direction of movement and the direction to the nest entrance (an angle of represents a direct movement toward the entrance).
Black arrow represents the mean of the distribution. Data was sampled at the end of each interaction of a forager. The angles are presented in two distributions, one where the foragers’ crop load was above the identified threshold (left), and one where the foragers’ crop load was below this threshold (right). The threshold value was extracted from the data presented in Figure 1 in the main text. Above the threshold foragers had a net bias away from the entrance (mean ± STD: 194.5° ± 133.3°), and below the threshold a net bias toward the entrance (mean ± STD: 359.4° ± 85.0°). In the continuous 2D simulation, the foragers’ direction of movement was determined by randomly sampling an angle from the empirical angle distributions.
Appendix 1—figure 2
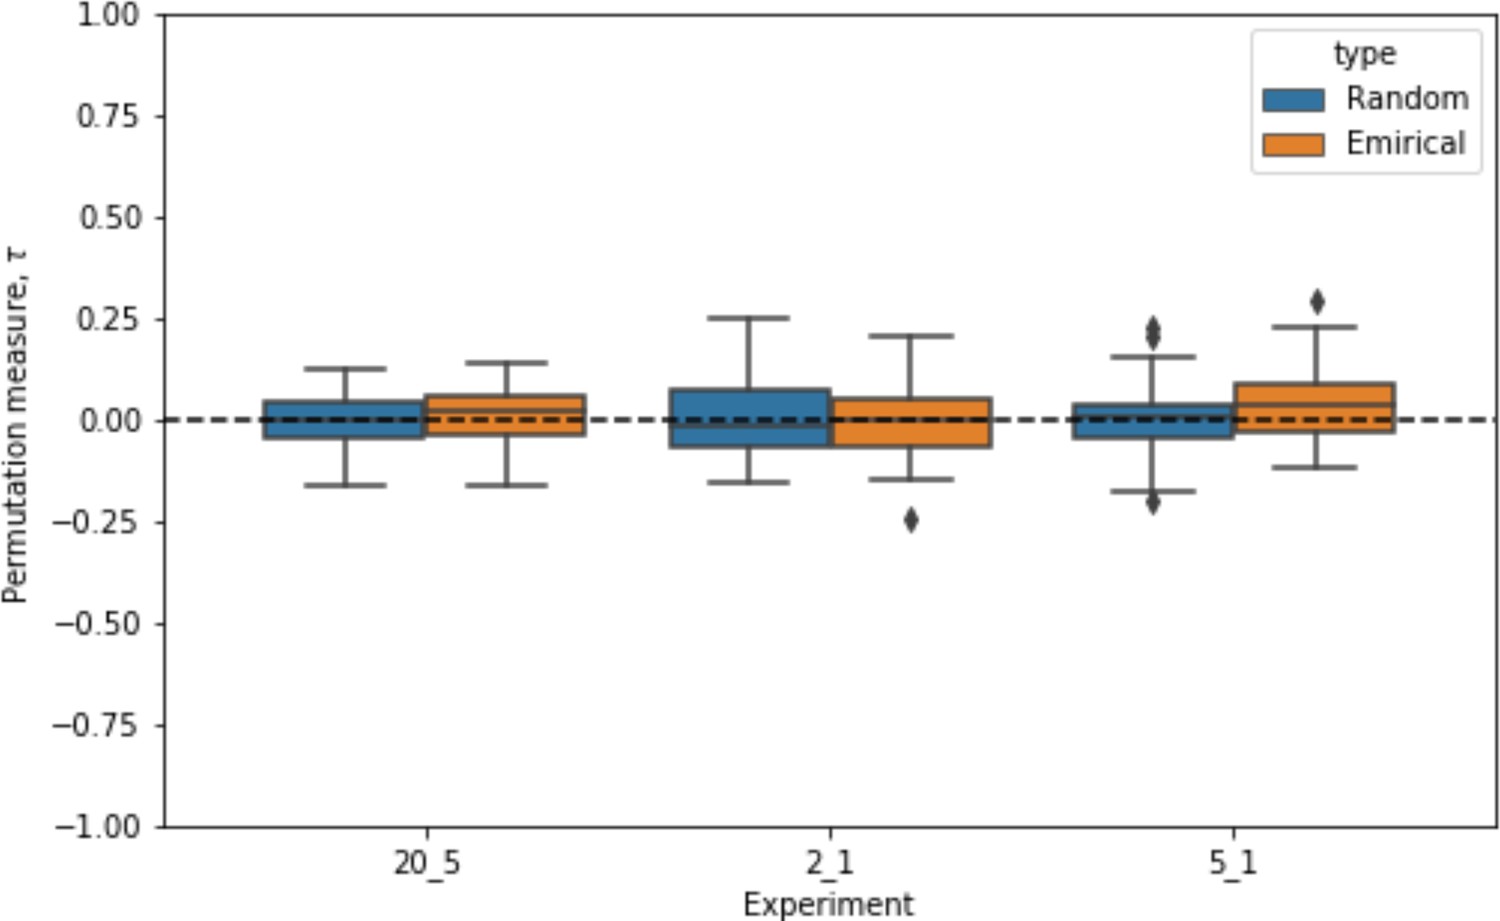
Distributions of the Kendall rank correlation coefficients for nest-ant movement in 3 experiments compared to those of fully random shuffling.
Tables
Table 1
Movement biases for agent-based model.
The probabilities of a simulated forager to step inward, outward or to stay in the same cell, for two cases: when her crop load is lower than or higher than a threshold (0.45). The values of the threshold and the biases are approximated based on the empirical data (Figure 2A).
| Crop load | |||
|---|---|---|---|
| ≤ 0.45 | 0.16 | 0.53 | 0.31 |
| > 0.45 | 0.46 | 0.32 | 0.22 |
Table 2
Parameter values for different groups of agents in both models.
Parameters given to all agents are described under the ’Ants’ sub-population.
| Sub-population | Parameter | Model | Value |
|---|---|---|---|
| Ants | |||
| Crop state capacity | All | 1 | |
| Movement speed | 2D | 0.2 ant-lengths second-1 | |
| Nest-ants | |||
| Initial crop state | All | 0 | |
| Position | |||
| 1D | 45 ants, one on every cell | ||
| 2D | 89 ants randomly placed | ||
| Radius of interaction | 2D | 0.2 ant-lengths | |
| Forager | |||
| Initial crop state | All | 1 | |
| Threshold value | All | 0.45 | |
| Initial position | All | Entrance of nest | |
| Foraging time | All | 0 | |
| Interaction proportion | All | ||
| Biases in state A | 1D | {0.32,0.22,0.46} | |
| Biases in state B | 1D | {0.53,0.31,0.16} | |
| Possible angles in state A | 2D | Appendix 1—figure 1, above | |
| Possible angles in state B | 2D | Appendix 1—figure 1, below | |
| Boarder reflection noise | 2D | [–0.3 radians, 0.3 radians] |
Additional files
Download links
A two-part list of links to download the article, or parts of the article, in various formats.
Downloads (link to download the article as PDF)
Open citations (links to open the citations from this article in various online reference manager services)
Cite this article (links to download the citations from this article in formats compatible with various reference manager tools)
Emergent regulation of ant foraging frequency through a computationally inexpensive forager movement rule
eLife 12:e77659.
https://doi.org/10.7554/eLife.77659


