Single-cell RNA sequencing and lineage tracing confirm mesenchyme to epithelial transformation (MET) contributes to repair of the endometrium at menstruation
- Centre for Inflammation Research, University of Edinburgh, United Kingdom
- MRC Human Genetics Unit, Institute of Genetics and Molecular Medicine, University of Edinburgh, United Kingdom
Figures
Figure 1
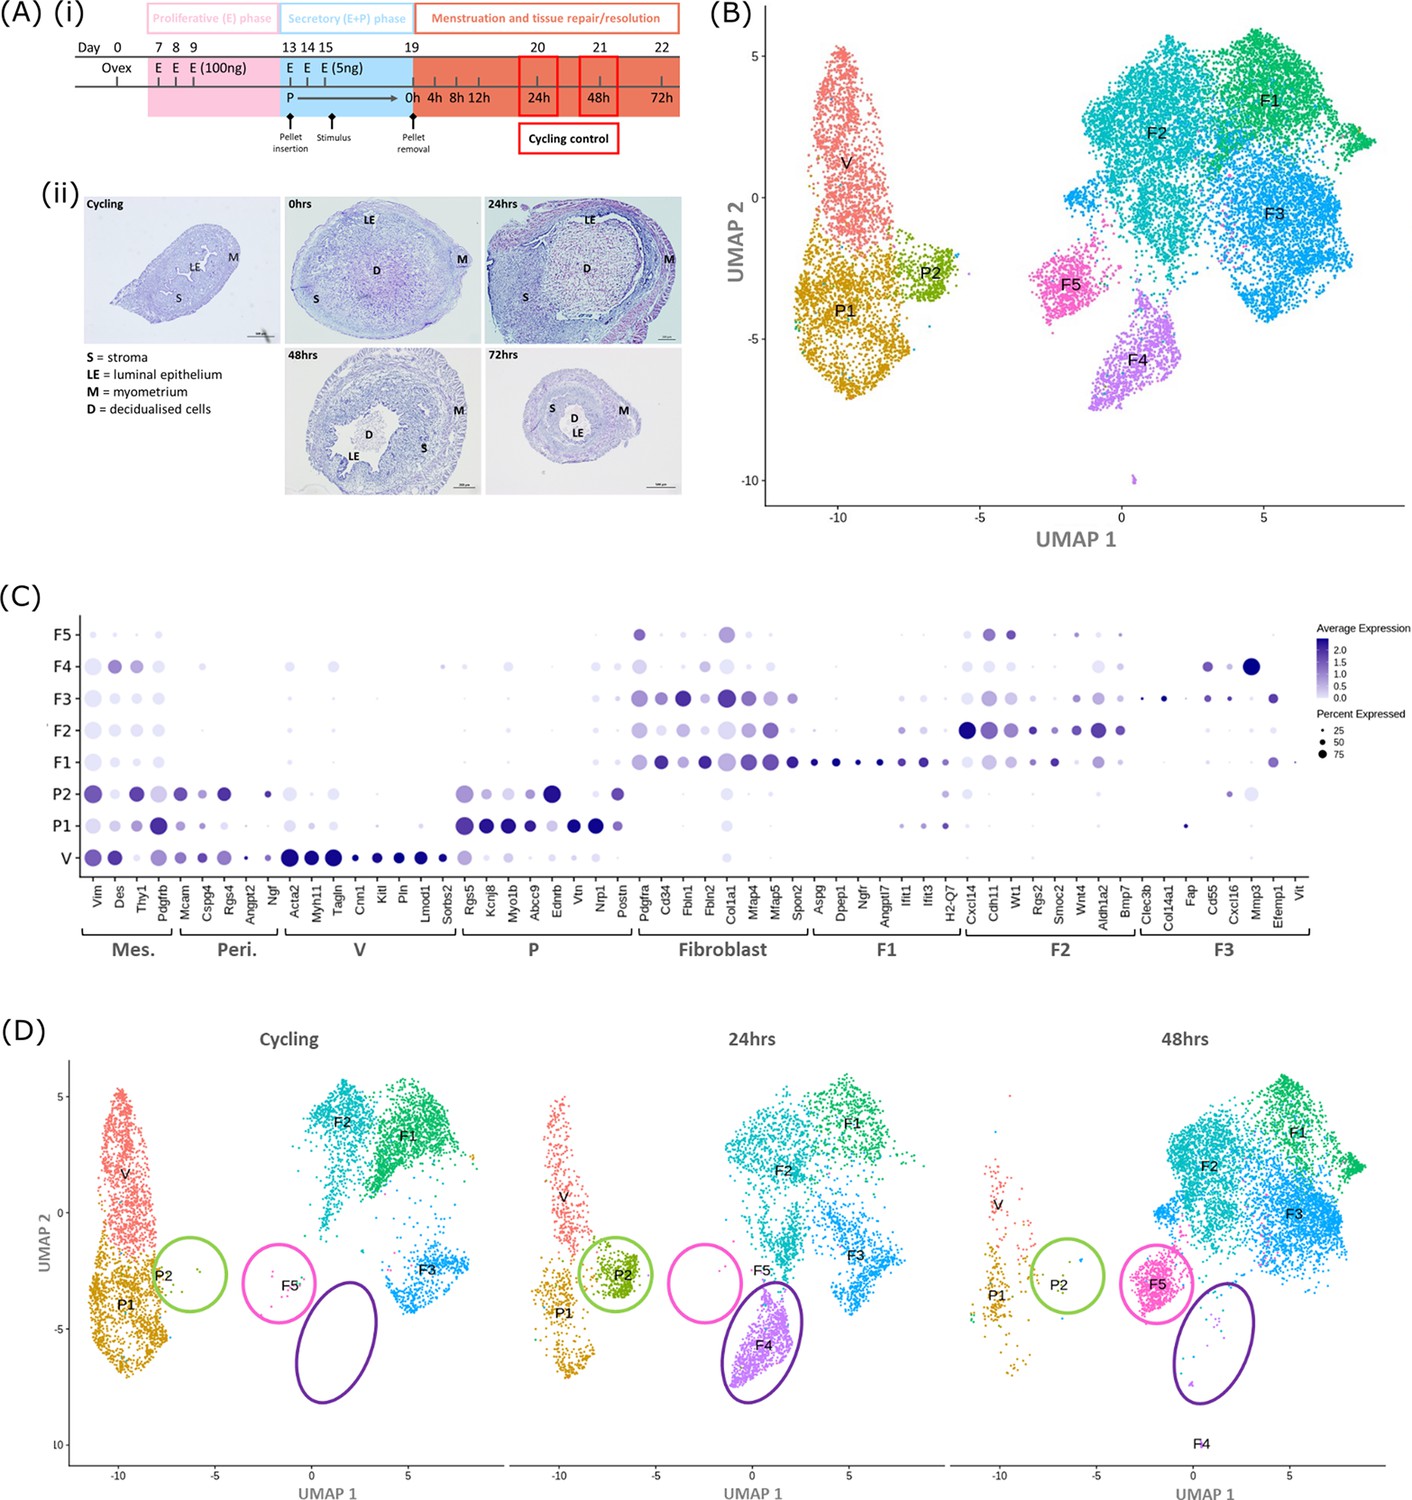
Single-cell RNA sequence analysis identified mesenchymal cell populations unique to ‘repairing’ tissue in a mouse model of endometrial breakdown and repair (menstruation).
(A, i) Mouse model of endometrial tissue breakdown and repair, (ii) histological morphology of uterine tissues 0, 24, 48, and 72 hr progesterone withdrawal illustrating tissue breakdown, repair, remodelling and resolution. (B) UMAP visualisation: GFP +mesenchymal cells isolated from Pdgfrb-BAC-eGFP mouse endometrium (cycling plus 24/48 hr after progesterone withdrawal) cluster into eight distinct populations. (C) Dot plot: expression of canonical gene signatures associated with known cell types present in the endometrium: mesenchymal cells (Pdgfrb, Vim, Des, Thy1), perivascular cells (Mcam, Cspg4, Rgs4, Acta2) and fibroblasts (Pdgfra, Cd34, Fbln1/2, Mfap4/5, Col1a1) (dot colour: average expression per cluster; dot size: percent cluster expressing gene) (D) UMAP visualisation: mesenchymal clusters split by source/dataset identifies transient repair-specific subpopulations P2 and F4 in 24 hr tissues and F5 in 48 hr tissues.
Figure 2 with 1 supplement
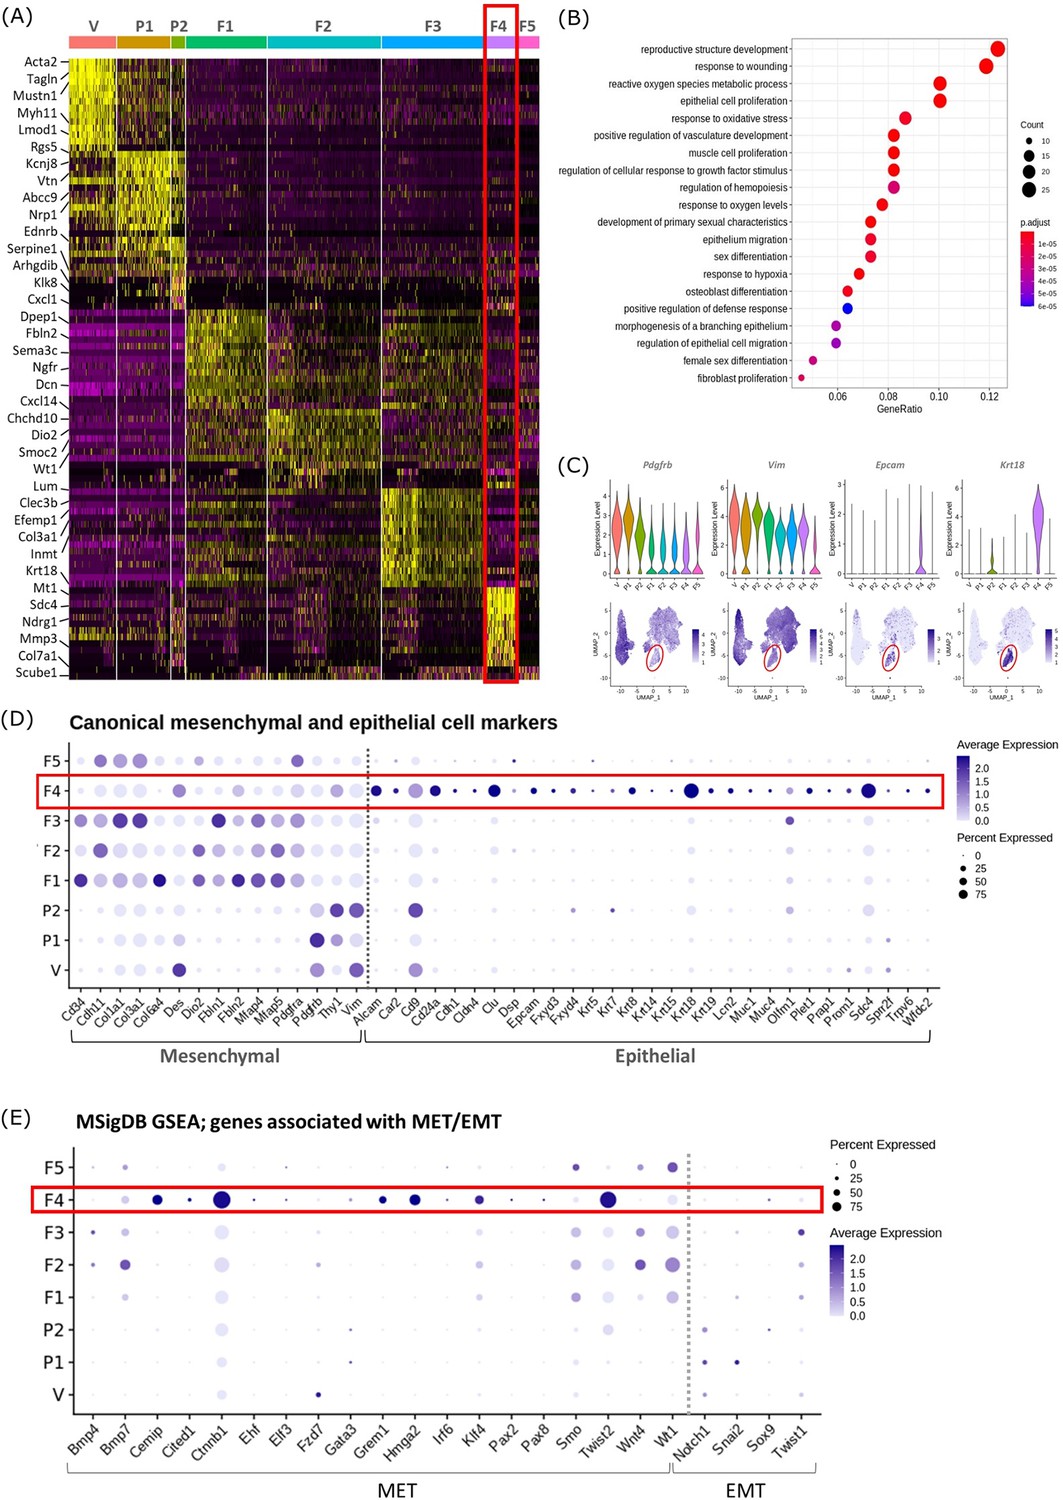
Gene expression analysis identifies transcriptomic profiles of mesenchymal cells and the expression of genes associated with epithelial cell identity in repair-specific fibroblasts (cluster F4).
(A) Heatmap (yellow, high; purple, low) displaying differentially expressed genes per cluster when compared to all other clusters (logFC >0.5, pvalue <0.05, Wilcoxon rank-sum test) top is colour coded and named by cluster; V=vascular smooth muscle cells (vSMCs), P1=pericytes 1, P2=pericytes 2, F1=fibroblasts 1, F2=fibroblasts 2, F3=fibroblasts 3, F4=fibroblasts 4, F5=fibroblasts 5. The expression of the top 5 exemplar genes in each cell cluster is illustrated. (B) Dot plot: GO enrichment terms relating to biological processes (BP) associated with the genetic signature of repair-specific cluster F4 (dot size: gene ratio, number of genes in data/number of genes associated with GO term; dot colour: p-value representing the enrichment score). (C) Gene expression plots: expression of canonical mesenchymal cell markers (i) Pdgfrb and (ii) Vim and canonical epithelial cell markers (iii) Epcam and (iv) Krt18. Note F4 fibroblasts (red box) express markers associated with both cell lineages. (D) Dot plot: expression of extended gene signatures associated with mesenchymal and epithelial cell lineages in the endometrium (dot colour: average expression per cluster; dot size: percent cluster expressing gene). (E) Dot plot: expression of genes associated with the regulation of MET/EMT taken from the MSigDB (dot colour: average expression per cluster; dot size: percent cluster expressing gene).
Figure 2—figure supplement 1
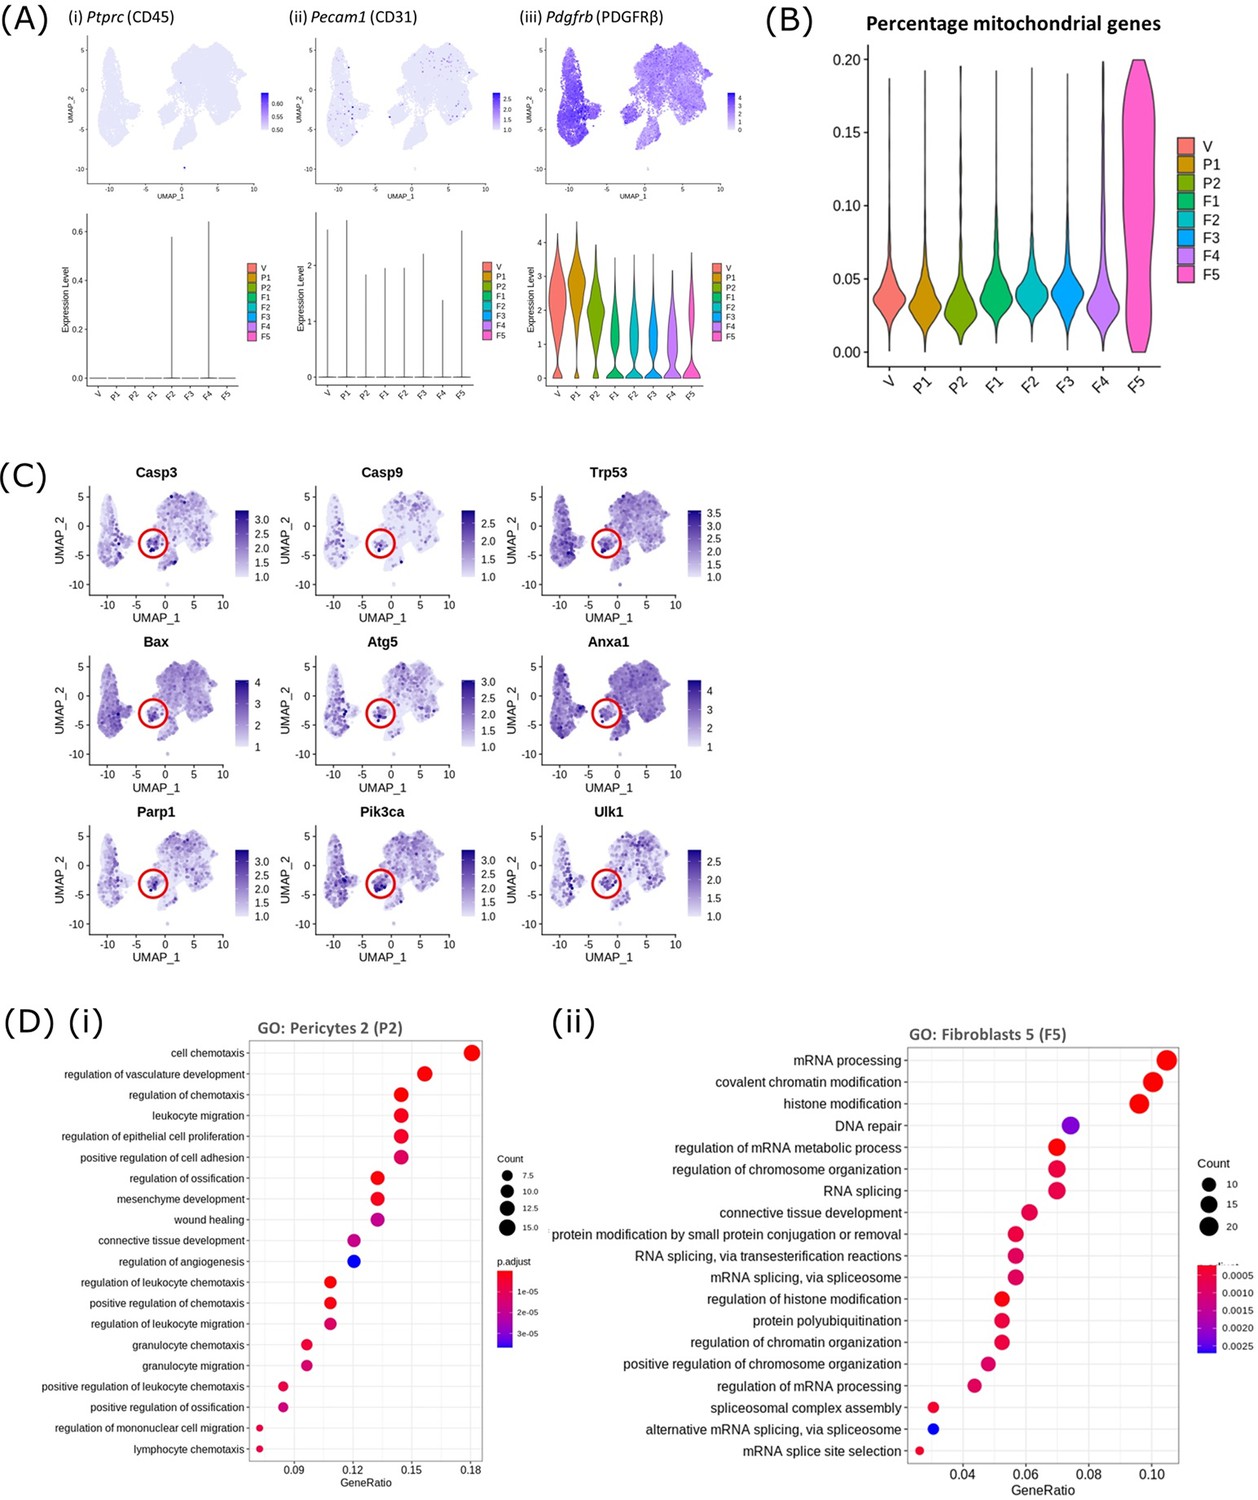
Gene expression data for mesenchyme subpopulations including identification of apoptosis related genes.
(A) Gene expression plots: expression of Pecam1 (CD31), Ptprc (CD45) and Pdgfrb (PDGFRβ) in the 8 mesenchymal cell clusters confirming that the population of cells isolated for the scRNAseq study had no contamination with endothelial or immune cells. (B) Violin plot: percentage of mitochondrial genes expressed by mesenchymal cell clusters indicative of damaged/dying cells; V-vascular smooth muscle cells (vSMCs), P1-pericytes 1, P2-pericytes 2, F1-fibroblasts 1, F2-fibroblasts 2, F3-fibroblasts 3, F4- fibroblasts 4, F5- fibroblasts 5. (C) Gene expression plots: expression of apoptosis-associated genes Casp3, Casp9, Trp53, Bax, Atg5, Anxa1, Parp1, Pik3ca and Ulk1 note high expression in F5. (D) Dot plot: clusterProfiler gene ontology (GO) analysis of biological functions associated with the DEgene signature of (i) pericytes 2 (P2) and (ii) fibroblasts 5 (F5) (dot size: gene ratio, number of genes in data/number of genes associated with GO term; dot colour: p-value representing the enrichment score). Note P2 high for chemotaxis.
Figure 3
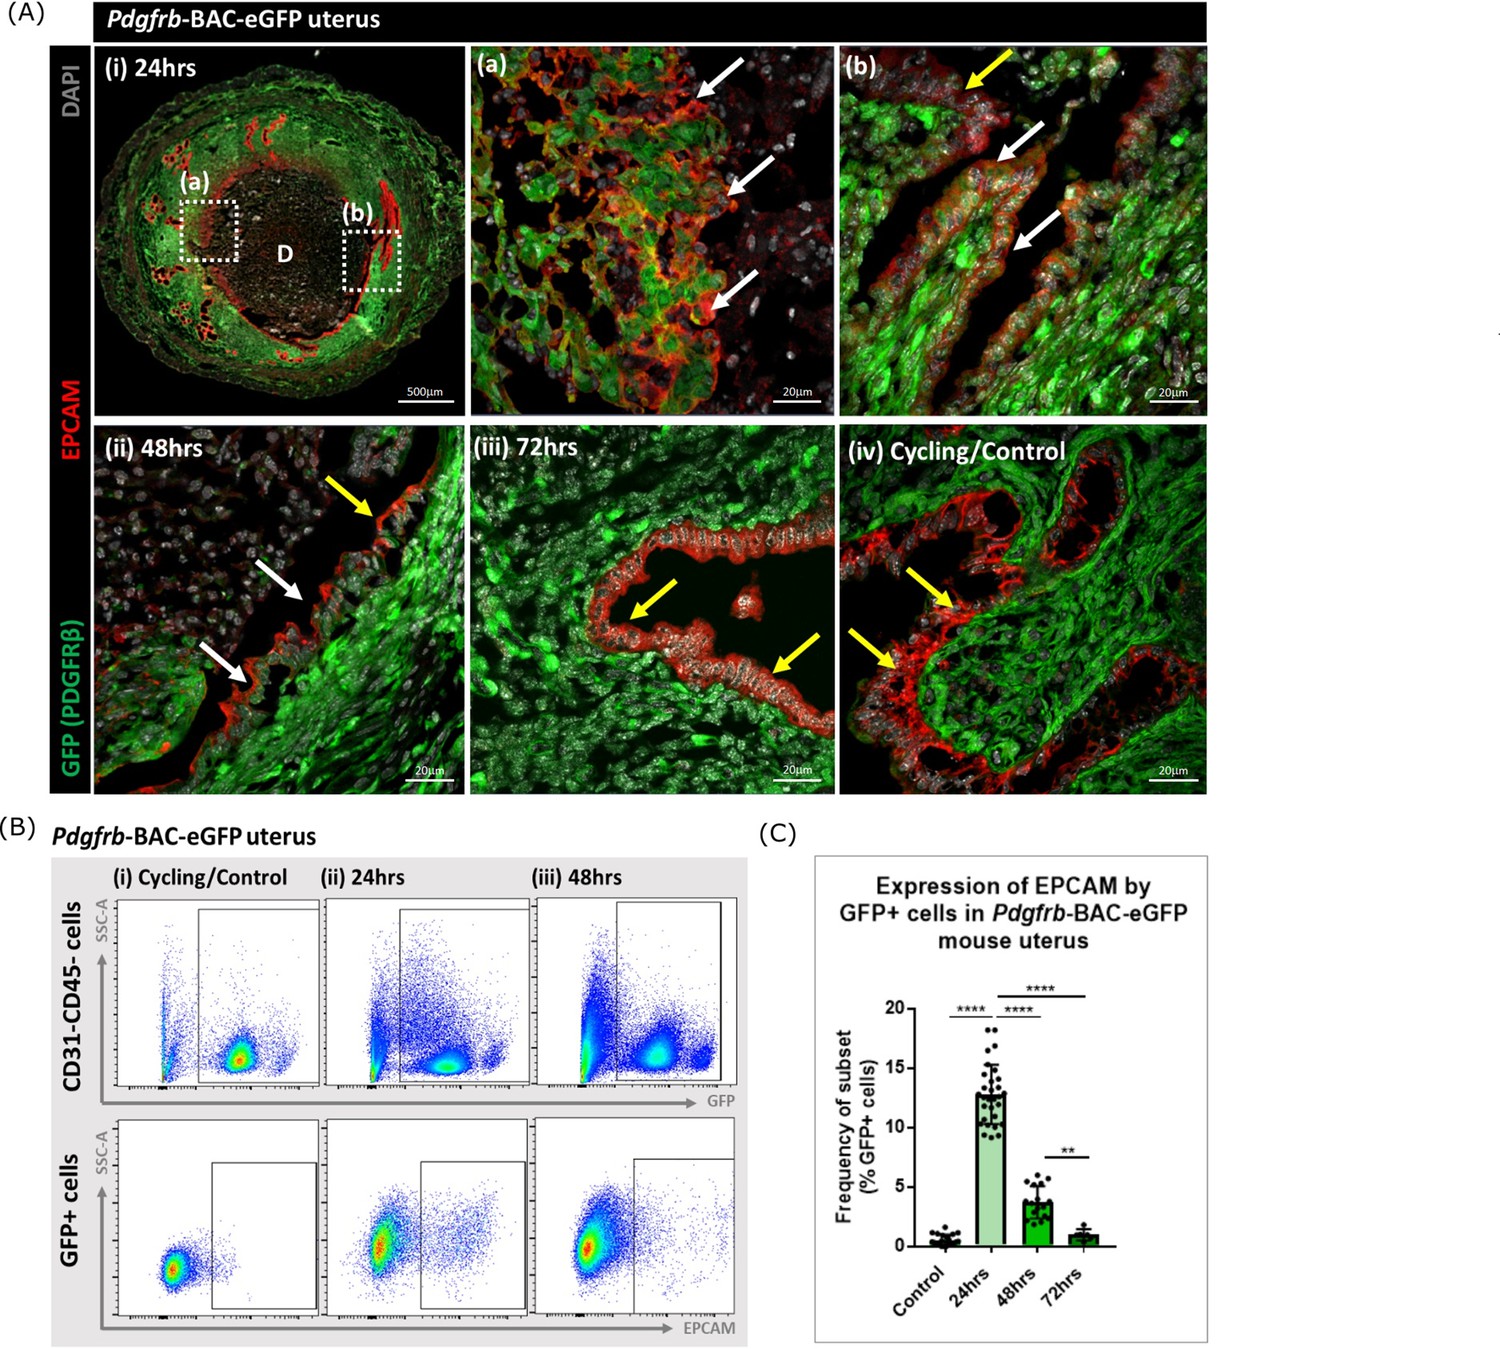
Analysis of Pdgfrb-BAC-eGFP uterine tissue during endometrial tissue repair and remodelling identifies transient expression of GFP in EPCAM + epithelial cells.
(A) Immunohistochemical analysis of GFP reporter protein (green) and epithelial cell marker EPCAM (red) in uterine tissues 24, 48, and 72 hr following progesterone withdrawal. (i) In 24 hr tissues cells that are GFP + EPCAM + are detected in (a) regions of denuded stromal surfaces where the decidualised tissue has detached (white arrows) and (b) regions where a new epithelium has formed (white arrows). (ii) At 48 hr GFP + EPCAM + cells were detected within the renewed luminal epithelium (white arrows) adjacent to GFP- EPCAM + epithelial cells (yellow arrows). (iii) At 72 hr no GFP + EPCAM + cells were detected. (iv) In control/cycling tissues epithelial cells are EPCAM + (yellow arrows), stroma is GFP+. (B) Flow cytometry (FC): analysis of EPCAM in Pdgfrb-BAC-eGFP uterine tissues at 24, 48, and 72 hr following progesterone withdrawal; note detection of a new population of GFP + EPCAM + cells at 24 hr (boxed lower panel) with decreased numbers at 48 hr. (C) Bar plot: quantification of FC data analysing the expression of EPCAM by GFP reporter positive cells in the uterus (%) - control (n=21) 0.53 ± 0.46%; 24 hr (n=30) 12.78 ± 2.49%; 48 hr (n=17) 3.71 ± 1.36%; 72 hr (n=6) 0.96 ± 0.47%; one-way ANOVA, Sidak’s multiple comparisons.
-
Figure 3—source data 1
Summary statistics for flow cytometry analyses performed in Figure 3C.
- https://cdn.elifesciences.org/articles/77663/elife-77663-fig3-data1-v2.docx
-
Figure 3—source data 2
One-way ANOVA with Sidak’s multiple comparisons test for Figure 3C.
- https://cdn.elifesciences.org/articles/77663/elife-77663-fig3-data2-v2.docx
Figure 4 with 1 supplement
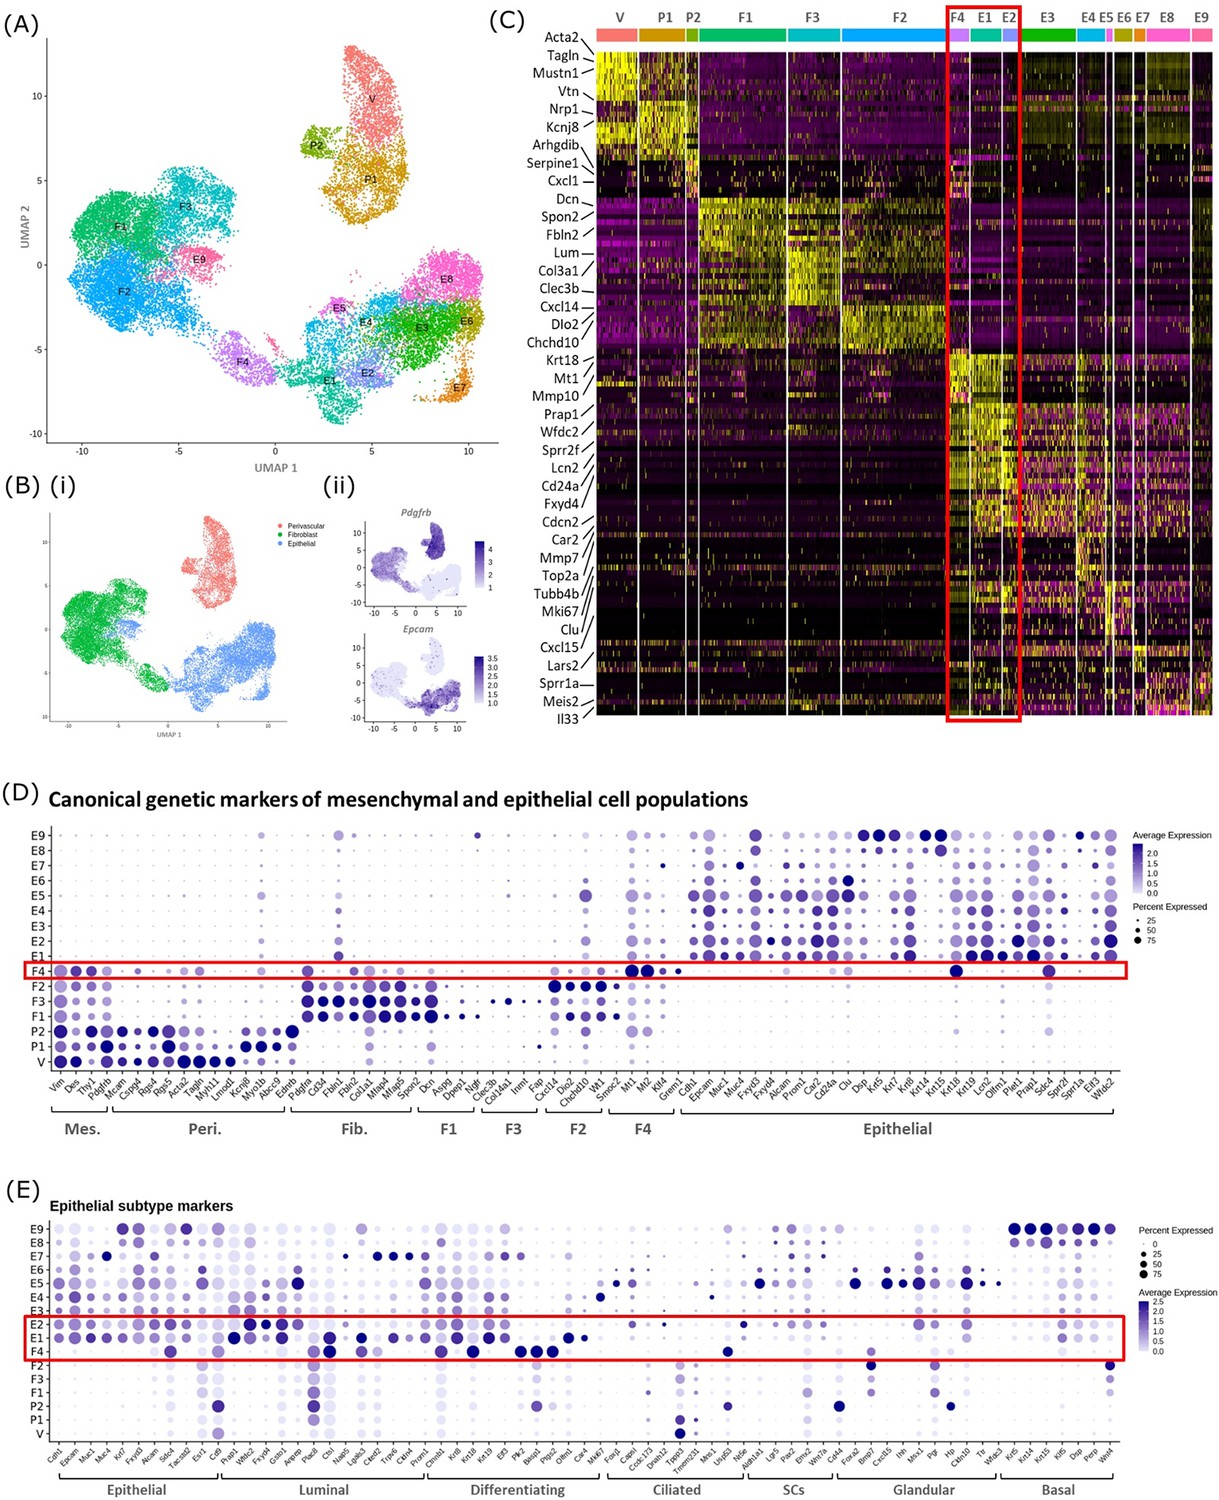
In silico analysis of scRNAseq reveals transcriptomic similarity between repair-specific mesenchymal cells and subpopulations of EPCAM + endometrial epithelial cells.
(A) UMAP visualisation: GFP + mesenchymal cells and GFP-EPCAM + epithelial cells isolated from Pdgfrb-BAC-eGFP mouse endometrium (cycling/24/48 hr and cycling/48 hr, respectively) cluster into 16 distinct populations: 7 mesenchymal, 9 epithelial. Repair-specific fibroblasts (F4) cluster in close proximity to epithelial cell clusters but remain a distinct population of cells. (B) (i) UMAP visualisation: three groups of cell populations are detected in the data: perivascular, fibroblast, and epithelial cells (add colours) (ii) gene expression of Pdgfrb is restricted to mesenchymal populations (perivascular/fibroblast) while Epcam is restricted to epithelial populations (and repair-specific fibroblasts; F4), confirming the isolation strategy adopted. (C) Scaled heatmap (yellow, high; purple, low) displaying differentially expressed genes per cluster when compared to all other clusters (logFC >0.5, pvalue <0.05, Wilcoxon rank-sum test) top is colour coded and named by cluster; V=vascular smooth muscle cells (vSMCs), P1/2=pericytes 1/2, F1−4=fibroblasts 1–4, E1−9=epithelial cells 1–9. The expression of 3 exemplar genes in each cell cluster is displayed. F4 shows genetic similarity to E1/2 (red box). (D) Dot plot: expression of canonical genes associated with mesenchymal, perivascular, fibroblast and epithelial lineages, F4 is the only cluster that expressed genes from multiple lineages (red box) (dot colour: average expression per cluster; dot size: percent cluster expressing gene). (E) Dot plot: expression of gene signatures associated with known epithelial cell subtypes present in the endometrium as per the literature: canonical epithelial, luminal, differentiating, ciliated, SCs, glandular, basal epithelial cells (dot colour: average expression per cluster; dot size: percent cluster expressing gene). Red box F4 compared to E1, E2 highlighting expression of genes found in the luminal and differentiating epithelial cell populations.
Figure 4—figure supplement 1
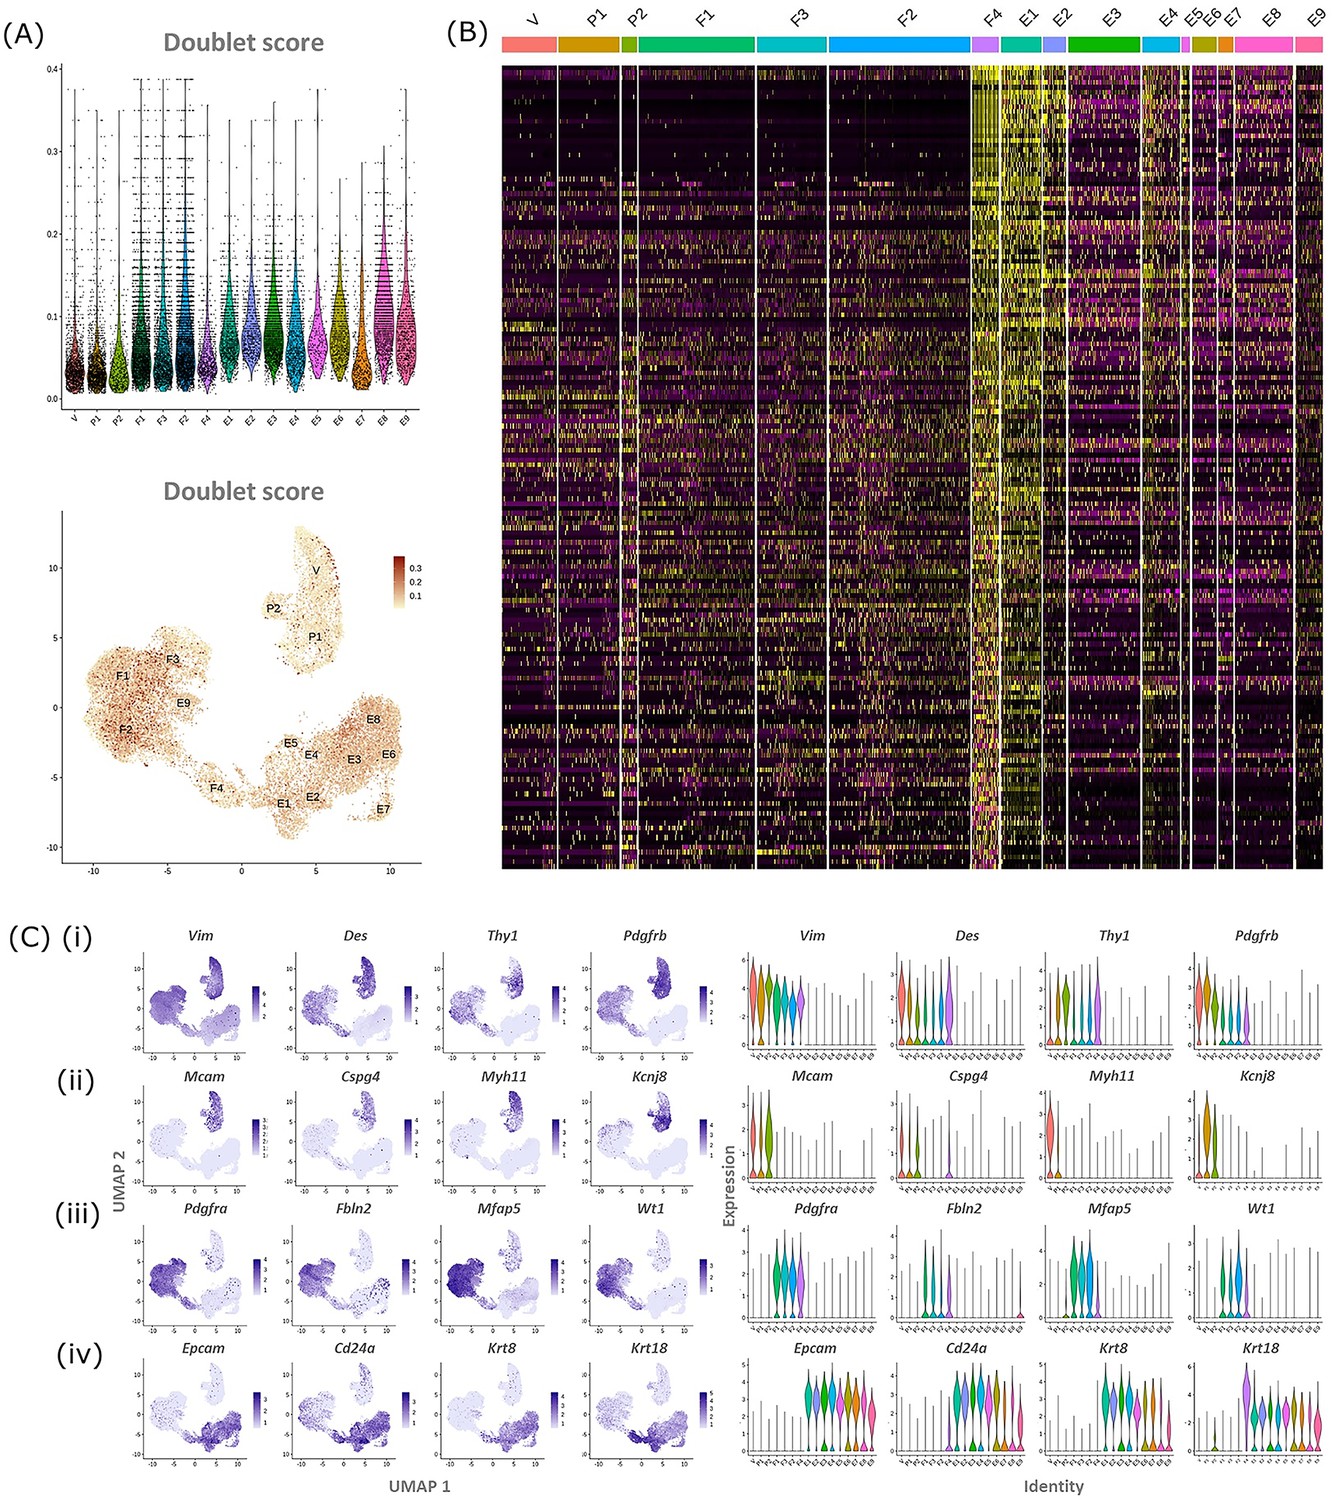
Comparison between gene expression in F4 population and all other cell clustes confirms overlap with both fibroblast and epithelial cells.
(A) Expression of canonical markers by GFP + mesenchymal cells and GFP-EPCAM + epithelial cells (Pdgfrb-BAC-eGFP uterus) for (i) mesenchymal (Vim, Des, Thy1, Pdgfrb), (ii) perivascular (Mcam, Cspg4, Myh11, Kcnj8), (iii) fibroblast (Pdgfra, Fbln2, Mfap4, Wt1), and (iv) epithelial (Epcam, Cd24a, Krt8, Krt18) cell lineages highlighting the predicted phenotype of the cell clusters. (B) Scaled heatmap (yellow, high; purple, low) displaying differentially expressed genes for cluster F4 when compared to all other clusters (logFC >0.5, pvalue <0.05, Wilcoxon rank-sum test) top is colour coded and named by cluster; V=vascular smooth muscle cells (vSMCs), P1/2=pericytes 1/2, F1−4=fibroblasts 1–4, E1−9=epithelial cells 1–9. Note the transcriptional profile of F4 appears most similar to E1/2.
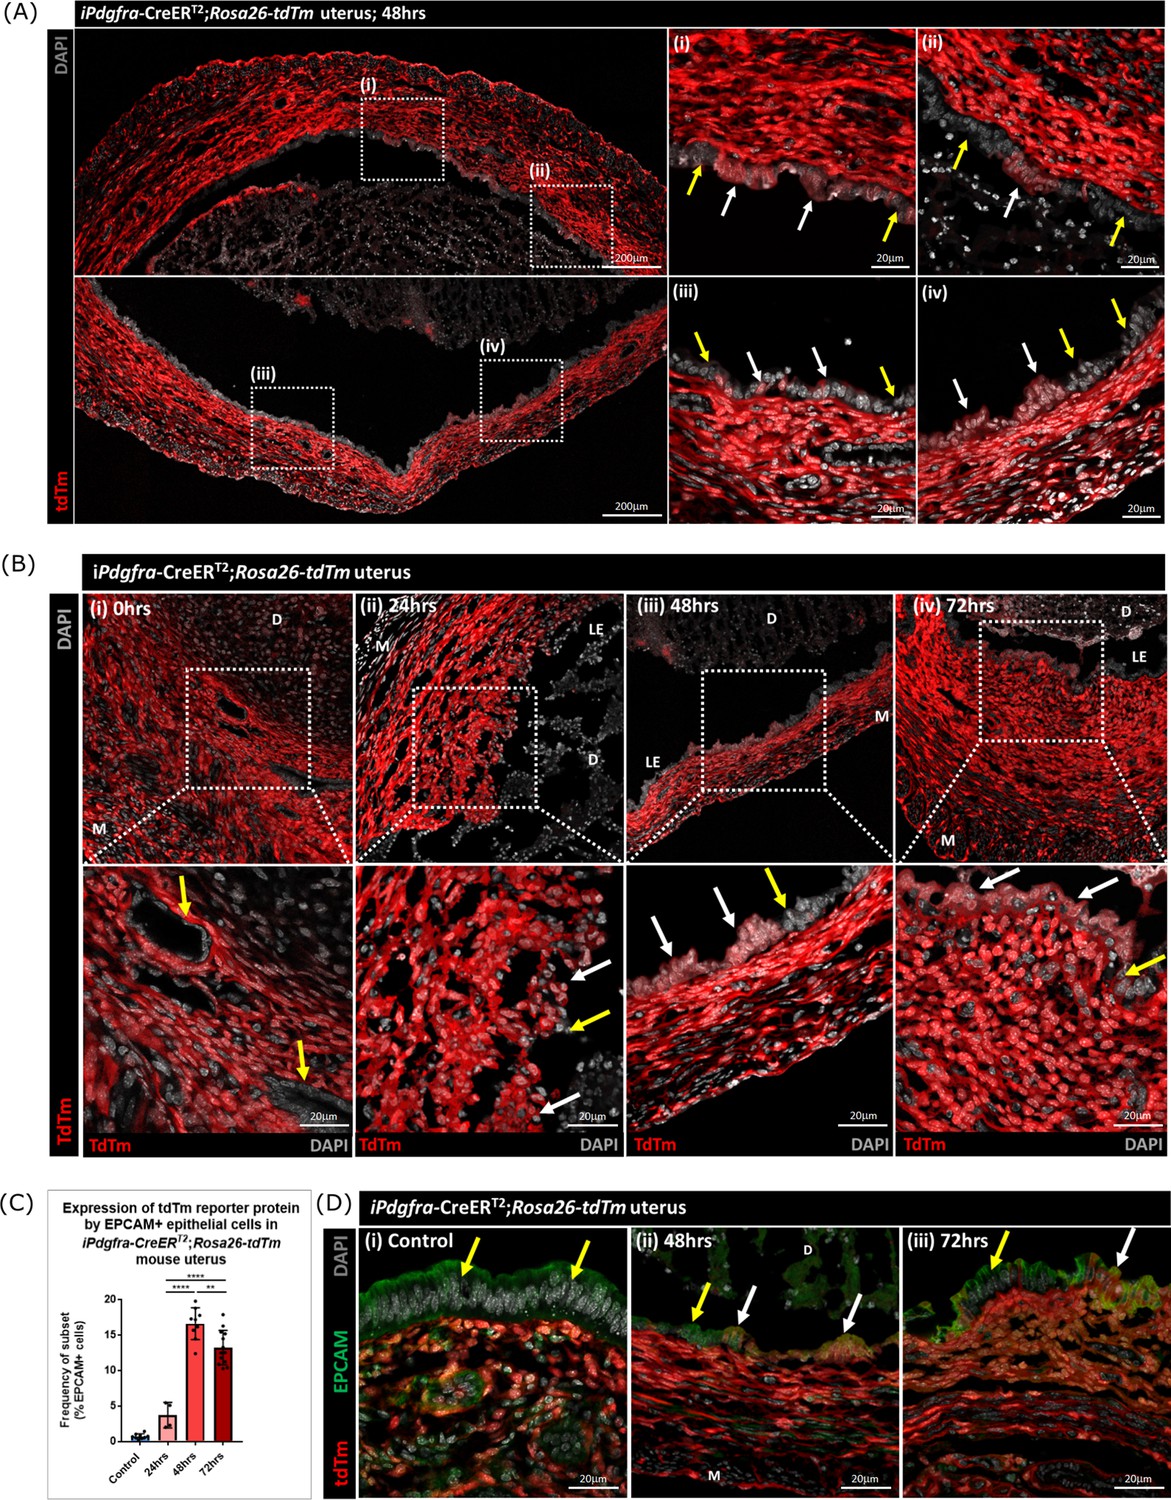
Figure 5 with 2 supplements
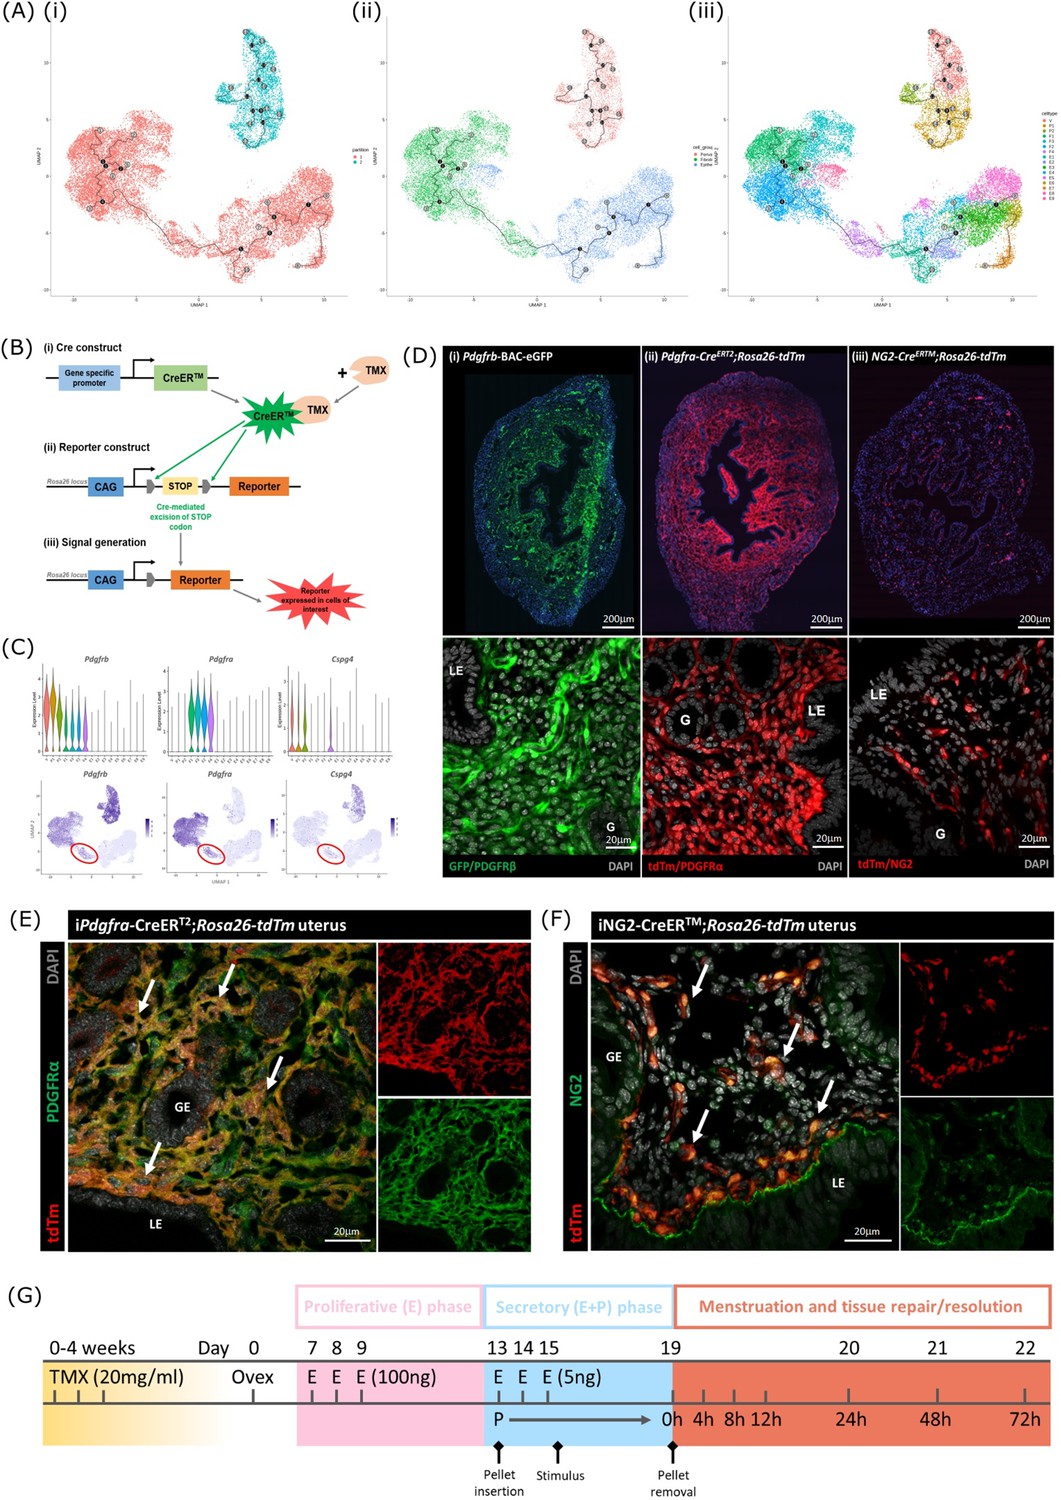
Lineage tracing strategy using inducible cre recombinase system to target mesenchymal subpopulations in endometrium of adult mice.
(A) UMAP visualisation of trajectory analysis. (i) Monocle3 separated data into two ‘partitions’ placing fibroblasts and epithelial cells into the same trajectory. (ii) Monocle3 revealed a putative differentiation trajectory between fibroblasts (green) and epithelial cells (blue) but with no link to perivascular cells (pink). (iii) The trajectory between fibroblasts and epithelial cells runs through the repair-specific fibroblast cluster F4 (black dots: trajectory ‘roots’; black lines: trajectory ‘branches’; grey dots: trajectory ‘end-points’). (B) Schematic: representation of induced reporter expression in cells of interest using the tamoxifen inducible cre recombinase system. (C) Gene expression plots (scRNAseq data): (i) Pdgfrb all mesenchymal cell clusters (ii) Pdgfra fibroblasts, (iii) Cspg4/NG2 perivascular cells no expression of these genes in epithelial cell populations. (D) Expression of reporter proteins: (i) GFP + mesenchyme in Pdgfrb-BAC-eGFP mouse endometrium (see Kirkwood et al., 2021); (ii) tdTm detected in fibroblasts in Pdgfra-creERT2;Rosa26-tdTm mouse endometrium; (iii) tdTm detected in perivascular cells in iNG2-CreERTM;Rosa26-tdTm mouse endometrium. Epithelial cells (LE/G) do not express reporter proteins any of these mice (LE = luminal epithelium, G=epithelial glands). (E) Expression of tdTm reporter and native PDGFRα protein in Pdgfra-creERT2;Rosa26-tdTm mouse endometrium, co-localisation of tdTm and PDGFRα detected throughout (white arrows). (F) Expression of tdTm reporter and native NG2 protein in iNG2-CreERTM;Rosa26-tdTm mouse endometrium, co-localisation of tdTm and NG2 detected throughout (white arrows). (G) Schematic: mouse model of endometrial tissue breakdown and repair modified to include a 3 x injections with TMX followed by a 4 w washout period prior to ovariectomy.
Figure 5—figure supplement 1
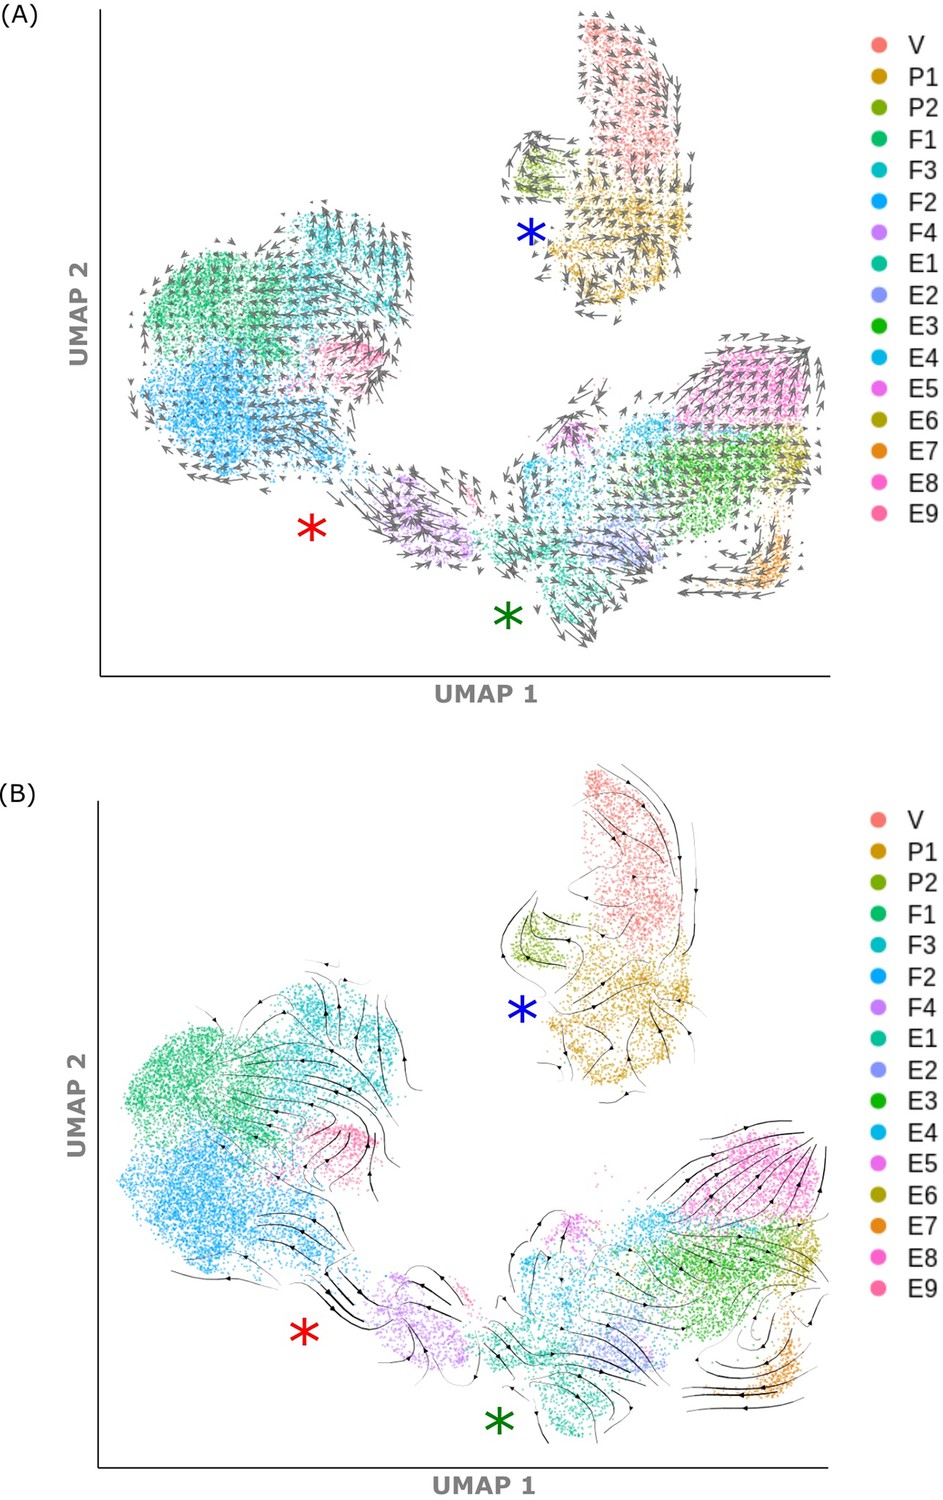
Trajectory Analysis.
(A) UMAP visualisation of scVelo analysis: RNA velocity vectors (grey arrows) superimposed on mesenchymal and epithelial clusters; arrow size = magnitude of residual from unspliced/spliced mRNA ratio. (B) UMAP visualisation of scVelo analysis: RNA velocity vectors (black arrows) visualised using Gaussian smoothing, superimposed on mesenchymal and epithelial clusters; arrow thickness = magnitude of residual from unspliced/spliced mRNA ratio. Red asterisk: F2 to F4 transition, blue asterisk: P1 to P2 transition, green asterisk: E1/2 transition.
Figure 5—figure supplement 2
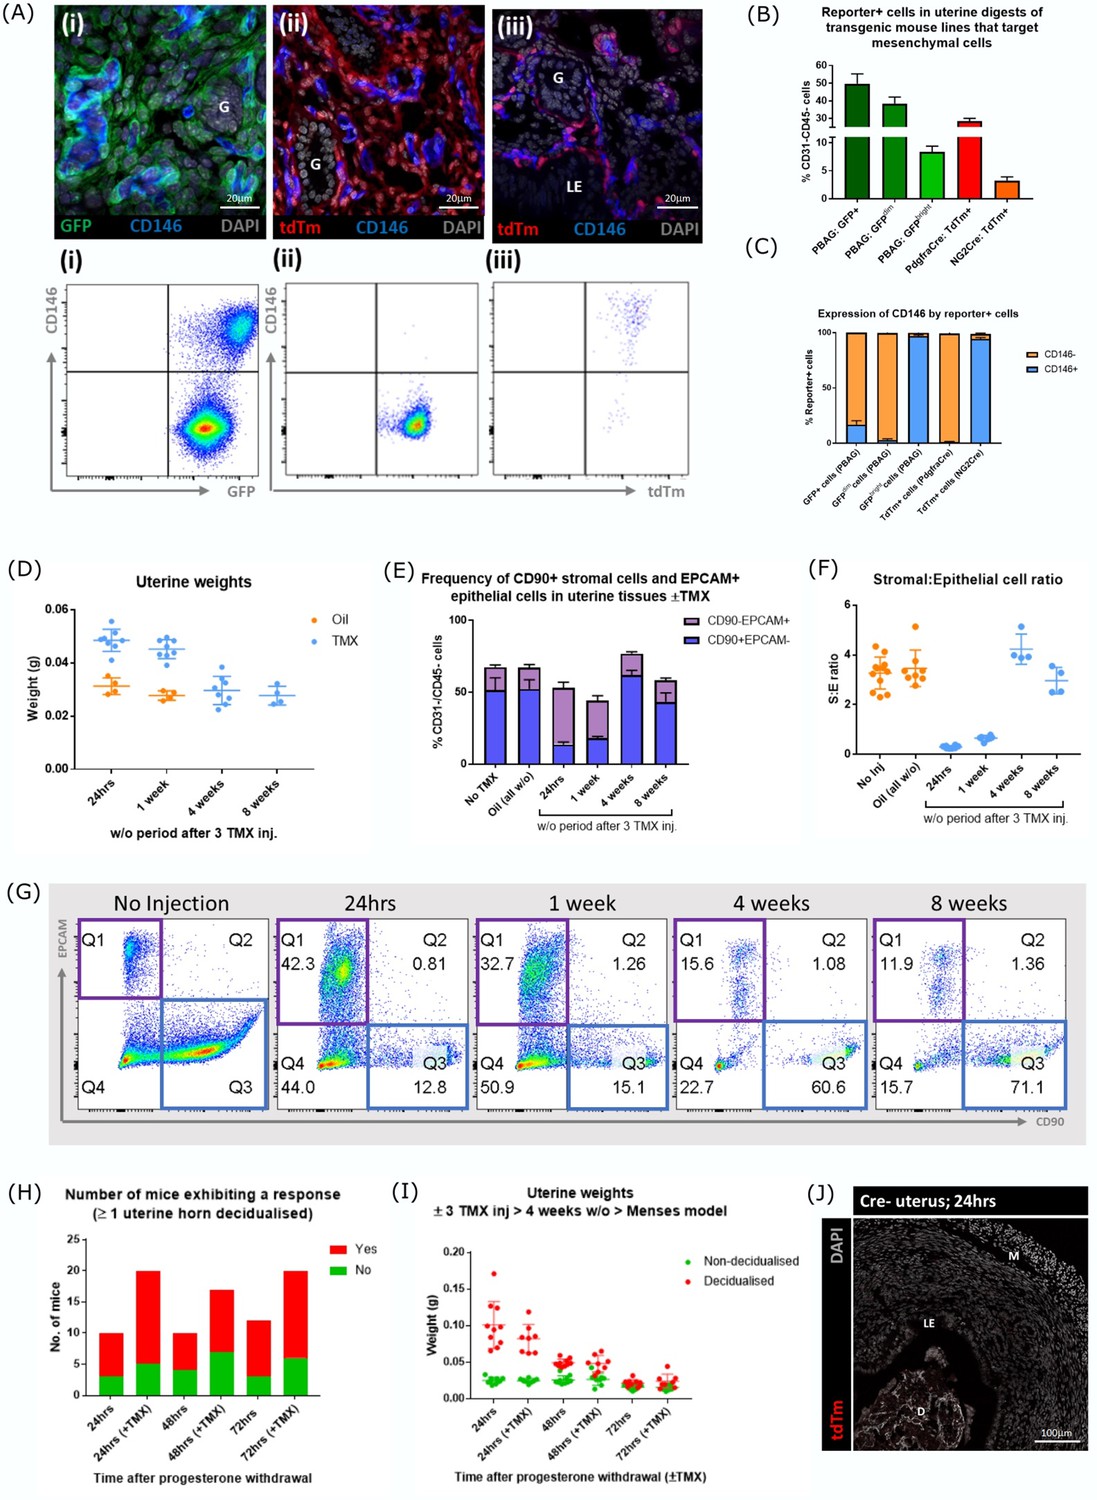
Optimisation of reporter gene expression and wash out following induction of transgenes with Tamoxifen.
(A) Expression of canonical pericyte marker CD146 in steady state/control uterine tissues from different transgenic models. (i) Two populations of cells are present in Pdgfrb-BAC-eGFP uterus: GFP + CD146+perivascular cells and GFP + CD146- stromal fibroblasts (ii) tdTm + cells in Pdgfra-CreERT2;Rosa26-tdTm uterus are CD146- (stromal fibroblast phenotype) in contrast (iii) tdTm + cells in NG2-CreERTM;Rosa26-tdTm uterus are CD146 + (perivascular cell phenotype). (B) Bar plot: quantification of flow data analysing the number of reporter + cells in steady state/control uterine tissues from different transgenic models. (C) Bar plot: quantification of flow data analysing the expression CD146 in different transgenic cell populations from control uterine tissues confirming results of immunohistochemistry. (D) Bar plot: Uterine horn weights from mice treated with oil or 3 x daily TMX analysed after 24 hr, 1, 4, or 8 weeks. TMX treated animals had uterine weights comparable to the control group by 4 weeks. (E–F) Bar plot: quantification of flow data analysing the expression of canonical stromal marker CD90 and epithelial marker EPCAM in uterine tissues from mice treated with oil or TMX analysed after 24 hr, 1, 4, or 8 weeks. The TMX treated animals had a stromal:epithelial cell ratio comparable to the control groups by 4 weeks. (G) Flow cytometry: expression of canonical stromal marker CD90 and epithelial marker EPCAM in uterine tissues from mice treated with oil or TMX – note in line with expectations stimulation of the tissue increased the epithelial compartment (EPCAM+) at 24 hr and 1 week but this was restored to control levels at 4 weeks. (H) Bar plot: Comparison of the number of mice that responded to induction of a decidualisation after initiation of the menstruation model 4 weeks after TMX. (I) Bar plot: Uterine horn weights of mice from the mouse model of induced menstruation (non-decidualised and decidualised horns weighed separately) with and without TMX 4 weeks prior to ovariectomy. (J) No expression of tdTm detected in the uterus from Cre negative tamoxifen treated mice.
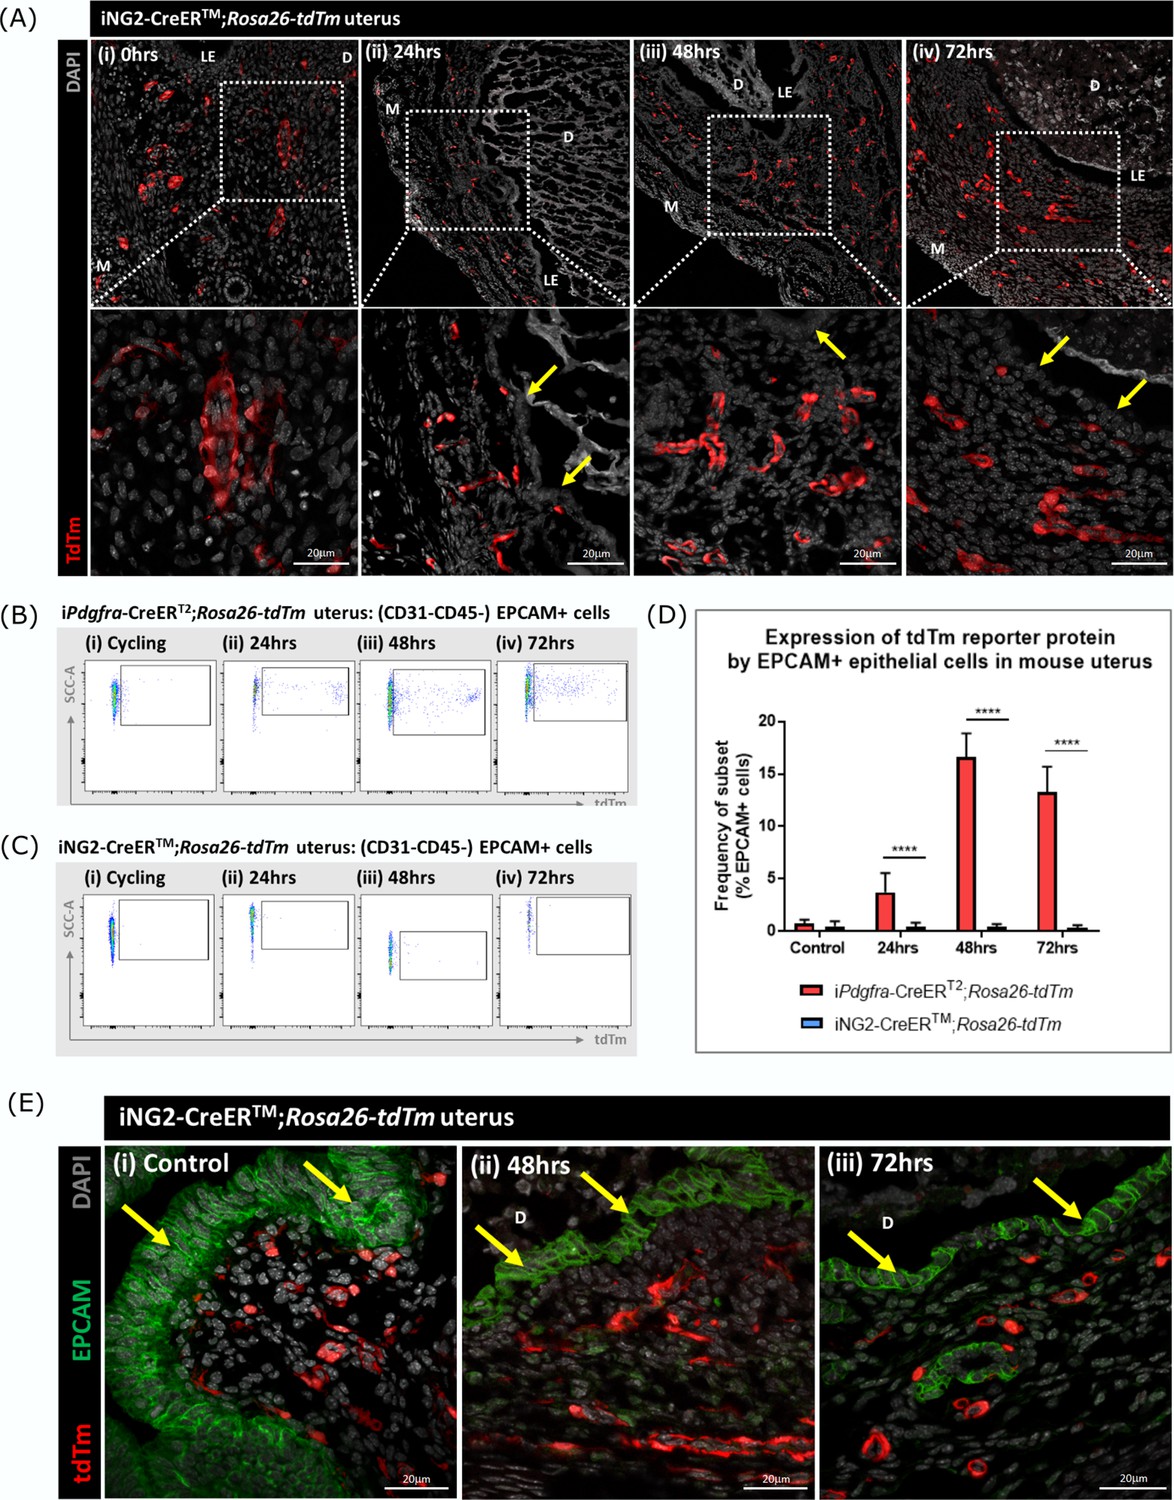
Figure 6

Lineage tracing of PDGFRα + cells identifies a population that undergoes MET.
(A) Analysis of tdTm reporter protein and canonical epithelial cell marker EPCAM in Pdgfra-creERT2;Rosa26-tdTm uterine tissues 24 hr following progesterone withdrawal when the tissue is undergoing simultaneous decidual breakdown and repair. (i-iii) tdTm + EPCAM + cells can be detected in regions where the decidualised tissue is detached and the underlying stromal surface left exposed (white arrows) and (iv) in regions where a new epithelial layer is formed (white arrows) adjacent to tdTm- epithelial cells (yellow arrows). (v) Regions of epithelium where no tdTm + EPCAM + cells were detected exist in other regions of the tissue (yellow arrows). (B) FC: analysis of mesenchymal marker CD90 and epithelial marker EPCAM by tdTm + cells in Pdgfra-creERT2;Rosa26-tdTm uterine tissues 24/48/72 hr following progesterone withdrawal, detection of tdTm + CD90+EPCAM + cells in 24 hr tissues, red box. (C) Bar plot: quantification of tdTm + CD90+EPCAM + cells at 24/48/72 hr in Pdgfra-creERT2;Rosa26-tdTm uterine tissue, calculated as a frequency of tdTm + cells: Control (n=9): 0.45 ± 0.51%; 24 hr (n=4): 19.76 ± 3.24%; 48 hr (n=9): 0.96 ± 0.64%; 72 hr (n=13): 0.48 ± 0.54%; one-way ANOVA; Tukey’s multiple comparisons. (D) FC: analysis of mesenchymal marker CD90 and epithelial marker EPCAM by tdTm + cells in iNG2-CreERTM;Rosa26-tdTm uterine tissues 24/48/72 hr following progesterone withdrawal, no detection of tdTm + CD90+EPCAM + cells in 24 hr tissues, red box. (E) Bar plot: quantification of tdTm + CD90+EPCAM + cells in 24/48/72 hr iNG2-CreERTM;Rosa26-tdTm uterine tissues,, calculated as a frequency of tdTm + cells: Control (n=4): 0.58 ± 0.34%; 24 hr (n=12): 0.64 ± 0.55%; 48 hr (n=6): 0.18 ± 0.29%; 72 hr (n=3): 0.61 ± 0.32%; one-way ANOVA; Tukey’s multiple comparisons. (F) IHC: analysis of tdTm reporter protein and canonical epithelial cell marker EPCAM in iNG2-CreERTM;Rosa26-tdTm uterine tissues 24 hr following progesterone withdrawal when the tissue is undergoing simultaneous decidual breakdown and repair. tdTm + EPCAM and tdTm-EPCAM + cells can be detected in (i) regions where the decidualised tissue is detached and the underlying stromal surface left exposed (white and yellow arrows respectively), (ii) regions where a new epithelial layer is formed and (iii) regions of residual epithelium. No co-localisation of tdTm and EPCAM is detected in any region throughout the tissue.
-
Figure 6—source data 1
Summary statistics for flow cytometry analyses performed in Figure 6C.
- https://cdn.elifesciences.org/articles/77663/elife-77663-fig6-data1-v2.docx
-
Figure 6—source data 2
One-way ANOVA with Tukey’s multiple comparisons test of values in Figure 6C.
- https://cdn.elifesciences.org/articles/77663/elife-77663-fig6-data2-v2.docx
-
Figure 6—source data 3
Summary statistics for flow cytometry analyses performed in Figure 6E.
- https://cdn.elifesciences.org/articles/77663/elife-77663-fig6-data3-v2.docx
-
Figure 6—source data 4
One-way ANOVA with Tukey’s multiple comparisons test of values in Figure 6E.
- https://cdn.elifesciences.org/articles/77663/elife-77663-fig6-data4-v2.docx
Figure 7 with 1 supplement
Lineage tracing studies confirm that epithelial cells derived from PDGFRα+fibroblasts persist in the post repair luminal epithelium.
(A) Analysis of tdTm reporter protein expression in Pdgfra-creERT2;Rosa26-tdTm uterine tissues 48 hr following progesterone withdrawal when the tissue is remodelling and the luminal epithelium is re-instated. (i–iv) tdTm is expressed in stromal fibroblasts throughout the stromal tissue and in some cells in the luminal epithelium (white arrows) adjacent to tdTm- epithelial cells (yellow arrows). (B) IHC: analysis of tdTm reporter protein expression in Pdgfra-creERT2;Rosa26-tdTm uterine tissues 0, 24, 48, and 72 hr following progesterone withdrawal, tdTm + cells are detected within the renewed luminal epithelium at both 48 and 72 hr (white arrows) indicative of long term survival in the new epithelial layer. (C) Bar plot: quantification of FC data analysing EPCAM + cells that express tdTm in Pdgfra-creERT2;Rosa26-tdTm uterine tissues 24, 48, and 72 hr following progesterone withdrawal, calculated as a frequency of EPCAM + cells: Control (n=9): 0.75 ± 0.35%; 24 hr (n=4): 3.73 ± 1.81%; 48 h (n=9): 16.63 ± 2.24%; 72 hr (n=13): 13.26 ± 2.42%; one-way ANOVA; Tukey’s multiple comparisons. (D) IHC: analysis of tdTm reporter and epithelial marker EPCAM expression in Pdgfra-creERT2;Rosa26-tdTm uterine tissues 48 and 72 hr following progesterone withdrawal. (ii-iii) tdTm + EPCAM + cells can be detected in the luminal epithelium at 48/72 hr (white arrows) adjacent to tdTm-EPCAM + epithelial cells (yellow arrows) and are not detected in (i) steady state control tissues.
-
Figure 7—source data 1
Summary statistics for flow cytometry analyses performed in Figure 7E.
- https://cdn.elifesciences.org/articles/77663/elife-77663-fig7-data1-v2.docx
-
Figure 7—source data 2
One-way ANOVA with Tukey’s multiple comparisons test for values in Figure 7C.
- https://cdn.elifesciences.org/articles/77663/elife-77663-fig7-data2-v2.docx
Figure 7—figure supplement 1
Evaluation of cell fate in NG2creER/Rosa26-tdTM reporter mice.
(A) Analysis of tdTm reporter protein expression in NG2-CreERTM;Rosa26-tdTm uterine tissues 0, 24, 48, and 72 hr following progesterone withdrawal. Note tdTm + cells were located throughout the stromal tissue but were never detected within the renewed luminal epithelium (yellow arrows) at any time point (B) Flow quantification of tdTm reporter expression by EPCAM + cells in Pdgfra-CreERT2;Rosa26-tdTm uterine tissues 24, 48, and 72 hr following progesterone withdrawal. (C) Flow quantification of tdTm reporter expression by EPCAM + cells in NG2-CreERTM;Rosa26-tdTm uterine tissues 24, 48, and 72 hr following progesterone withdrawal. (D) Bar plot: quantification of flow data analysing EPCAM + cells that express tdTm in Pdgfra-CreERT2;Rosa26-tdTm or NG2-CreERTM;Rosa26-tdTm uterine tissues 24–72 hr following progesterone withdrawal. Note increase in the % of double positive cells between 24 and 48 hr in the Pdgfra-CreERT2;Rosa26-tdTm but no evidence of co-staining with cells recovered from the NG2 line; one-way ANOVA; Tukey’s multiple comparisons. (E) Analysis of tdTm reporter and epithelial marker EPCAM expression in NG2-CreERTM;Rosa26-tdTm uterine tissues 48 and 72 hr following progesterone withdrawal. (i-iii) No co-localisation of tdTm and EPCAM was detected in steady state control tissues or 48/72 hr tissues, tdTm + cells were located throughout the stroma and EPCAM + cells were located in the luminal and glandular epithelium (yellow arrows).
-
Figure 7—figure supplement 1—source data 1
Sidak’s multiple comparisons test of data from expression of tdTm reporter protein by EPCAM +epithelial cells in mouse uterus following induction with PDGFRalpha or NG2 Cre (shown in D).
- https://cdn.elifesciences.org/articles/77663/elife-77663-fig7-figsupp1-data1-v2.docx
Additional files
-
Supplementary file 1
Details of antibodies used in the study.
(a) Primary and secondary antibodies with associated working dilutions used to detect proteins in mouse uterine tissues. (b) Flow cytometry antibodies selected and optimised to interrogate mesenchymal cell populations in murine uterus.
- https://cdn.elifesciences.org/articles/77663/elife-77663-supp1-v2.docx
-
MDAR checklist
- https://cdn.elifesciences.org/articles/77663/elife-77663-mdarchecklist1-v2.docx
Download links
A two-part list of links to download the article, or parts of the article, in various formats.
Downloads (link to download the article as PDF)
Open citations (links to open the citations from this article in various online reference manager services)
Cite this article (links to download the citations from this article in formats compatible with various reference manager tools)
Single-cell RNA sequencing and lineage tracing confirm mesenchyme to epithelial transformation (MET) contributes to repair of the endometrium at menstruation
eLife 11:e77663.
https://doi.org/10.7554/eLife.77663


