Interaction of human keratinocytes and nerve fiber terminals at the neuro-cutaneous unit
- Department of Neurology, University Hospital of Würzburg, Germany
- Imaging Core Facility, Biocenter, University of Würzburg, Germany
- Department of Biotechnology and Biophysics, University of Würzburg, Germany
Figures
Figure 1 with 4 supplements
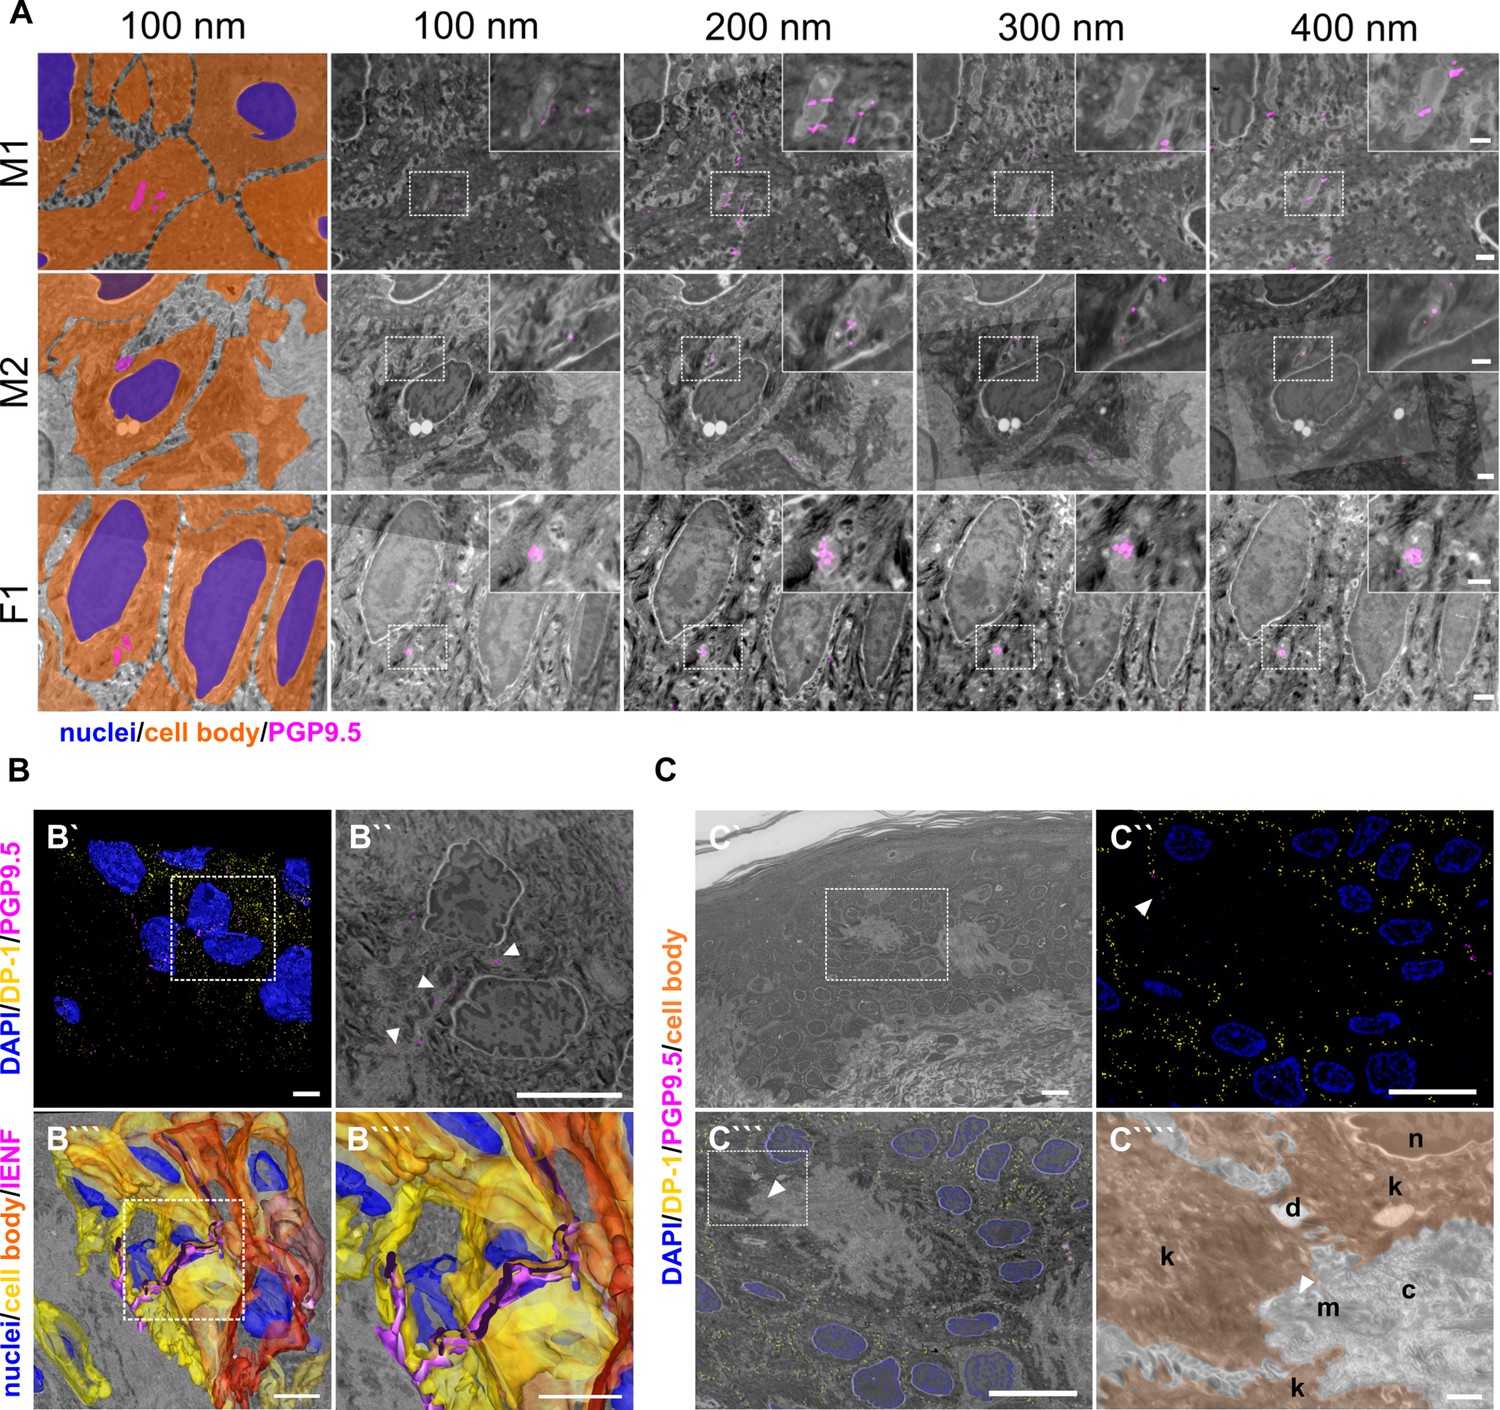
Epidermal nerve fiber ensheathment and srAT functionality.
(A) Ensheathment of IENF by keratinocytes. Nerve fibers projecting within keratinocytes in skin punch biopsy samples of two male (M1, M2) and one female subject (F1). First tile shows keratinocyte cell bodies (orange), nuclei (blue), and fiber (magenta) in pseudo color. Each row represents four consecutive sections with 100 nm thickness of correlated images, with PGP9.5 labeling for IENF (magenta), while dashed insets show higher magnification of the ROI in inlay. See also Figure 1—video 1. Scale bar: 1 µm, magnified insets: 500 nm. (B) 3D reconstruction of IENF processes traversing between and within keratinocytes. (B`) 3D visualization of fluorescence signal from srAT approach, white rectangle indicates area in B``. PGP9.5 (magenta) labeled nerve fiber processes between and in keratinocytes in close apposition to nuclei (blue). DP-1 (yellow) marks intercellular desmosomal junctions as keratinocyte cell boundaries. (B``) Single plane with overlay of PGP9.5 signal and EM. (B```) Extrapolation of IENF trajectory in 3D, based on IF signal and EM ultrastructure with fiber (magenta), keratinocyte cell bodies (yellow-orange), and nuclei (blue); see also Figure 1—video 2. Scale bars: 5 µm. (C) Preservation of antigenicity and cellular structure in LR-White embedded epidermal tissue with overview area from SEM (C`). Scale bar: 10 µm. (C``) SIM image of 100 nm skin section with DP-1 (yellow), PGP9.5 (magenta), and DAPI (blue) labeling. Arrowhead indicates PGP9.5-positive IENF processes. Scale bar: 10 µm. (C```) Correlated SIM and SEM image from dashed rectangle in A. Scale bar: 10 µm. (C````) Inset of c showing subcellular preservation of collagen fibers (c), desmosomes (de), keratinocytes (k), mitochondria (m), and nucleus (n). Arrowhead indicates IENF processes also observed via IF in a. Scale bar 1 µm. Abbreviations: DP-1, desmoplakin 1; IENF, intraepidermal nerve fiber; IF, immunofluorescence; LR-White, London Resin-White; PGP9.5, protein gene product-9.5; SEM, scanning electron microscopy; SIM, structured illumination microscopy.
Figure 1—figure supplement 1

CLEM principle and labeling verification.
(A) Principle of unbiased correlation using intrinsic landmarks. IF channels are locked and hidden behind nuclear DAPI signal, which is used as only visible fluorescent channel, applied as landmark channel (blue). DAPI signal and SEM nucleus texture are used to achieve unbiased correlation of IF and SEM information. After optimization of the correlation, the channels of interest are made visible, overlaid and regions of interest selected. No further changes of image locations were applied afterwards. IF signal specificity. (B) Four consecutive tissue sections with nuclear DAPI (blue), DP-1 (yellow), and PGP9.5 (magenta) labeling showing traceable persistent labeling. Arrowhead indicates PGP9.5 positive nerve fiber and numbers show position of respective nuclei. Nucleus number 2 is ceasing within the z-stack. Scale bar 5 µm. (C) Application of secondary antibodies Al488-anti mouse (green), SeTau-647-anti rabbit (yellow), and Cy3-anti guinea pig (red) alone showed no fluorescent signal. DAPI signal (blue) for orientation. Scale bar 10 µm. Abbreviations: Al488, Alexa Fluor 488; Cy3, cyanine 3; DAPI, 4',6-diamidino-2-phenylindole; DP-1, desmoplakin 1; IF, immunofluorescence, PGP9.5, protein product 9.5 SEM, scanning electron microscopy.
Figure 1—figure supplement 2

Utility of srAT for tracing skin cells.
(A) Epidermis with keratinocytes [K] and Langerhans cell [LC]. (B) Single z-sections of outlined areas. LC was identified via S100β (red). Arrowheads indicate LC protrusions in contact to K. (C) Upper dermis and basement membrane (dashed line) with basal keratinocytes [BK] and dermal Schwann cell [DSC]. (D) Single Z-sections of outlined areas. DSC was identified via PGP9.5 (magenta) and S100β (red) labeling. Dermal fiber processes are enwrapped by DSC, indicated with arrowheads. Inset in last panel shows magnification of marked fiber. Scale bars 5 µm (A, C), 1 µm (B, D), and 500 nm (inset in D). Abbreviations: BK, basal keratinocyte; DSC, dermal Schwann cell; K, keratinocyte; LC, Langerhans cell; PGP9.5, protein product 9.5; S100β, S100 calcium binding protein B.
Figure 1—video 1
srAT with serial 100 nm sections with one frame per second.
PGP9.5 (magenta) marks IENF ensheated within keratinocytes, indicated by white arrowhead. Scale bar: 5 µm. Abbreviations: IENF, intraepidermal nerve fiber; PGP9.5, protein product 9.5; srAT, super-resolution array tomography.
Figure 1—video 2
srAT with serial 100 nm SEM sections and 3D interpolation of keratinocyte nuclei (blue), keratinocyte cell bodies (yellow-orange), and IENF (magenta).
Four sections per second. Scale bar: 5 µm. Abbreviations: IENF, intraepidermal nerve fiber; SEM, scanning electron microscopy; srAT super-resolution array tomography.
Figure 2 with 2 supplements
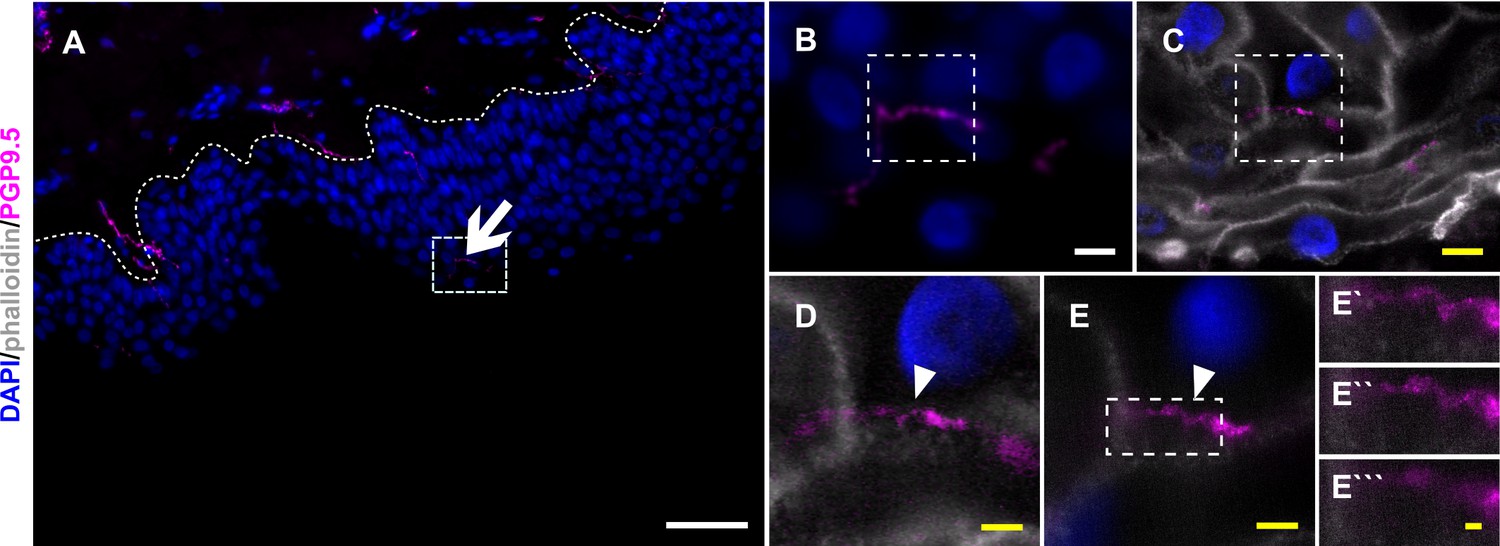
Nerve fiber ensheathment in expanded human skin tissue.
(A) Overview of skin section prior to expansion with PGP9.5-positive IENF (magenta) and nuclear DAPI (blue) signal; dotted line marks epidermis-dermis border and arrow indicates IENF. White rectangle highlights inset enlarged in B. (B) Enlarged area prior to expansion and (C) matched area post-expansion at same magnification with addition of actin marker phalloidin (grey), white rectangles mark inset area of D and E. (D) Enlarged area containing IENF at 20 x magnification and (E) at 63 x magnification with arrowheads indicating IENF passing through keratinocyte. Inset in E marks enlarged area in E`-E```. (E`) shows z-plane prior to E, (E``) same z-plane as E, and E``` z-plane step after E. White scale bars indicate pre-expansion state, yellow scale bars were corrected for expansion factor. Scale bars: 50 µm (A), 5 µm (B, C), 2 µm (d, e), 500 nm (E```). Z-step size of 1.2 µm translates to approximate 276 nm in expanded gel. Abbreviations: DAPI, 4',6-diamidino-2-phenylindole; IENF, intraepidermal nerve fiber; PGP9.5, protein gene product-9.5.
Figure 2—figure supplement 1

Assumed TRPV1 localization in expanded skin tissue section.
TRPV1 signal was predominantly localized to keratinocyte membrane and cytoplasm (A). Dashed line indicates dermal-epidermal border. Within the dermis, TRPV1 clusters were visible at PGP9.5-positive fibers after expansion (B, C) in the respective inset of A. (C) represents a maximum z-projection after expansion, while a single plane is shown in (D). (D`) shows inset from (D) with PGP9.5 and TRPV1 signal as overlay and (D``) only TRPV1 label. Arrowheads indicate TRPV1-positive regions. As seen in (C), TRPV1 signal was also detected in areas presumably not containing cells and superimposed with nuclear areas. Scale bars (A) 20 µm, (B–D) 5 µm, (D`–D``) 1 µm. Abbreviations: DAPI, 4',6-diamidino-2-phenylindole; PGP9.5, protein product 9.5; TRPV1, transient receptor potential vanilloid 1.
Figure 2—video 1
Ensheathment and Cx43 plaque in expanded human epidermis.
Magnification with filled arrowhead indicating part of an IENF, labeled via PGP9.5 (magenta), tunneling through a keratinocyte, labeled via phalloidin (grey). Additional hollow arrowhead showing a Cx43 plaque in contact with IENF. Physical 1.2 µm stack step size, translating to 276 nm biological step size. Framerate of two planes per second. Expansion factor corrected scale bar 1 µm. Abbreviations: Cx43, connexin 43; IENF, intraepidermal nerve fiber; PGP9.5, protein gene product-9.5.
Figure 3
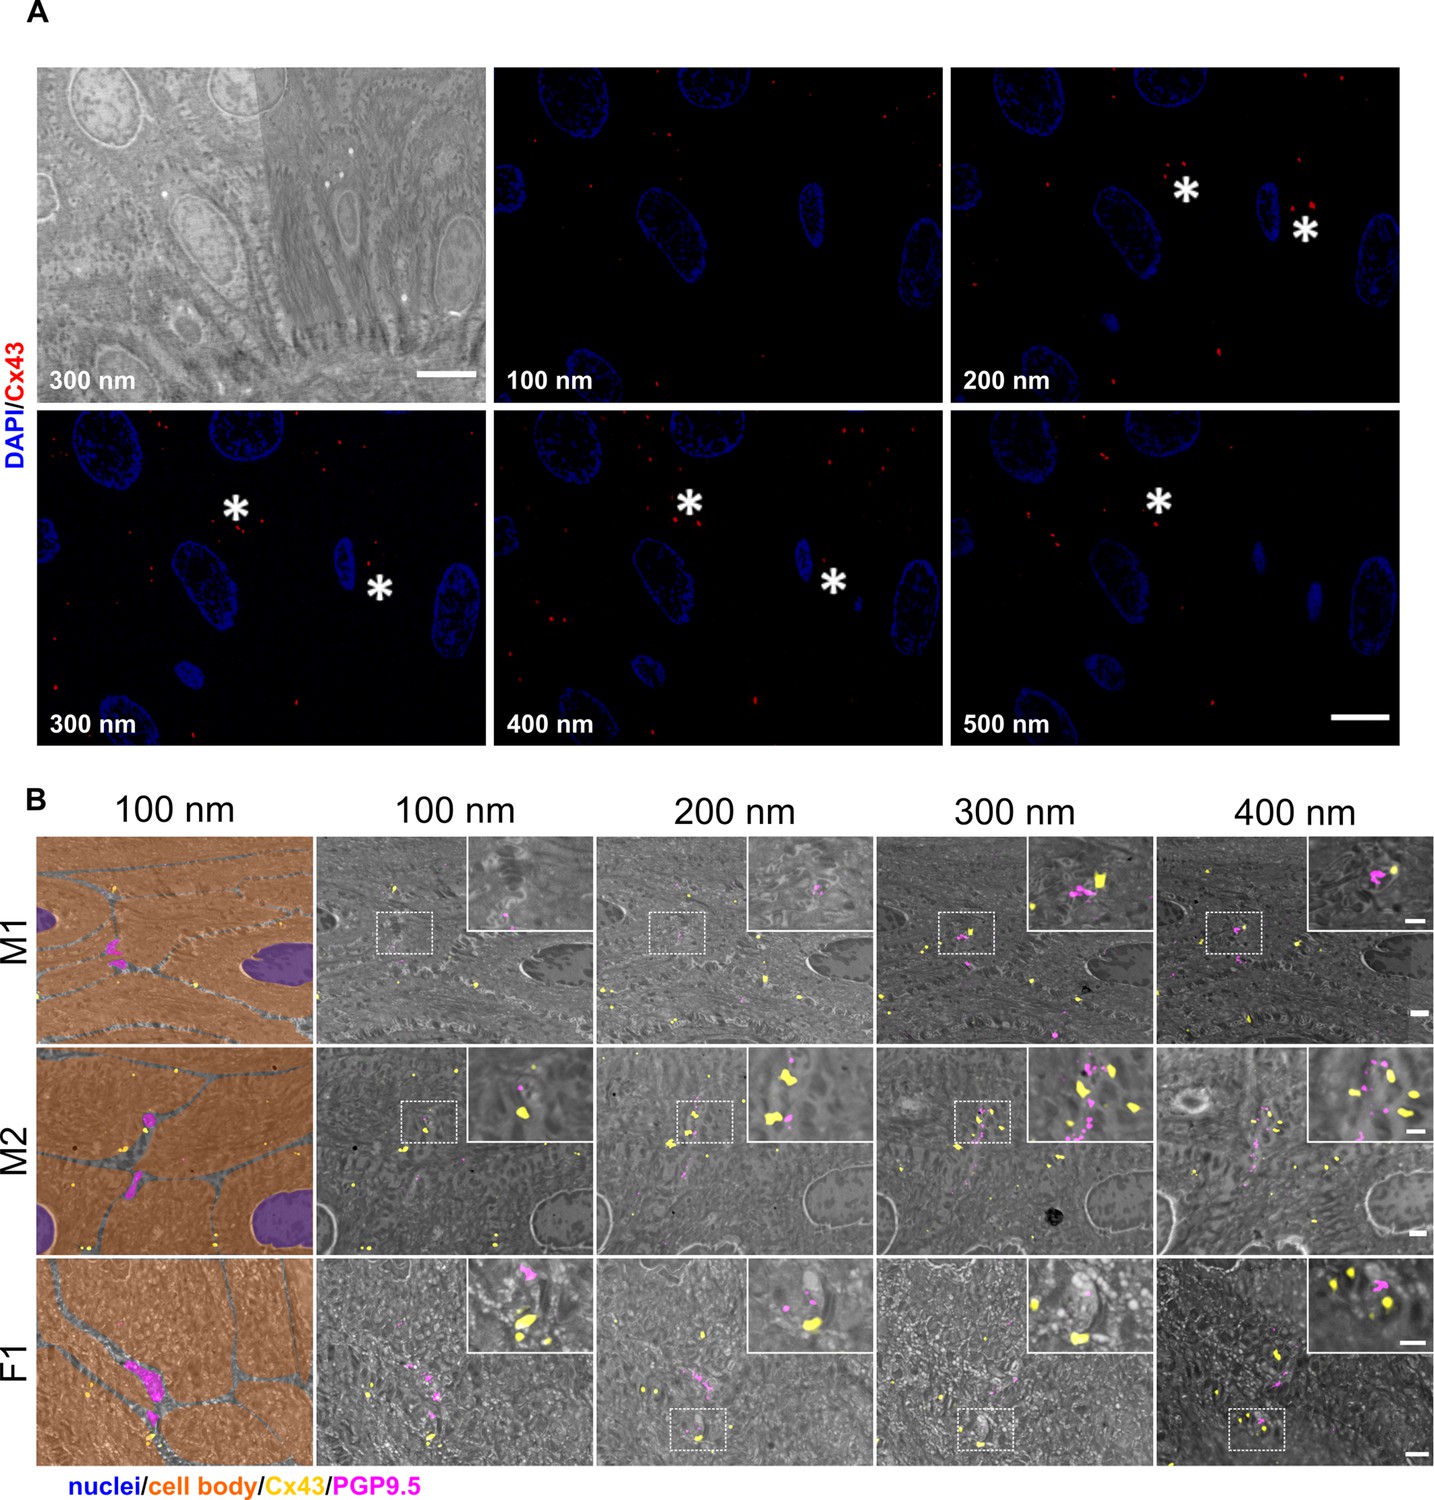
Identification of Cx43 plaques via srAT.
(A) Tracking of Cx43 plaques in epidermal layers. First panel illustrates SEM overview of epidermal layers corresponding to five consecutive sections of IF images showing Cx43 signal (red) and nuclei (blue). Asterisks mark examples of traced Cx43 plaques. (B) Cx43 plaques at keratinocyte-nerve fiber close contact sites. Nerve fibers processing between keratinocytes in skin samples of two male subjects (M1, M2) and one female subject (F1). Each row represents four consecutive sections of 100 nm thickness. First tile shows keratinocyte cell bodies (orange), nuclei (blue), and nerve fibers (magenta) in pseudo color with Cx43 signal (red). Correlated PGP9.5 labeling (magenta) locates at nerve fibers and Cx43 labeling (yellow) indicates Cx43 plaques. Insets show magnification of contact area. Scale bars: 5 µm (A), 1 µm (B), magnified insets: 500 nm. Abbreviations: Cx43, connexin 43; IF, Immunofluorescence; PGP9.5, protein gene product-9.5; SEM, scanning electron microscopy.
Figure 4
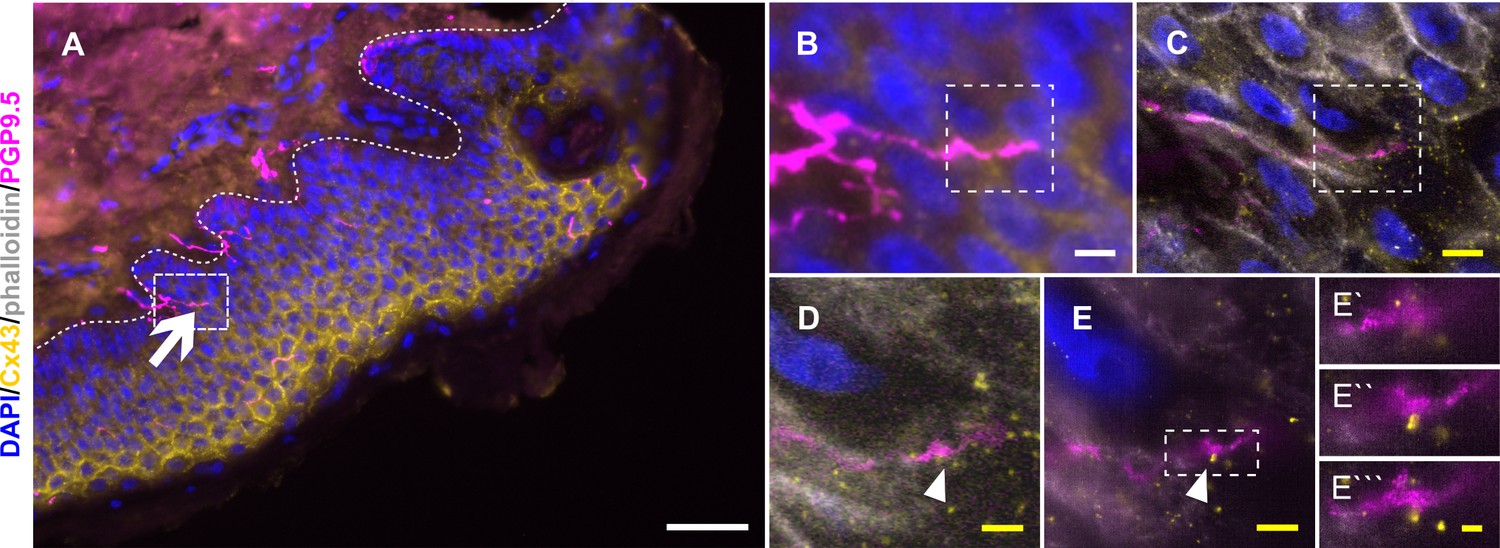
Cx43 accumulation at keratinocyte-nerve fiber contact sites in expanded human epidermis.
(A) Overview of skin section prior to expansion with PGP9.5-labeled IENF (magenta), Cx43 (yellow), and nuclear DAPI (blue); dotted line illustrates epidermis-dermis border and arrow indicates IENF. White rectangle marks inset enlarged in B. (B) Enlarged area prior to expansion and (C) matched area post-expansion at same magnification with addition of actin marker phalloidin (grey); white rectangles mark inset area of D and E. (D) Enlarged IENF area at ×20 magnification and (E) at ×63 magnification with arrowheads indicating Cx43 plaque at IENF. Inset in E marks enlarged area in E`-E```. (E`) shows z-plane prior to E, (E``) same z-plane as E, and E``` z-plane step after E. White scale bars indicate pre-expansion state, yellow scale bars are corrected for expansion factor. Scale bars: 50 µm (A), 5 µm (B, C), 2 µm (D, E), 500 nm (E`-E```). Z-step size of 1.2 µm translates to approximate 274 nm in expanded gel. Abbreviations: Cx43, connexin 43; IENF, intraepidermal nerve fiber; PGP9.5, protein gene product-9.5.
Figure 5 with 1 supplement
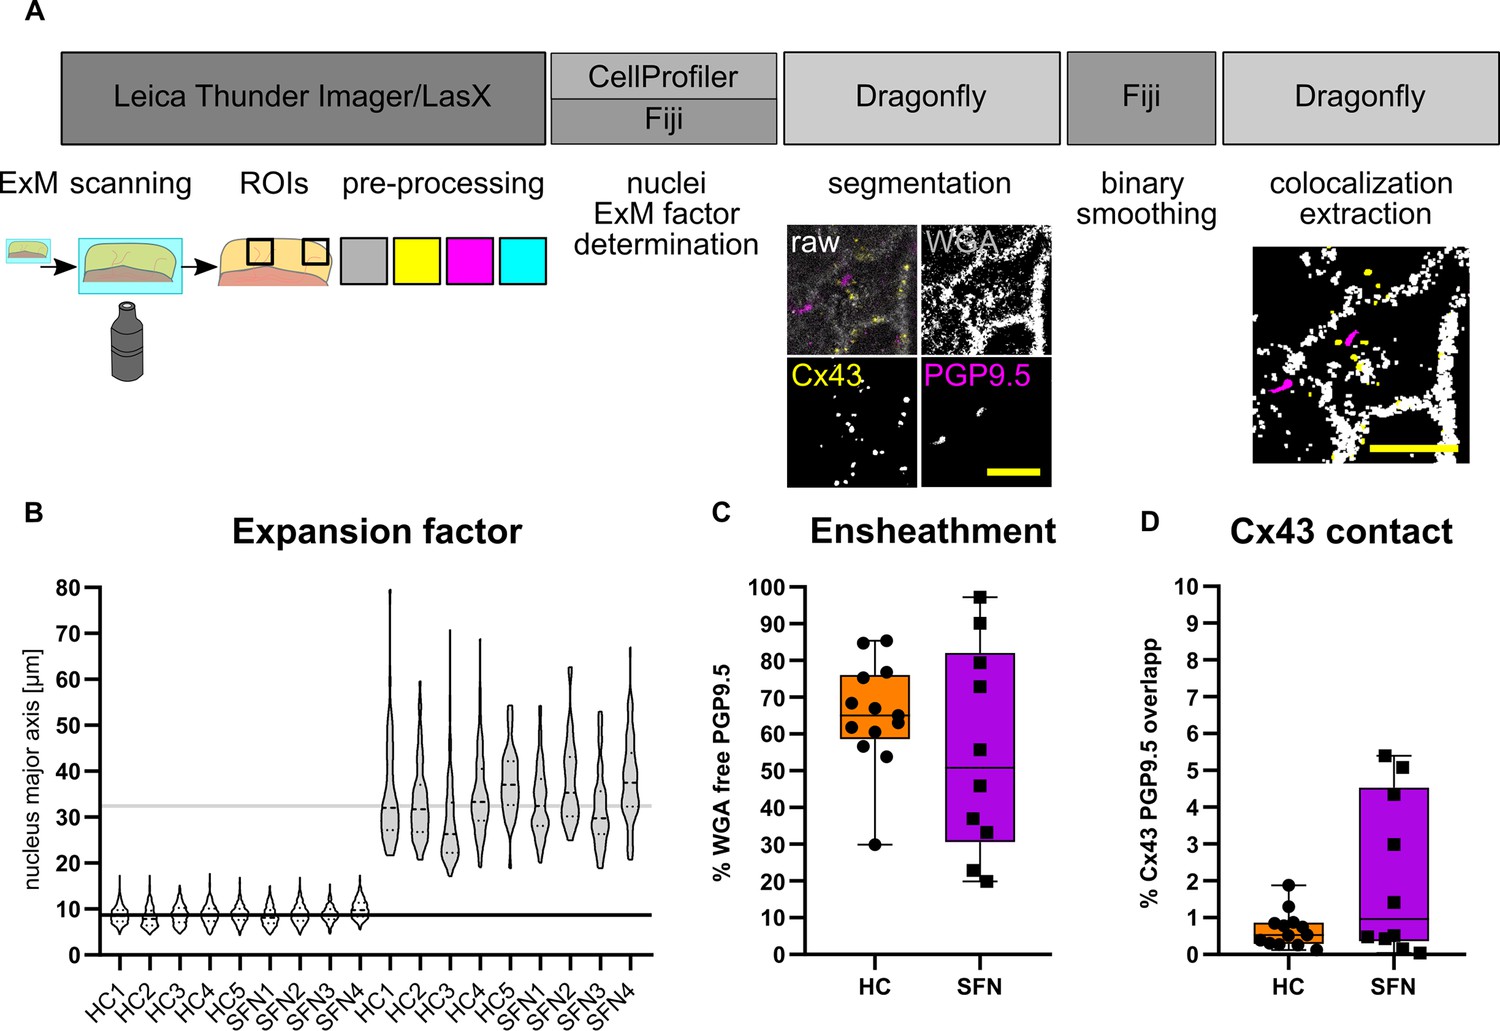
Quantitative assessment of morphological parameters at the NCU.
(A) Workflow for ensheathment and Cx43 quantification (see also Figure 5—video 1). (B) Magnitude of skin tissue expansion across investigated sections via comparison of epidermal nuclei. Median nucleus size between samples pre-ExM (8.73±0.54 µm) and post ExM (32.46±3.54 µm) denotes a median ExM factor of 3.83±0.36. (C) Extracted fiber ensheathment ratio (PGP9.5-positive px without WGA pixel co-localization divided by total PGP9.5 px count) in HC versus SFN patients. (C) Extracted fiber ratio (total PGP9.5 px versus PGP9.5 non WGA overlap px) in HC versus SFN patients (n=13 HC and 10 HC ROIs from n=5 HC and n=4 SFN samples; p=0.41; shown as box & whiskers plot with minimum and maximum). (D) Cx43 contact ratio (PGP9.5 px with Cx43-WGA double positive px divided by total PGP9.5 px) in HC versus SFN (n=13 HC and 10 SFN ROIs from n=5 HC and n=4 SFN samples; p=0.34; shown as box & whiskers plot with minimum and maximum). Expansion factor corrected scale bars (yellow) of exemplary segmentation: 5 µm. See also Figure 5—source data 2. Abbreviations: HC, healthy control; Cx43, connexin 43; NCU, neuro-cutaneous unit; PGP9.5, protein gene product 9.5; px, pixel; SFN, small fiber neuropathy; WGA, wheat germ agglutinin.
-
Figure 5—source data 1
Descriptive data and values for nucleus based calculation of expansion factors.
- https://cdn.elifesciences.org/articles/77761/elife-77761-fig5-data1-v1.xlsx
-
Figure 5—source data 2
Statistical details and input values for Figure 5C and D.
- https://cdn.elifesciences.org/articles/77761/elife-77761-fig5-data2-v1.xlsx
Figure 5—video 1
Image processing of quantification pipeline.
Comparison of raw ROI of IENF after 4 x ExM (part1), with machine learning segmentation (part 2), and after final binary smoothing (part 3). Eight z-sections per second with 99 z-sections. ExM adjusted Scale bar: 10 µm.
Figure 6 with 3 supplements
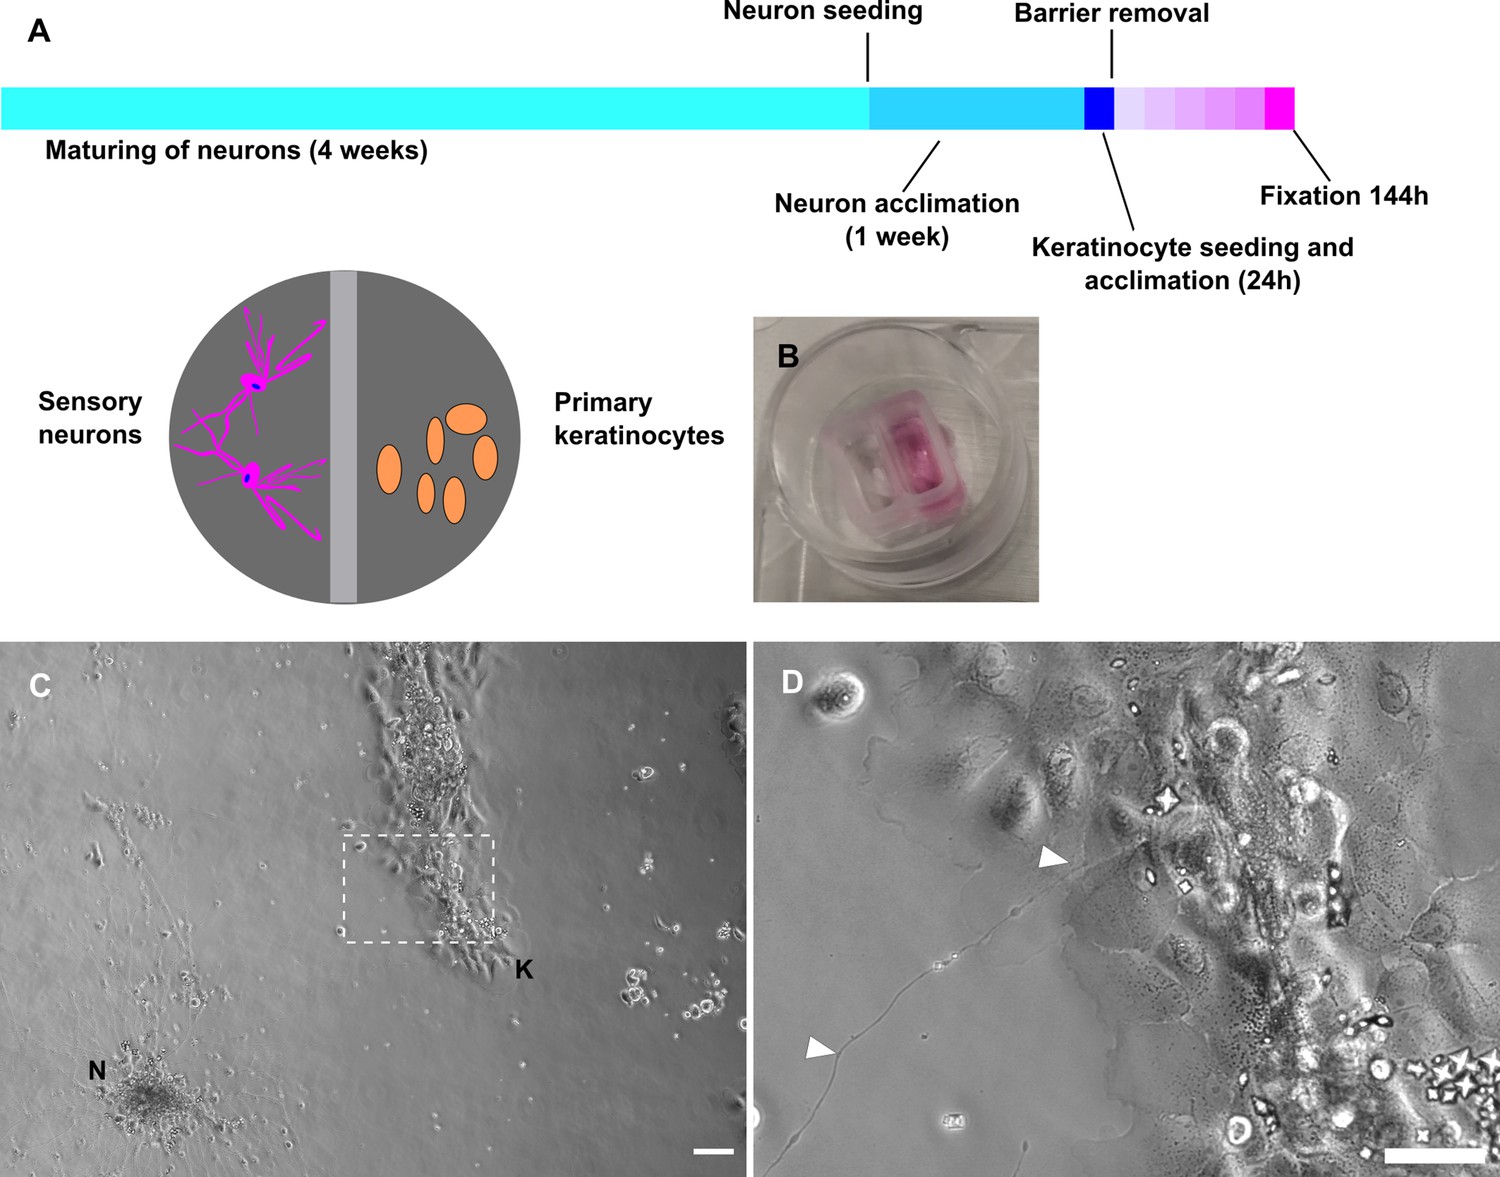
Fully human sensory neuron-keratinocyte co-culture model.
(A) Timeline of culturing protocol and compartment scheme. (B) Chamber system. (C) Overview of co-culture after 115 h in conditioned neuronal medium with neuronal cluster [N] and keratinocyte colony [K]. Inset (D) shows a single neurite in contact with keratinocytes (arrowheads). Co-culture kept in conditioned neuronal medium. Scale bars: 100 µm (C), magnified inset: 50 µm (D). See also Figure 6—video 1. Abbreviations: K, keratinocyte colony; N, neuronal cluster.
Figure 6—figure supplement 1
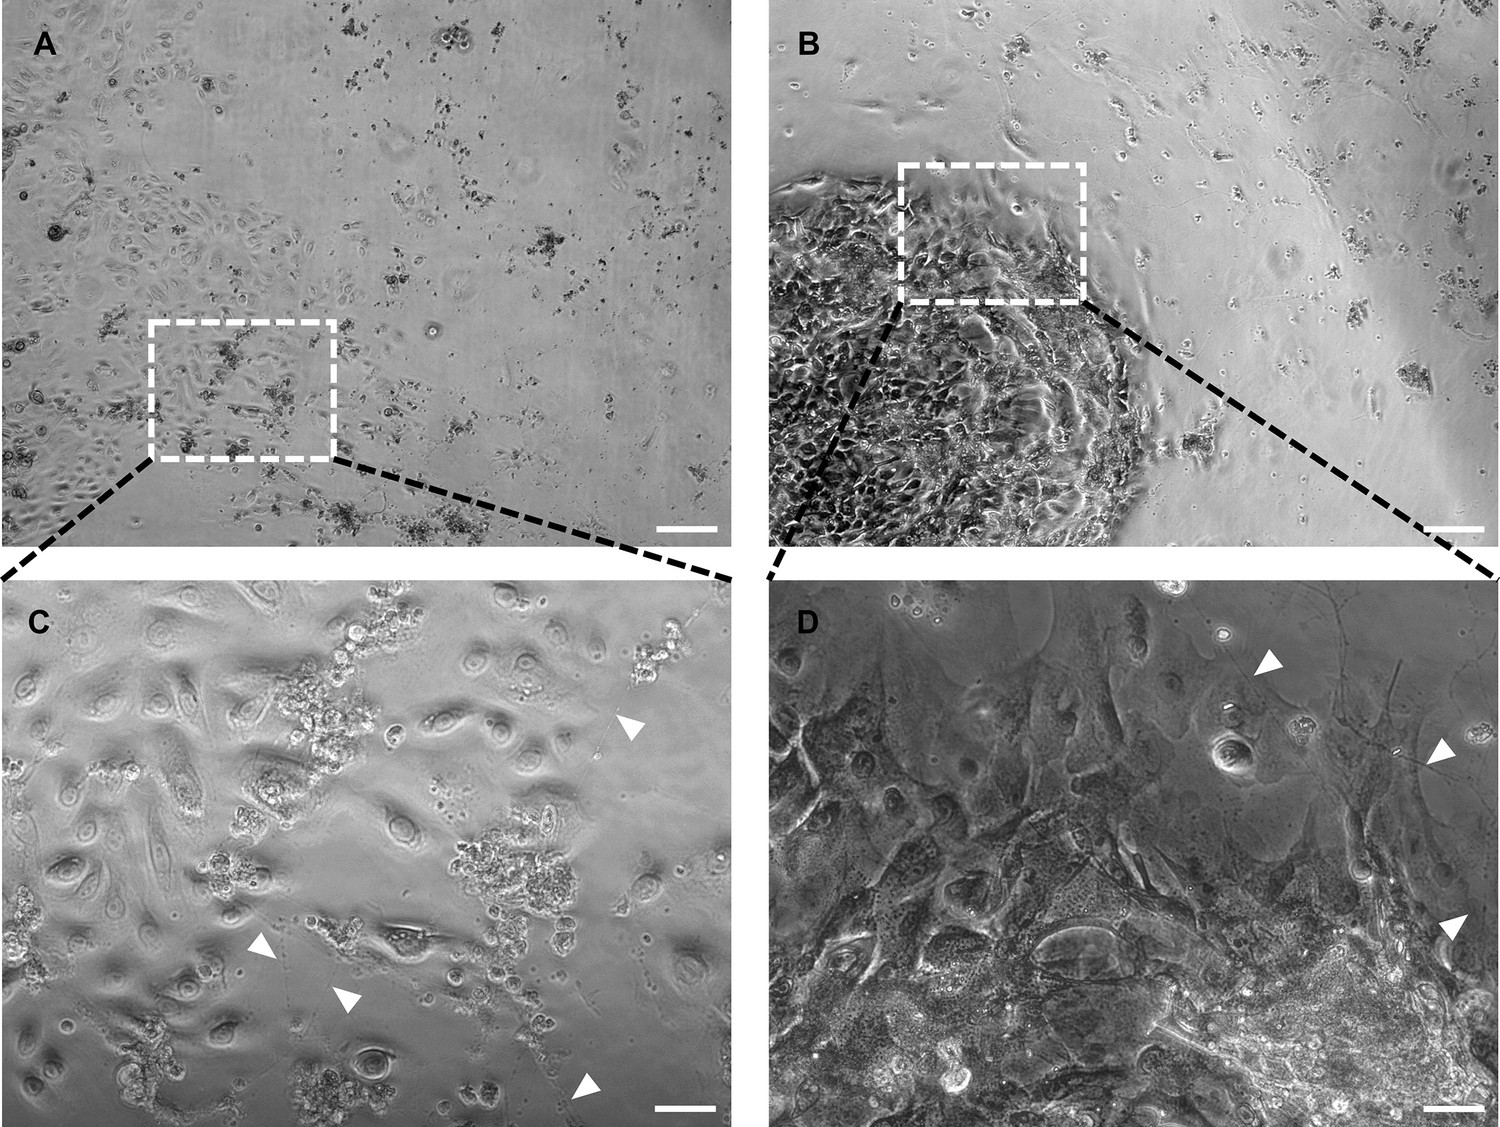
Comparison of co-culture dependent on media condition.
Overview of contrast imaged co-culture in keratinocyte medium (A) and conditioned neuronal medium (B) imaged with 5 x objective. Insets represent enlarged areas in C and D at 20 x objective. Single keratinocytes show basal or early differentiated state in keratinocyte medium (C), whereas differentiated and aggregated keratinocytes are predominant in conditioned neuronal medium (D) Arrowheads indicate passing neurites. Scale bars: 200 µm (A, B) and 50 µm (C, D).
Figure 6—figure supplement 2
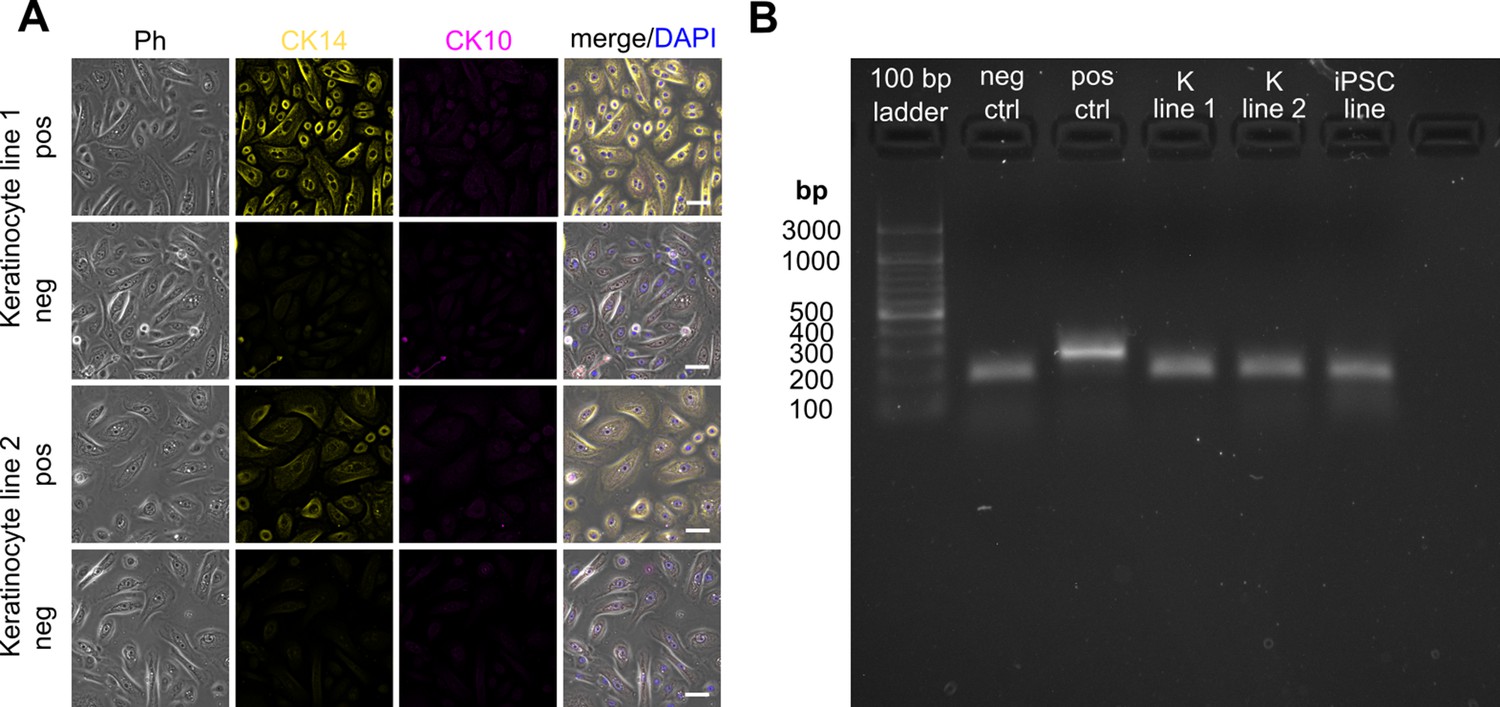
Keratinocyte characterization and mycoplasma screen.
Keratinocytes showed a typical cobblestone morphology and were positive for basal keratinocyte marker cytokeratin 14, but negative for terminal differentiation marker cytokeratin 10 when primary and secondary antibodies were applied (pos) and no labeling (neg) was observed for secondary antibodies labeling only (A). Cells were imaged on ThunderImager with a K5 monochrome camera with HC PL FLUOTAR 40 x/0.80 PH2 (all Leica Microsystems, Wetzlar, Germany) and same min/max values applied to the respective channels for both cell lines and their corresponding negative controls. No mycoplasma contamination was detected in the used cell lines (B). Scale bars: 50 µm. Abbreviations: bp, base pairs; CK10, cytokeratin 10; CK14, cytokeratin 14; DAPI, 4', 6-diamidino-2-phenylindole; iPSC line, induced pluripotent stem cell line; K line 1, keratinocyte line 1; K line 2, keratinocyte line 2; neg ctrl, negative control; Ph, phase contrast; pos ctrl, positive control.
Figure 6—video 1
Live imaging of fully human sensory neuron-keratinocyte co-culture with neurite establishing contact to keratinocyte colony.
Arrowheads indicate outgrowing neurite. Framerate of eight time points per second with 20 min intervals per time point. Scale bar: 50 µm.
Figure 7
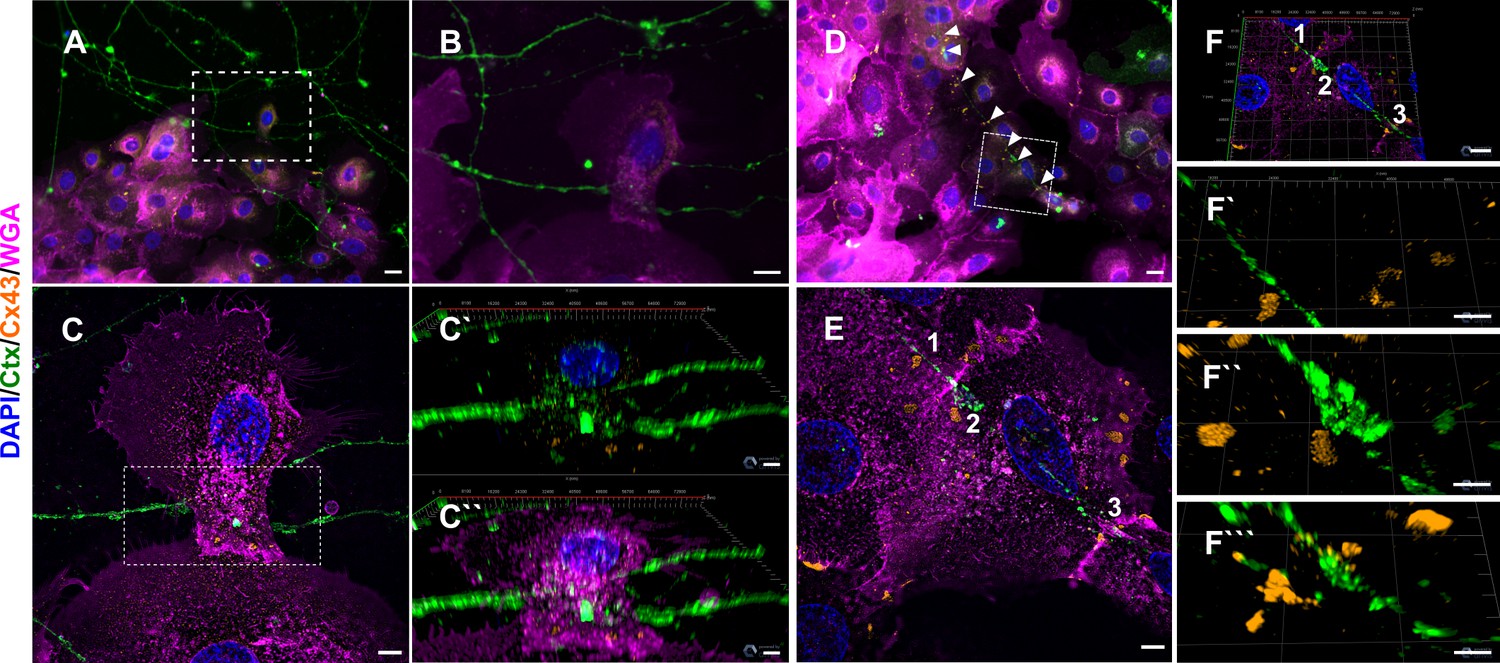
Neurite ensheathment and Cx43 plaques in full human co-culture model.
(A) Confocal overview image of Ctx-positive sensory neurites (green), Cx43 positive (orange) keratinocytes with membrane labeling of keratinocytes via WGA (magenta) and nuclear DAPI (blue). (B) Inset of ensheathment area from A. (C) Single plane lattice SIM image and respective inset area with 3D visualization of z-stack (2.925 µm depth, 0.196 µm steps) showing nucleus, Cx43, and neurite signal (C`) and including WGA (C``). (D) Confocal overview image of Ctx-positive sensory neurites (green), Cx43-positive (orange) keratinocytes with membrane labeling of keratinocytes via WGA (magenta), and nuclei (blue). Arrowheads indicate Cx43 - neurite contact areas. (E) Single plane lattice SIM image and respective inset area with 3D visualization, numbers represent single Cx43 plaques (F) of z-stack (2.925 µm depth, 0.196 µm steps). (F`-F```) detailed neurite - Cx43 contact areas. Co-culture kept in keratinocyte medium. Scale bars: 20 µm (A, D), 5 µm (C-C``, E, F`-F````), 1 µm (F). Abbreviations: Ctx, cholera toxin subunit B; Cx43, connexin 43; DAPI, 4',6-diamidino-2-phenylindole; SIM, structured illumination microscopy; WGA, wheat germ agglutinin.
Figure 8 with 1 supplement
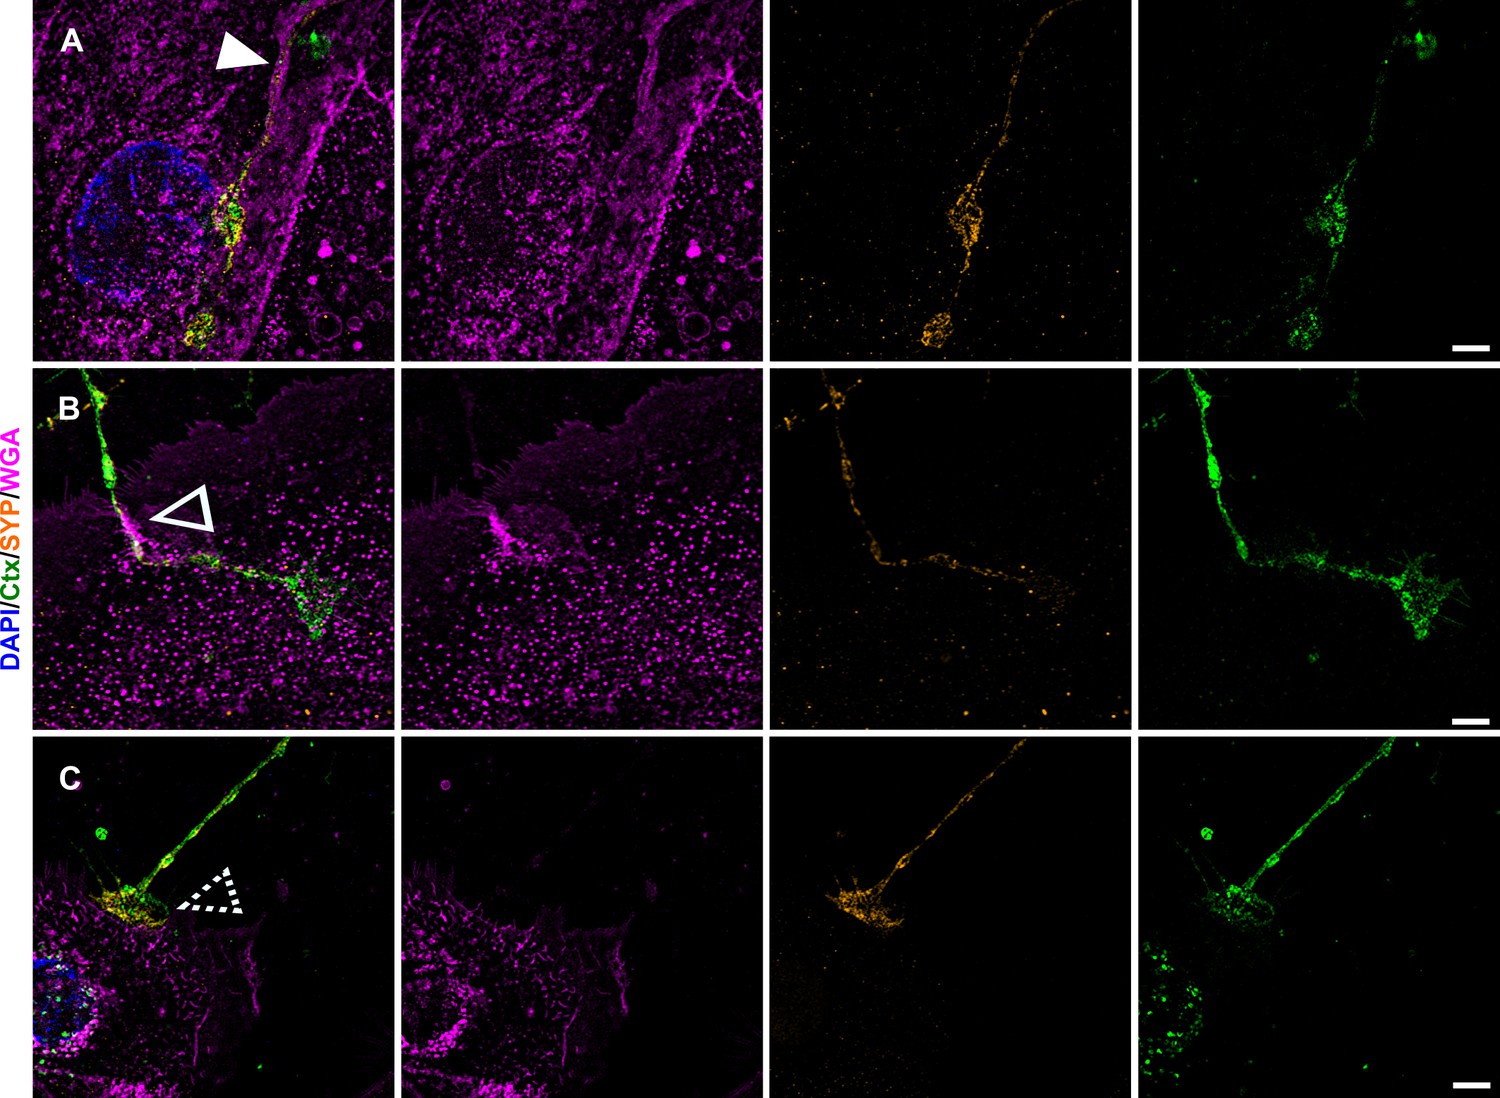
Keratinocyte-neurite interactions and synaptic vesicular SYP distribution.
Single plane lattice SIM images with overlay of nuclear DAPI (blue), WGA (magenta), SYP (yellow), and Ctx (green) signal as first panel, followed by single channel images of WGA, SYP, and Ctx. Distinct contact sites with gutter like structure (A) indicated by filled arrowhead, enwrapping (B) indicated via empty arrowhead, and bouton-like contact (C) indicated via dashed arrowhead were observed in human keratinocyte-sensory neuron co-culture. SYP signal in A-C is predominantly restricted to neurites with sparse dotted labeling in keratinocytes. Co-culture kept in keratinocyte medium. Scale bars: 5 µm. Abbreviations: Ctx, cholera toxin subunit B; DAPI, 4',6-diamidino-2-phenylindole, SIM, structured illumination microscopy; SYP, synaptophysin; WGA, wheat germ agglutinin.
Figure 8—figure supplement 1

Neurite outline and synaptic vesicular SYP localization.
(A) Overview images of neuronal culture with DAPI (blue), Ctx (green), pan-NF (yellow), and SYP (magenta). Insets indicate enlarged areas in B and C. (B, C). First panel shows overlay of neurofilament marker pan-NF and SYP with apparent extra neuronal SYP accumulations (indicated via arrowheads). Second panel shows neurite membrane marker Ctx. Last panel depicts overlay, revealing SYP signal located within the outline of neurites. Scale bars: 5 µm (A), 1 µm (B, C). Ctx, cholera toxin subunit B; DAPI, 4',6-diamidino-2-phenylindole, pan-NF, pan-neurofilament; SIM, structured illumination microscopy; SYP, synaptophysin.
Figure 9 with 1 supplement
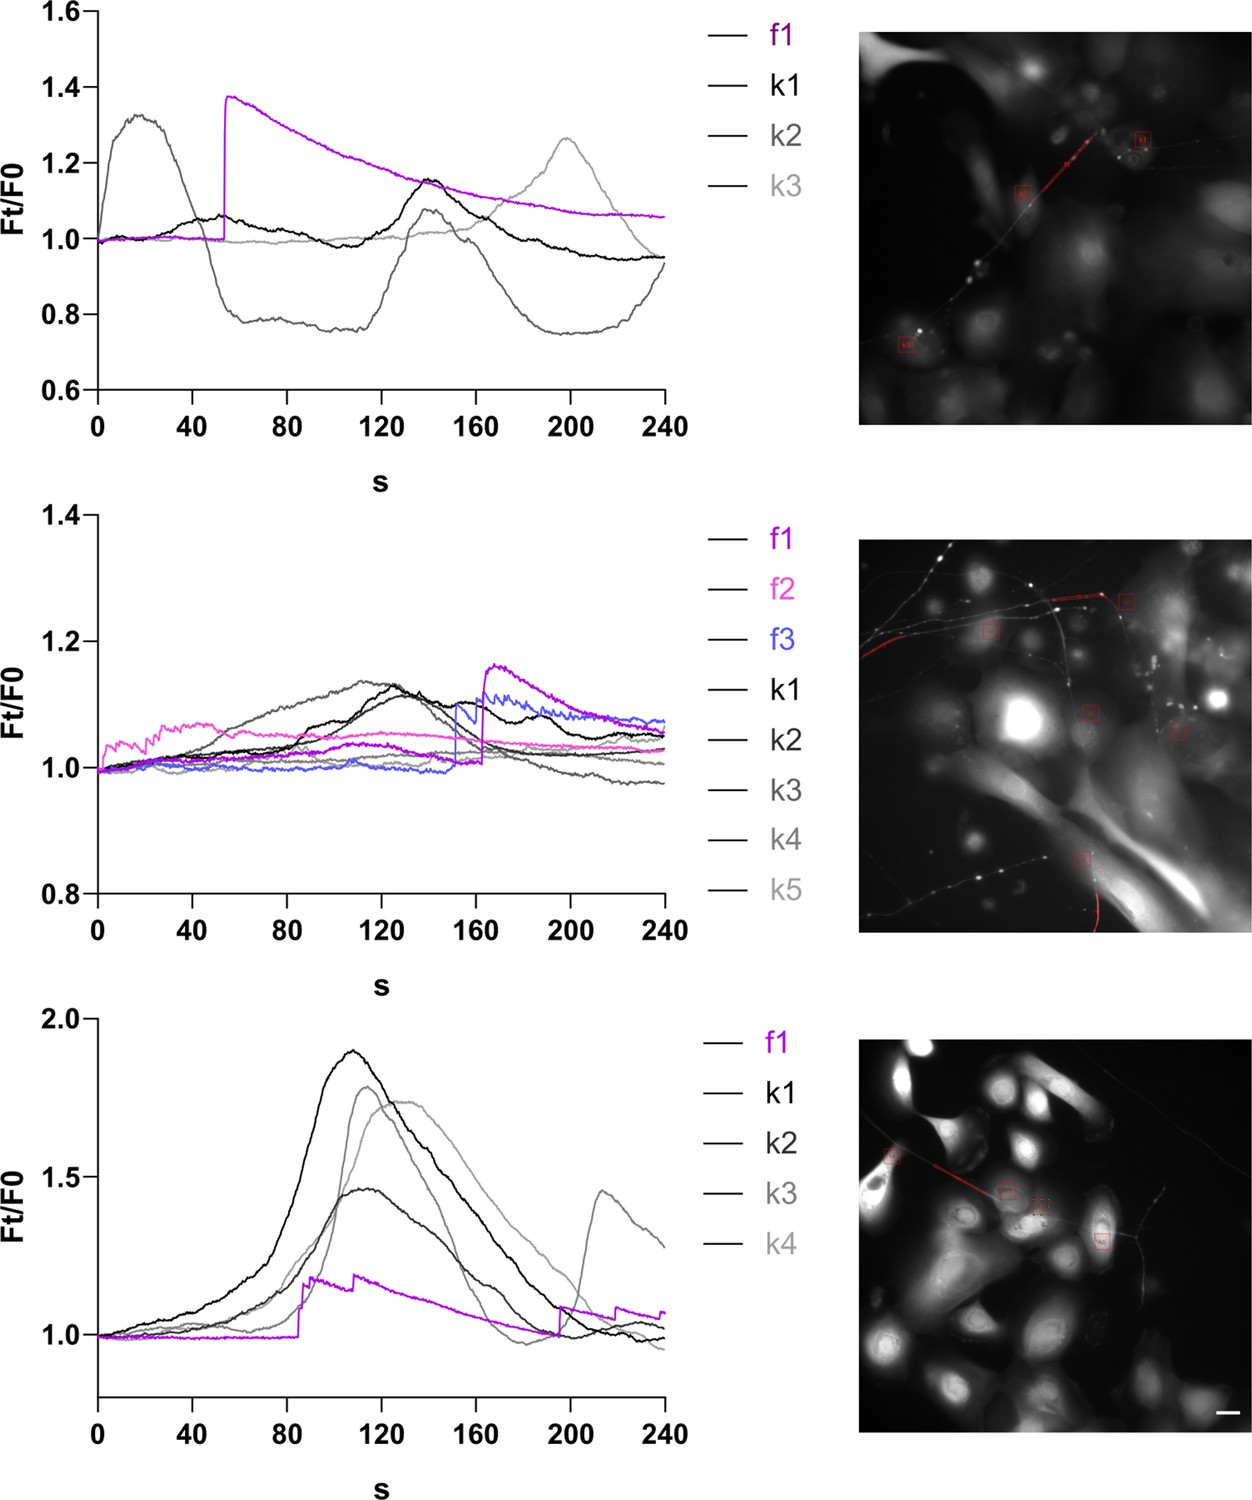
Ca2+ traces in fully human co-culture systems of sensory neurons and keratinocytes are temporally connected.
(Left) Representative Ca2+ transients of keratinocytes (black-grey) and neurites (magenta-blue) in contact and (right) imaged area with respective ROIs. Scale bar: 20 µm. Spontaneous activity observed in 3/7 wells. See also Figure 9—video 1.
Figure 9—video 1
Ca2+ imaging of fully human sensory neuron-keratinocyte co-culture.
Arrow shows keratinocyte in contact to fiber labeled by arrowhead. Acquisition interval 250ms and framerate of 32 images per second. Scale bar: 50 µm.
Figure 10
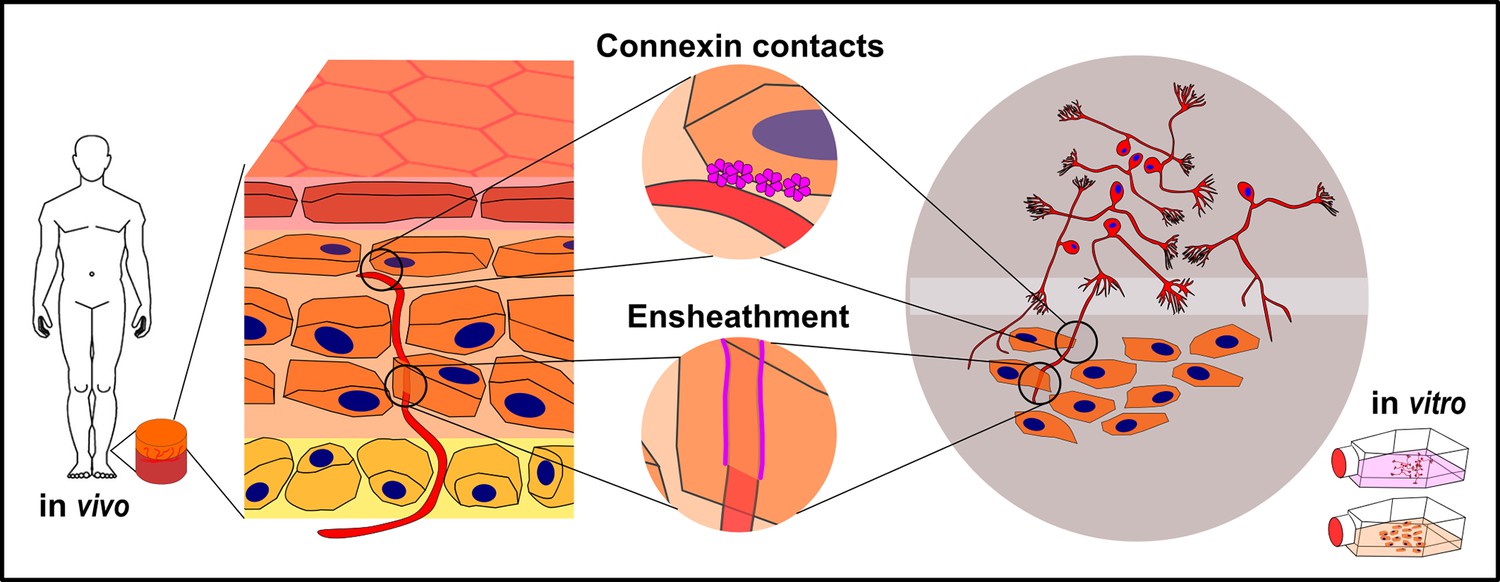
Keratinocyte-nerve fiber interactions in human epidermis and 2D model.
Proposed connexin contacts are potential transducers of sensory and nociceptive keratinocyte adenosine triphosphate signaling toward intraepidermal nerve fibers. Ensheathment of fibers by keratinocytes may orchestrate nerve fiber outgrowth and stabilization. Both observations are conserved in human 2D co-culture model.
Author response image 1

Tables
Key resources table
| Reagent type (species) or resource | Designation | Source or reference | Identifiers | Additional information |
|---|---|---|---|---|
| Biological samples | Skin sections | This paper | See Supplementary file 1 | |
| Biological samples | Primary keratinocytes | This paper | See Supplementary file 1 | |
| Biological samples | iPSC and-differentiated sensory neurons | Klein et al., 2023 | see Supplementary file 1 | |
| Antibody | Monoclonal mouse anti- protein gene product 9.5 | AbD serotec, Puchheim, Germany | Cat# 7863–1004 | srAt (1:400); ExM (1:200) |
| Antibody | Monoclonal rabbit anti-S100β | Abcam, Cambridge, UK | Cat# ab52642 | srAt (1:400) |
| Antibody | Mouse anti-Neurofilament marker (pan-neuronal, cocktail) | BioLegend, San Diego, CA, USA | Cat# 837801 | ICC (1:100) |
| Antibody | Polyclonal guinea pig anti-Desmoplakin | Progen, Heidelberg, Germany | Cat# DP-1 | srAt (1:400) |
| Antibody | Polyclonal rabbit anti- protein gene product 9.5 | Zytomed, Berlin, Germany | Cat# 516‐3344 | ExM (1:100) |
| Antibody | Polyclonal rabbit anti-Connexin 43 | Sigma Aldrich, St. Louise, MO, USA | Cat# C6219 | ExM (1:100); ICC (1:100); srAT (1:400) |
| Antibody | Polyclonal guinea pig anti-Connexin 43 | alomone labs, Jerusalem, Israel | Cat# ACC-201-GP | ExM (1:100) |
| Antibody | Polyclonal rabbit anti-Synaptophysin | Merck, Darmstadt, Germany | Cat# AB9272 | ICC (1:100) |
| Antibody | Monoclonal mouse anti-Cytokeratin 10 | Abcam, Cambridge, UK | Cat# ab1421 | ICC (1:200) |
| Antibody | Polyclonal guinea pig anti Cytokeratin 14 | Progen, Heidelberg, Germany | Cat# GP14 | ICC (1:200) |
| Antibody | Alexa Fluor 488 polyclonal donkey anti-mouse | Dianova, Hamburg, Germany | Cat# 715-545-150 | ExM (1:200); srAT (1:400) |
| Antibody | Alexa Fluor 488 polyclonal donkey anti-rabbit | Dianova, Hamburg, Germany | Cat# 711-545-152 | ExM (1:200) |
| Antibody | CF568 donkey polyclonal anti-rabbit | Biotium, Fremont, CA, USA | Cat# 20098–1 | ExM (1:200) |
| Antibody | CF568 donkey polyclonal anti-guinea pig | Biotium, Fremont, CA, USA | Car# 20377 | ExM (1:200) |
| Antibody | SeTau-647 anti-Rabbit | Conjugated antibody kindly provided by Prof. Markus Sauer, Department of Biotechnology and Biophysics, University of Würzburg, Germany. | srAT (1:400) | |
| Antibody | CF633 goat polyclonal anti-rabbit | Biotium, Fremont, CA, USA | Cat# 20122–1 | ExM (1:200) |
| Antibody | Cy3 goat polyclonal anti-guinea pig | Dianova, Hamburg, Germany | Cat# 106-165-003 | srAT (1:400) |
| Commercial assay | Fluo8-AM ester | Abcam, Cambridge, UK | Cat# ab142773 | 2 µM |
| Software | ImageJ/FIJI | National Institutes of Health; Schindelin et al., 2012 | doi:10.1038/nmeth.2019 | |
| Software | ImageJ plugin TRAKEM2 | Cardona et al., 2012; Saalfeld et al., 2012 | https://github.com/trakem2/TrakEM2 | |
| Software | Inkscape | Inkscape project | https://inkscape.org/?switchlang=en | |
| Software | GIMP2 | The GIMP Development Team | https://www.gimp.org/downloads/ | |
| Software | IMOD | Kremer et al., 1996 | https://bio3d.colorado.edu/imod/ | |
| Software | Dragonfly ORS | Dragonfly - a brand of Comet | https://www.theobjects.com/dragonfly/index.html | |
| Software | ImageJ BaSiC plugin | Peng et al., 2017a; Peng et al., 2017b | https://github.com/marrlab/BaSiC | |
| Software | ImageJ plugin MosaicJ | Swiss Federal Institute of Technology Lausanne | ||
| Other | Actin ExM 546 (phalloidin derivate) | Chrometra, Kortenaken, Belgium | ExM (33 nM) | |
| Other | Cholera Toxin Subunit B (Recombinant), Alexa Fluor 488 Conjugate | Thermo Fisher Scientific, Waltham, ME, USA | ICC (1:100) | |
| Other | Wheat germ agglutinin, Alexa Fluor 647 conjugate | Thermo Fisher Scientific, Waltham, ME, USA | ICC (1:100) | |
| Other | Wheat germ agglutinin, CF633 conjugate | Biotium, Fremont, CA, USA | ExM (1:100) |
Table 1
Primary and secondary antibodies and marker with specifications.
| Primary antibodies/marker | Company | Catalog number | Application |
|---|---|---|---|
| Actin ExM 546 (phalloidin derivate) | Chrometra, Kortenaken, Belgium | n.a. | ExM |
| Cholera toxin subunit B (recombinant), Alexa Fluor 488 Conjugate | Thermo Fisher Scientific, Waltham, ME, USA | C34775 | ICC |
| Monoclonal mouse anti- protein gene product 9.5 | AbD serotec, Puchheim, Germany | 7863–1004 | srAT; ExM |
| Monoclonal rabbit anti-S100β | Abcam, Cambridge, UK | ab52642 | srAT |
| Mouse anti-Neurofilament marker (pan-neuronal, cocktail) | BioLegend, San Diego, CA, USA | 837801 | ICC |
| Polyclonal guinea pig anti-Desmoplakin | Progen, Heidelberg, Germany | DP-1 | srAT |
| Polyclonal rabbit anti- protein gene product 9.5 | Zytomed, Berlin, Germany | 516‐3344 | ExM |
| Polyclonal rabbit anti-Connexin 43 | Sigma Aldrich, St. Louise, MO, USA | C6219 | srAT, ExM, ICC |
| Polyclonal guinea pig anti-Connexin 43 | alomone labs, Jerusalem, Israel | ACC-201-GP | ExM |
| Monoclonal mouse anti-Cytokeratin 10 | Abcam, Cambridge, UK | ab1421 | ICC |
| Polyclonal guinea pig anti Cytokeratin 14 | Progen, Heidelberg, Germany | GP14 | ICC |
| Polyclonal rabbit anti-Synaptophysin | Merck, Darmstadt, Germany | AB9272 | ICC |
| Wheat germ agglutinin, Alexa Fluor 647 conjugate | Thermo Fisher Scientific, Waltham, ME, USA | W32466 | ICC |
| Wheat germ agglutinin, CF633 conjugate | Biotium, Fremont, CA, USA | 29024 | ExM |
| Secondary antibodies | |||
| Alexa Fluor 488 donkey anti-mouse | Dianova, Hamburg, Germany | 715-545-150 | srAT, ExM |
| Alexa Fluor 488 donkey anti-rabbit | Dianova, Hamburg, Germany | 711-545-152 | ExM |
| CF568 donkey anti-rabbit | Biotium, Fremont, CA, USA | 20098–1 | ICC |
| CF568 donkey anti-guinea pig | Biotium, Fremont, CA, USA | 20098–1 | ExM |
| CF633 goat anti-rabbit | Biotium, Fremont, CA, USA | 20122–1 | ExM, ICC |
| Cy3 goat anti-guinea pig | Dianova, Hamburg, Germany | 106-165-003 | srAT |
| SeTau-647 anti-Rabbit | Conjugated antibody kindly provided by Prof. Markus Sauer, Department of Biotechnology and Biophysics, University of Würzburg, Germany. | srAT |
-
Abbreviations: ExM, expansion microscopy; ICC, immunohistochemistry; n.a., not applicable; srAT, super-resolution array tomography.
Additional files
-
Supplementary file 1
Clinical parameters for all participants assigned to applied biomaterial.
- https://cdn.elifesciences.org/articles/77761/elife-77761-supp1-v1.xlsx
-
Supplementary file 2
Fiji macros and CellProfiler pipelines applied for segmentation.
- https://cdn.elifesciences.org/articles/77761/elife-77761-supp2-v1.zip
-
Transparent reporting form
- https://cdn.elifesciences.org/articles/77761/elife-77761-transrepform1-v1.docx
Download links
A two-part list of links to download the article, or parts of the article, in various formats.
Downloads (link to download the article as PDF)
Open citations (links to open the citations from this article in various online reference manager services)
Cite this article (links to download the citations from this article in formats compatible with various reference manager tools)
Interaction of human keratinocytes and nerve fiber terminals at the neuro-cutaneous unit
eLife 13:e77761.
https://doi.org/10.7554/eLife.77761


