Maternal H3K36 and H3K27 HMTs protect germline development via regulation of the transcription factor LIN-15B
- Department of Molecular, Cell, and Developmental Biology, University of California, Santa Cruz, United States
Figures
Figure 1
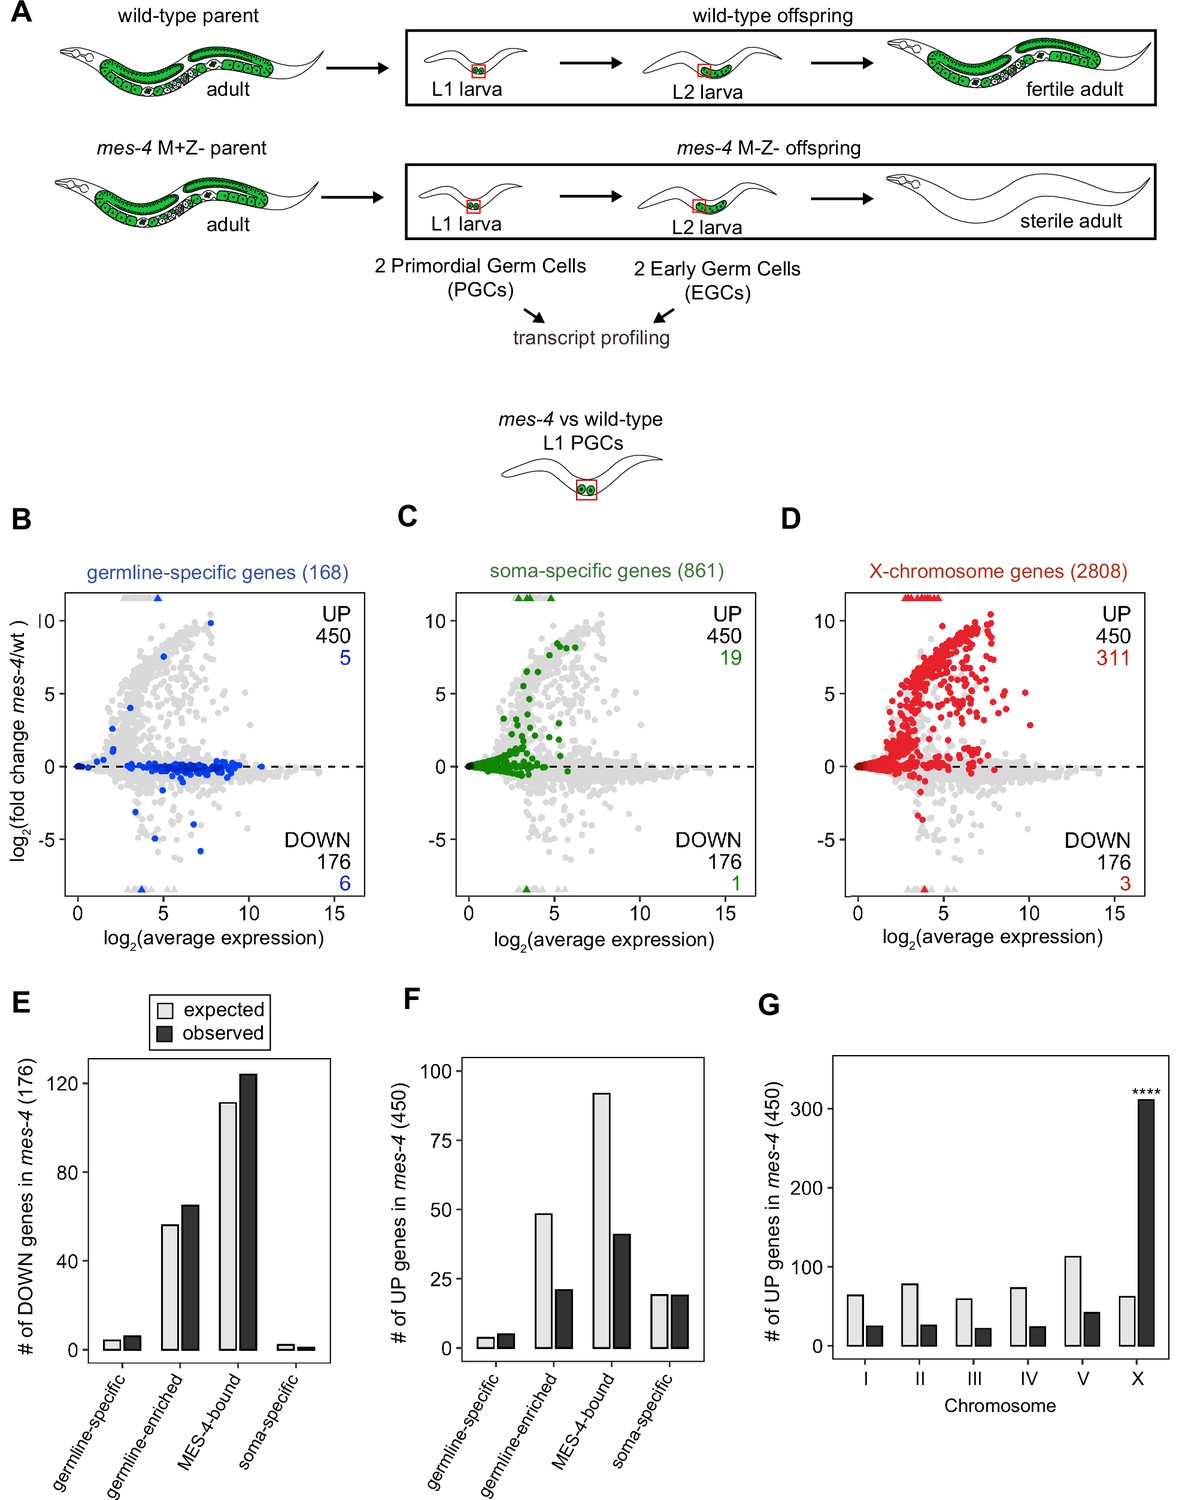
Transcriptome defects in mes-4 M-Z- primordial germ cells (PGCs) are dominated by upregulation of genes on the X.
(A) Cartoon illustrating the maternal-effect sterile (Mes) phenotype in mes-4 mutants. mes-4 M+Z- (M for maternal, Z for zygotic) mutants cannot synthesize MES-4 (Z-) but are fertile because they inherited maternal MES-4 gene product (M+). Removal of maternal MES-4 renders mes-4 M-Z- mutant adults sterile. Germline is green, and soma is white. Transcripts were profiled from single sets of two sister PGCs and from single sets of two early germ cells (EGCs) (red boxes) hand-dissected from mes-4 M-Z- (hereafter called mes-4) mutant and wild-type (wt) L1 and L2 larvae, respectively. (B–D) MA plots showing log2(average expression) versus log2(fold change) of transcript abundance for 20,258 protein-coding genes (circles) between mes-4 and wt PGCs. Numbers of biological replicates (sets of two cells): 19 wt PGCs and 11 mes-4 PGCs. Genes that exceeded one or both plot scales (triangles) were set at the maximum value of the scale. Genes belonging to a specific gene set are colored: (B) 168 germline-specific genes are blue, (C) 861 soma-specific genes are green, and (D) 2808 X-chromosome genes are red. Differentially expressed genes in mes-4 vs. wt PGCs were identified using Wald tests in DESeq2 and by setting a q-value < 0.05 significance threshold. Numbers of all misregulated genes (black) and numbers of those in gene sets (colored) are indicated in the corners; top is upregulated (UP) and bottom is downregulated (DOWN) in mes-4 vs. wt. (E–G) Bar plots showing the expected number (gray) and observed number (black) of misregulated genes that are members of the indicated gene sets. Hypergeometric tests were performed in R to test for gene-set enrichment. p-value designation is ****<1e-5. (E) Enrichment analyses for DOWN genes were restricted to 5858 protein-coding genes that we defined as ‘expressed’ (minimum average read count of 1) in wt PGCs. Gene-set sizes: germline-specific (140), germline-enriched (1867), MES-4-bound (3702), soma-specific (73). (F, G) Enrichment analyses for UP genes included all 20,258 protein-coding genes in the transcriptome. Gene-set sizes: germline-specific (168), germline-enriched (2176), MES-4-bound (4132), soma-specific (861), chrI (2888), chrII (3508), chrIII (2670), chrIV (3300), chrV (5084), and chrX (2808).
Figure 2 with 2 supplements
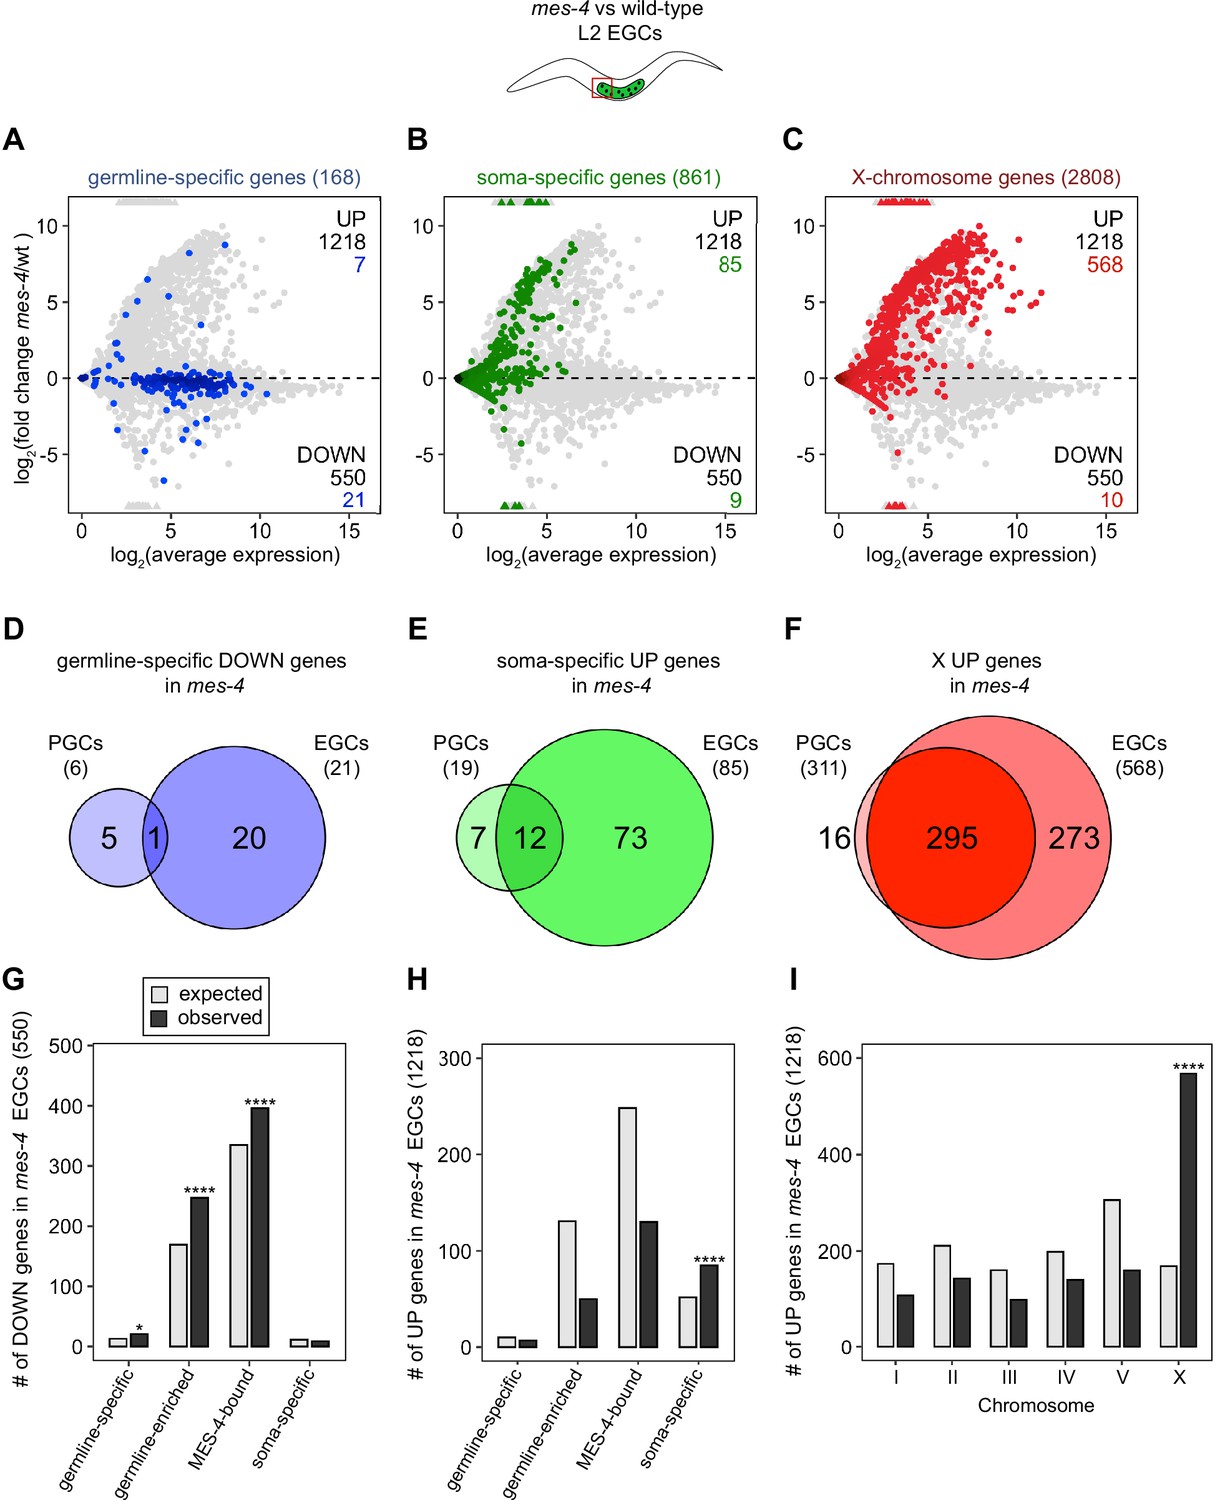
mes-4 M-Z- early germ cells (EGCs) have more severe transcriptome defects than mes-4 M-Z- primordial germ cells (PGCs).
(A–C) MA plots as described for Figure 1B–D showing differential expression analysis for mes-4 vs. wild-type (wt) EGCs. Numbers of biological replicates (sets of two cells): 13 wt EGCs and 15 mes-4 EGCs. (D–F) Venn diagrams comparing sets of misregulated genes (mes-4 vs. wt) between PGCs and EGCs: (D) germline-specific downregulated (DOWN) genes, (E) soma-specific upregulated (UP) genes, and (F) X UP genes. (G–I) Bar plots showing the expected number (gray) and observed number (black) of misregulated genes in mes-4 EGCs that are members of the indicated gene sets. Hypergeometric tests were performed in R to test for gene-set enrichment. p-value designations are *<0.01 and ****<1e-5. (G) Enrichment analyses for DOWN genes were restricted to 6682 protein-coding genes that we defined as ‘expressed’ (minimum average read count of 1) in wt EGCs. Gene-set sizes: germline-specific (143), germline-enriched (1857), MES-4-bound (3675), soma-specific (126). (H, I) Enrichment analyses for UP genes included all 20,258 protein-coding genes in the transcriptome. Gene-set sizes: germline-specific (168), germline-enriched (2176), MES-4-bound (4132), soma-specific (861), chrI (2888), chrII (3508), chrIII (2670), chrIV (3300), chrV (5084), and chrX (2808).
Figure 2—figure supplement 1
Analysis of features of misregulated genes in mes-4 M-Z- primordial germ cells (PGCs) and early germ cells (EGCs).
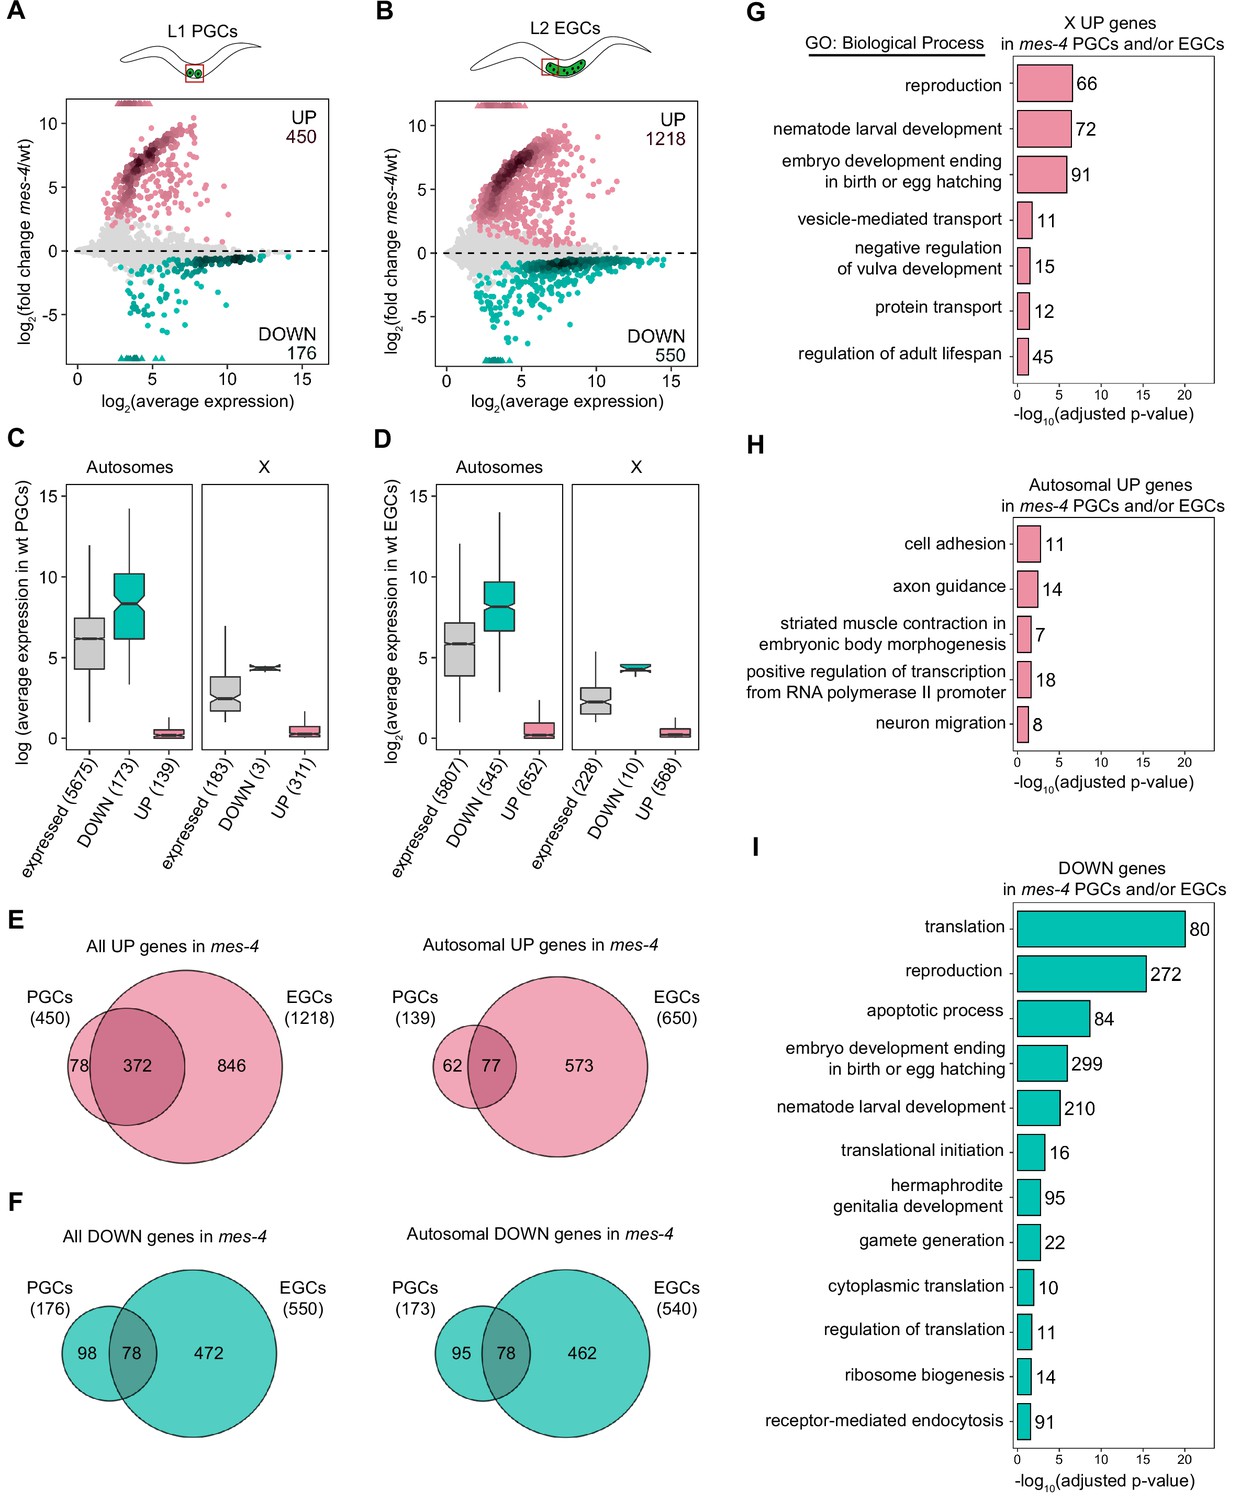
(A, B) MA plots as described for Figure 1B–D showing differential expression analysis for (A) mes-4 vs. wild-type (wt) PGCs and (B) mes-4 vs. wt EGCs. Colored circles represent misregulated genes (q-value < 0.05); upregulated (UP) genes are in pink and downregulated (DOWN) genes are in teal. (C, D) Boxplots showing distributions of transcript abundance for autosomal (left) or X-linked (right) expressed genes (gray), DOWN genes (teal), and UP genes (pink) in (C) wt PGCs and (D) wt EGCs. Boxplots show the median, the 25th and 50th percentiles (boxes), and the 2.5th and 97.5th percentiles (whiskers). (E) Venn diagrams comparing UP genes (left) or autosomal UP genes (right) in mes-4 PGCs and/or EGCs. (F) Venn diagrams comparing DOWN genes (left) or autosomal DOWN genes (right) in mes-4 PGCs and/or EGCs. (G–I) Bar plots showing significantly enriched (Benjamini–Hochberg-adjusted p-value<0.05) Gene Ontology (GO) biological process terms in sets of misregulated genes (mes-4 PGCs and/or EGCs): (F) X UP genes, (G) autosomal UP genes, and (H) DOWN genes. Numbers of misregulated genes for each GO term are indicated. Analyses of UP genes (G, H) used all 20,258 protein-coding genes as background, while analysis of DOWN genes (I) used our set of 6345 protein-coding genes expressed in wt PGCs and/or EGCs as background. All GO analyses were performed using DAVID Bioinformatics Resource 6.8.
Figure 2—figure supplement 2
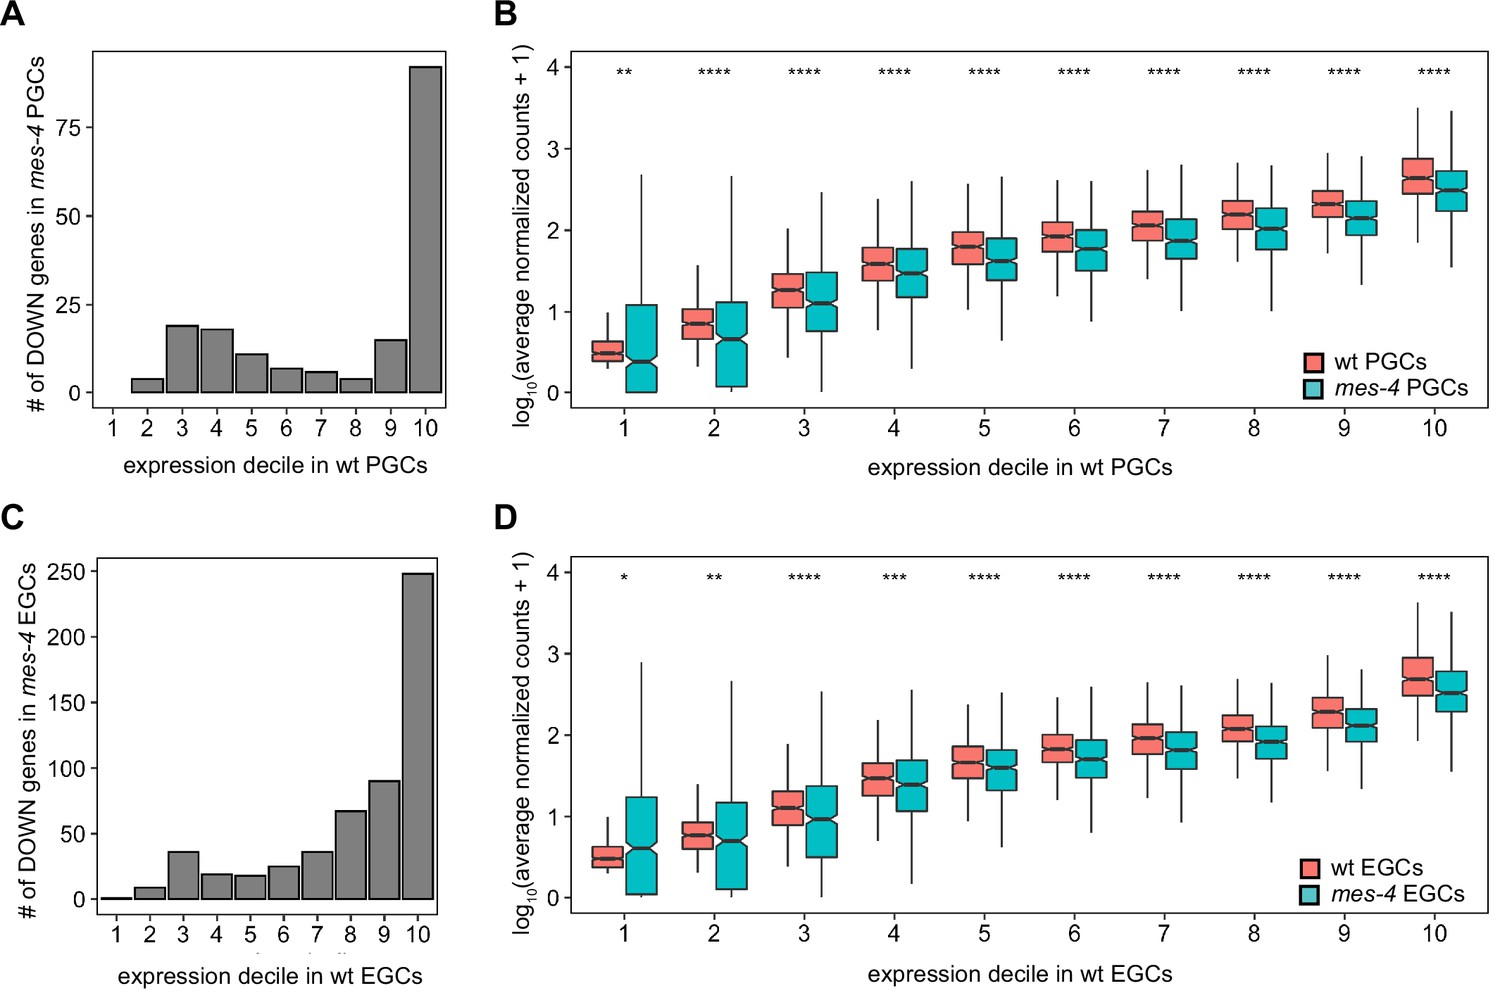
Differential expression analysis of downregulated (DOWN) genes in mes-4 primordial germ cells (PGCs) and early germ cells (EGCs) by expression decile in wild type (wt).
(A, C) Bar plots showing the number of DOWN genes across expression deciles in (A) wt PGCs and (C) wt EGCs. To generate deciles of expression, genes were ranked from lowest to highest by average TPM to account for the impact of gene length on expression level. (B, D) Boxplots comparing, for each decile of expression, the expression level (average normalized counts) of genes between wt and mes-4 (B) PGCs and (D) EGCs. Boxplots show the median, the 25th and 50th percentiles (boxes), and the 2.5th and 97.5th percentiles (whiskers). We performed Mann–Whitney tests with normalized counts instead of TPM to compare expression levels between wt and mes-4 PGCs or EGCs because the former is more appropriate for between-sample comparisons. p-value designations are *<0.01, **<0.001, ***<1e-4, and ****<1e-5.
Figure 3
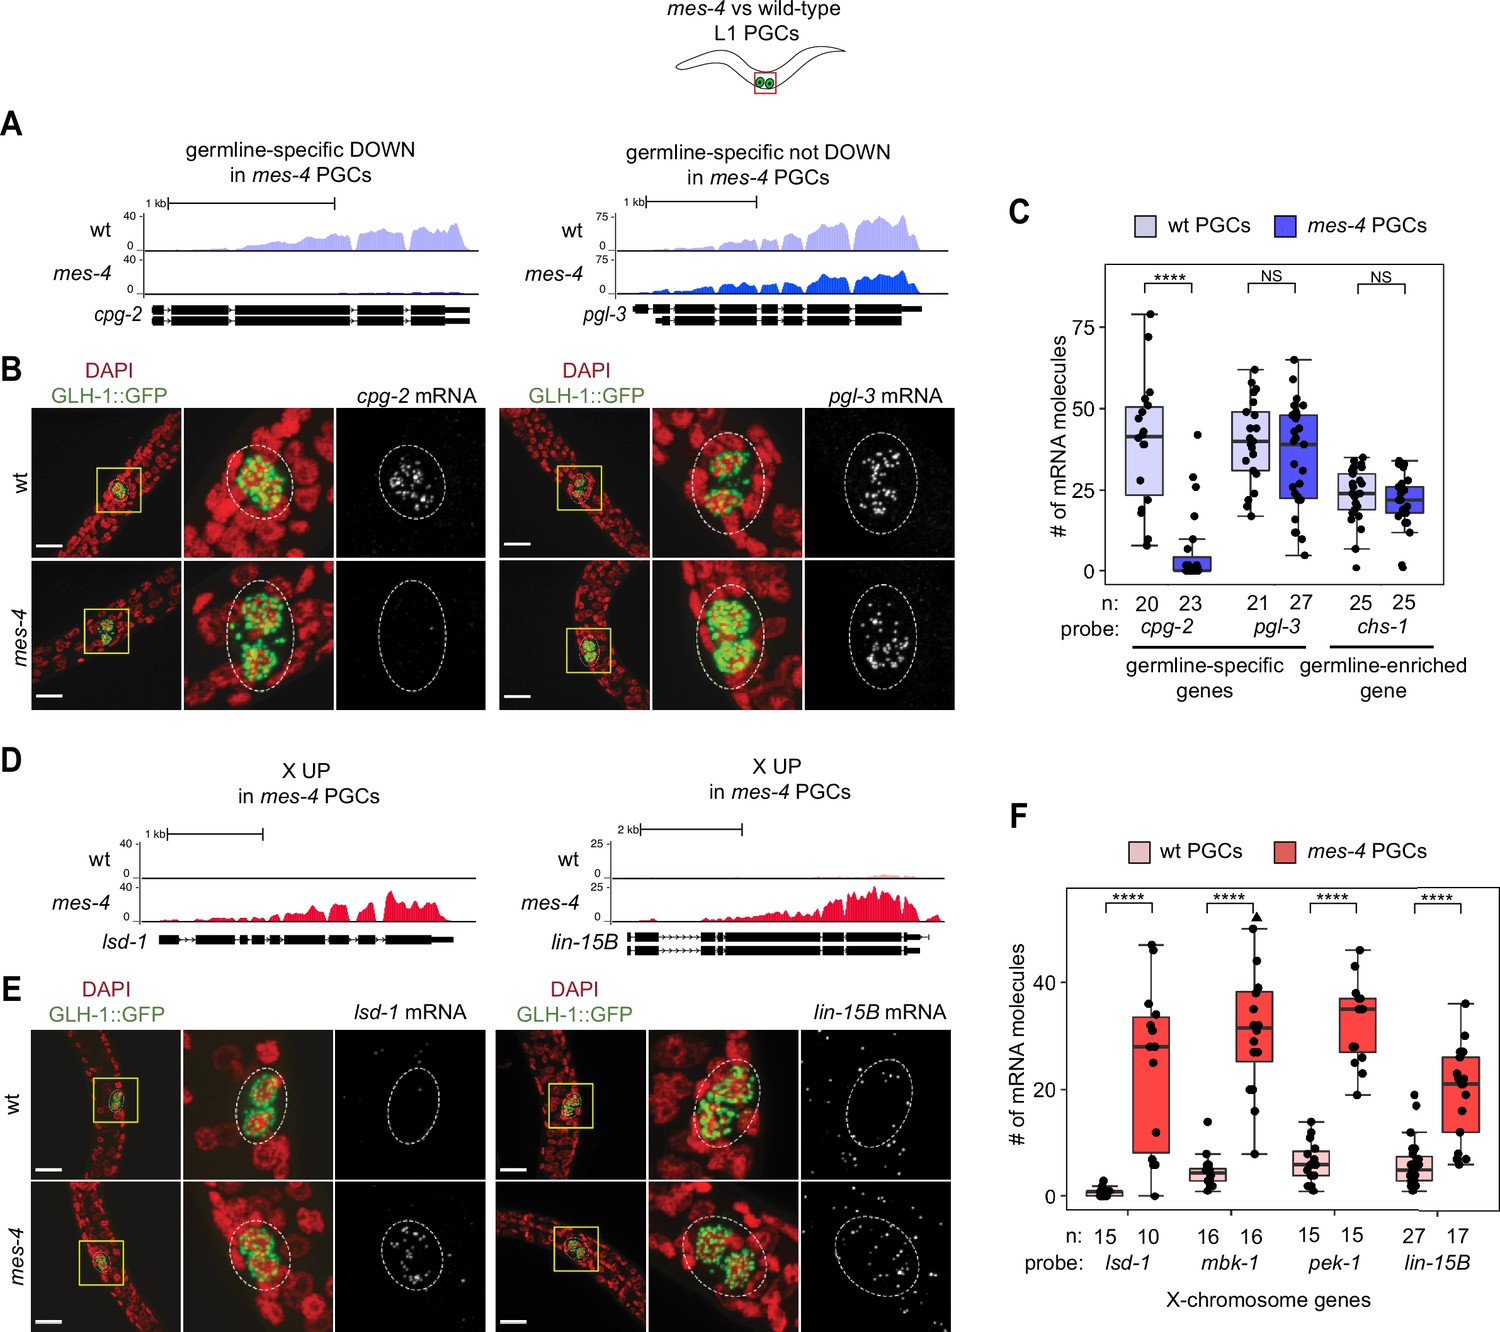
Transcript quantification in mes-4 M-Z- mutant primordial germ cells (PGCs) by single-molecule fluorescence in situ hybridization (smFISH) corroborates RNA-seq results.
(A, D) UCSC Genome Browser images showing average sequencing read coverage over Ensembl gene models for wild-type (wt) PGCs (top track) and mes-4 PGCs (bottom track). (B, E) Representative maximum-intensity Z-projection images of smFISH experiments in L1 larvae collected after 5 hr of feeding. DAPI-stained nuclei are red. GLH-1::GFP is green. The dashed lines circumscribe PGCs marked by GLH-1::GFP. The second and third images in each set are zoomed insets of the yellow box in the first image. Foci in the mRNA channel (third image in each set) represent individual transcripts. Scale bars are 10 µm. (A, B) Two germline-specific genes: cpg-2 (left) and pgl-3 (right). cpg-2 was downregulated (DOWN) and pgl-3 was not DOWN in transcript profiling of mes-4 vs. wt PGCs. (D, E) Two X-linked UP genes in transcript profiling of mes-4 vs. wt PGCs and/or early germ cells (EGCs): lsd-1 (left) and lin-15B (right). (C, F) Transcript quantification in smFISH 3D images of PGCs. Each circle represents one quantified image. The number of quantified images for each combination of probe and genotype is indicated. Boxplots show the median, the 25th and 50th percentiles (boxes), and the 2.5th and 97.5th percentiles (whiskers). Mann–Whitney tests were used to compare a gene’s transcript counts between mes-4 and wt PGCs. p-value designations are NS >0.01 and ****<1e-5. (C) Quantification of cpg-2, pgl-3, and chs-1 transcripts. chs-1 is in the germline-enriched gene set and is not DOWN in transcript profiling of mes-4 vs. wt PGCs and EGCs. (F) Quantification of lsd-1, mbk-1, pek-1, and lin-15B transcripts, four X-linked UP genes in transcript profiling of mes-4 vs. wt PGCs and/or EGCs.
-
Figure 3—source data 1
Comparison of single-molecule fluorescence in situ hybridization (smFISH) and transcript profiling data.
Table showing differential expression statistics for the seven genes tested by smFISH. Log2(fold change) values were calculated by comparing mean transcript counts in mes-4 primordial germ cells (PGCs) to wild-type (wt) PGCs, and the p-value is from a Mann–Whitney test. For transcript profiling analysis, ‘shrunken’ log2(fold change) values were calculated using DESeq2 and ashr in R.
- https://cdn.elifesciences.org/articles/77951/elife-77951-fig3-data1-v2.xlsx
Figure 4 with 3 supplements
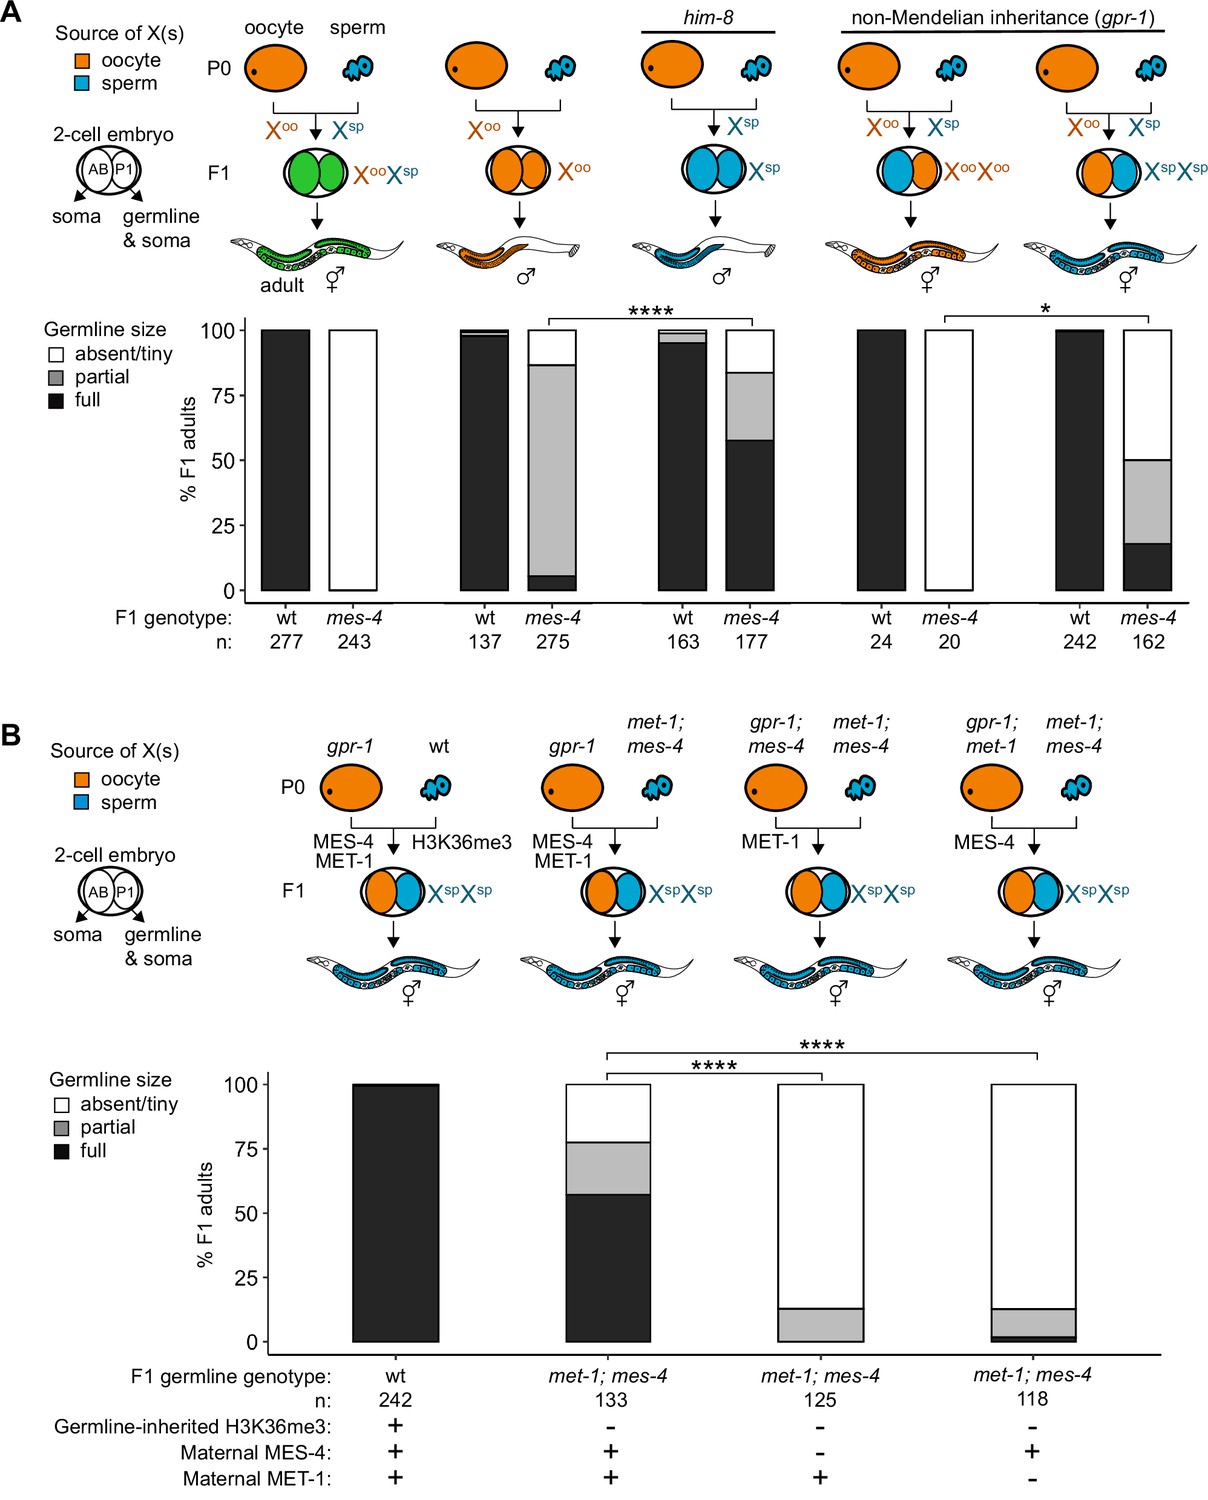
Maternally loaded MES-4 promotes germline development by repressing the X chromosomes independently from transmitting H3K36me3 across generations.
(A, B) Bar plots showing distributions of germline size (absent/tiny, partial, and full) in worms with different X-chromosome compositions in their germline. Numbers of scored F1 offspring and the genotype of their germlines are indicated (mes-4 indicates mes-4 M-Z-). Two-cell embryos contain AB (left) and P1 (right) blastomeres. AB generates some somatic tissues; P1 generates the germline and some somatic tissues. Orange, blue, and green indicate X-chromosome compositions: orange is only oocyte-inherited X(s), blue is only sperm-inherited X(s), and green is one oocyte-inherited X and one sperm-inherited X. To generate ‘non-Mendelian’ F1 hermaphrodite offspring that inherited two genomes and therefore two Xs from one gamete, fathers were mated with mothers that carried a mutation in gpr-1. Two-tailed Fisher’s exact tests were used to test whether the proportion of F1 adults with a full-sized germline significantly differed between samples. p-value designations are *<0.01 and ****<1e-5. (A) To generate F1 male offspring that inherited their single X from the sperm, parents were mated that carried the him-8(e1489) mutation, which causes X-chromosome nondisjunction during oogenesis in the hermaphrodite. (B) Presence or absence of sperm-inherited H3K36me3 marking, maternal MES-4, and maternal MET-1 in the germline of F1 offspring are indicated in the schematic of each cross and below each bar.
Figure 4—figure supplement 1
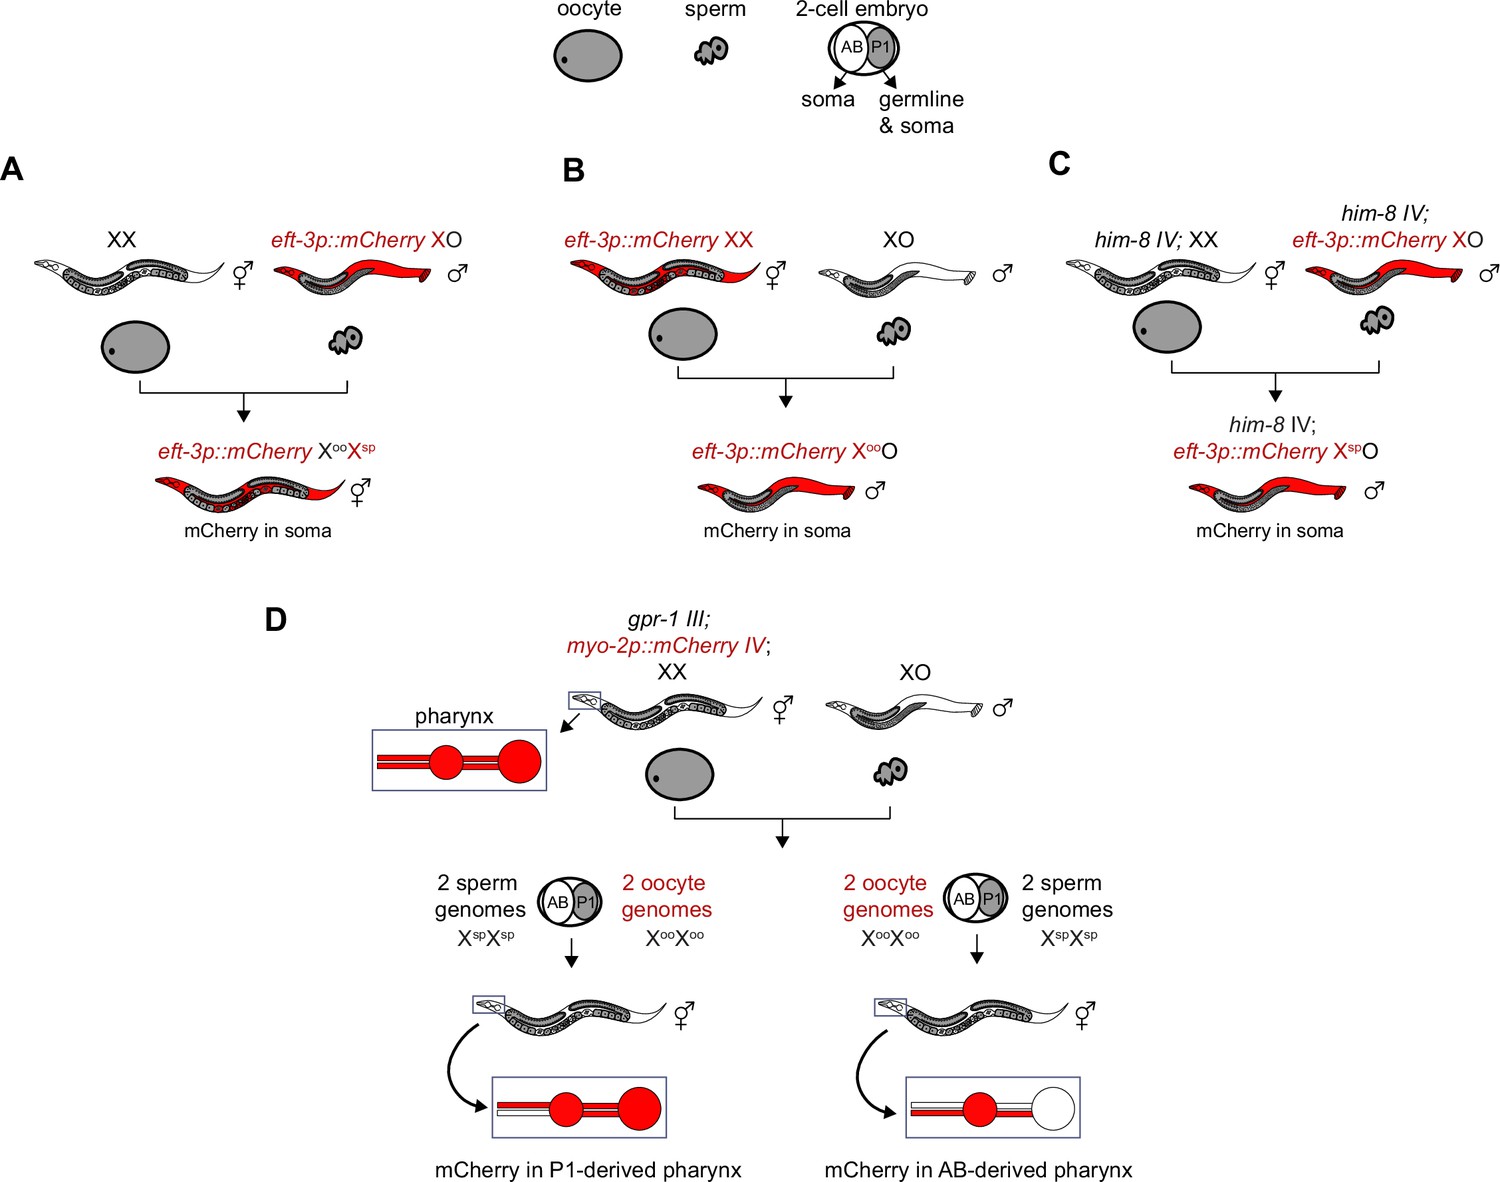
Genetic strategies to generate and identify F1 offspring that inherited different X-chromosome endowments from parents.
(A–C) X-linked and soma-expressed mCherry driven by the eft-3 promoter was used to track X-chromosome inheritance patterns in F1 offspring. (C) To generate males that inherited their single X from the sperm, the him-8(e1489) mutation was used. him-8 causes X-chromosome nondisjunction in the maternal germline, which causes some oocytes to lack an X. (D) To generate hermaphrodites whose germline inherited either two genomes from the oocyte or two genomes from the sperm, a gpr-1 overexpression allele was used. Expression of mCherry driven by the myo-2 promoter in AB-derived pharyngeal muscle or P1-derived pharyngeal muscle was used to identify F1 hermaphrodite offspring with non-Mendelian inheritance patterns.
Figure 4—figure supplement 2
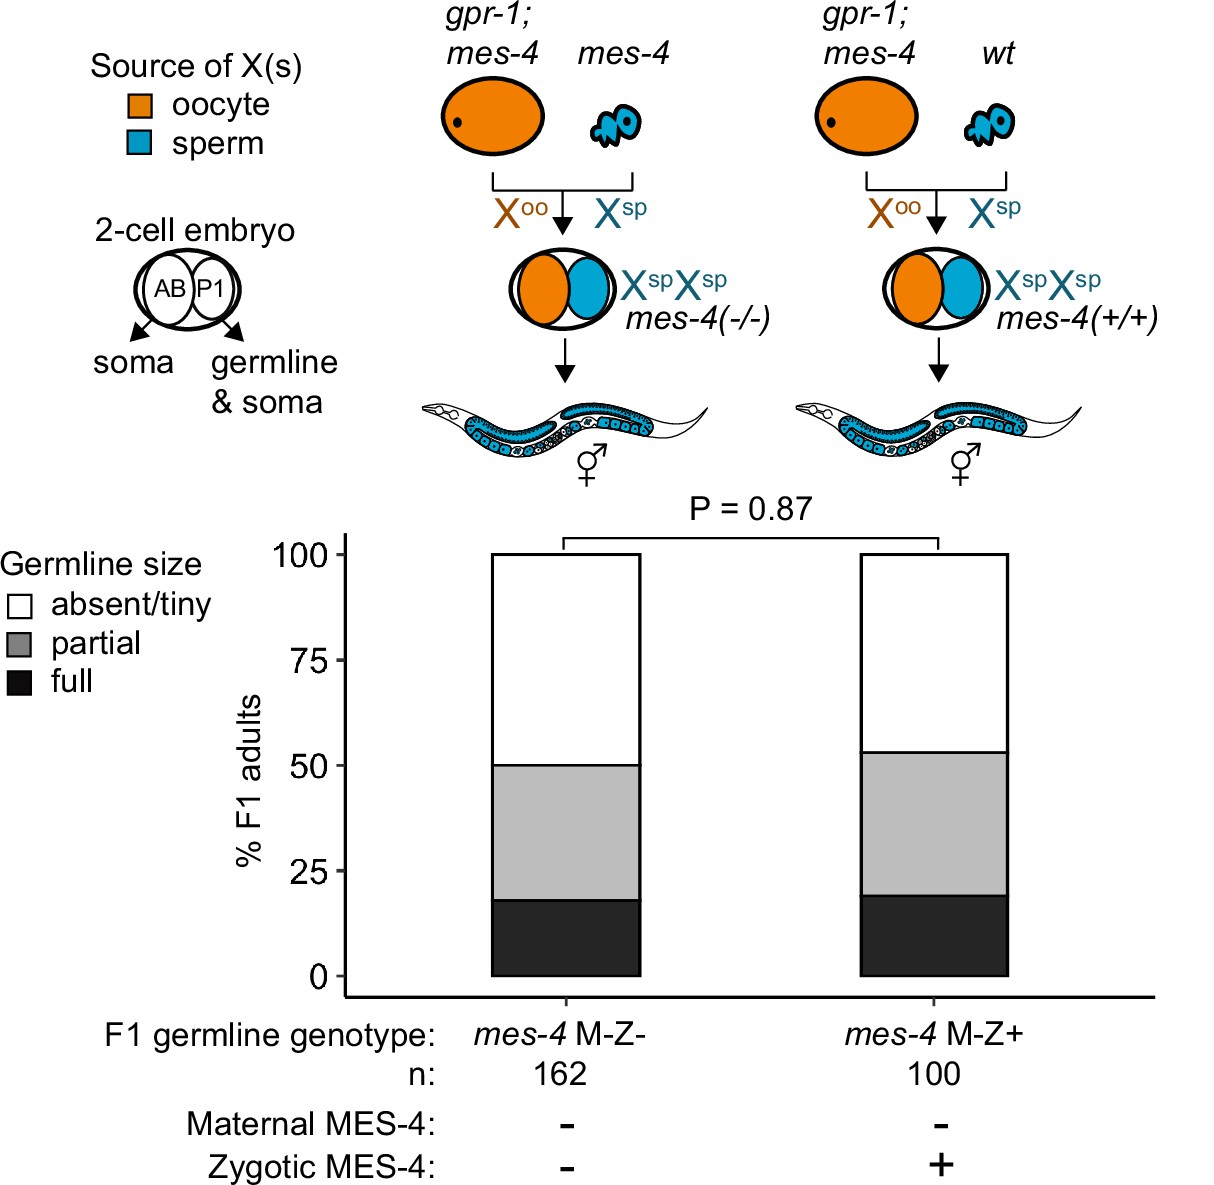
mes-4 M-Z+ XspXsp mutants do not have healthier germlines than mes-4 M-Z- XspXsp mutants.
Bar plots as described for Figure 4 showing distributions of germline size (absent/tiny, partial, and full) in F1 offspring whose germline inherited two X chromosomes from the sperm. Numbers of scored F1 offspring, the genotype of their germlines, and the presence or absence of maternal MES-4 and zygotic MES-4 are indicated below the bars. Notably, the germlines of mes-4 M-Z+ offspring have two wild-type copies of mes-4 that they inherited from the sperm.
Figure 4—figure supplement 3
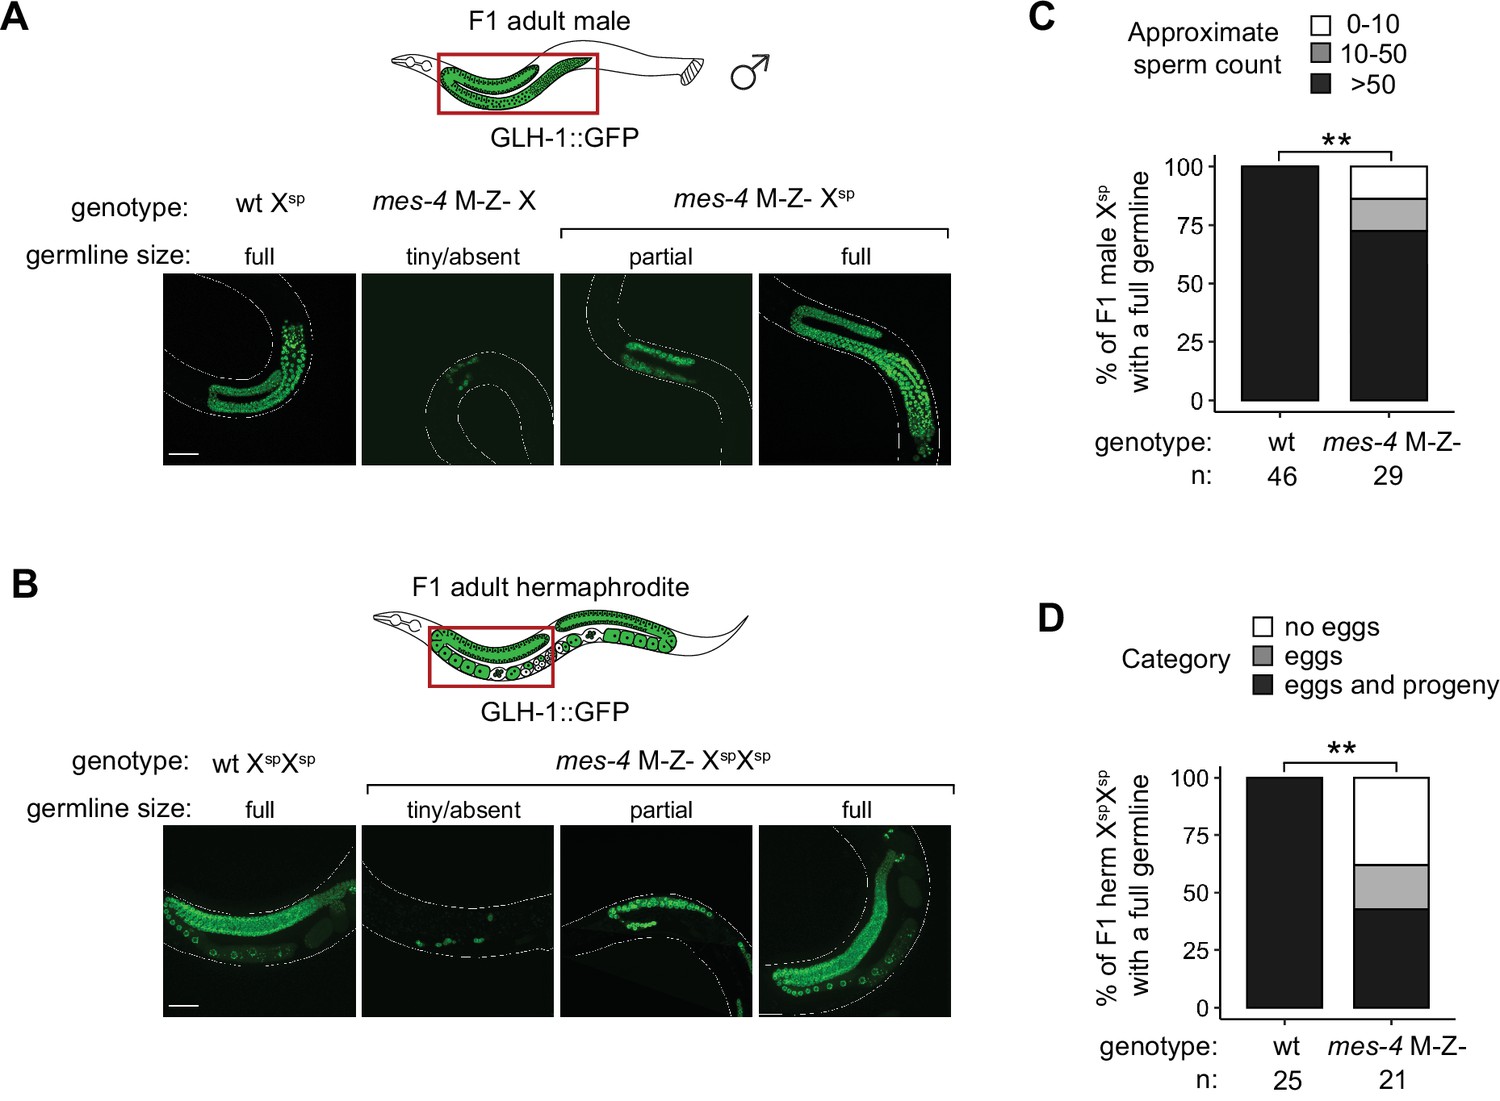
Further fertility analyses of mes-4 M-Z- mutants that inherited their X(s) from the sperm.
(A, B) Representative images of live F1 offspring with a germline scored as either tiny/absent, partial, or full. Genotypes of imaged worms with respect to the mes-4 locus and their germline’s X-chromosome composition are indicated. Green signal is the germline marker GLH-1::GFP. Worm bodies are outlined in white. Scale bar is 45 µM. (A) F1 male offspring generated using the him-8(e1489) mutation. All imaged males inherited their single X from the sperm, except the male with a tiny/absent germline; that male inherited its X either from the mother’s oocyte or mother’s sperm (self-fertilization). (B) F1 hermaphrodite offspring generated using the gpr-1 overexpression allele with a germline composed of two genomes from the sperm. (C) Bar plots showing sperm counts in F1 male offspring that were classified as having a full germline. Percentages of F1 males that had >50 sperm were compared between wild-type (wt) and mes-4 mutant populations using a two-sided Fisher’s exact test. (D) Bar plots showing the presence or absence of eggs and viable progeny in F1 hermaphrodite offspring that were classified as having a full germline. Percentages of F1 hermaphrodites that had eggs and viable progeny were compared between wt and mes-4 mutant populations using a two-sided Fisher’s exact test. p-value designation is **<0.001.
Figure 5 with 3 supplements
Loss of LIN-15B reduces X misexpression in mes-4 M+Z- adult germlines and suppresses germline death in mes-4 M-Z- mutants.
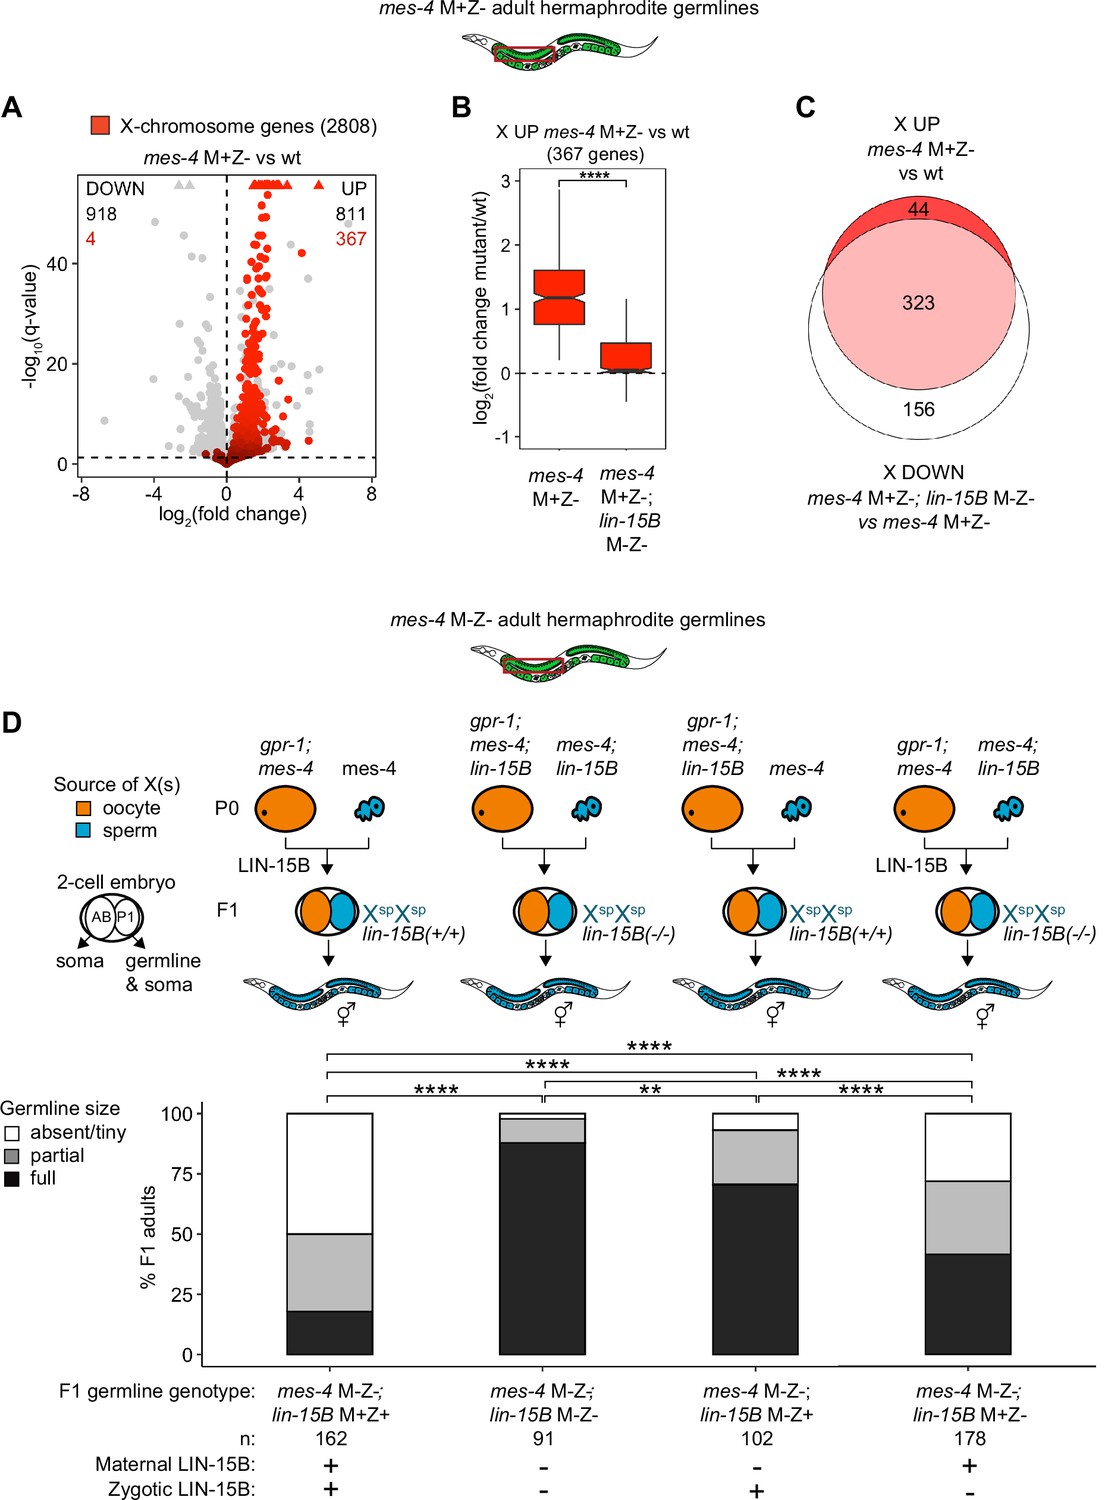
(A) Volcano plot showing log2(fold change) of transcript abundance and significance [-log10(q-value)] for 20,258 protein-coding genes (circles) between germlines dissected from mes-4 M+Z vs. wild-type (wt) adults. Genes that exceeded the plot scale (triangles) were set at the maximum value of the scale. X-chromosome genes (2808) are red. Genes above the horizontal line (q-value of 0.05) are considered significantly misregulated. The number of all misregulated protein-coding genes (black) and the number of those that are X-linked (red) are indicated in the corners; left is downregulated (DOWN) and right is upregulated (UP) in mes-4 M+Z vs. wt. (B) Boxplots showing log2(fold change) in transcript abundance for the 367 X UP genes in mes-4 M+Z- vs. wt germlines between mes-4 M+Z- vs. wt germlines and between mes-4 M+Z-; lin-15B M-Z- vs. wt germlines. Boxplots show the median, the 25th and 50th percentiles (boxes), and the 2.5th and 97.5th percentiles (whiskers). Waists around the median indicate 95% confidence intervals. Mann–Whitney tests were used to compare samples. (C) Venn diagram comparing the 367 X UP genes in mes-4 M+Z vs. wt and the 479 X DOWN genes in mes-4 M+Z-; lin-15B M-Z- vs. mes-4 M+Z- germlines. (D) Bar plots as described in the legend of Figure 4. Genotypes of hermaphrodite and male parents are indicated at the top. All scored F1 offspring were non-Mendelian segregants (caused by the gpr-1 mutation in mother worms) whose germline inherited two genomes and therefore two Xs from the sperm. The F1 germline’s genotype with respect to lin-15B is indicated to the right of the two-cell embryos; ‘+’ is wild-type allele, ‘-‘ is null allele. The presence or absence of maternal LIN-15B and zygotic LIN-15B in the germline of F1 offspring is indicated in the schematic of each cross and below each bar. Two-sided Fisher’s exact tests were used to test whether the proportion of F1 adults with a full-sized germline significantly differed between samples. p-value designations are **<0.001 and ****<1e-5.
Figure 5—figure supplement 1
Identification and testing of candidate transcription factors for a role in causing sterility of mes-4 M-Z- mutants.
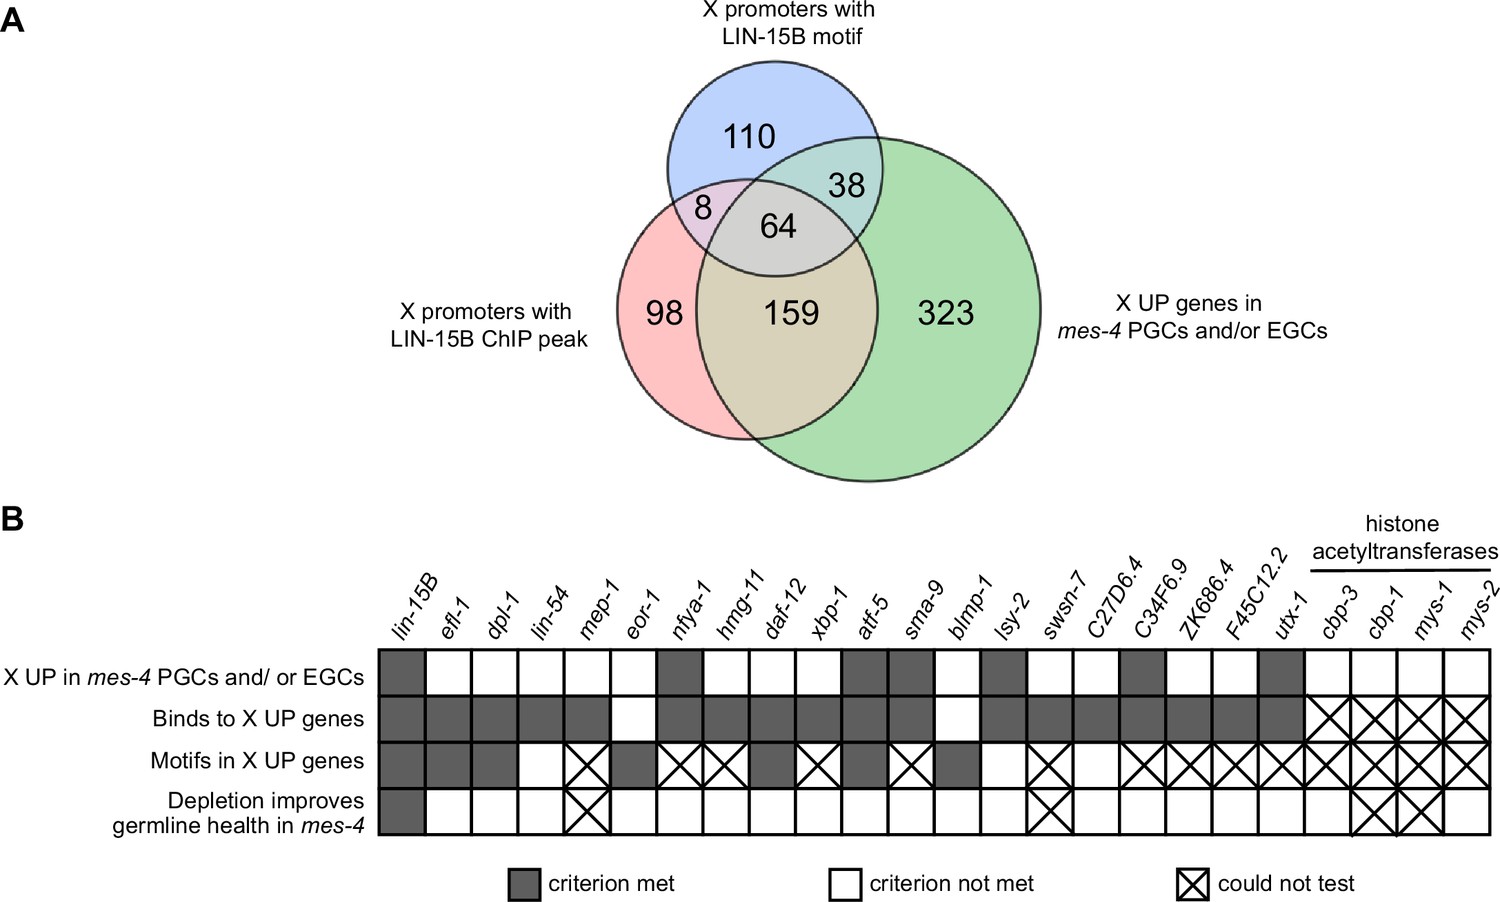
(A) Venn diagram comparing three gene sets: X UP genes in mes-4 primordial germ cells (PGCs) and/or early germ cells (EGCs), X genes with a LIN-15B ChIP peak in their promoter region (500 bp upstream of TSS), and X genes with a LIN-15B binding motif in their promoter region. LIN-15B ChIP-chip data were from embryos (downloaded from modENCODE), and LIN-15B ChIP-seq data were from L3 land L4 larvae (downloaded from modERN). (B) Table showing the candidate transcription factors that were tested for a role in causing sterility of mes-4 M-Z- worms (columns) and the criteria used to select them (rows). Gray-colored squares indicate a criterion was met, white-colored squares indicate a criterion was not met, and an ‘X’ indicates a criterion could not be tested or the effect of RNAi on germline size could not be determined. RNAi of cbp-1, mys-1, or swsn-7 caused highly penetrant embryo and larval lethality, which prevented us from sampling a sufficient number of healthy adults. RNAi of mep-1 caused ectopic expression of GLH-1::GFP(+) P granules in somatic tissues, which complicated our identification of germline tissue by live imaging GLH-1::GFP. The RNAi phenotypes we observed for cbp-1, swsn-7, and mep-1 have been previously reported (Maeda et al., 2001; Unhavaithaya et al., 2002; Cabianca et al., 2019).
Figure 5—figure supplement 2
Further analysis of how LIN-15B impacts the transcriptome of mes-4 M+Z- dissected adult germlines.
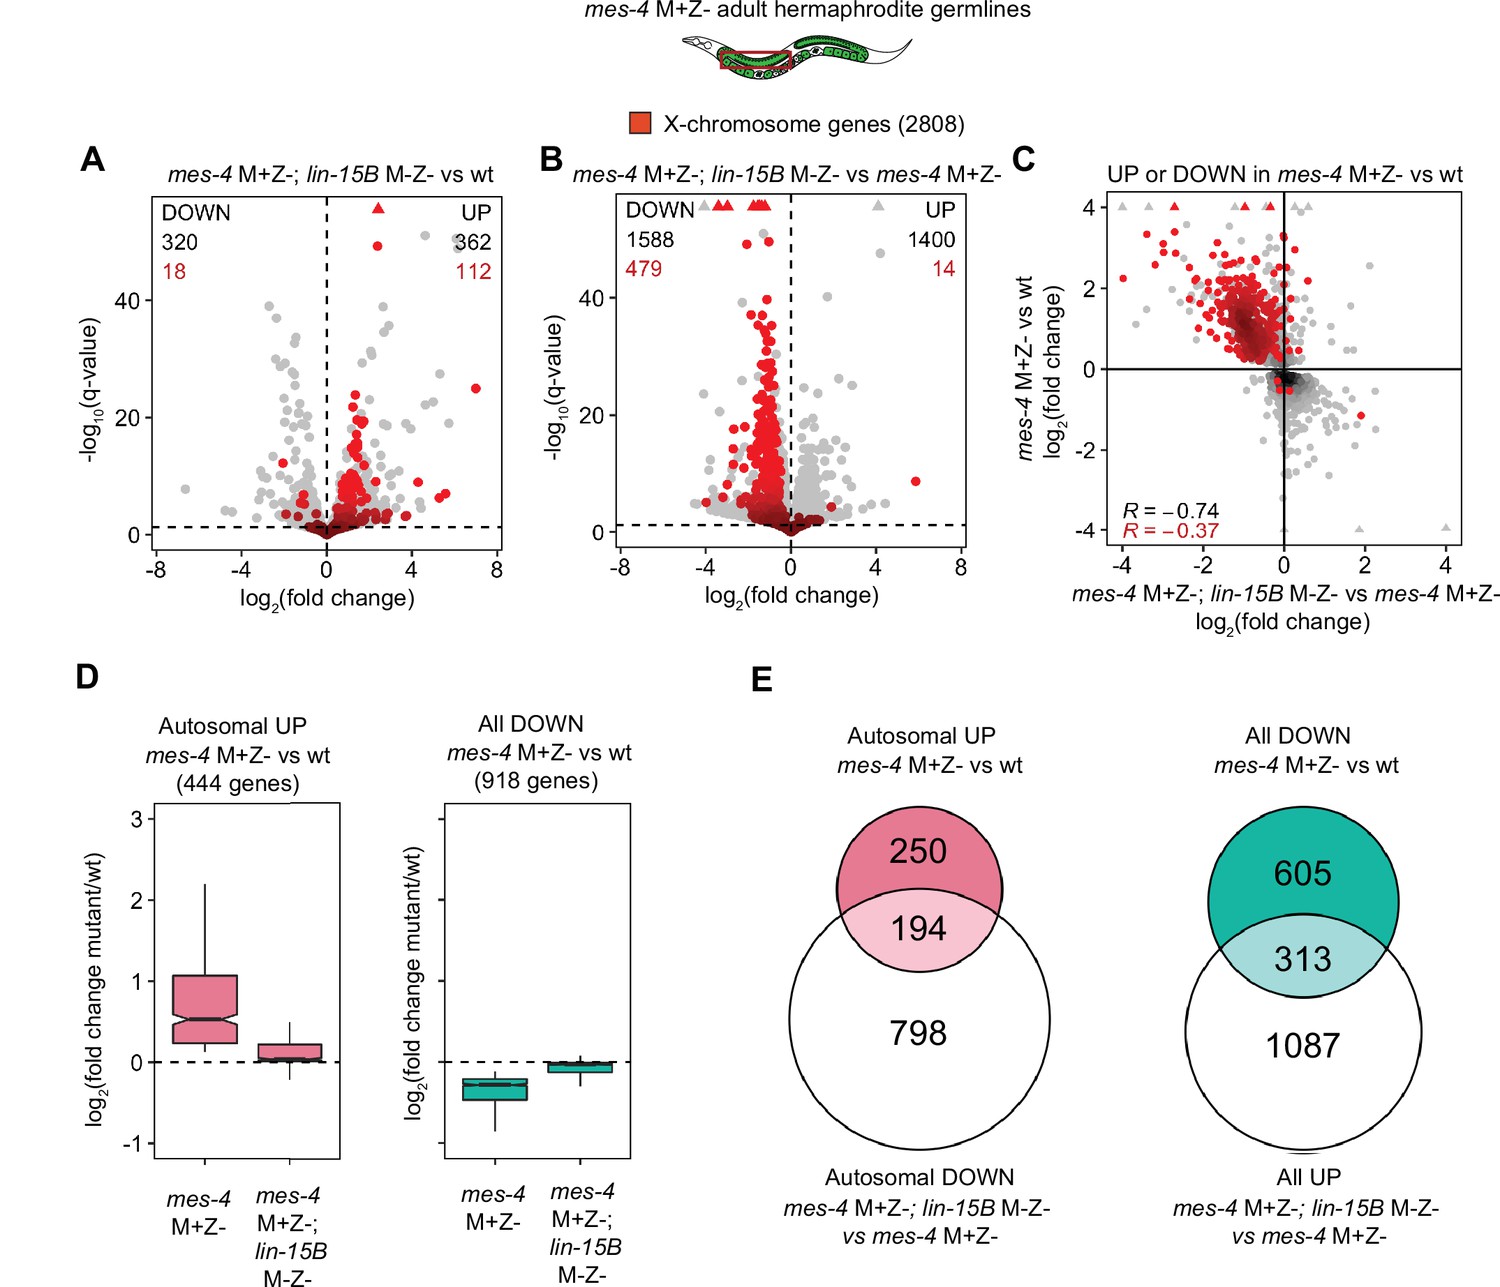
(A, B) Volcano plots as described for Figure 5A showing differential expression analysis for (A) mes-4 M+Z-; lin-15B M-Z- vs. wild-type (wt) adult germlines and (B) mes-4 M+Z-; lin-15B M-Z- vs. mes-4 M+Z- germlines. X genes are colored red. (C) Scatterplot comparing log2(fold change) in mes-4 M+Z- vs. wt adult germlines to log2(fold change) in mes-4 M+Z-; lin-15B M-Z- vs. mes-4 M+Z- adult germlines. Only genes that were upregulated (UP) or downregulated (DOWN) (q-value < 0.05) in mes-4 M+Z vs. wt adult germlines are shown. X genes are colored red. Spearman’s correlation coefficients for all plotted genes (black) and for plotted X genes (red) are indicated. (D) Boxplots as described for Figure 5B for autosomal UP genes in mes-4 M+Z- vs. wt (left) and for DOWN genes in mes-4 M+Z- vs. wt (right). (E) Venn diagrams as described for Figure 5C for the indicated gene sets.
Figure 5—figure supplement 3
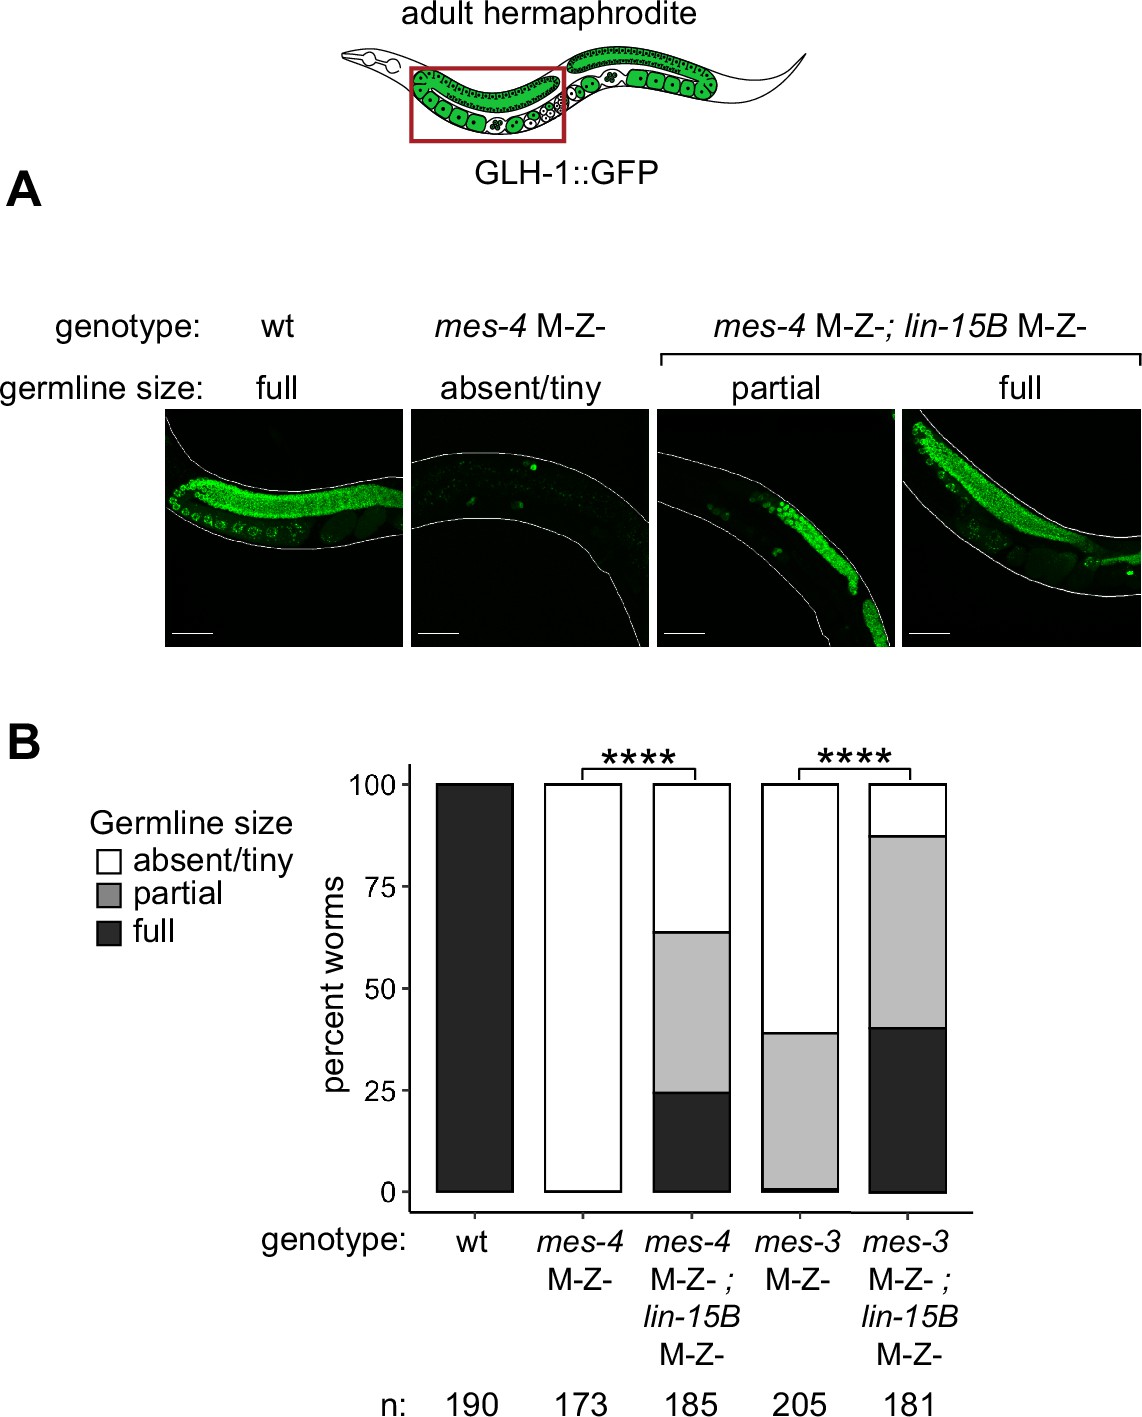
Removal of LIN-15B improves germline health in mes-4 and mes-3 M-Z- XooXsp mutant hermaphrodites.
(A) Representative images of live F1 adult hermaphrodite offspring with a germline scored as either absent/tiny, partial, or full. Genotypes of imaged worms with respect to mes-4 and lin-15B are indicated. All F1s inherited one X from the oocyte and one X from the sperm. Green signal is the germline marker GLH-1::GFP. Worm bodies are outlined in white. Scale bar is 45 µM. (B) Bar plots as described for Figure 5D showing distributions of germline size in F1 offspring. Genotypes and sample sizes are indicated. Percentages of F1s with full-sized germlines were compared using two-sided Fisher’s exact tests. p-value designation is ****<1e-5.
Figure 6 with 1 supplement
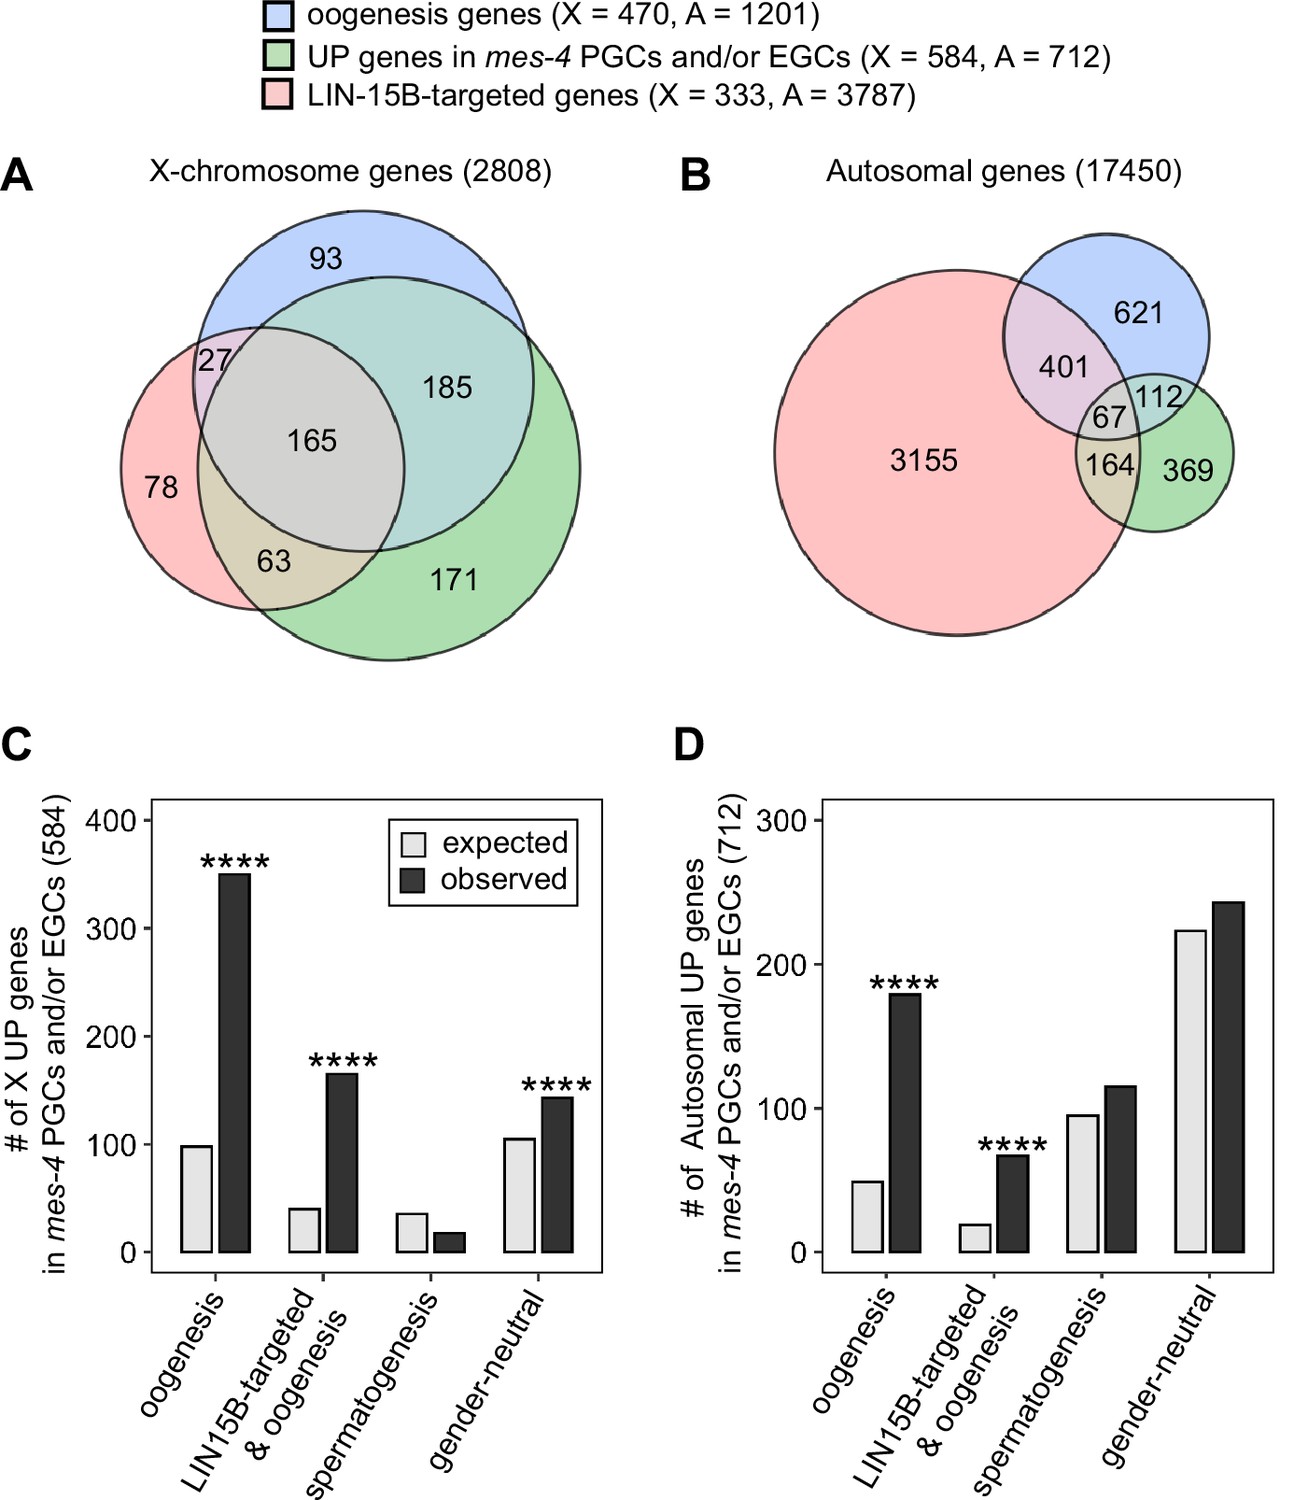
mes-4 M-Z- nascent germlines misexpress oogenesis genes.
(A, B) Venn diagrams comparing oogenesis genes, upregulated (UP) genes in mes-4 primordial germ cells (PGCs) and/or early germ cells (EGCs), and LIN-15B target genes on (A) the X chromosome and (B) the autosomes. (C, D) Bar plots showing the expected number (gray) and observed number (black) of misregulated genes that are members of the indicated gene sets for (C) the X chromosome and (D) the autosomes. Hypergeometric tests were performed in R to test for gene-set enrichment. p-value designation is ****<1e-5. Gene-set sizes for the X chromosome: oogenesis (470), LIN-15B-targeted and oogenesis (192), spermatogenesis (171), and gender-neutral (503). Gene-set sizes for the autosomes: oogenesis (1201), LIN-15B-targeted and oogenesis (468), spermatogenesis (2327), and gender-neutral (5470).
Figure 6—figure supplement 1
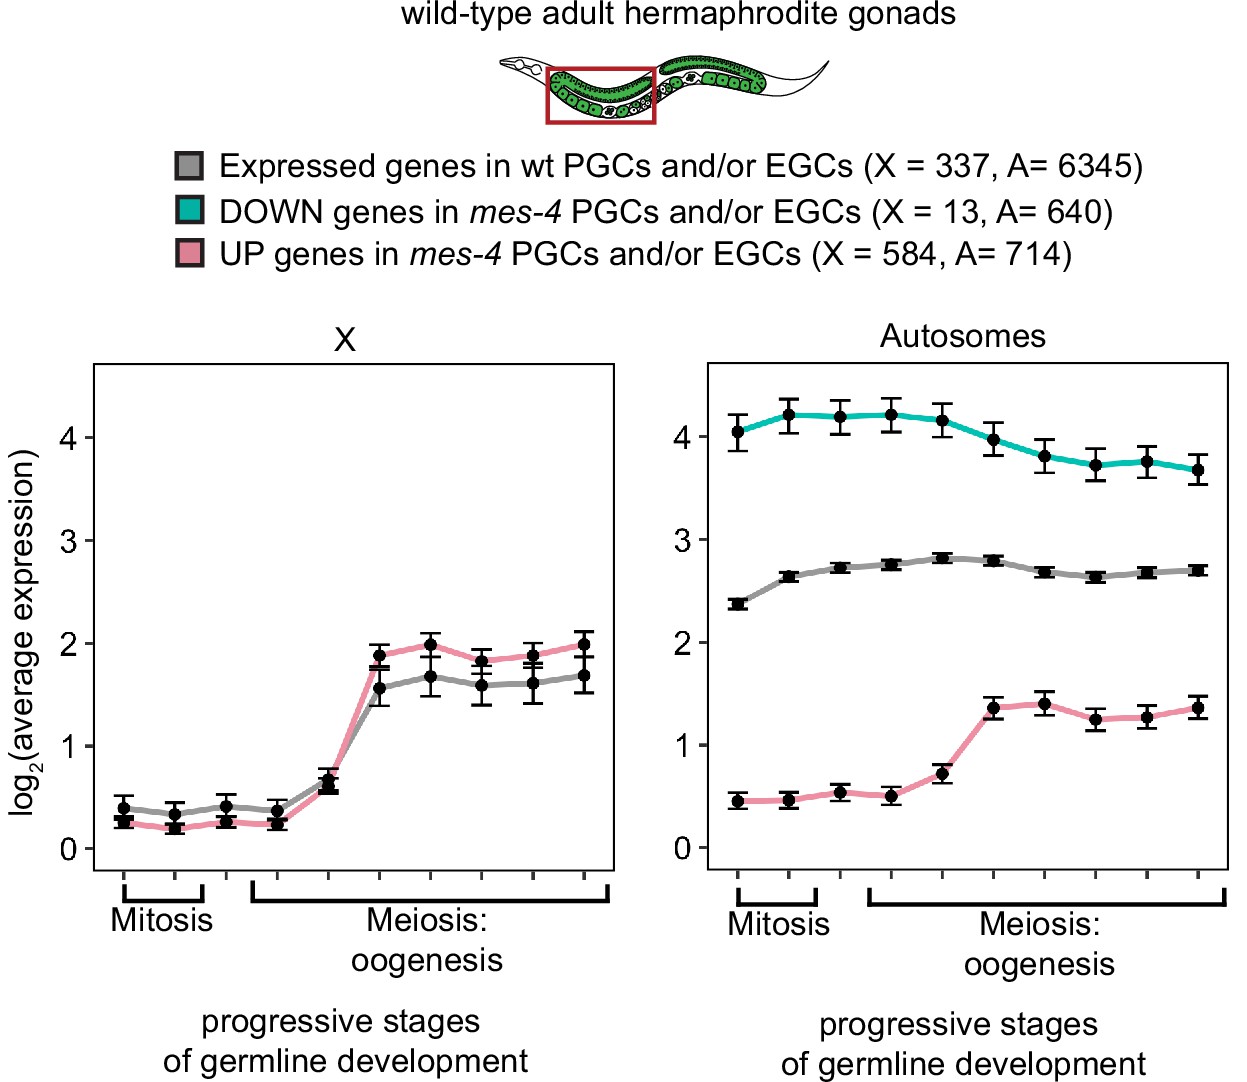
X UP genes have enriched transcript abundance during oogenesis compared to during pre-gametic stages.
Line plots showing log2(average expression) across 10 regions of a wild-type adult hermaphrodite germline that capture progressively later stages of germline development going from left to right (data from Tzur et al., 2018, Tables S2A and S10A). Average expression values were calculated in Tzur et al. by normalizing each gene’s read counts to the total number of read counts in a sample, multiplying those normalized values by 105, and finally averaging across two independent samples. Each dot represents the mean expression of a gene set (colors) in 1 of the 10 germline regions. Whiskers correspond to 95% confidence intervals of the mean. Gene-set sizes are indicated. The set of X downregulated (DOWN) genes was not analyzed due to its small size (13 genes).
Figure 7 with 2 supplements
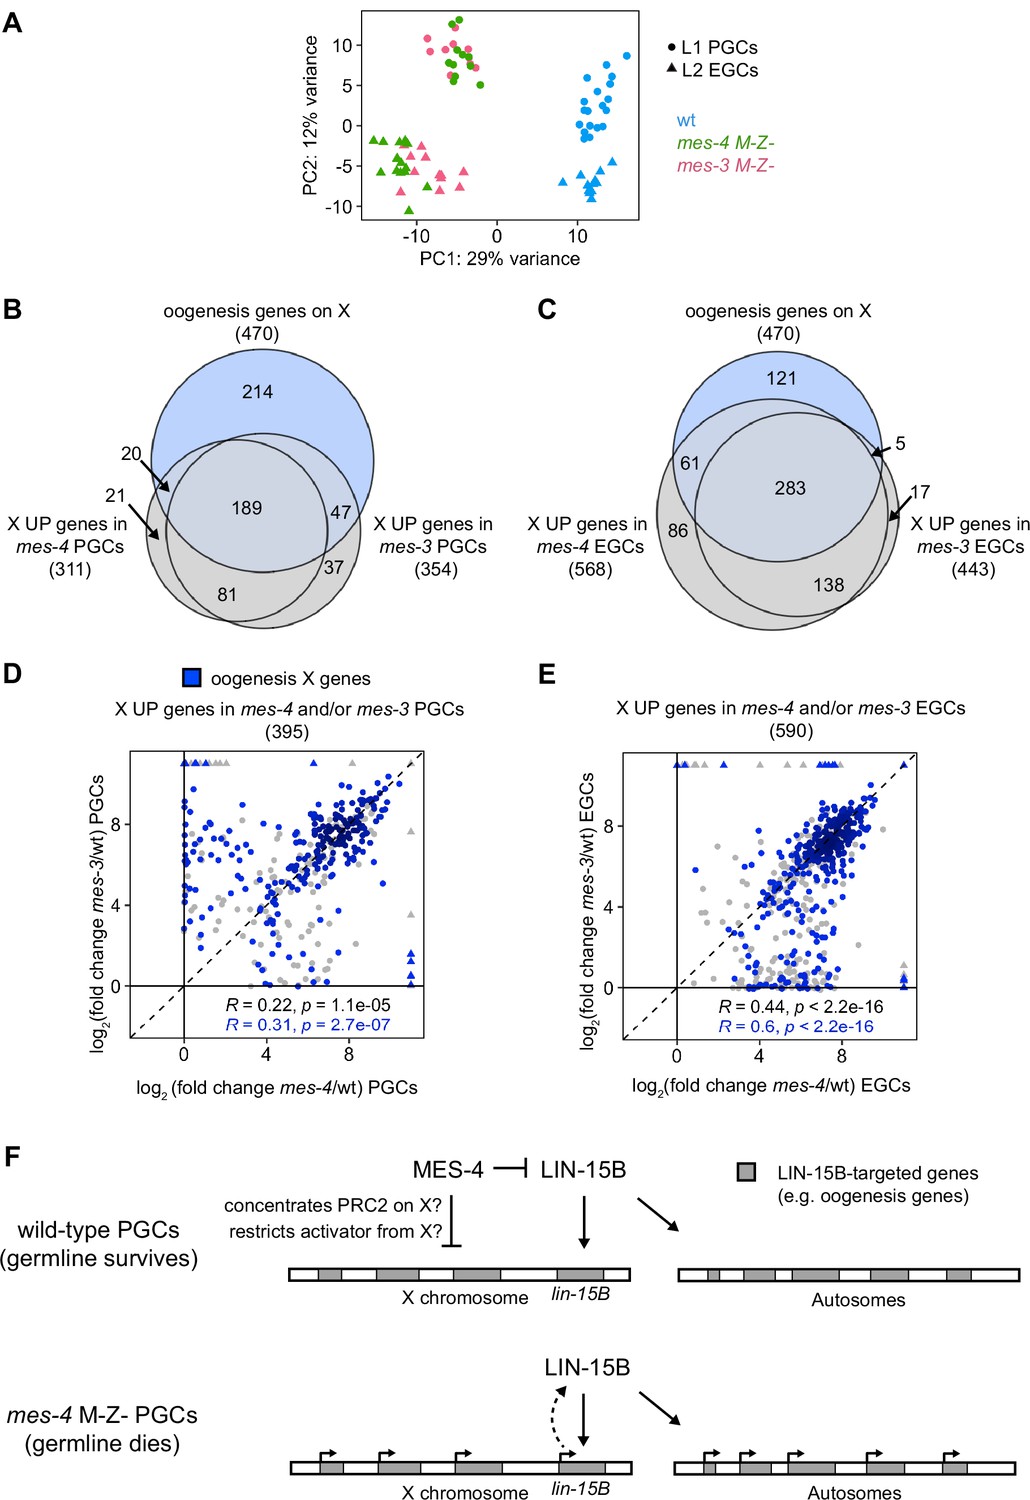
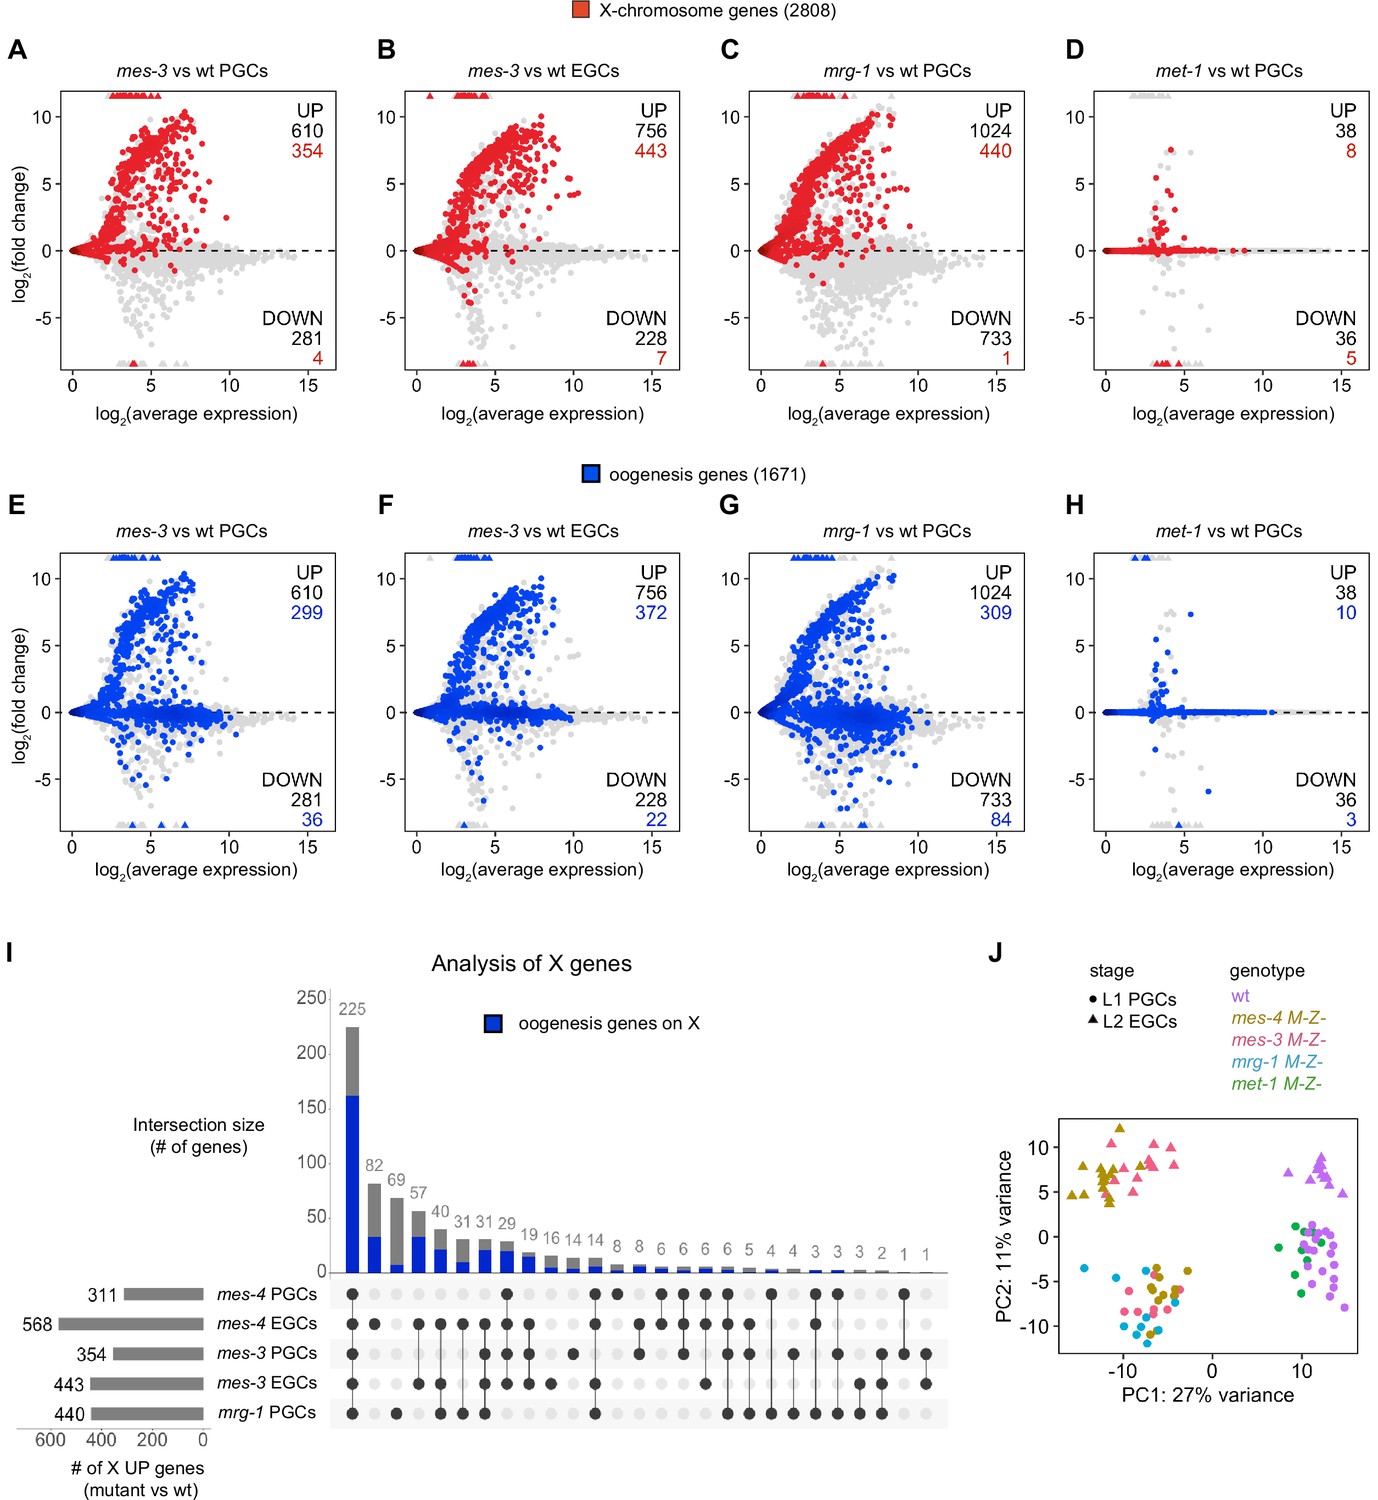
mes-4 M-Z- and mes-3 M-Z- nascent germlines misexpress a highly similar set of X genes, many of which are oogenesis genes.
(A) Principal component analysis (PCA) including all replicates of wild-type (wt) (blue), mes-4 M-Z- (green), and mes-3 M-Z- (pink) primordial germ cells (PGCs) (circles) and early germ cells (EGCs) (triangles). The percentages of total variance across all samples described by the top two principal components are indicated. (B, C) Venn diagrams comparing X oogenesis genes to (B) X UP genes in mes-4 and mes-3 PGCs and to (C) X UP genes in mes-4 and mes-3 EGCs. (D, E) Scatterplots comparing log2(fold change) (mutant vs. wt) of transcript abundance for X UP genes (gray circles) and X UP oogenesis genes (blue circles) in (D) mes-4 and/or mes-3 PGCs and in (E) mes-4 and/or mes-3 EGCs. The Spearman‘s correlation coefficients along with their p-values are indicated at the bottom of each scatterplot. (F) Cartoon model illustrating how MES-4 may protect germline survival by antagonizing LIN-15B. Our finding that the dose and gamete source of the X impact germline health upon loss of MES-4 focused our analysis on X genes. We identified LIN-15B as a key player in activating X genes, including lin-15B, and causing germline death upon loss of MES-4. LIN-15B may activate X genes directly by binding to those genes or indirectly by regulating one or more other transcription factors. MES-4 may repress lin-15B and other X genes by concentrating a repressor (e.g., PRC2) on the X or by restricting an activator (e.g., a histone acetyltransferase or LIN-15B) from the X. We do not know whether upregulation of X genes other than lin-15B and/or of autosomal genes contribute to germline death upon loss of MES-4.
Figure 7—figure supplement 1
Comparison of X and oogenesis gene misexpression in primordial germ cells (PGCs) and early germ cells (EGCs) dissected from various chromatin regulator mutants.
(A–H) MA plots as described for Figure 1B–D showing differential expression analysis for (A, E) mes-3 M-Z- vs. wild-type (wt) PGCs, (B, F) mes-3 M-Z- vs. wt EGCs, (C, G) mrg-1 M-Z- vs. wt PGCs, and (D, H) met-1 M-Z- vs. wt PGCs. X genes are colored red, and oogenesis genes are colored blue. Numbers of biological replicates (sets of two cells): 19 wt PGCs, 13 wt EGCs, 11 mes-4 PGCs, 15 mes-4 EGCs, 10 mes-3 PGCs, 12 mes-3 EGCs, 10 mrg-1 PGCs, and 10 met-1 PGCs. (I) Upset plot generated using the UpsetR R package comparing sets of X UP (mutant vs. wt) genes across mes-4 PGCs, mes-4 EGCs, mes-3 PGCs, mes-3 EGCs, and mrg-1 PGCs. The blue bars show the subsets of X UP genes that are X UP oogenesis genes. (J) Principal component analysis (PCA) plot showing all analyzed transcript profiles across the first two principal components. Variance-stabilized counts computed by the vst function in DESeq2 were used to perform PCA. Stages and genotypes of worms are indicated by shape and color, respectively.
Figure 7—figure supplement 2
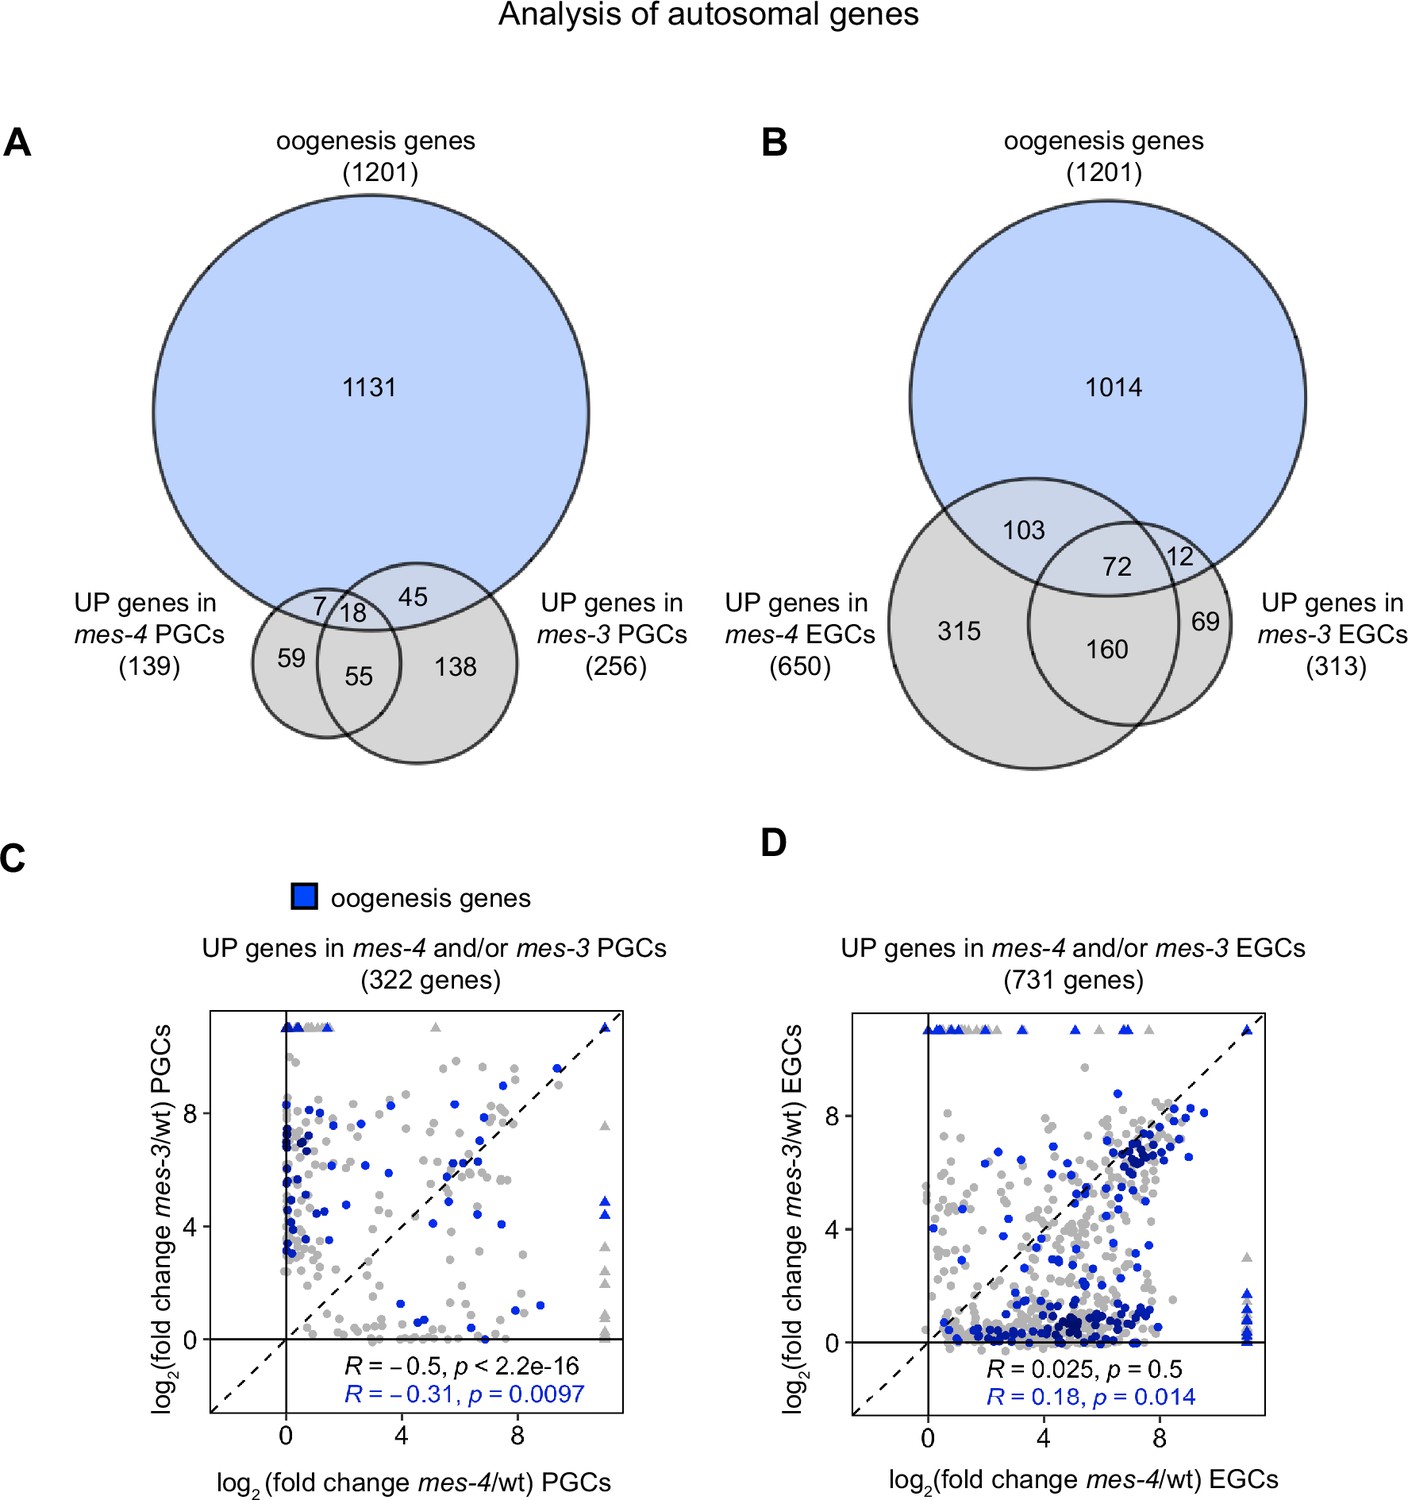
Comparison of autosomal UP genes in mes-4 and mes-3 primordial germ cells (PGCs) and early germ cells (EGCs).
(A, B) Venn diagrams comparing autosomal oogenesis genes to autosomal UP genes in (A) mes-4 and mes-3 PGCs and (B) mes-4 and mes-3 EGCs. (C, D) Scatterplots comparing log2(fold change) (mutant vs. wild-type [wt]) of transcript abundance for autosomal UP genes (gray circles) and autosomal oogenesis UP genes (blue circles) in (C) mes-4 and/or mes-3 PGCs and (D) mes-4 and/or mes-3 EGCs. Spearman’s correlation coefficients along with their p-values are at the bottom of each scatterplot.
Author response image 1
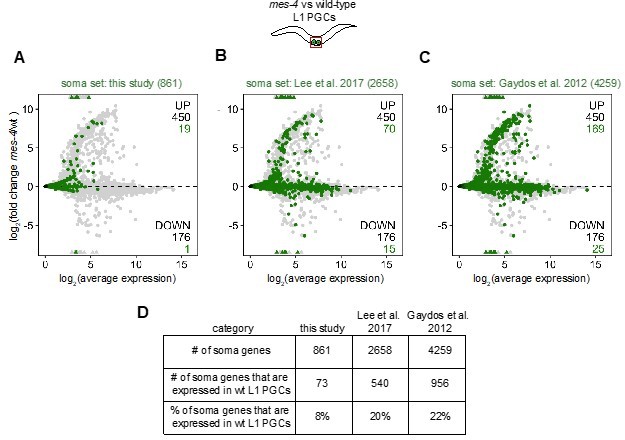
Evaluation of the specificity of our soma-specific gene set and 2 other “soma” gene sets.
(A,B,C,) MA plots showing log2(average expression) versus log2(fold change) of transcript abundance for 20,258 protein-coding genes (circles) between mes-4 and wt PGCs. Numbers of biological replicates (sets of 2 cells): 19 wt PGCs and 11 mes-4 PGCs. Genes that exceed one or both plot scales (triangles) are set at the maximum value of the scale. Genes belonging to a “soma” gene set are colored: (A) 861 soma-specific genes that were defined in this study, (B) 2658 soma genes that were defined in Lee et al. (2017), and (C) 4259 soma genes that were defined in Gaydos et al. (2012). Differentially expressed genes in mes-4 vs wt PGCs were identified using Wald tests in DESeq2 and by setting a q-value < 0.05 significance threshold. Numbers of all mis-regulated genes (black) and numbers of those in the soma gene sets (colored) are indicated in the corners; top is upregulated (UP) and bottom is downregulated. (D) Table showing, for each soma gene set, the number of genes in the set, the number of genes that are expressed in wt PGCs, and the percentage of genes that are expressed in wt PGCs. We categorized 5,858 protein-coding genes that have a minimum average normalized read count of 1 in wt PGCs as “expressed in wt PGCs”.
Additional files
-
Supplementary file 1
List of differentially expressed genes in mutant vs. wild-type (wt) primordial germ cells (PGCs) and early germ cells (EGCs).
Six tables show the results of differential expression analysis of mes-4 vs. wt PGCs, mes-4 vs. wt EGCs, mes-3 vs. wt PGCs, mes-3 vs. wt EGCs, mrg-1 vs. wt PGCs, and met-1 vs. wt PGCs. Numbers of biological replicates for each condition are in the legend of Figure 7—figure supplement 1. Each table includes the wormbase ID and public ID for each differentially expressed gene in the respective comparison, a column that indicates whether a differentially expressed gene was upregulated or downregulated, and a column that indicates whether each gene is X-linked or autosomal.
- https://cdn.elifesciences.org/articles/77951/elife-77951-supp1-v2.xlsx
-
Supplementary file 2
List of DNA/RNA oligos used in the study.
For each oligo, its DNA or RNA sequence and a description of how it was used in the study are included.
- https://cdn.elifesciences.org/articles/77951/elife-77951-supp2-v2.xlsx
-
MDAR checklist
- https://cdn.elifesciences.org/articles/77951/elife-77951-mdarchecklist1-v2.docx
Download links
A two-part list of links to download the article, or parts of the article, in various formats.
Downloads (link to download the article as PDF)
Open citations (links to open the citations from this article in various online reference manager services)
Cite this article (links to download the citations from this article in formats compatible with various reference manager tools)
Maternal H3K36 and H3K27 HMTs protect germline development via regulation of the transcription factor LIN-15B
eLife 11:e77951.
https://doi.org/10.7554/eLife.77951


