FSH-blocking therapeutic for osteoporosis
- Center for Translational Medicine and Pharmacology and The Mount Sinai Bone Program, Departments of Medicine and of Pharmacological Sciences, Icahn School of Medicine at Mount Sinai, United States
- Maine Medical Center Research Institute, United States
- BioMedical Engineering and Imaging Institute, Icahn School of Medicine at Mount Sinai, United States
- Tisch Cancer Institute, Icahn School of Medicine at Mount Sinai, United States
- United States Department of Agriculture, Grand Forks Human Nutrition Research Center, United States
- Sidney Kimmel Comprehensive Cancer Center, Johns Hopkins University, United States
Figures
Figure 1 with 1 supplement
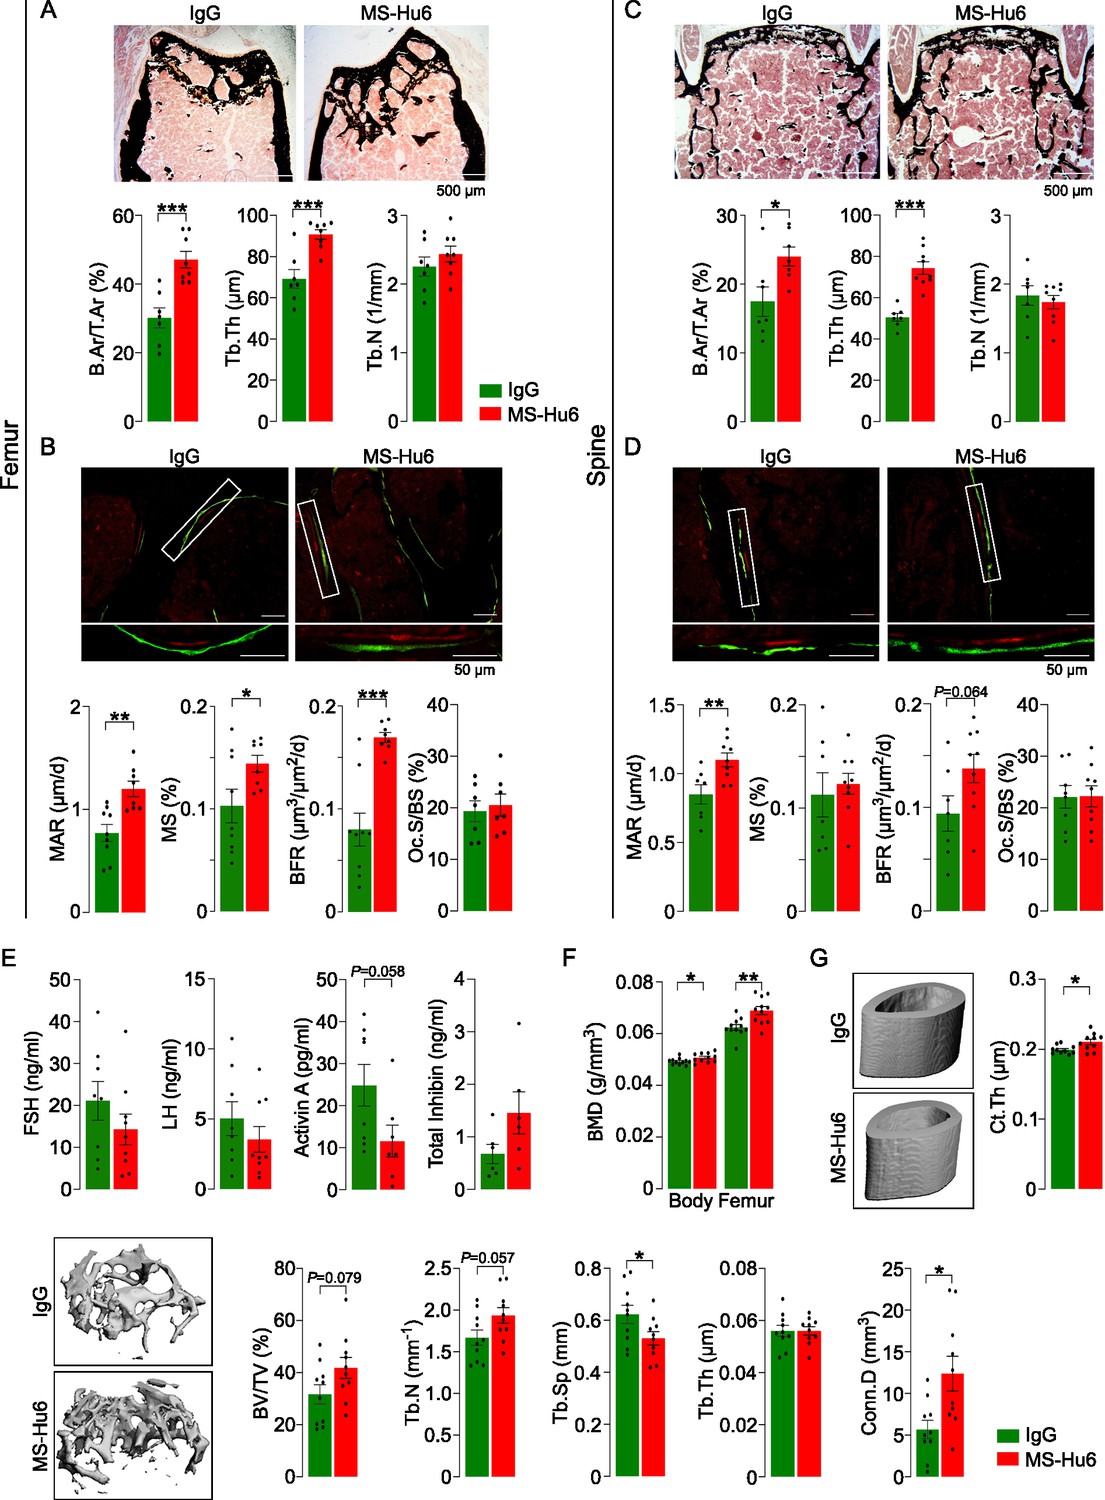
MS-Hu6 stimulates new bone formation and increases bone mass.
Representative images of von Kossa-stained femoral epiphyses (A) and spine (C) of male FVB (Thermo) mice treated with MS-Hu6 or human IgG. Two-dimensional histomorphometric parameters showing bone volume (B.Ar/T.Ar), trabecular thickness (Tb.Th), and trabecular number (Tb.N). Dynamic histomorphometry showing representative images of double-labeled sections and quantitative data on mineral apposition rate (MAR), mineralizing surface (MS), and bone formation rate (BFR) at femoral epiphyses (B) and spine (D); osteoclast surfaces (Oc.S) are also shown. Shown also are serum follicle-stimulating hormone (FSH), luteinizing hormine (LH), activin A, and inhibin levels (E). Parallel studies carried out at C.J.R.’s lab used ovariectomized C57BL/6 mice, which were injected 18 weeks post-ovariectomy with MS-Hu6 or human IgG for 8 weeks. Shown are PIXImus measurements of total body and femur bone mineral density (BMD) (F), as well as µCT images and quantitative estimates of fractional bone volume (BV/TV), Tb.N, trabecular spacing (Tb.S) and Tb.Th, connectivity density (Conn.D), and cortical thickness (Ct.Th) (G) (performed at J.J.C.’s lab). Statistics: mean ± SEM; N=7, 8 mice/group for panel A; N=7–9 mice/group for panels B, C, and D; N=6–9 mice/group for panel E; N=11 mice/group for panel F; and N=10 mice/group for panel G; two-tailed Student’s t-test (IgG versus MS-Hu6), *p<0.05, **p<0.01, ***p<0.001, or as shown.
-
Figure 1—source data 1
Source data for Figure 1.
- https://cdn.elifesciences.org/articles/78022/elife-78022-fig1-data1-v2.xlsx
Figure 1—figure supplement 1
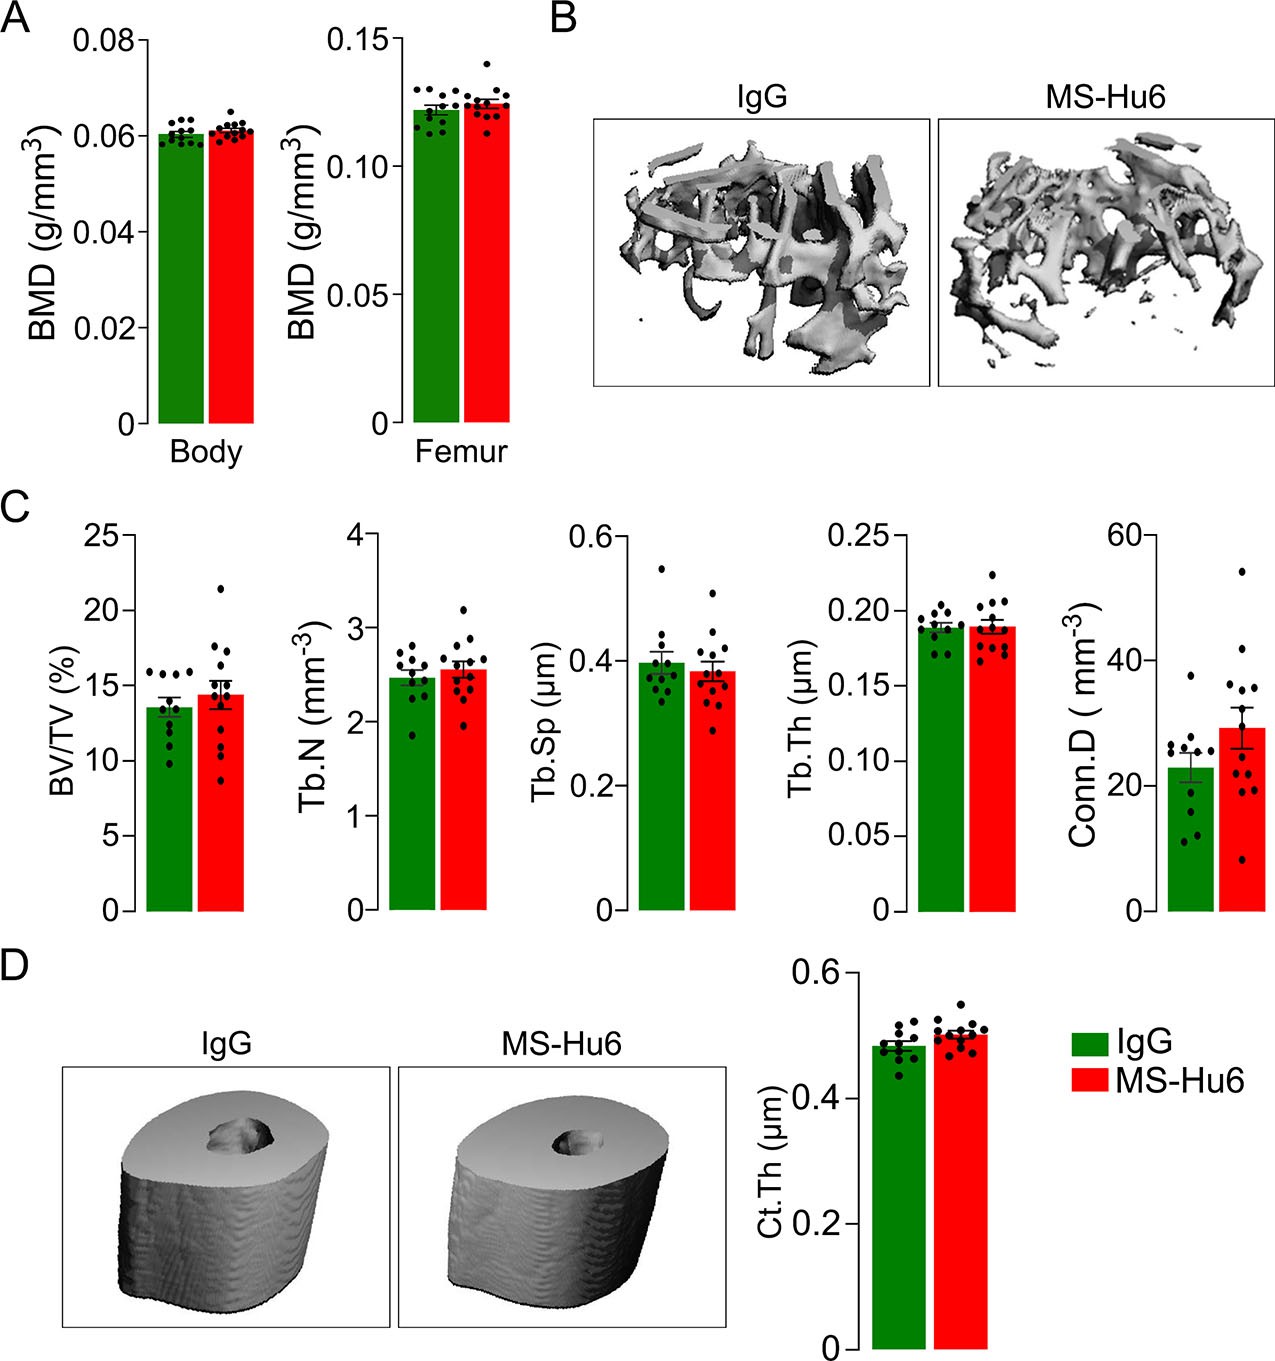
Bone phenotype of the C3H/HeJ mouse is resistant to anabolic actions of MS-Hu6.
PIXImus measurements of total body and femur bone mineral density (BMD) (A), as well as µCT images (B, D) and quantitative estimates of fractional bone volume (BV/TV), trabecular number (Tb.N), trabecular spacing (Tb.Sp) and trabecular thickness (Tb.Th), connectivity density (Conn.D) (C), and cortical thickness (Ct.Th) (D). Statistics: mean ± SEM, N=11–13 mice/group, two-tailed Student’s t-test (IgG versus MS-Hu6). Experiment performed at C.J.R. lab, with µCT analysis independently at J.J.C. lab.
-
Figure 1—figure supplement 1—source data 1
Source data for Figure 1—figure supplement 1.
- https://cdn.elifesciences.org/articles/78022/elife-78022-fig1-figsupp1-data1-v2.xlsx
Figure 2
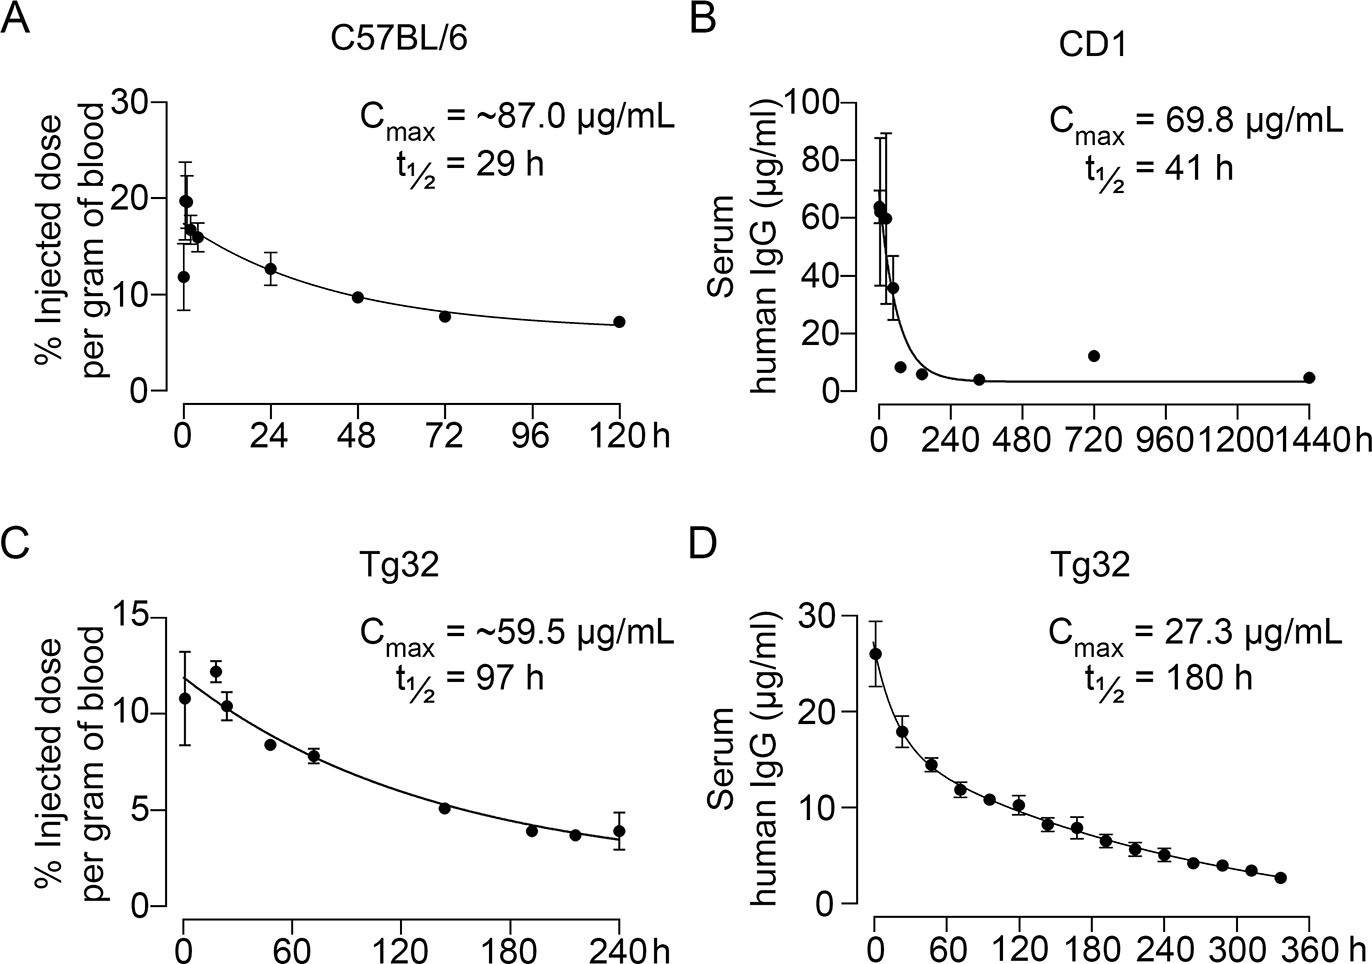
Pharmacokinetics of MS-Hu6.
Plasma levels, Cmax and β phase t½ values for MS-Hu6 injected into C57BL/6 mice (250 µCi of 89Zr-MS-Hu6, N=5 mice per experiment followed longitudinally, two combined experiments) (A), CD1 mice (200 µg biotinylated MS-Hu6, N=3–4 mice per time point) (B), Tg32 mice (250 µCi of 89Zr-MS-Hu6, N=5 mice followed longitudinally) (C), and Tg32 mice (200 µg unconjugated MS-Hu6, N=5 mice followed longitudinally) (D). Data are presented as mean ± SEM.
-
Figure 2—source data 1
Source data for Figure 2.
- https://cdn.elifesciences.org/articles/78022/elife-78022-fig2-data1-v2.xlsx
Figure 3
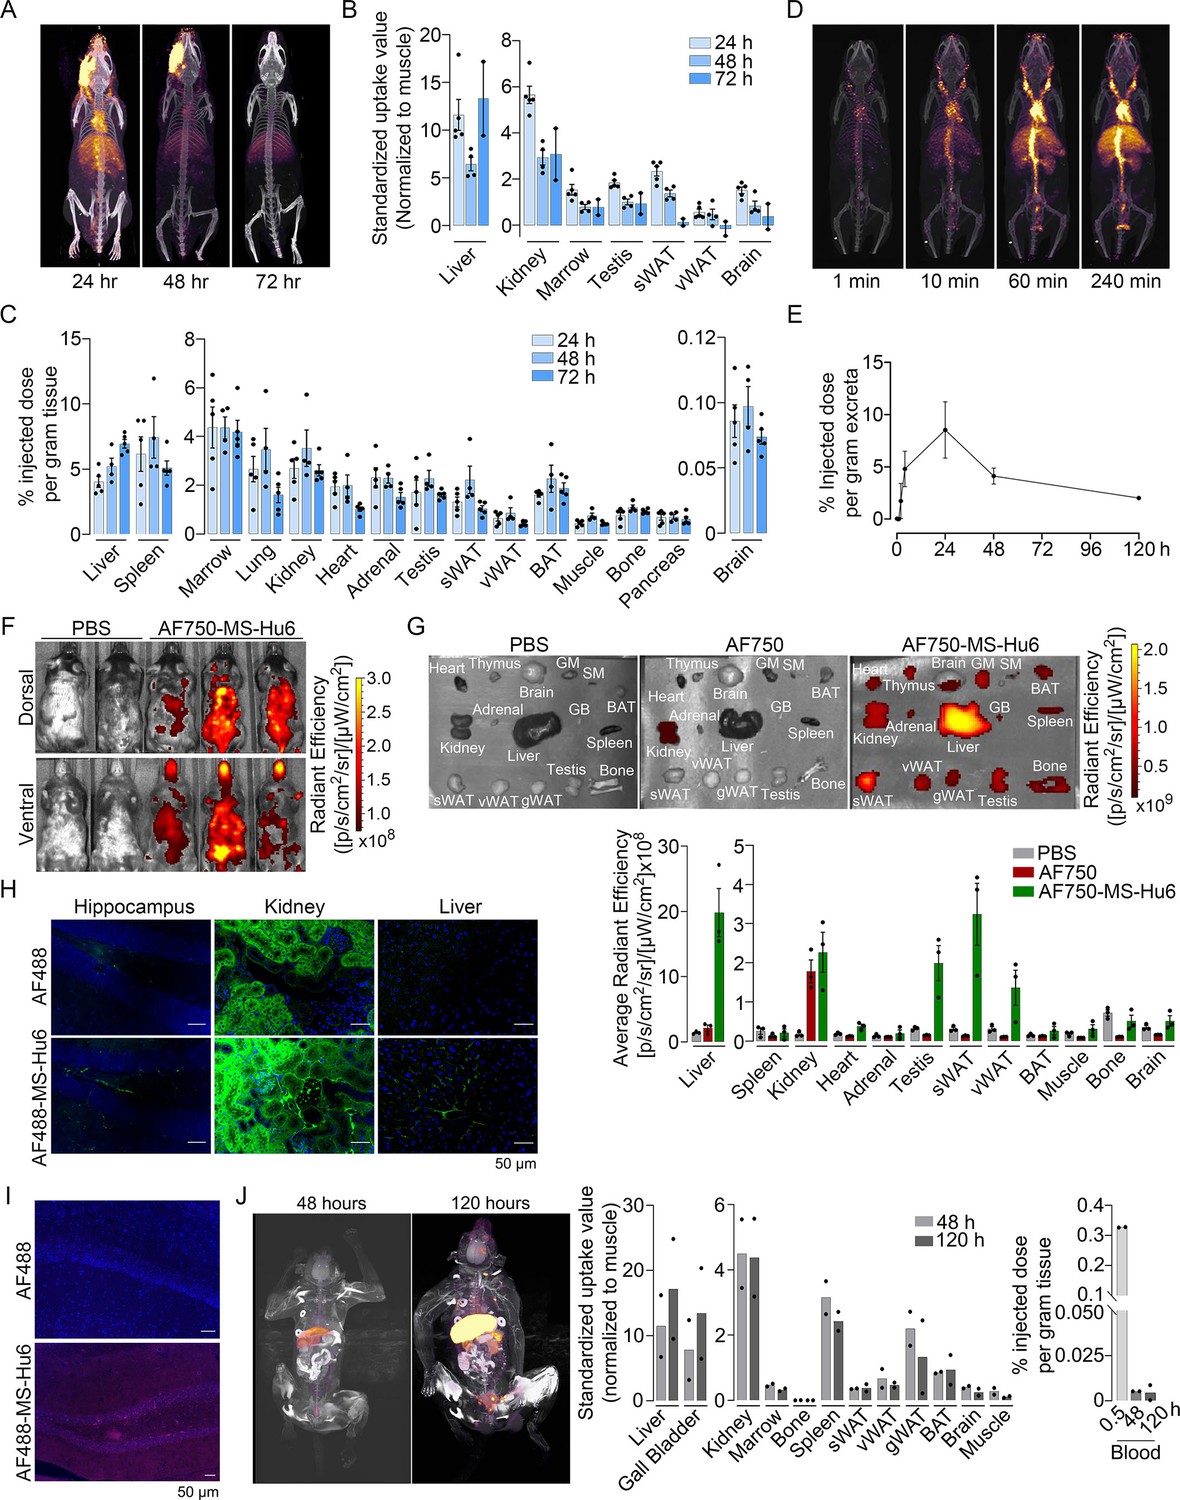
Biodistribution and excretion of MS-Hu6 in mice and monkeys.
Representative PET-CT images of mice treated with a single bolus dose of 89Zr-labeled MS-Hu6 (250 µCi) at 24, 48, and 72 hours (A), together with quantitation in terms of standardized value uptake units (SUVs, normalized to muscle) in different organs (N=5, 4 and 2 mice for the three time points, respectively) (B). 89Zr-MS-Hu6 (γ-counts) in individual tissues isolated following perfusion of the mice with 20 mL PBS (N=5, 4 and 5 mice for the three time points, respectively) (C). Dynamic PET/CT images showing the uptake of 89Zr-MS-Hu6 over 240 min (D). Time course of excretion of 89Zr-labeled MS-Hu6 in feces (N=5 mice/time point) (E). Emitted whole body radiance on IVIS imaging of C57BL/6 mice injected with AF750-MS-Hu6 (200 µg) or PBS (F). IVIS imaging and quantitation (average radiance) of isolated perfused tissues, as shown, following AF750-MS-Hu6, AF750, or PBS injection (N=3 mice/group) (G). Immunofluorescence micrographs of hippocampal, kidney, and liver sections from C57BL/6 mice injected with AF488-MS-Hu6 or unconjugated AF488 (200 µg/mouse, i.v.) (AF488 - green; DAPI - blue) (H). Counterstaining with an anti-human IgG confirmed localization (AF488 - red; DAPI - blue) (I). Whole body PET/CT image, quantitation (SUVs) of multiple organs and serum radioactivity (γ-counts) following a single i.v. injection of 89Zr-MS-Hu6 (1.3 mg, ~1.3 mCi) in two Cynomolgus monkeys aged 14 and 15 years, respectively (J). Data are presented as mean ± SEM .
-
Figure 3—source data 1
Source data for Figure 3.
- https://cdn.elifesciences.org/articles/78022/elife-78022-fig3-data1-v2.xlsx
Figure 4
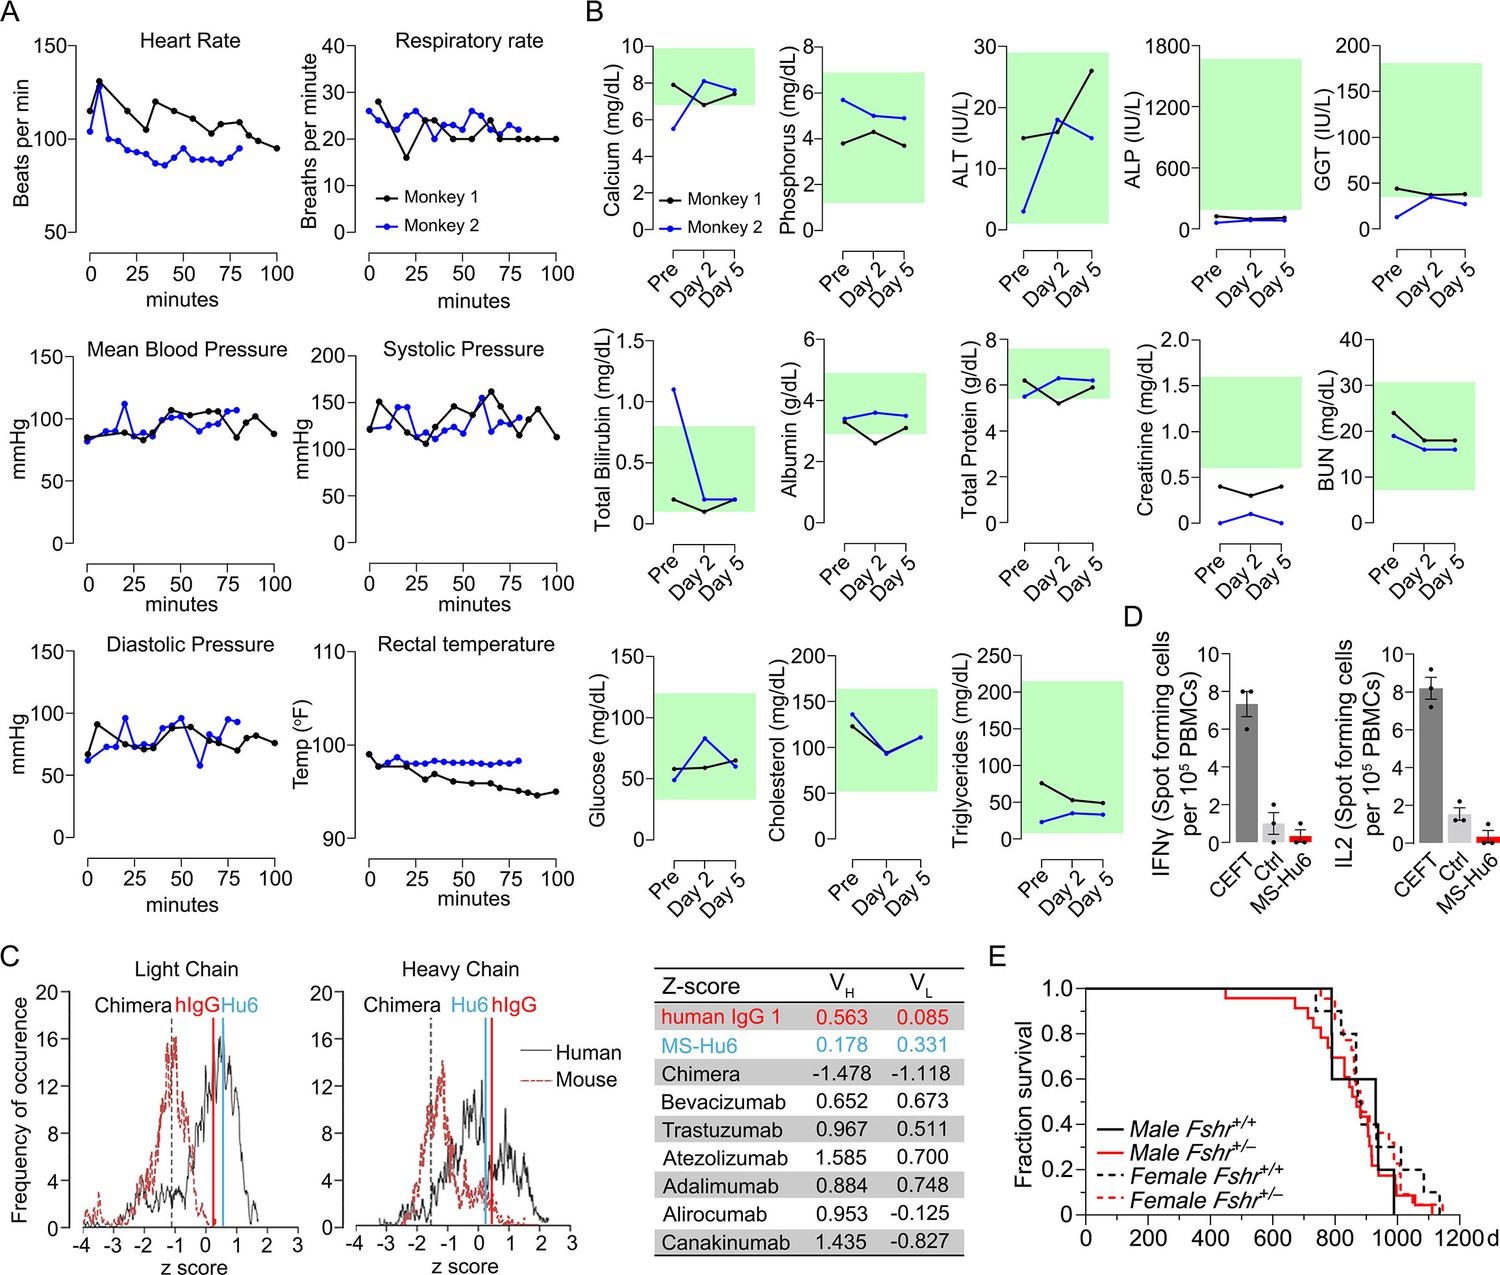
Acute and chronic tolerability of MS-Hu6.
Effects on physiological parameters monitored up to 100 min (A) and serum biochemistry (at days 0, 2, and 5) (B) after injecting 89Zr-MS-Hu6 as a single i.v. bolus dose (1.3 mg, ~1.3 mCi) into the tail veins of Cynomolgus monkeys (“Andy”, 14 years/9.8 kg, and “Scott”, 15 years/6.15 kg). Normative serum biochemistry data (green) from Koo et al., 2019. In silico assessment of “humanness” using abYsis, with Z-scores comparing humanized MS-Hu6, mouse-human chimeric antibody (Gera et al., 2020), and human IgG1 (C). Table shows narrowly distributed Z-scores after inputting primary sequences of FDA-approved, clinically utilized humanized (“zumab”), and fully human (“mab”) antibodies: bevacizumab (anti-VEGF, Avastin); trastuzumab (anti-HER2, Herceptin); atezolizumab (anti-PD-L1, Tecentriq); adalimumab (anti-TNFα, Humira); alirocumab (anti-PCSK9, Praluent); and canakinumab (anti-IL-β; Ilaris) (C). Assessment of immunogenicity using ELISpot assays for the inflammatory cytokines IFNγ and IL-2 in human peripheral blood mononuclear cell cultures in response to added MS-Hu6, Dulbecco’s Modified Eagle’s Medium (DMEM) (Ctrl), or peptide pool from cytomegalovirus, Epstein-Barr virus, influenza and tetanus toxoid (CEFT) (positive control, Immunospot) (D). Kaplan–Meier survival curves showing that haploinsufficiency of Fshr, which otherwise mimics the effect of MS-Hu6 on bone mass (Sun et al., 2006; Liu et al., 2017), does not reduce lifespan compared with wild-type littermates over 1100 days (3 years; 5, 10 mice for wild-type male and female, and 23, 22 mice for male and female Fshr+/- mice, respectively) (E).
-
Figure 4—source data 1
Source data for Figure 4.
- https://cdn.elifesciences.org/articles/78022/elife-78022-fig4-data1-v2.xlsx
Figure 5
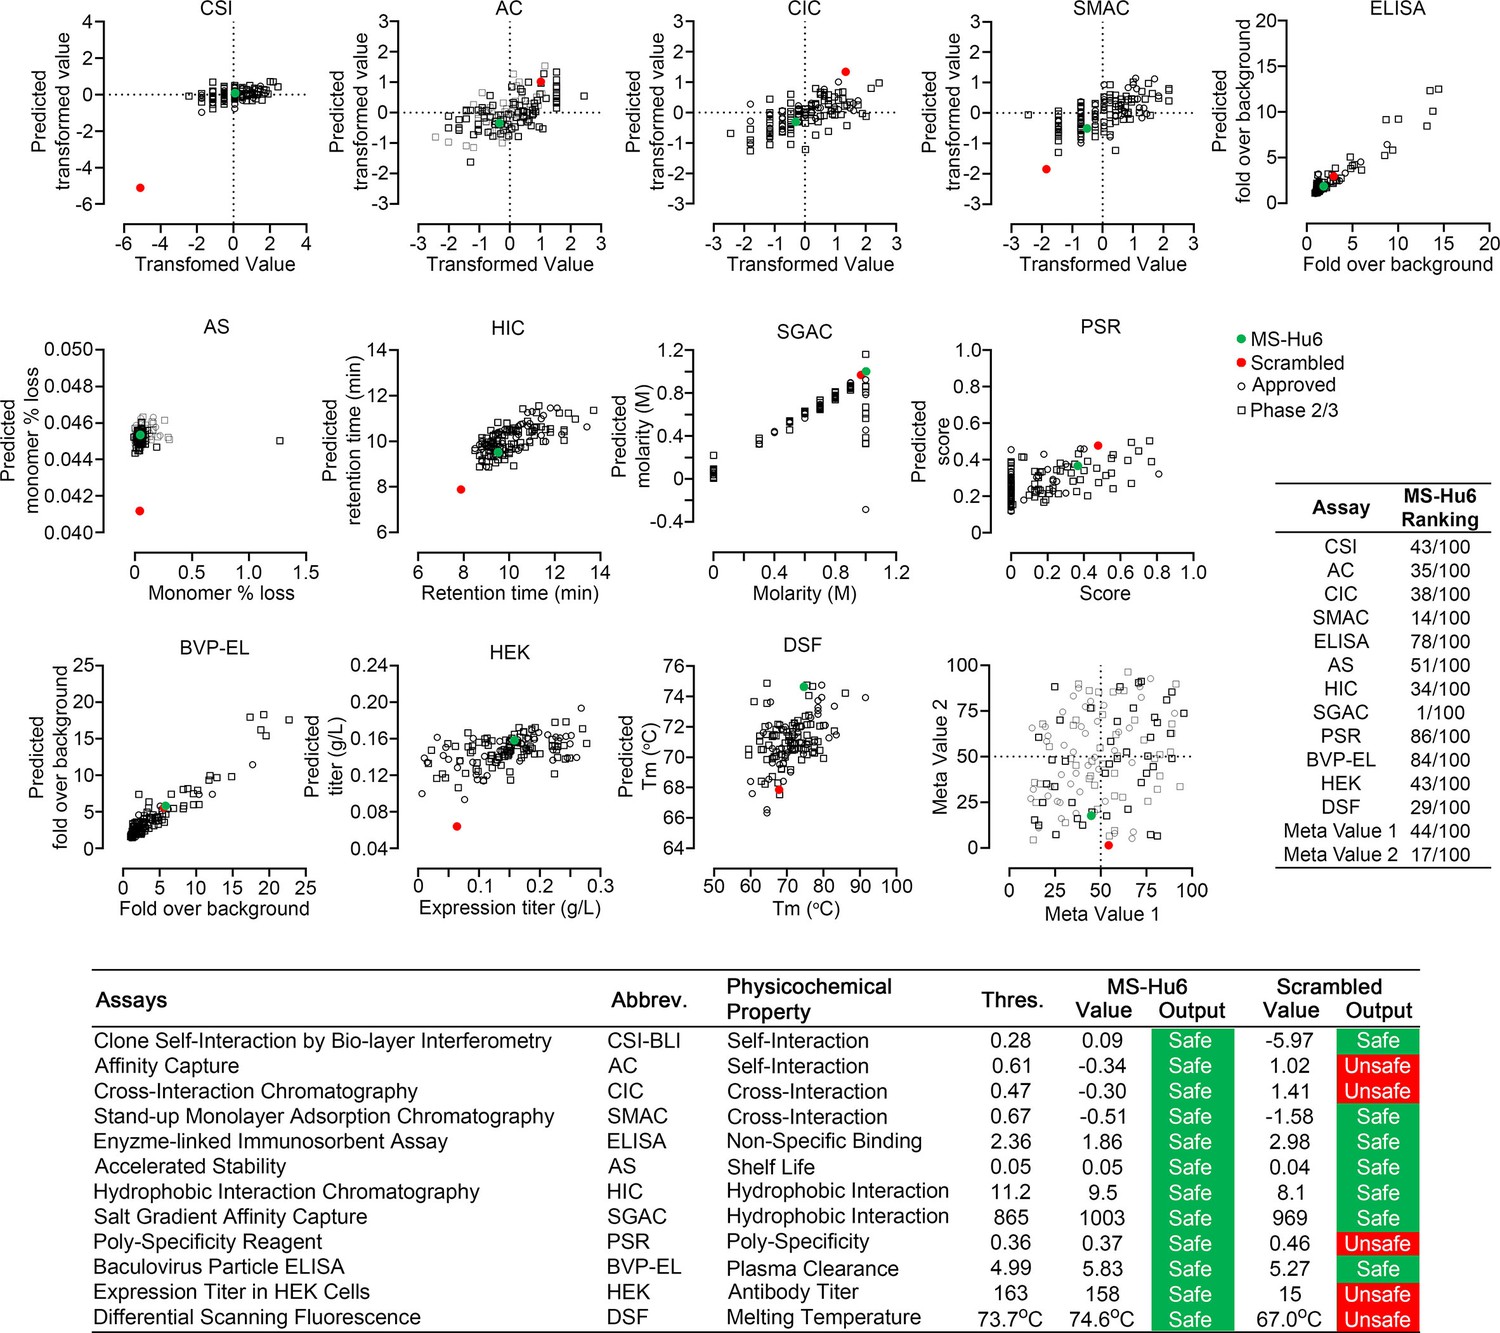
Manufacturability of MS-Hu6.
Protein–Sol Abpred was used to compare twelve physicochemical parameters that were computationally derived for MS-Hu6 against experimental derivations of 48 FDA-approved antibodies and 89 antibodies in late-stage (phase 2/3) clinical development. MS-Hu6 fell within the “safe” range and was therefore considered manufacturable. The relative ranking of specific parameters is shown (1 = best, 100 = worst; Table, insert). A variation of MS-Hu6, in which the CDR regions were scrambled, failed 5 of 12 outputs, indicating non-manufacturability. While 65% FDA-approved monoclonal antibodies show no ‘red flags,’ those with up to four red flags have been approved by the FDA (Jain et al., 2017). Also shown are meta values for both MS-Hu6 and its scrambled sequence (1 = best; 100 = worst) derived by averaging ranks for eight experimental parameters. MS-Hu6 fell within the lower left quadrant, confirming that physicochemical properties were acceptable for manufacturing.
-
Figure 5—source data 1
Source data for Figure 5.
- https://cdn.elifesciences.org/articles/78022/elife-78022-fig5-data1-v2.xlsx
Figure 6
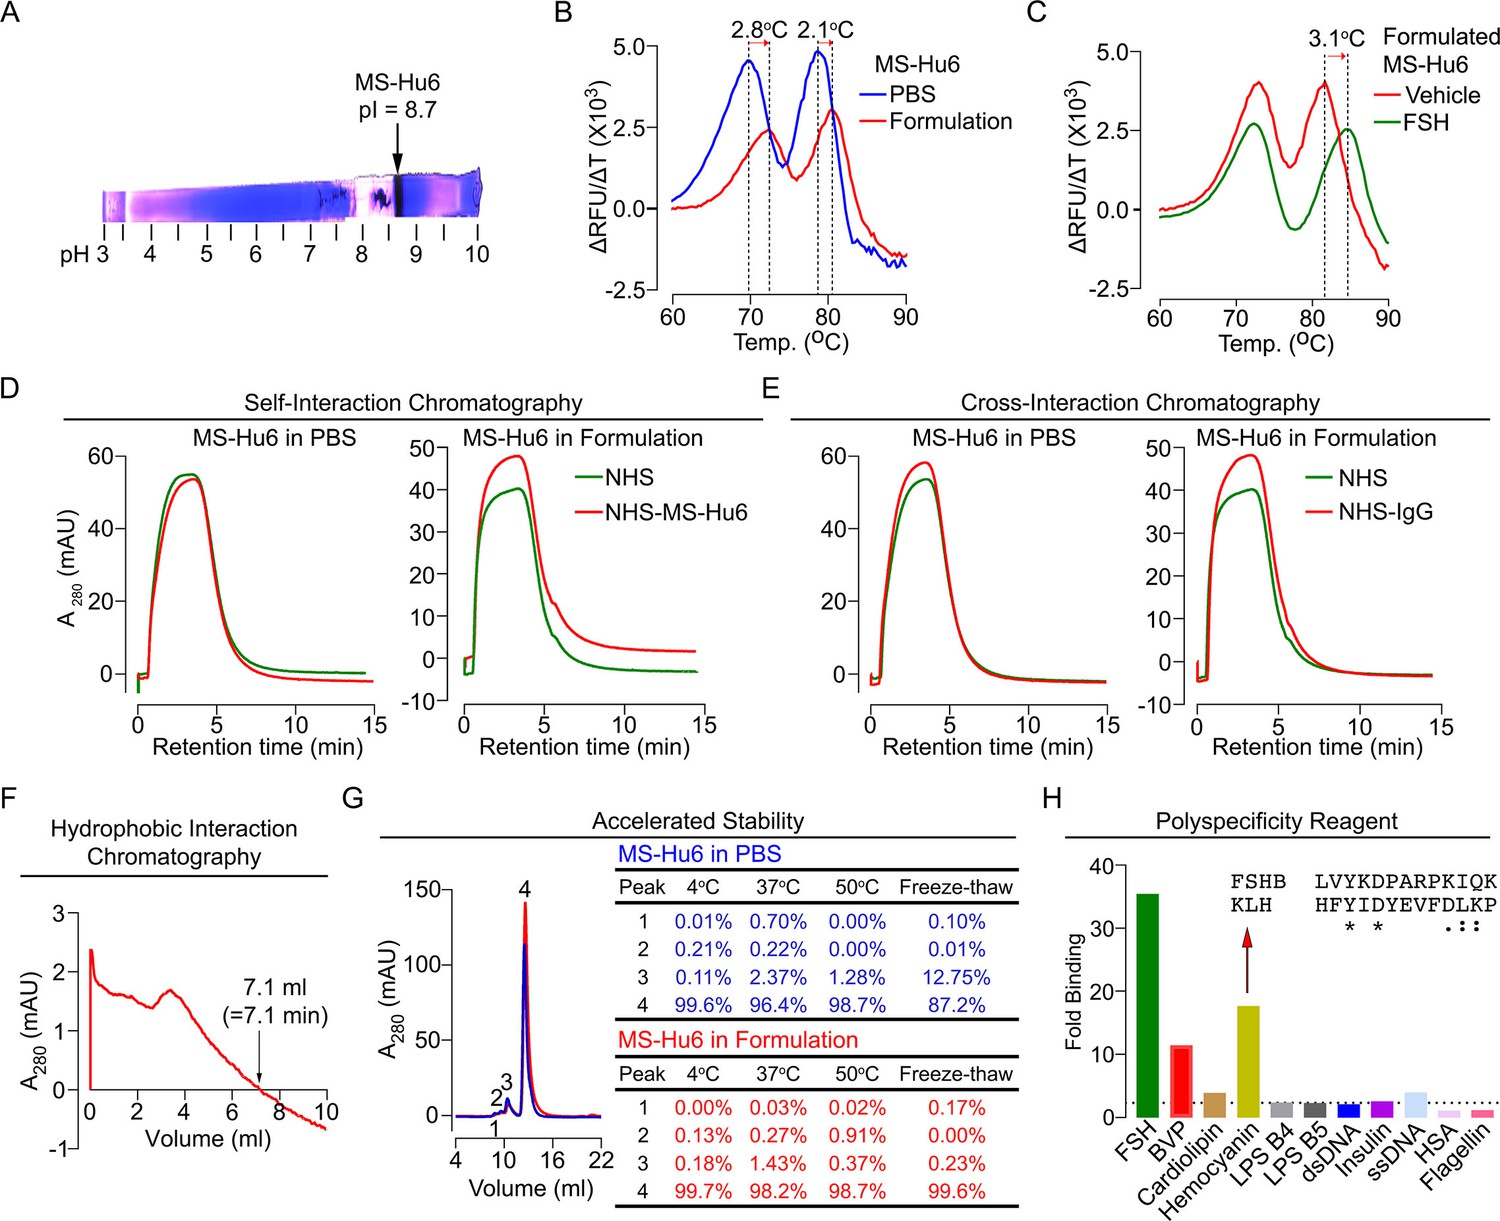
Physicochemical characteristics of MS-Hu6.
Isoelectric focusing confirmed an isoelectric pH (pI) pf 8.7 for MS-Hu6, consistent with its in silico prediction (Expasy) of 8.58 (A). Thermal shift assays were used to examine the stability of both Fc and Fab regions of formulated MS-Hu6 versus MS-Hu6 in PBS (B), as well as the stability of follicle-stimulating hormone (FSH) binding to the Fab region of formulated MS-Hu6 (C). UV absorbance (280 nm) readout of self-interaction chromatography (SIC) (D) or cross-interaction chromatography (CIC) (E) to assess binding of formulated MS-Hu6 versus MS-Hu6 in PBS with self or human IgG, respectively. Hydrophobic chromatography showing UV absorbance (280 nm) of the eluate from a butyl sepharose column upon passing MS-Hu6 at pH 6.5 over 20 min at a flow rate of 1 mL/min (retention time shown) (F). Representative size exclusion chromatograms and area under the peak for MS-Hu6 in PBS or formulated MS-Hu6 following stress testing by three cycles of freeze-thaw or incubation at 4°C, 37°C, and 50°C for 1 week (G). Reactivity of MS-Hu6 to a standard panel of antigens, including cardiolipin, hemocyanin (KLH), lipopolysaccharides B4 and B5 (LPS B4 and LPS B5), double- and single- stranded DNA (dsDNA and ssDNA), insulin, human albumin, flagellin, and baculovirus particles (BVP) (ELISAs) (H). Homology of KLH with the epitope against which MS-Hu6 was raised, showing identical (*) and conserved (:) amino acid residues (H).
Additional files
Download links
A two-part list of links to download the article, or parts of the article, in various formats.
Downloads (link to download the article as PDF)
Open citations (links to open the citations from this article in various online reference manager services)
Cite this article (links to download the citations from this article in formats compatible with various reference manager tools)
FSH-blocking therapeutic for osteoporosis
eLife 11:e78022.
https://doi.org/10.7554/eLife.78022


