Synaptic location is a determinant of the detrimental effects of α-synuclein pathology to glutamatergic transmission in the basolateral amygdala
- Department of Neurodegenerative Science, Van Andel Institute, United States
- Aligning Science Across Parkinson’s (ASAP) Collaborative Research Network, United States
- Department of Cellular and Molecular Medicine, University of Ottawa, Canada
- University of Ottawa Brain and Mind Research Institute, Canada
- Ottawa Institute of Systems Biology, Canada
- Pharma Research and Early Development (pRED), F. Hoffman-La Roche, United States
Figures
Figure 1

α-synuclein (αSyn) is selectively localized at vesicular glutamate transporter 1 (vGluT1+) axon terminals in mouse brain.
(A) Representative confocal images showing colocalization of αSyn with vGluT1 (left), but not with vGluT2 (right) in the basolateral amygdala (BLA) (top), cerebral cortex (middle), and the striatum (bottom). Simultaneously collected confocal images from each brain region were split into vGluT1/αSyn and vGluT2/αSyn channels for the purpose of illustration. (B) Zoomed z series of images of the boxed area from the BLA in (A) showing colocalization and correlated changes in the immunoreactive intensities of vGluT1 and αSyn. Such colocalization and correlation are absent between vGluT2 and αSyn within the same region. Images were taken and shown from a + μm z-depth with an inter-section interval of 0.25 μm. (C) Bar graphs showing Pearson correlation coefficient between vGluT1 and αSyn, as well as between vGluT2 and αSyn, in the BLA (αSyn/vGluT1=0.82 ± 0.007, αSyn/vGluT2=0.17 ± 0.004; n=18 slices/4 mice; p<0.0001, MWU), cerebral cortex (αSyn/vGluT1=0.82 ± 0.006, αSyn/vGluT2=0.12 ± 0.009; n=8 slices/3 mice; p=0.0002, MWU), and the striatum (αSyn/vGluT1=0.83 ± 0.006, αSyn/vGluT2=0.17 ± 0.02; n=8 slices/3 mice; p=0.0002, MWU).
-
Figure 1—source data 1
Source data for plot in Figure 1C.
- https://cdn.elifesciences.org/articles/78055/elife-78055-fig1-data1-v2.xlsx
Figure 2
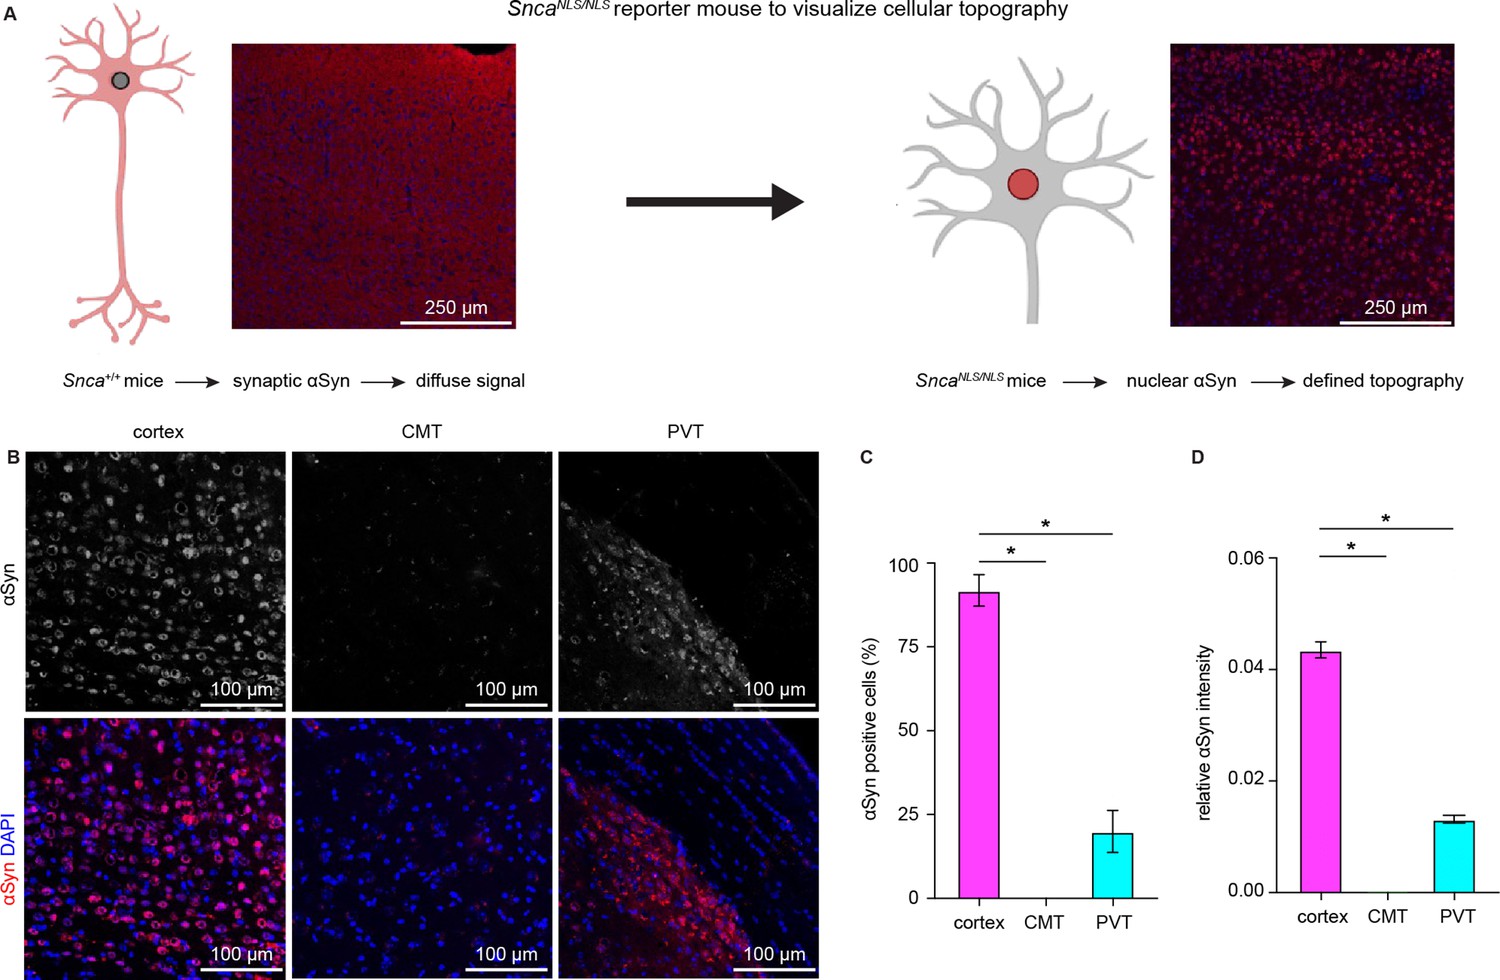
Cerebral cortical neurons express higher levels of endogenous α-synuclein (αSyn) than thalamic neurons.
(A) Schematic of approach to determine cellular topography of αSyn in the SncaNLS/NLS reporter mouse line. (B) Representative photomicrographs in the different highlighted brain regions for either αSyn alone (top panels) or co-stained with DAPI as a nuclear marker. (C–D) Quantification of the proportion of αSyn-positive nuclei (C, % αSyn positive cells, cortex=91.9 ± 4.7%, CMT=0 ± 0%; PVT=19.9 ± 6.3%, n=3 mice) or average relative intensity of αSyn in the different regions (cerebral cortex=0.04 ± 0.001, n=742 cells/3 mice; CMT=0 ± 0, n=364 cells/3 mice; PVT=0.01 ± 0.0007, n=734 cells/3 mice). * p<0.05, one-way ANOVA followed by Sidak’s multiple comparison tests. Abbreviations: CMT, centromedial thalamus; PVT, periventricular thalamus.
-
Figure 2—source data 1
Source data for plots in Figure 2C and D.
- https://cdn.elifesciences.org/articles/78055/elife-78055-fig2-data1-v2.xlsx
Figure 3 with 1 supplement
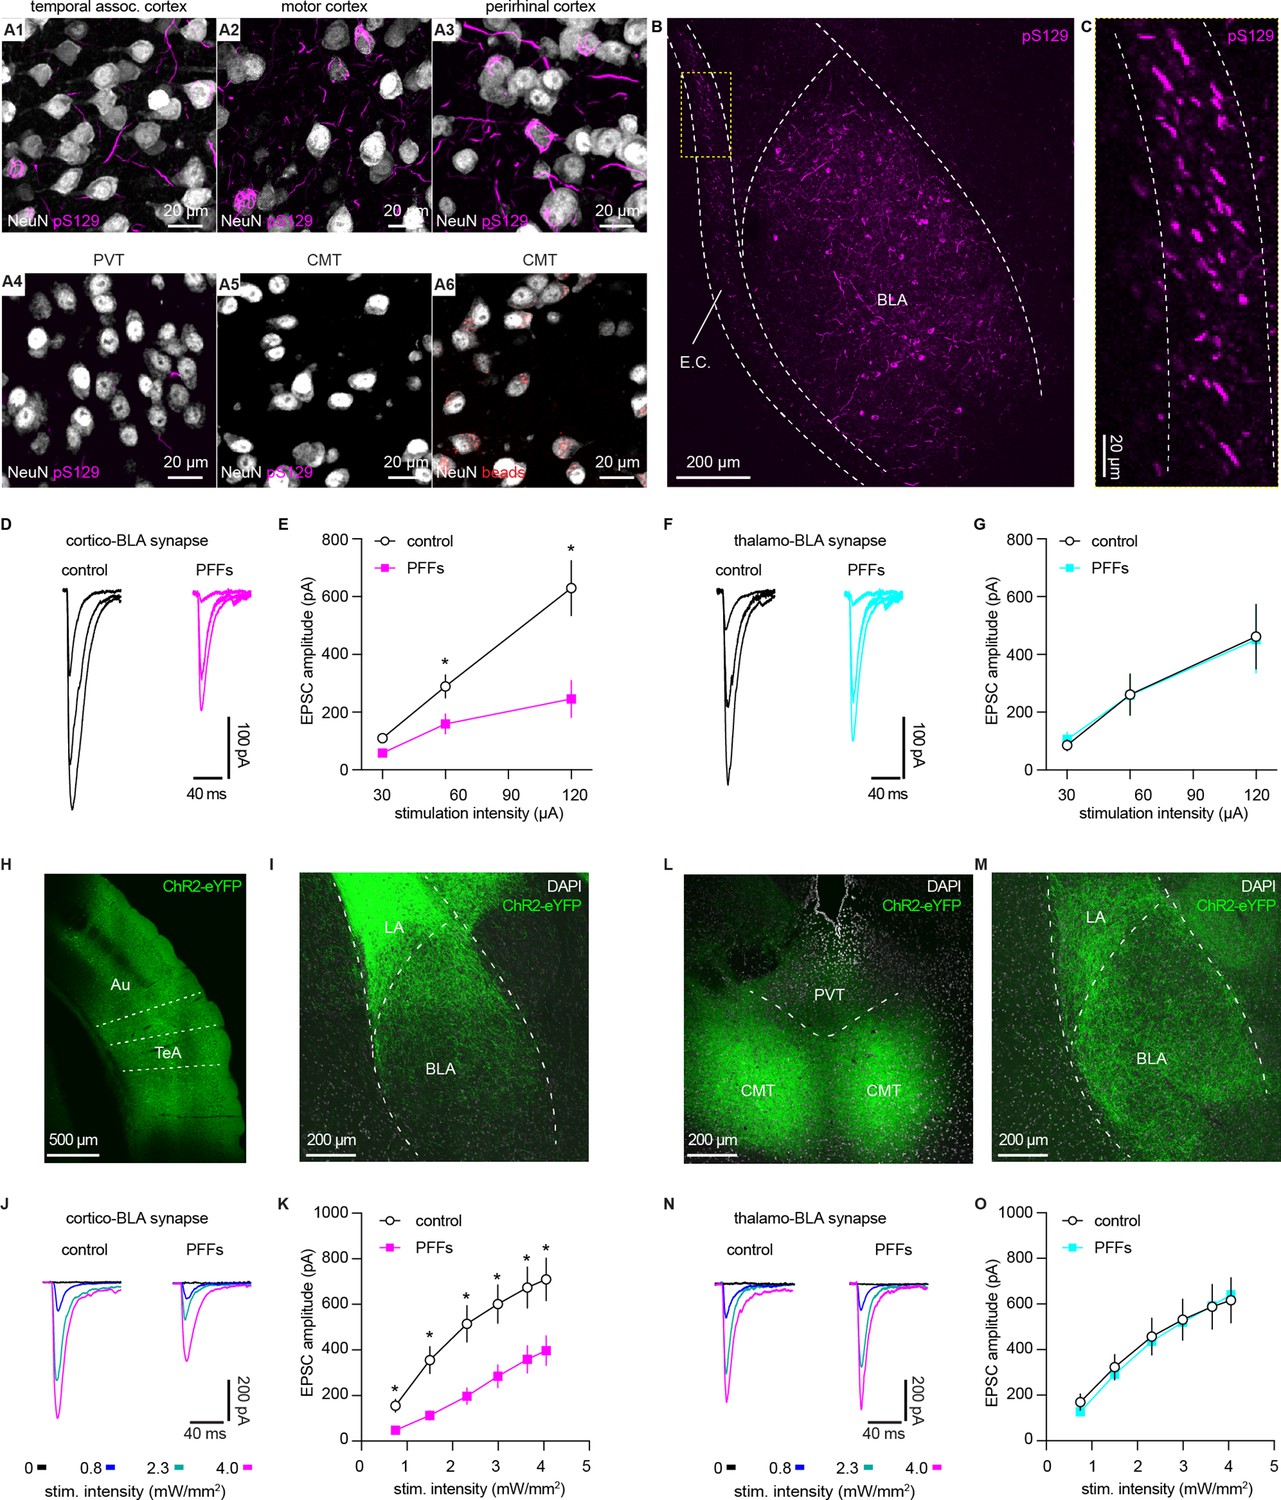
α-synuclein (αSyn) aggregates preferentially disrupt vesicular glutamate transporter 1 (vGluT1+) cortico-BLA transmission.
(A) Representative images showing the presence of αSyn aggregates in the cortical regions (A1–A3), but largely absent in the midline thalamus (A4–A5). A6, representative images showing retrobeads labeled neurons in the centromedial thalamus. (B–C) Representative images showing pS129+ αSyn pathology in the basolateral amygdala (BLA) (B) and the external capsule (C). (D–E) Representative traces of excitatory postsynaptic currents (EPSCs) evoked by electrical stimulation of the external capsule (D) and summarized results (E) showing a reduced cortico-BLA transmission in slices from preformed fibrils (PFFs)- versus PBS-injected mice. n=17 neurons/4 mice for each group. (F–G) Representative traces of EPSCs evoked by electrical stimulation of the internal capsule (F) and summarized results (G) showing unaltered thalamo-BLA transmission in slices from PFFs- versus PBS-injected wildtype mice. n=17 cells/5 mice for controls, and 13 cells/4 PFF-injected mice. (H–I) Representative images showing viral infection site in the temporal association cortex (TeA) and nearby regions (H), and the axon terminal field in the BLA (I). (J–K) Representative traces of optogenetically-evoked EPSCs (J) and summarized results (K) showing a reduced amplitude of cortico-BLA EPSCs in slices from PFFs- versus PBS-injected mice. n=35–37 neurons/4 mice per group. (L–M) Representative images showing viral infection site in the midline thalamus (L), and the axon terminal field in the BLA (M). (N–O) Representative traces of optogenetically-evoked EPSCs (N) and summarized results (O) showing unaltered thalamo-BLA transmission in slices from PFFs- versus PBS-injected mice. n=28 neurons/4 mice per group. *, p<0.05, MWU followed by Bonferroni-Dunn correction for multiple comparisons. Abbreviations: CMT, centromedial thalamus; PVT, periventricular thalamus.
-
Figure 3—source data 1
Source data for plots in Figure 3.
- https://cdn.elifesciences.org/articles/78055/elife-78055-fig3-data1-v2.xlsx
Figure 3—figure supplement 1
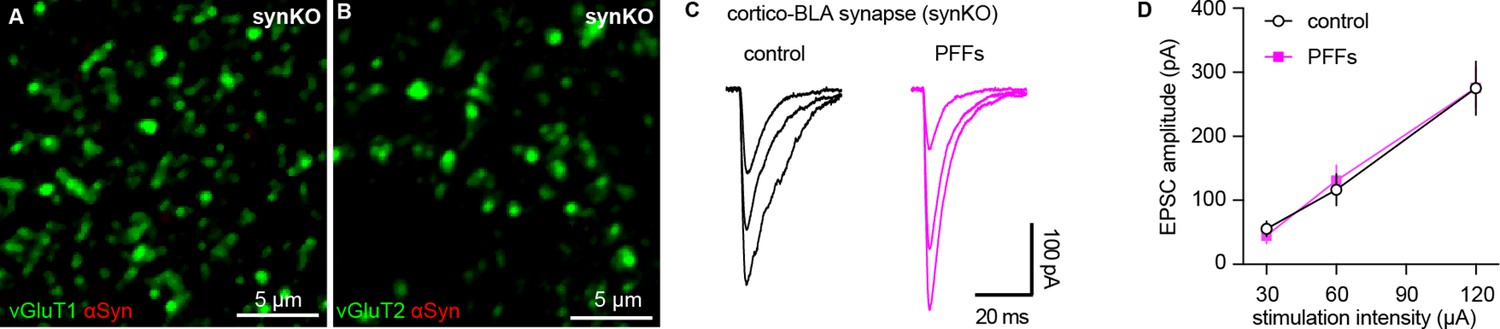
Intrastriatal preformed fibrils (PFFs) injection does not alter cortico-BLA transmission in synKO mice.
(A–B) Representative confocal images showing lack of endogenous α-synuclein (αSyn) in vGluT1+ (A) and vGluT2+ (B) terminals in the basolateral amygdala (BLA). (C) Representative traces of EPSCs evoked by electrical stimulation of the external capsule (C) and summarized results (D) showing no changes of cortico-BLA transmission in slices from PFFs- versus PBS-injected mice. n=12 neurons/3 mice for each group.
-
Figure 3—figure supplement 1—source data 1
Source data for plot in Figure 3—figure supplement 1.
- https://cdn.elifesciences.org/articles/78055/elife-78055-fig3-figsupp1-data1-v2.xlsx
Figure 4
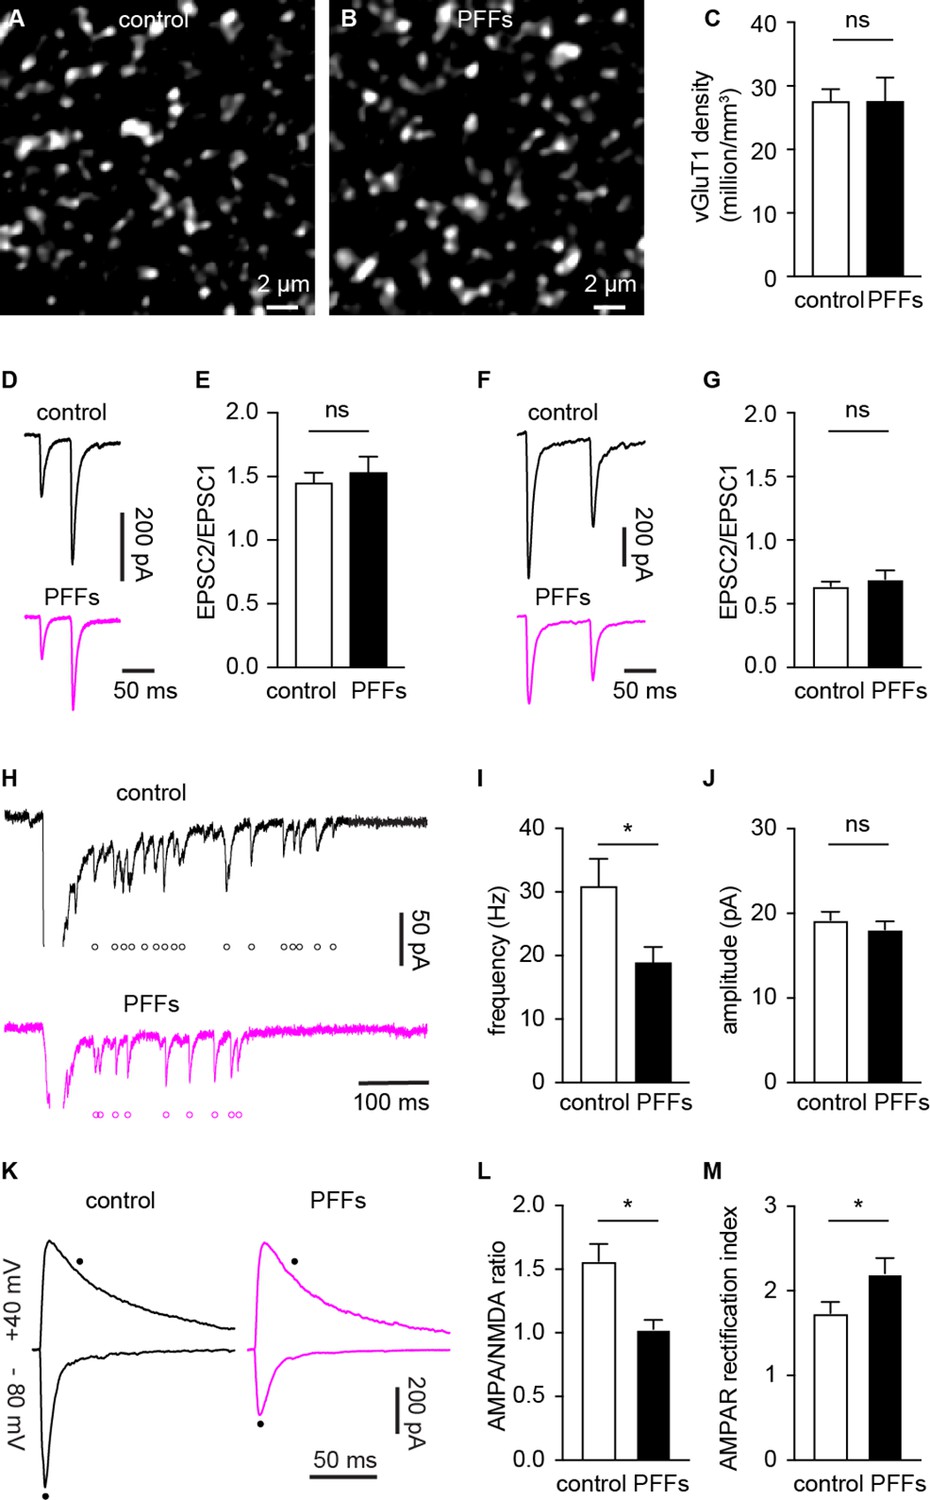
α-synuclein (αSyn) pathology decreases the number of functional cortico-BLA inputs.
(A–B) Representative confocal images showing vesicular glutamate transporter 1 (vGluT1)-immunoreactivity in the basolateral amygdala (BLA) from control (A) and PFFs-injected (B) mice. (C) Summarized data showing no change in the vGluT1 density in the BLA between control and PFFs-injected mice (control=27.5 ± 2 million/mm3, n=11 slices/3 mice; preformed fibrils (PFFs)=27.5 ± 3.8 million/mm3, n=12 slices/3 mice; p=0.98, MWU). (D–E) Representative traces of cortico-BLA excitatory postsynaptic currents (EPSCs) evoked by 20 Hz paired pulses of electric stimulation (D) and the summarized results of EPSC2/EPSC1 ratios (E, controls=1.45 ± 0.08, n=19 neurons/4 mice; PFFs=1.53 ± 0.13, n=18 neurons/4 mice; p=0.99, MWU). (F–G) Representative traces of cortico-BLA EPSCs evoked by 10 Hz paired pulses of optogenetic stimulation (F) and the summarized results of EPSC2/EPSC1 ratios (controls=0.64 ± 0.04, n=35 neurons/4 mice; PFFs=0.69 ± 0.07, n=31 neurons/4 mice; p=0.83, MWU). (H) Representative traces showing Sr2+ induced, optogenetically evoked EPSCs (Sr2+-EPSCs) at cortico-BLA synapses from control and PFFs-injected mice. Each open circle indicates a single identified Sr2+-EPSC. (I–J) Summarized result showing a reduction of the frequency (control=30.9 ± 4.3 Hz, n=24 neurons/3 mice; PFFs=18.9 ± 2.4 Hz, n=24 neurons/3 mice; p=0.012, MWU), but not the amplitude (control=19.2 ± 0.99 pA, n=24 neurons/3 mice; PFF=18.1 ± 0.98 pA, n=24 neurons/3 mice; p=0.31, MWU), of Sr2+-EPSCs at cortico-BLA synapses. (K) Representative cortico-BLA EPSC traces recorded at –80 mV and +40 mV from control and PFF-injected mice. Black dots indicate the time at which AMPA- and NMDA-mediated components were measured. (L) Summarized results showing a decreased AMPA/NMDA ratio at cortico-BLA synapses from PFFs-injected mice relative to controls (control=1.56 ± 0.13, n=20 neurons/3 mice; PFFs=1.03 ± 0.07, n=18 neurons/3 mice, p=0.0012, MWU). (M) Summarized results showing an increased AMPA receptor rectification index at cortico-BLA synapses from PFFs-injected mice relative to controls (control=1.74 ± 0.13, n=20 neurons/3 mice; PFFs=2.21 ± 0.18, n=18 neurons/3 mice, p=0.035, MWU). ns, not significant. * p<0.05.
-
Figure 4—source data 1
Source data for plots in Figure 4.
- https://cdn.elifesciences.org/articles/78055/elife-78055-fig4-data1-v2.xlsx
Figure 5
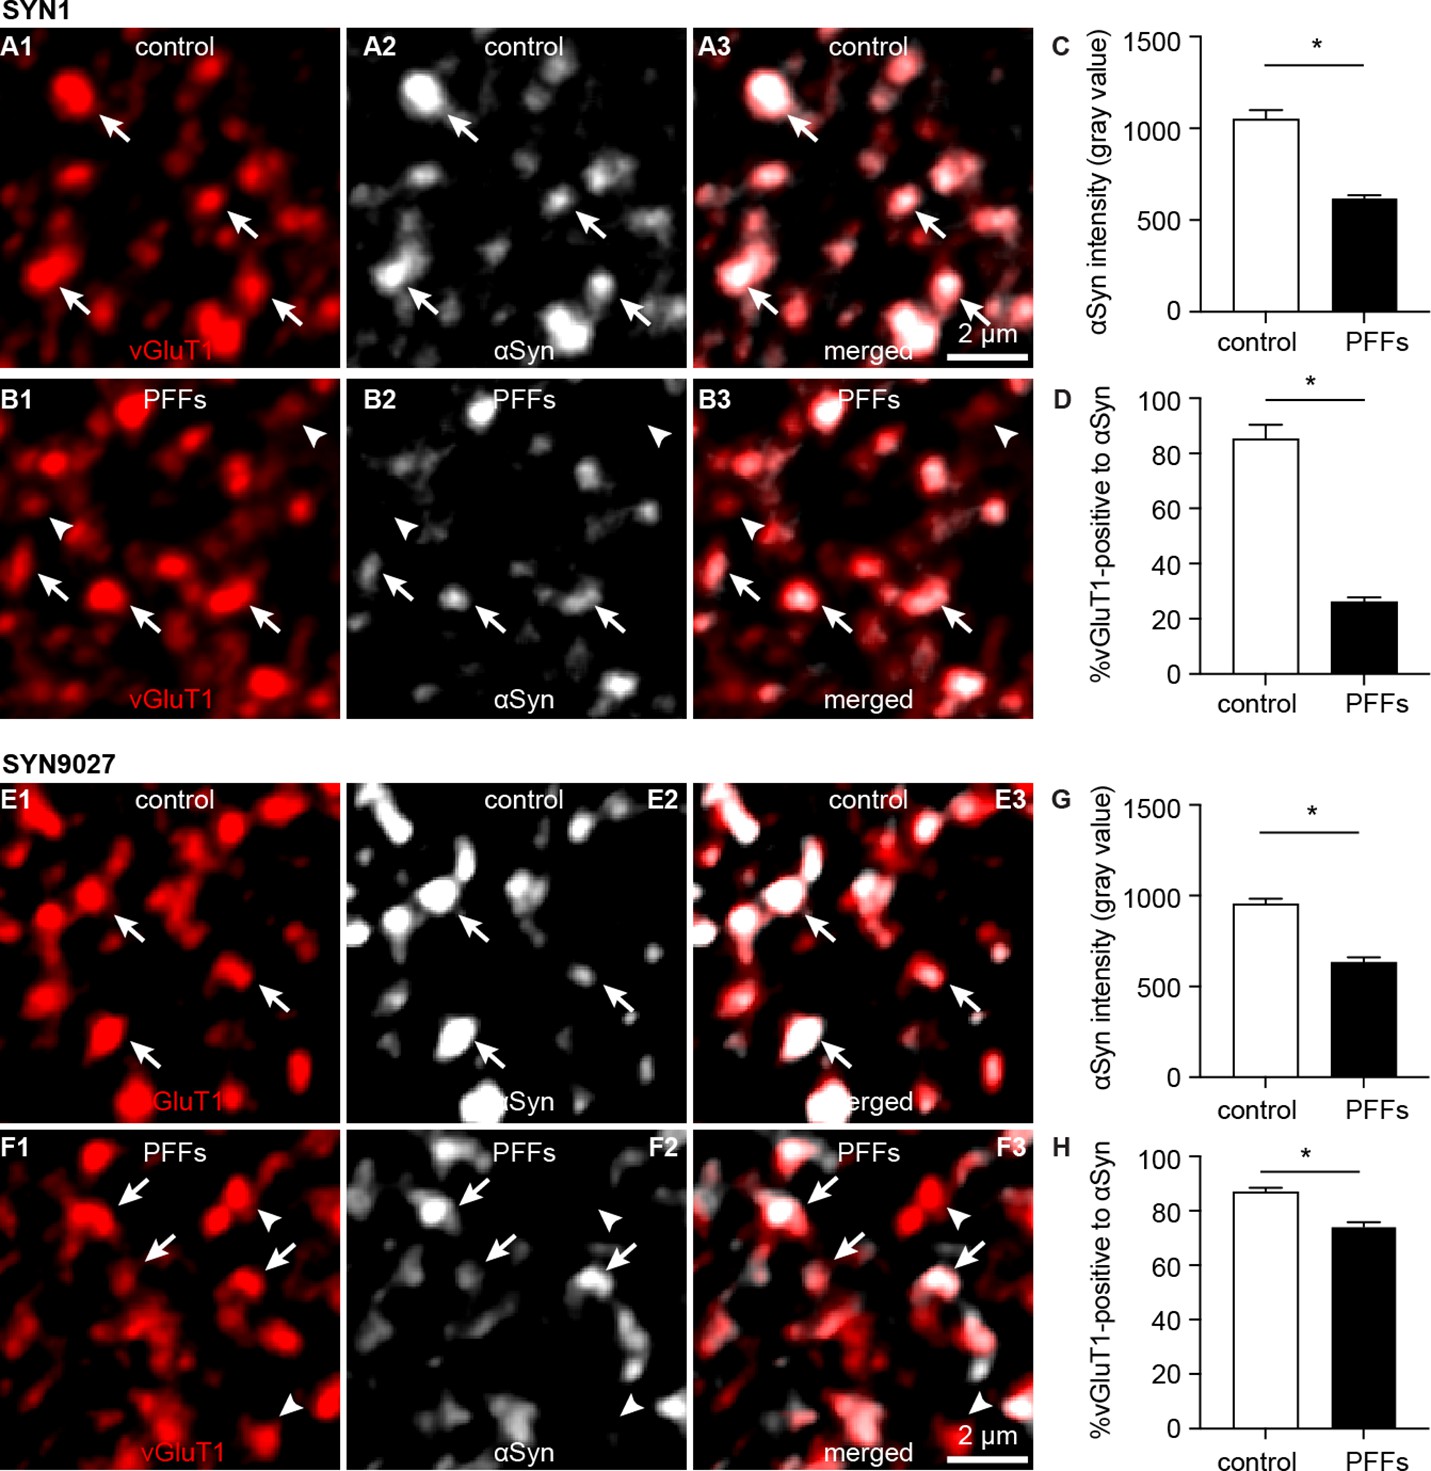
Decreased soluble α-synuclein (αSyn) at the axon terminals as pathology develops.
(A1–B3) Representative confocal images showing αSyn immunoreactivity within vesicular glutamate transporter 1 (vGluT1+) puncta in the basolateral amygdala (BLA) using SYN1 antibody from control (A1–A3) and PFFs-injected mice (B1–B3).(C) Summarized graph showing a reduced αSyn immunoreactivity per vGluT1 immunoreactive puncta in PFFs-injected mice relative to controls (control=1049 ± 50; preformed fibrils (PFFs)= 617 ± 18, n=100 puncta/group, p<0.0001, MWU). (D) Summarized graph showing a reduced percentage of vGluT1 immunoreactive puncta associated with detectable αSyn immunoreactivity in PFFs-injected mice relative to controls (controls=85 ± 5.2%; PFF=26 ± 1.7%, n=6 slices/group, p=0.002, MWU). (E1–F3) Representative confocal images showing αSyn immunoreactivity within vGluT1+ puncta in the BLA using SYN9027 antibody from control (E1–E3) and PFFs-injected mice (F1–F3). (G) Summarized graph showing a reduced αSyn immunoreactivity per vGluT1 immunoreactive puncta in PFFs-injected mice relative to controls (control=954 ± 29; PFFs=633 ± 27, n=241 puncta/group, p<0.0001, MWU). (D) Summarized graph showing a reduced percentage of vGluT1 immunoreactive puncta associated with detectable αSyn immunoreactivity in PFFs-injected mice relative to controls (controls=87 ± 1.5%, n=12 slices; PFF=74 ± 1.6%, n=11 slices, p<0.0001, MWU).
-
Figure 5—source data 1
Source data for plots in Figure 5.
- https://cdn.elifesciences.org/articles/78055/elife-78055-fig5-data1-v2.xlsx
Figure 6 with 1 supplement

Loss of α-synuclein (αSyn) impairs short-term plasticity of the cortico-BLA inputs.
(A1) Representative cortico-basolateral amygdala (BLA) excitatory postsynaptic currents (EPSCs) traces from control and preformed fibrils (PFF)-injected mice in response to repetitive stimulation (300 stimuli at 12.5 Hz). (A2) Summarized graph showing the temporal profiles of cortico-EPSCs depression in slices from control and PFFs-injected mice. The cortico-BLA EPSCs from PFFs-injected mice exhibited greater reduction in the amplitude toward the end of repetitive stimulation. n=13–15 neurons/ 3 mice. (B1) Representative cortico-BLA EPSCs traces from wild type (WT) control and αSyn KO mice in response to repetitive stimulation (300 stimuli at 12.5 Hz). (B2) Summarized graph showing the temporal profiles of cortico-EPSCs depression in slices from WT control and αSyn KO mice (n=8–9 neurons/3 mice. *, p<0.05, MWU followed by Bonferroni-Dunn correction for multiple comparisons).
-
Figure 6—source data 1
Source data for plots in Figure 6.
- https://cdn.elifesciences.org/articles/78055/elife-78055-fig6-data1-v2.xlsx
Figure 6—figure supplement 1
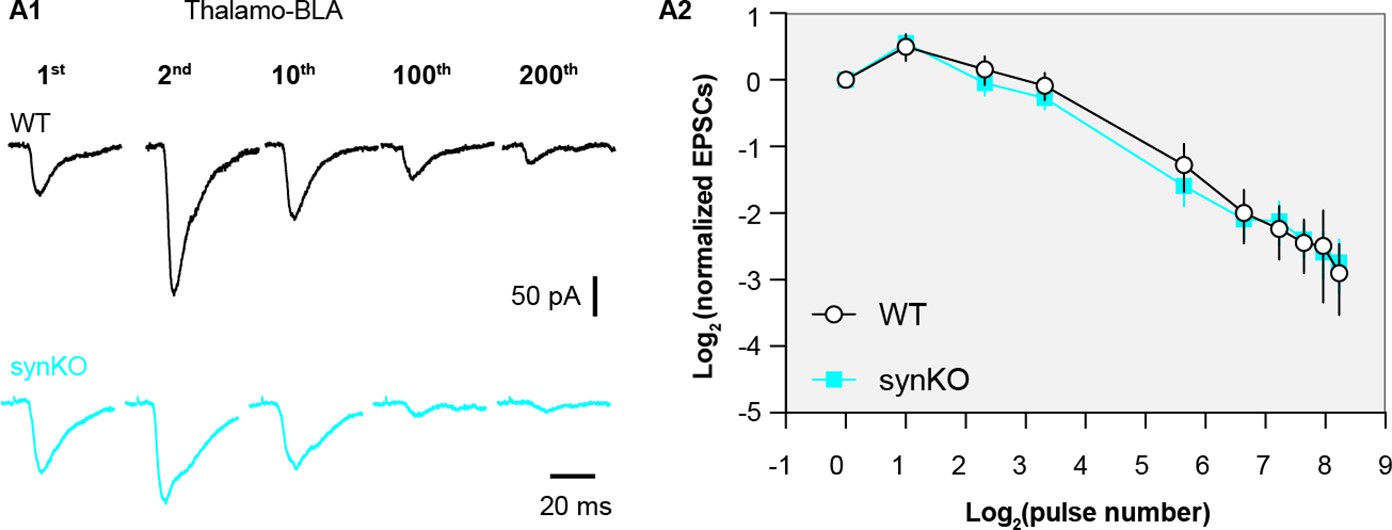
α-synuclein (αSyn) KO does not affect short term plasticity profiles of thalamo-BLA inputs.
(A1) Representative thalamo-basolateral amygdala (BLA) excitatory postsynaptic currents (EPSCs) traces from wild type (WT) control and αSyn KO mice in response to repetitive stimulation (300 stimuli at 12.5 Hz). (A2) Summarized graph showing the temporal profiles of thalamo-BLA EPSCs depression in slices from WT control and αSyn KO mice (n=9 neurons/3 mice. No statistical significance was detected between groups, MWU followed by Bonferroni-Dunn correction for multiple comparisons).
-
Figure 6—figure supplement 1—source data 1
Source data for plot in Figure 6—figure supplement 1.
- https://cdn.elifesciences.org/articles/78055/elife-78055-fig6-figsupp1-data1-v2.xlsx
Additional files
Download links
A two-part list of links to download the article, or parts of the article, in various formats.
Downloads (link to download the article as PDF)
Open citations (links to open the citations from this article in various online reference manager services)
Cite this article (links to download the citations from this article in formats compatible with various reference manager tools)
Synaptic location is a determinant of the detrimental effects of α-synuclein pathology to glutamatergic transmission in the basolateral amygdala
eLife 11:e78055.
https://doi.org/10.7554/eLife.78055


