Network segregation is associated with processing speed in the cognitively healthy oldest-old
- University of Alabama at Birmingham Heersink School of Medicine and Evelyn F. McKnight Brain Institute, United States
- University of Miami Miller School of Medicine and Evelyn F.McKnight Brain Institute, United States
- University of Florida and Evelyn F. and William L.McKnight Brain Institute, United States
- University of Arizona and Evelyn F. McKnightBrain Institute, United States
- University of Southern California, United States
Figures
Figure 1 with 1 supplement
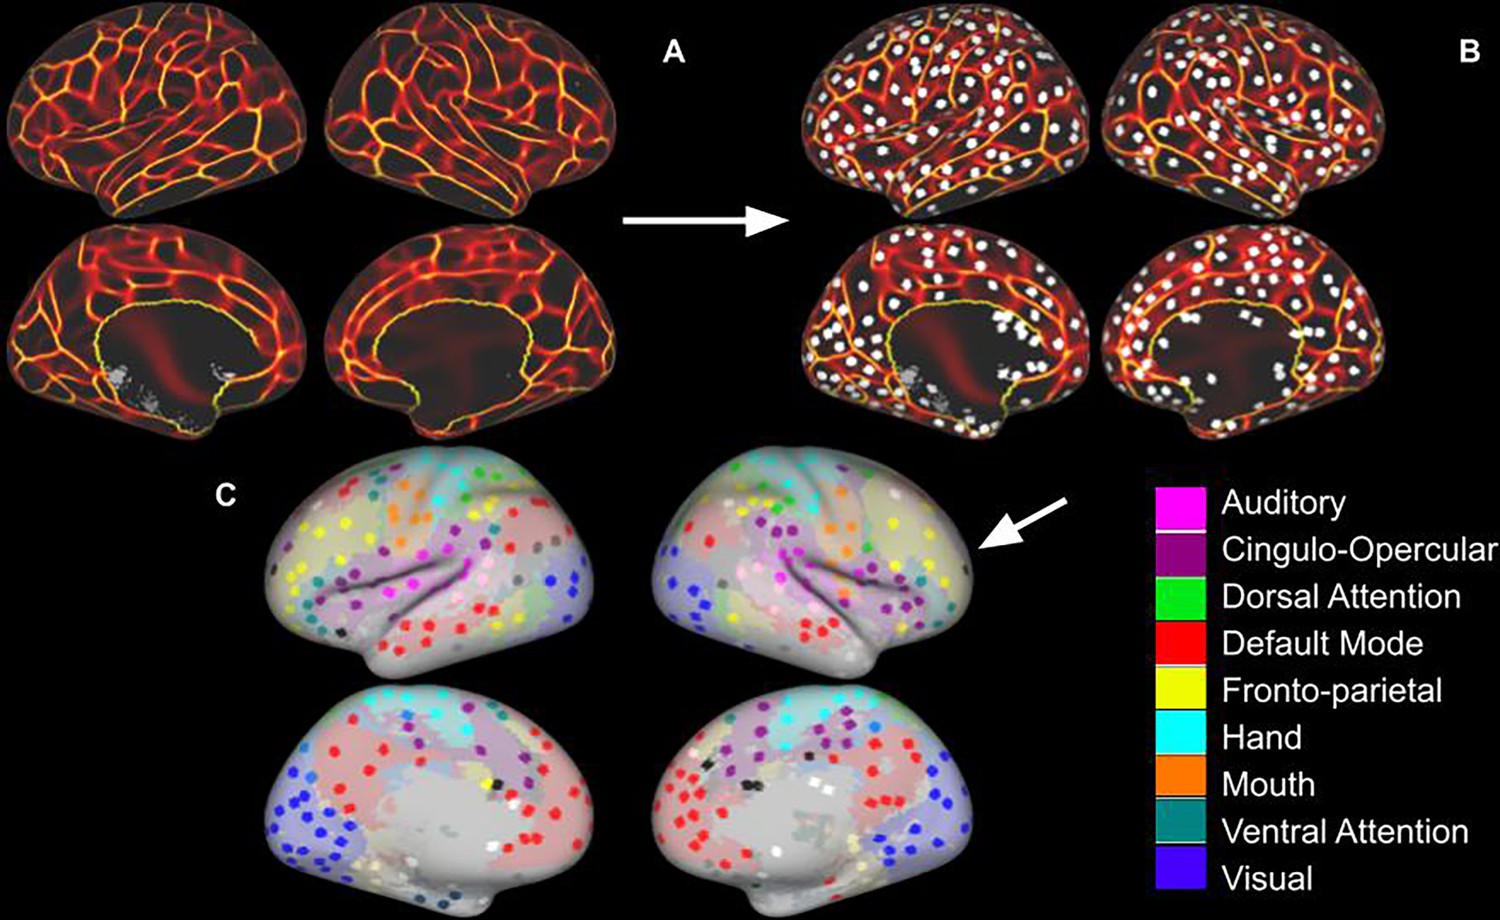
Regions of Interest Identification.
(A) Functional connectivity boundary maps based on methods used by Han et al., 2018. (B) Local minima ROIs (Regions of Interest, 3 mm discs) based on methods used by Chan et al., 2014. (C) Local minima ROIs with the color of network membership of ROIs based on parcellation colors that are shown underneath ROIs (Power et al., 2011). White ROIs indicate nodes that do not belong to any labeled network.
Figure 1—figure supplement 1

Relationship between age and cortical thickness.
Scatter plot of age and the average cortical thickness from all nodes (Figure 1). The small effect and insignificant result (r = –0.05, p=0.543) is consistent with the restricted age range (span of 14 years) and with the intentionally homogenous cognitive status of the sample.
Figure 2

Group average Fisher’s z- transformed correlation matrix of 321 nodes.
The association system consists of the default mode (DMN; red), fronto-parietal control (FPN; yellow), ventral attention (VA; teal), cingulo-opercular control (CON; purple), and dorsal attention (DA; green). The sensory-motor system consists of the hand somato-motor (light blue), visual (blue), mouth somato-motor (M; orange), and auditory networks (Aud; pink).
Figure 3
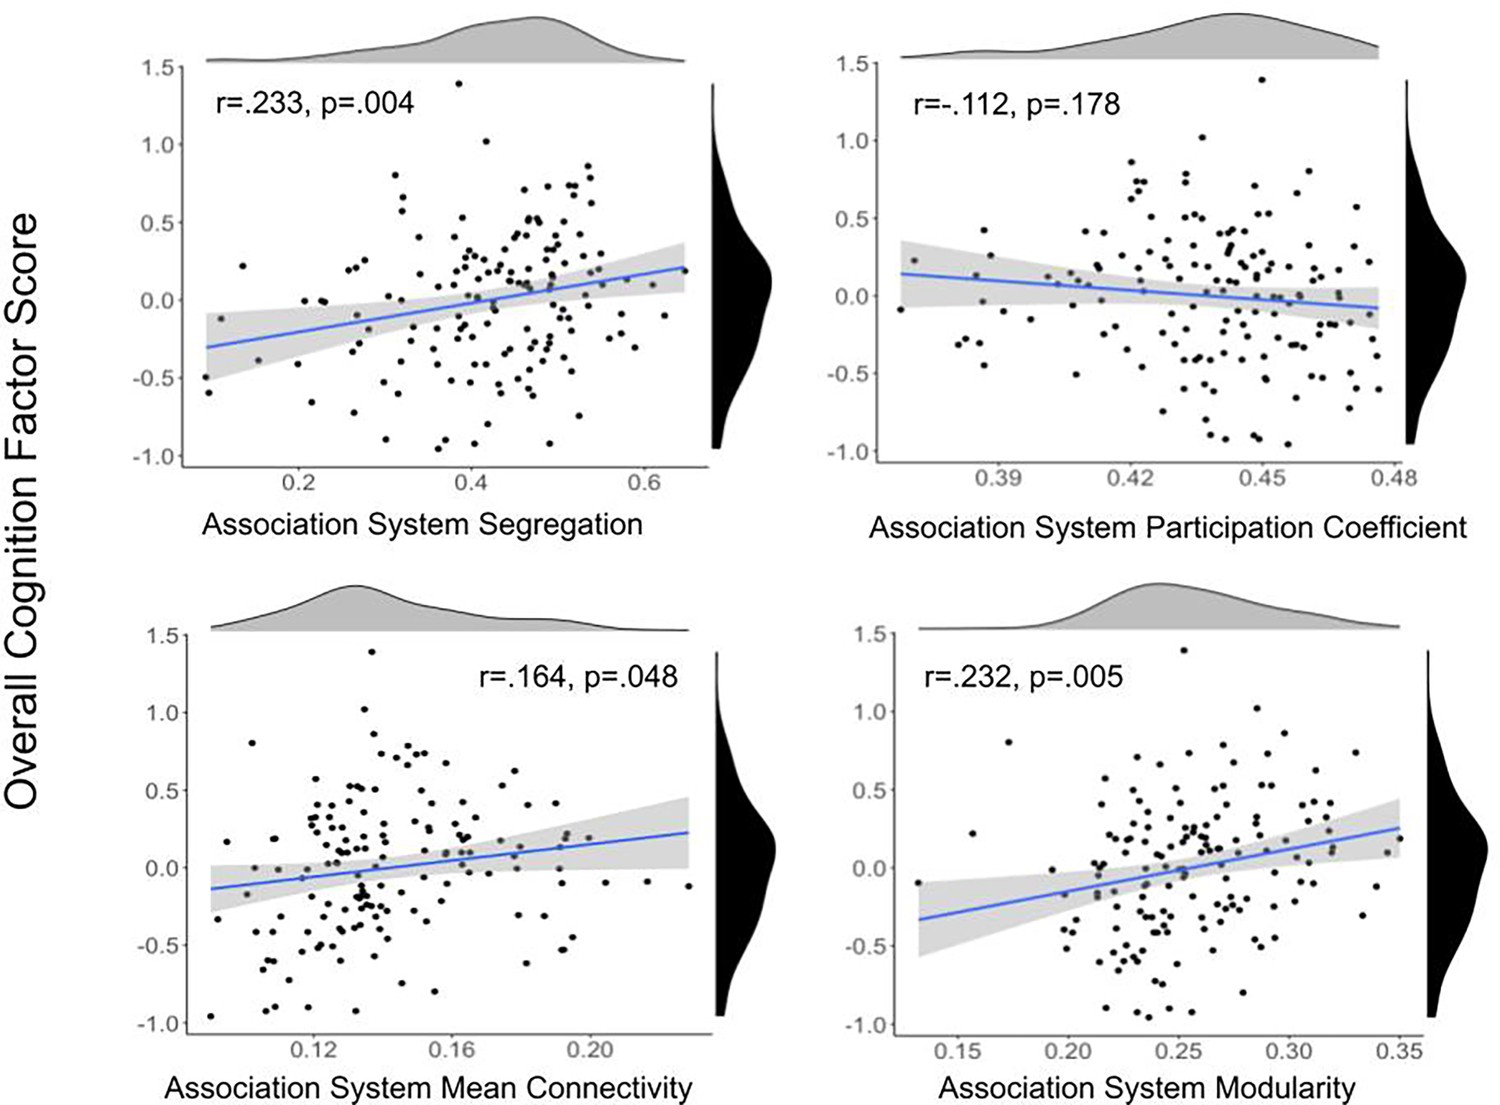
Scatter plots between association system metrics and overall cognitive performance.
Density plots for the variables are presented for each variable on the edge of the scatter plot. Overall cognition score is shown in black, and association system metrics are shown in gray. Overall cognition was related to association system segregation, modularity, and mean within-network connectivity, but not participation coefficient. Only the relationship between overall cognition and segregation and modularity remained significant after multiple comparisons correction using false discovery rate (FDR).
Figure 4
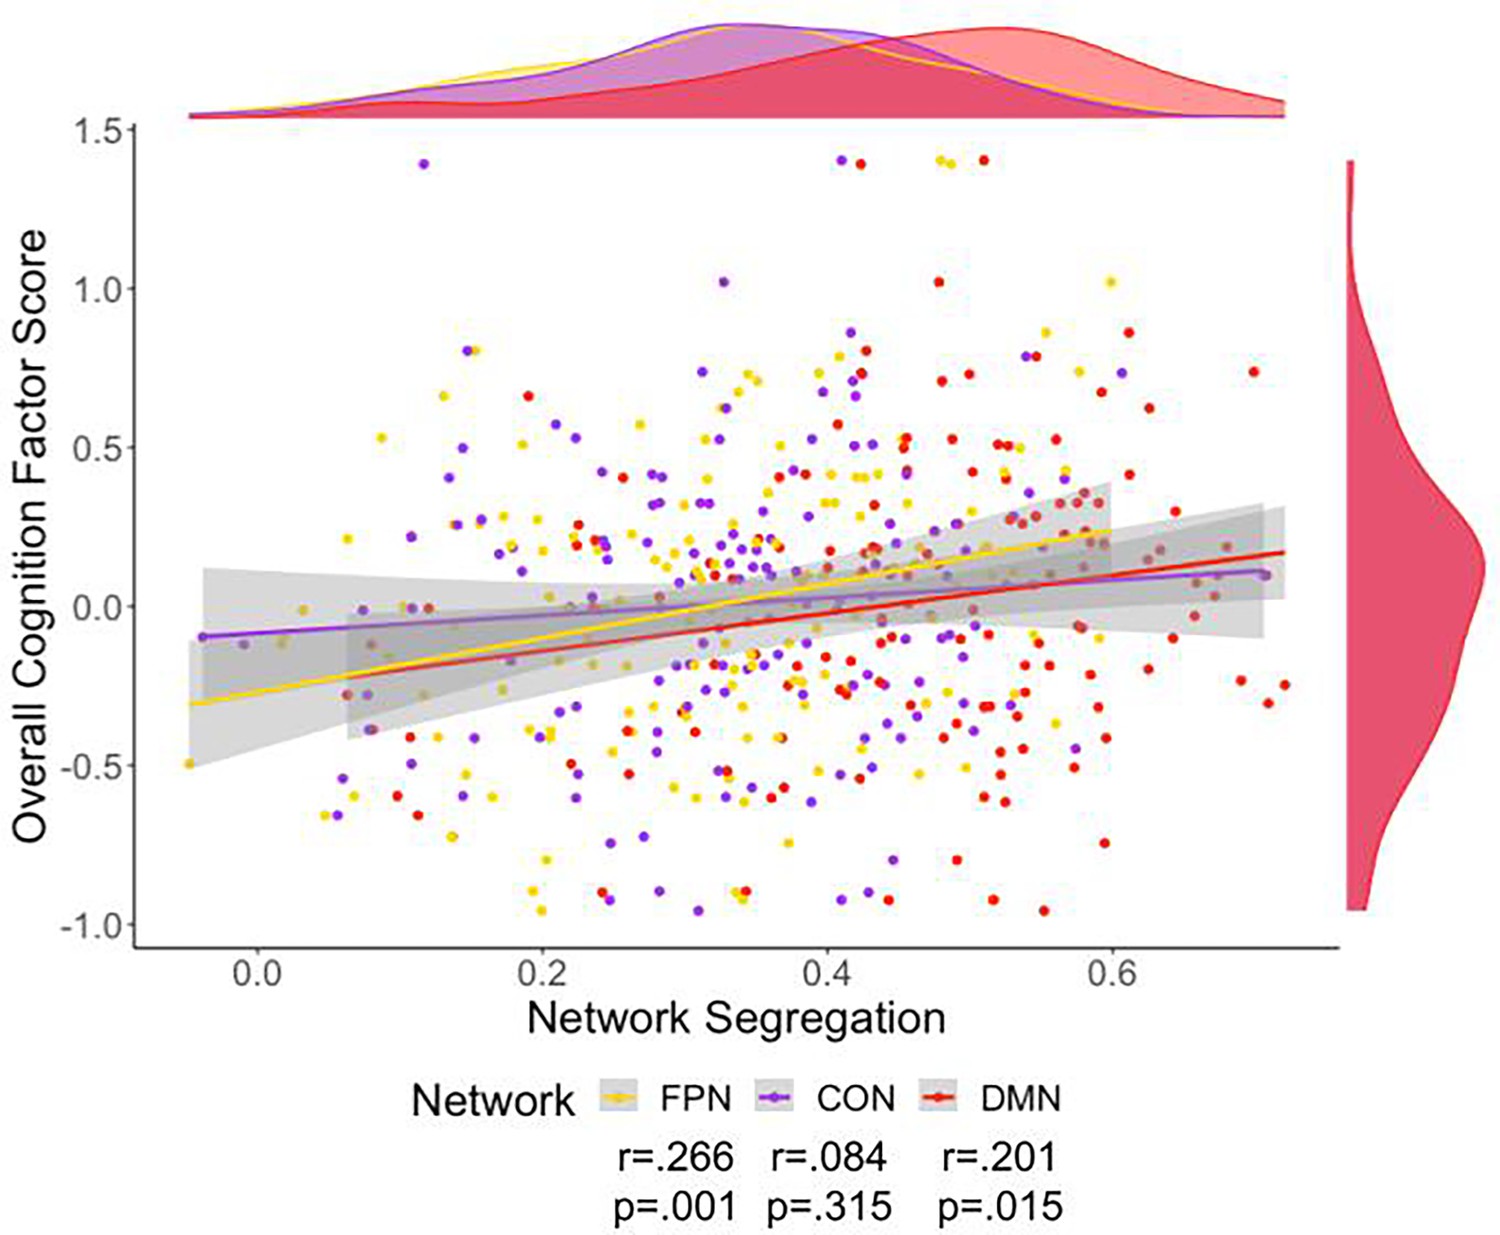
Scatter plot of overall cognition and fronto-parietal network (FPN) (yellow), cingulo-opercular network (CON) (purple), and default mode network (DMN) (red) network segregation.
Density plots for the variables are presented for each variable on the edge of the scatter plot. The colors on these plots match the network color in Figure 1. Only cognition’s relationship to segregation for FPN and DMN were still significant after adding a covariate of cortical thickness.
Figure 5
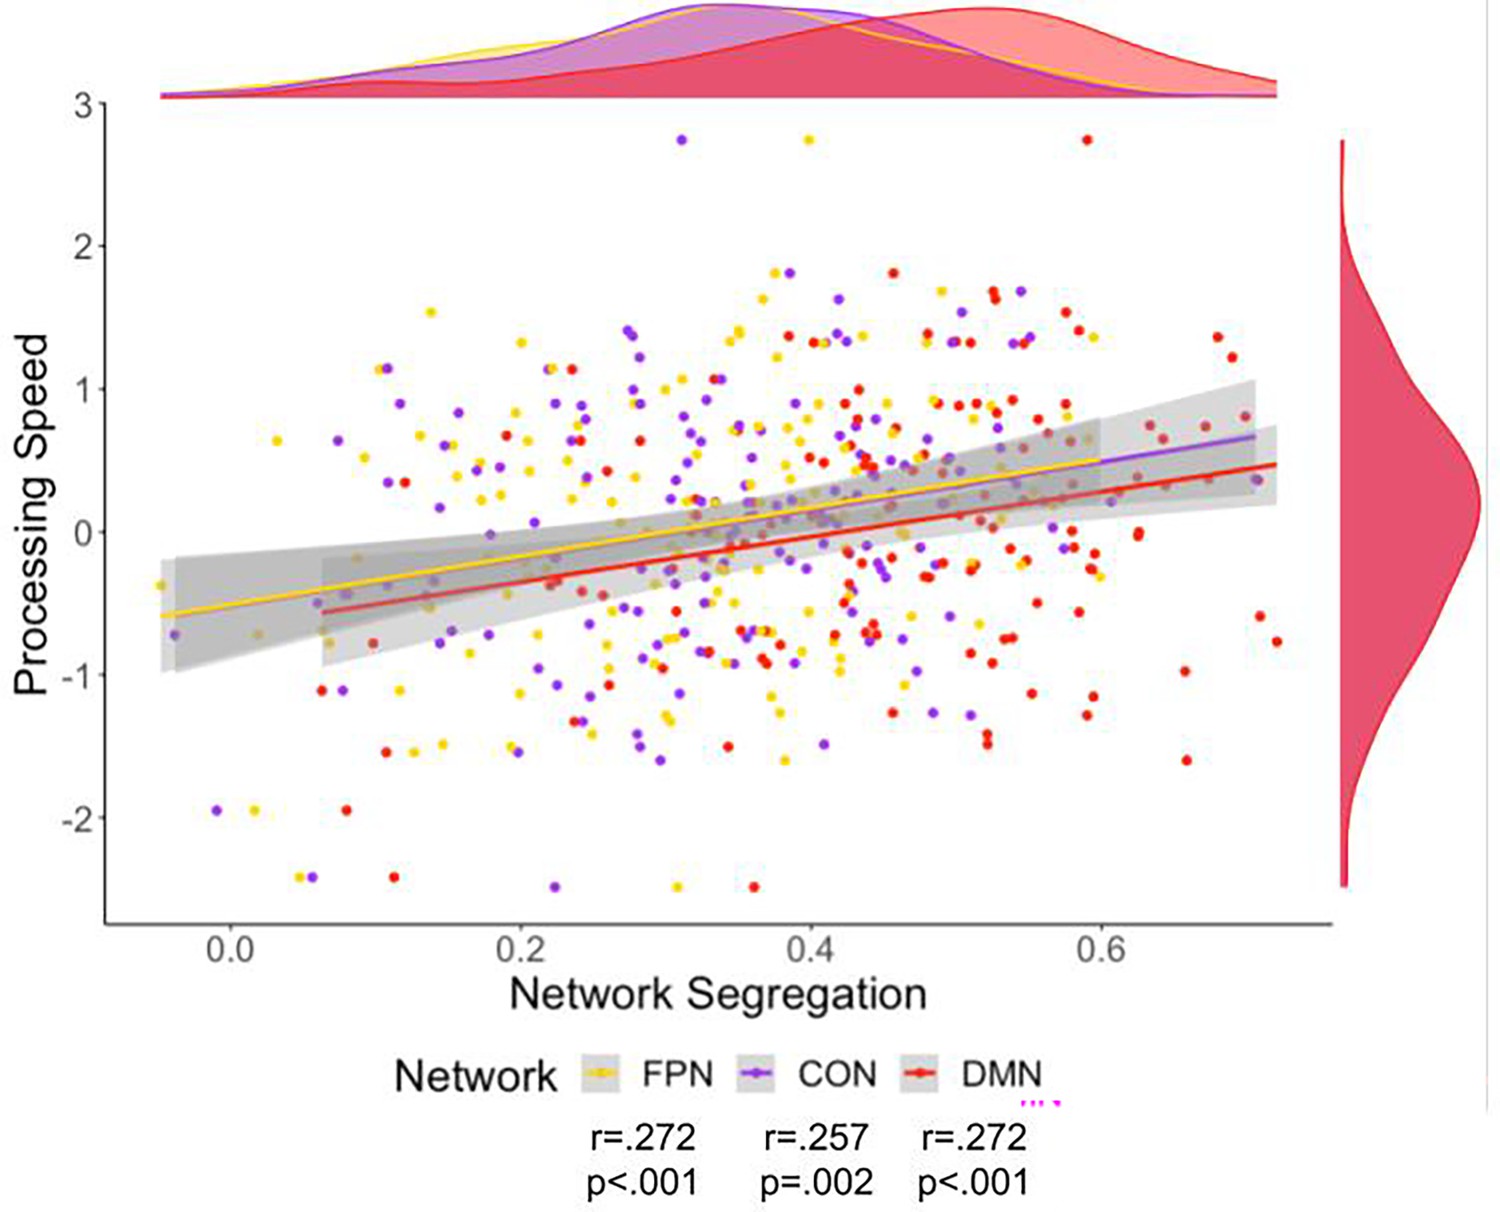
Scatter plot of processing speed and fronto-parietal network (FPN) (yellow), cingulo-opercular network (CON) (purple), and default mode network (DMN) (red) network segregation.
Density plots for the variables are presented for each variable on the edge of the scatter plot. The colors on these plots match the network color in Figure 1. There was a significant relationship to Processing Speed for segregation of each of the networks.
Figure 6 with 1 supplement
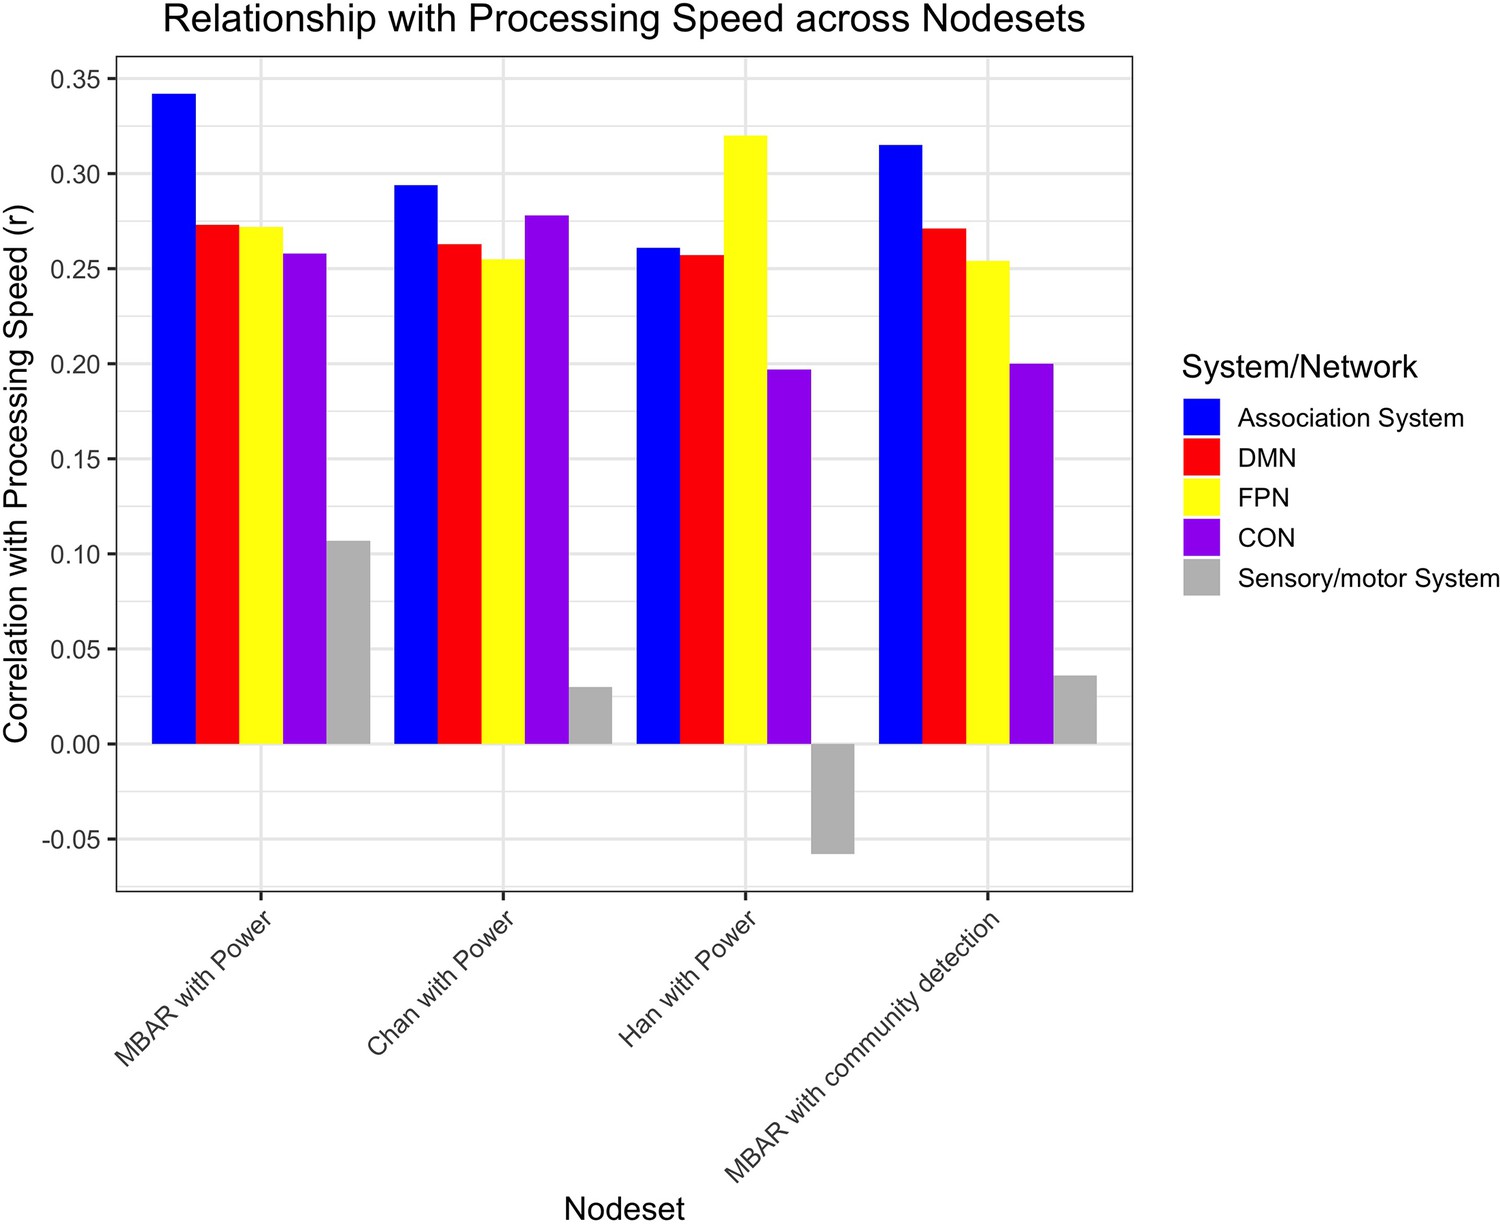
Bar plot of the correlation between processing speed and segregation within the association system, default mode network (DMN), fronto-parietal network (FPN), and cingulo-opercular network (CON), and sensory/motor system for each parcellation set.
‘MBAR with Power’ indicates node set created with MBAR data used to define the nodes, and Power et al., 2011 (Chan et al., 2014; Han et al., 2018) atlas was used to determine node network membership (Figure 1). ‘Chan with Power’ indicates younger adults data used to define nodes (Chan et al., 2014; Han et al., 2018), and Power et al., 2011 atlas used to determine node network membership. ‘Han with Power’ indicates older adults data from a different study (Chan et al., 2014; Han et al., 2018) used to define nodes, and Power et al., 2011 atlas used to determine node network membership. ‘MBAR with community detection’ indicates MBAR data used to define nodes and MBAR data-based community detection used to determine node network membership (Figure 7). Sensory/motor system is included as a negative control and was not significant in any parcellation; all other correlations were significant.
Figure 6—figure supplement 1
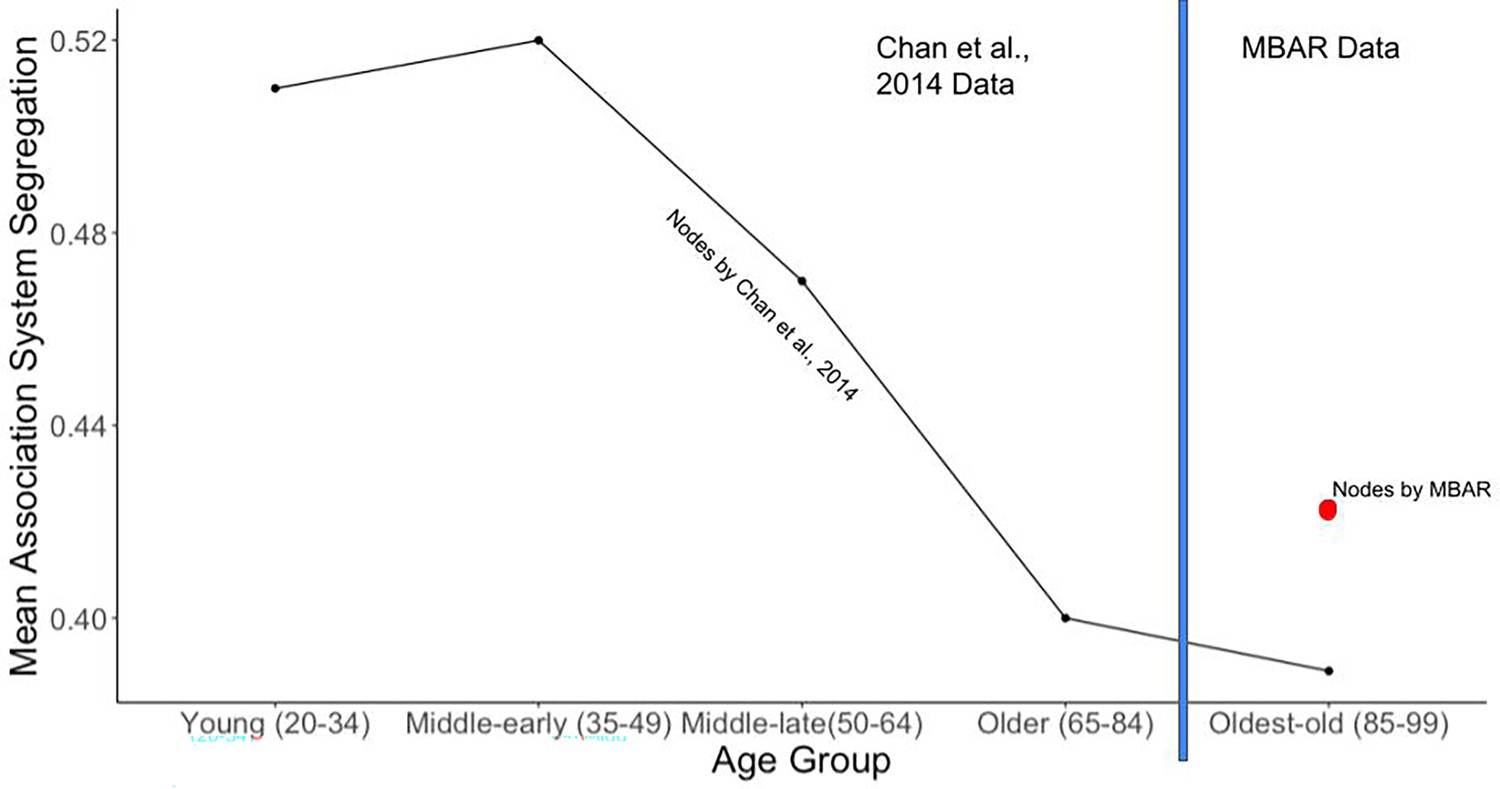
Mean association system segregation across age.
Line graph based on lifespan data reported in Chan et al., 2014 for young through older age groups. MBAR data represents the oldest-old age group. For the oldest-old, the black dot is the mean association system segregation using the same nodes as used in Chan et al., 2014, and the red dot is the mean association system segregation using nodes created with the current MBAR dataset. This figure supports previous findings of declining association system segregation with age.
Figure 7 with 1 supplement
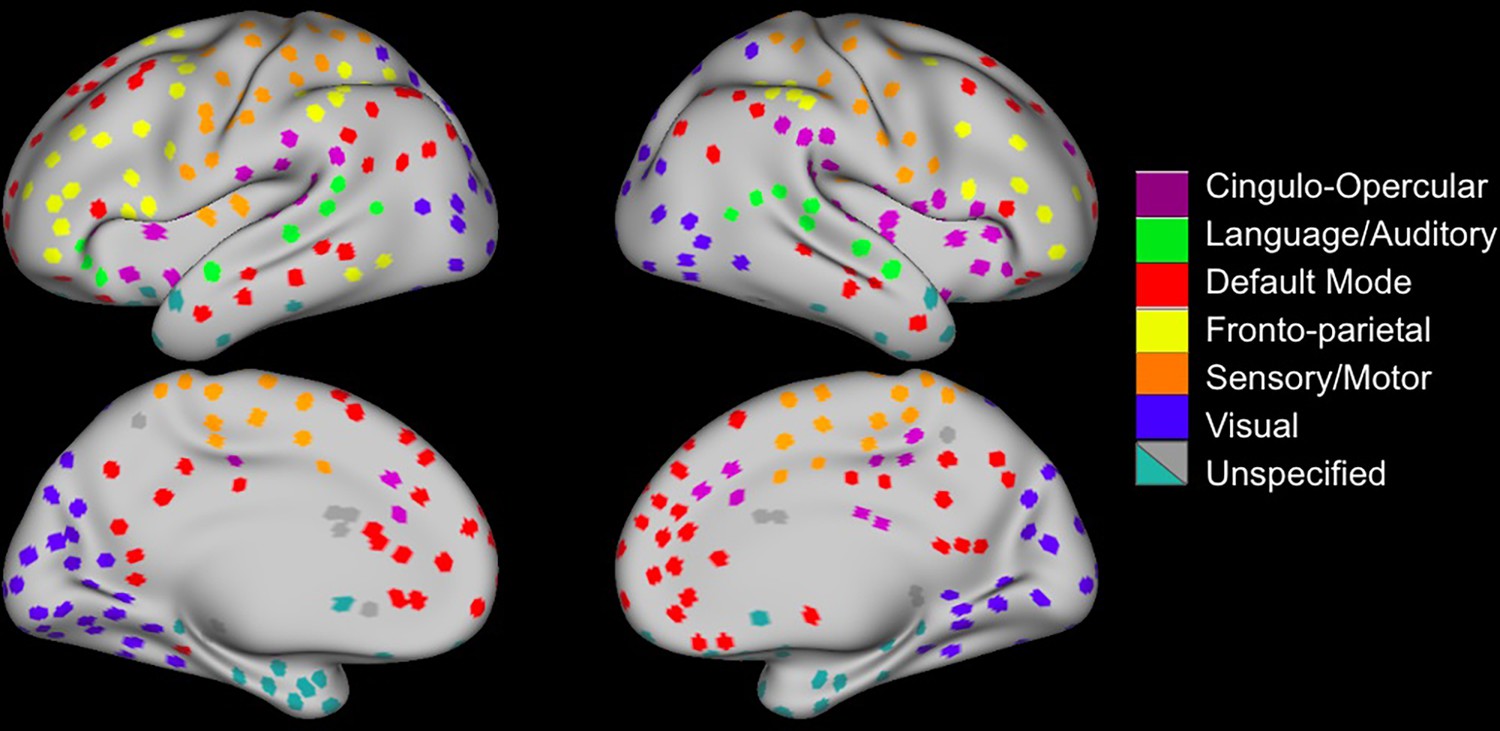
Nodes created from community detection of MBAR nodes (Figure 1).
Sensory/motor system consisted of visual, language/auditory, and sensory/motor networks. Association system consisted of cingulo-opercular, default mode, and fronto-parietal networks.
Figure 7—figure supplement 1
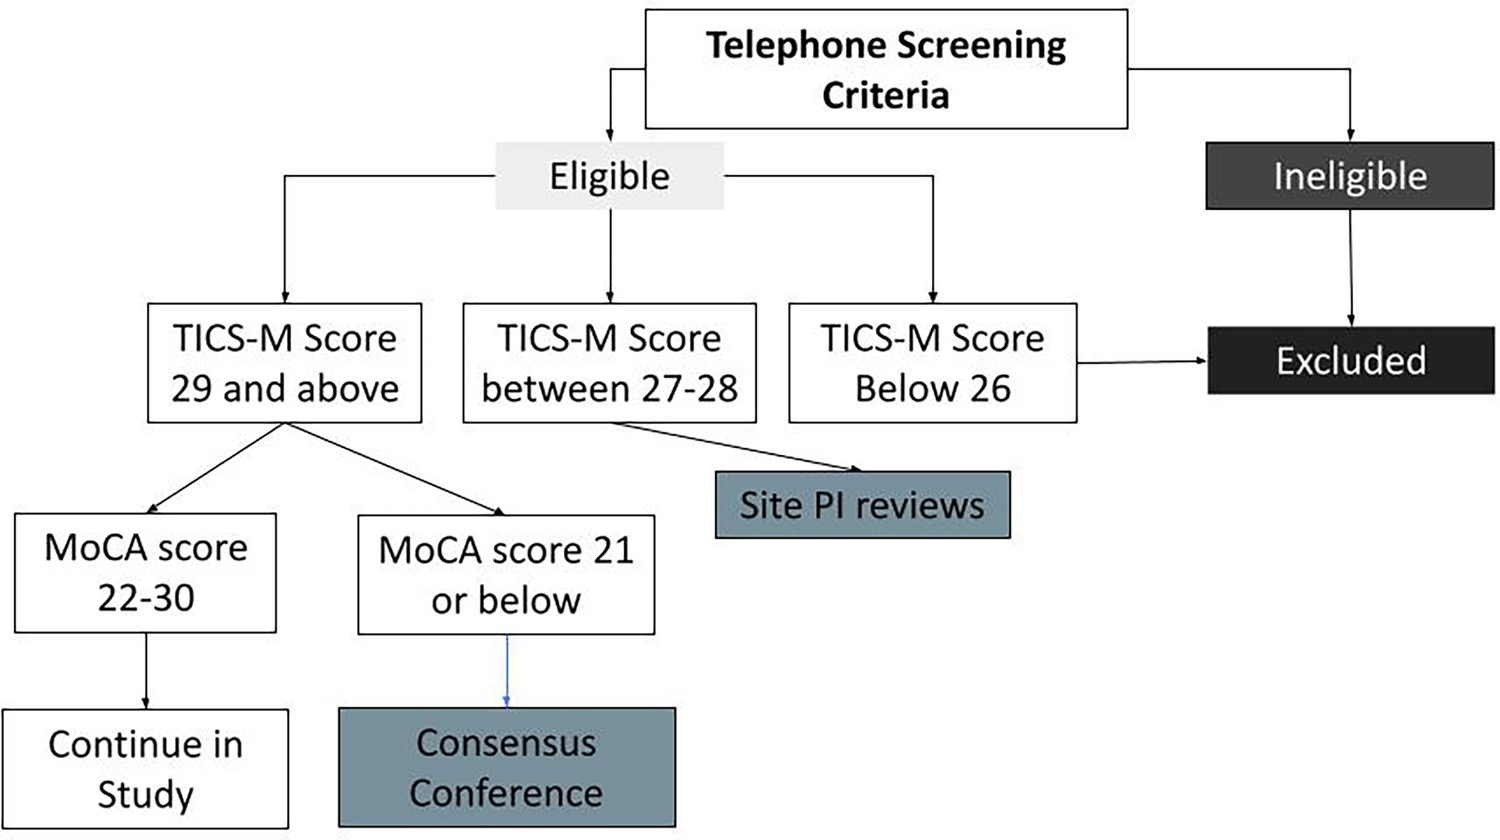
Participant screening process.
Telephone screening criteria included exclusion for major physical disabilities, MRI contraindications, dependence in instrumental activities of daily living or basic activities of daily living, uncontrolled medical conditions that would limit life expectancy or interfere with participation in the study, severe psychiatric conditions, neurological conditions (i.e., major vessel stroke, Parkinson’s disease, dementia), active substance abuse or alcohol dependence, less than sixth-grade reading level, vision or hearing deficits that would cause impediment to cognitive test administration, and inability to follow study protocol and task instructions due to cognitive impairment. Telephone Interview for Cognitive Status modified (TICS-M) was administered over the phone. If the TICS-M score falls within range for Site PI review, the Site PI would then decide if the participant should be deemed ineligible and excluded from the study or if the participant should continue on with the screening process. Montreal Cognitive Assessment (MoCA) was performed at the in-person screening visit. An additional evaluation was included in the initial in person visit, including examination by a neurologist, geriatric depression scale, and detailed medical history.
Tables
Table 1
Descriptive statistics for association system metrics and overall cognition metrics.
All variables are unitless except mean within-network connectivity (z-score).
| Association system and overall cognition metrics | Mean | SD | Range |
|---|---|---|---|
| Segregation | 0.4205 | 0.1071 | 0.0929–0.6463 |
| Mean within-network connectivity (z-score) | 0.0833 | 0.0246 | 0.0162–0.1522 |
| Participation coefficient | 0.4356 | 0.0235 | 0.3675–0.4746 |
| Modularity | 0.2561 | 0.0374 | 0.1321–0.3501 |
| Overall cognition factor score | 0.00989 | 0.4428 | –0.96–1.4 |
Table 2
Descriptive statistics of network segregation for each network.
All variables are unitless.
| Network segregation | Mean | SD | Range |
|---|---|---|---|
| DMN | 0.4517 | 0.1495 | 0.0628–0.7209 |
| FPN | 0.3279 | 0.1385 | –0.0482–0.5989 |
| CON | 0.3371 | 0.1330 | –0.0385–0.7062 |
-
CON, cingulo-opercular network; DMN, default mode network; FPN, fronto-parietal network.
Table 3
Descriptive statistics of cognitive domain factor score as computed through the exploratory factor analysis.
All variables are unitless.
| Cognitive domain factor scores | Mean | SD | Range |
|---|---|---|---|
| Processing speed | 0.05 | 0.86 | –2.49–2.74 |
| Executive functioning | 0.05 | 0.83 | –2.36–2.34 |
| Episodic memory | 0.05 | 0.84 | –1.82–1.69 |
| Working memory | –0.02 | 0.87 | –2.4–2.53 |
| Language | –0.08 | 0.79 | –1.77–2.54 |
Table 4
Descriptive statistics of characteristics of the study sample.
| Participant characteristics | Total sample, N = 146 |
|---|---|
| Age (years), mean ± SD (range) | 88.4 ± 3.18 (85–99) |
| Education (years), mean ± SD (range) | 16.1 ± 3.03 (9–26) |
| Sex, N(%) | |
| Female | 79 (54.11%) |
| Male | 67 (45.89%) |
| Race, N (%) | |
| Non-Hispanic Caucasian | 134 (91.78%) |
| African American | 6 (4.11%) |
| Hispanic Caucasian | 5 (3.42%) |
| Asian | 1 (0.69%) |
| Marital status, N (%) | |
| Widowed | 74 (50.69%) |
| Married | 54 (36.99%) |
| Divorced | 13 (8.90%) |
| Living as married/domestic partnership | 3 (2.06%) |
| Never married | 2 (1.37%) |
| Dominant hand, N (%) | |
| Right | 131 (89.73%) |
| Left | 15 (10.27%) |
Additional files
-
Supplementary file 1
Participant characteristics.
- https://cdn.elifesciences.org/articles/78076/elife-78076-supp1-v2.docx
-
Supplementary file 2
Factor loadings for cognitive domains.
- https://cdn.elifesciences.org/articles/78076/elife-78076-supp2-v2.docx
-
Supplementary file 3
Correlations between processing speed and segregation in each parcellation.
- https://cdn.elifesciences.org/articles/78076/elife-78076-supp3-v2.docx
-
Supplementary file 4
Correlations between cognitive domains and network segregation.
- https://cdn.elifesciences.org/articles/78076/elife-78076-supp4-v2.docx
-
Supplementary file 5
Supplemental regressions.
- https://cdn.elifesciences.org/articles/78076/elife-78076-supp5-v2.docx
-
Transparent reporting form
- https://cdn.elifesciences.org/articles/78076/elife-78076-transrepform1-v2.pdf
Download links
A two-part list of links to download the article, or parts of the article, in various formats.
Downloads (link to download the article as PDF)
Open citations (links to open the citations from this article in various online reference manager services)
Cite this article (links to download the citations from this article in formats compatible with various reference manager tools)
Network segregation is associated with processing speed in the cognitively healthy oldest-old
eLife 14:e78076.
https://doi.org/10.7554/eLife.78076


