Frequency-specific neural signatures of perceptual content and perceptual stability
- Neuroscience Institute, New York University Grossman School of Medicine, United States
- Department of Neurology, New York University Grossman School of Medicine, United States
- Department of Neuroscience and Physiology, New York University Grossman School of Medicine, United States
- Department of Radiology, New York University Grossman School of Medicine, United States
Figures
Figure 1 with 1 supplement
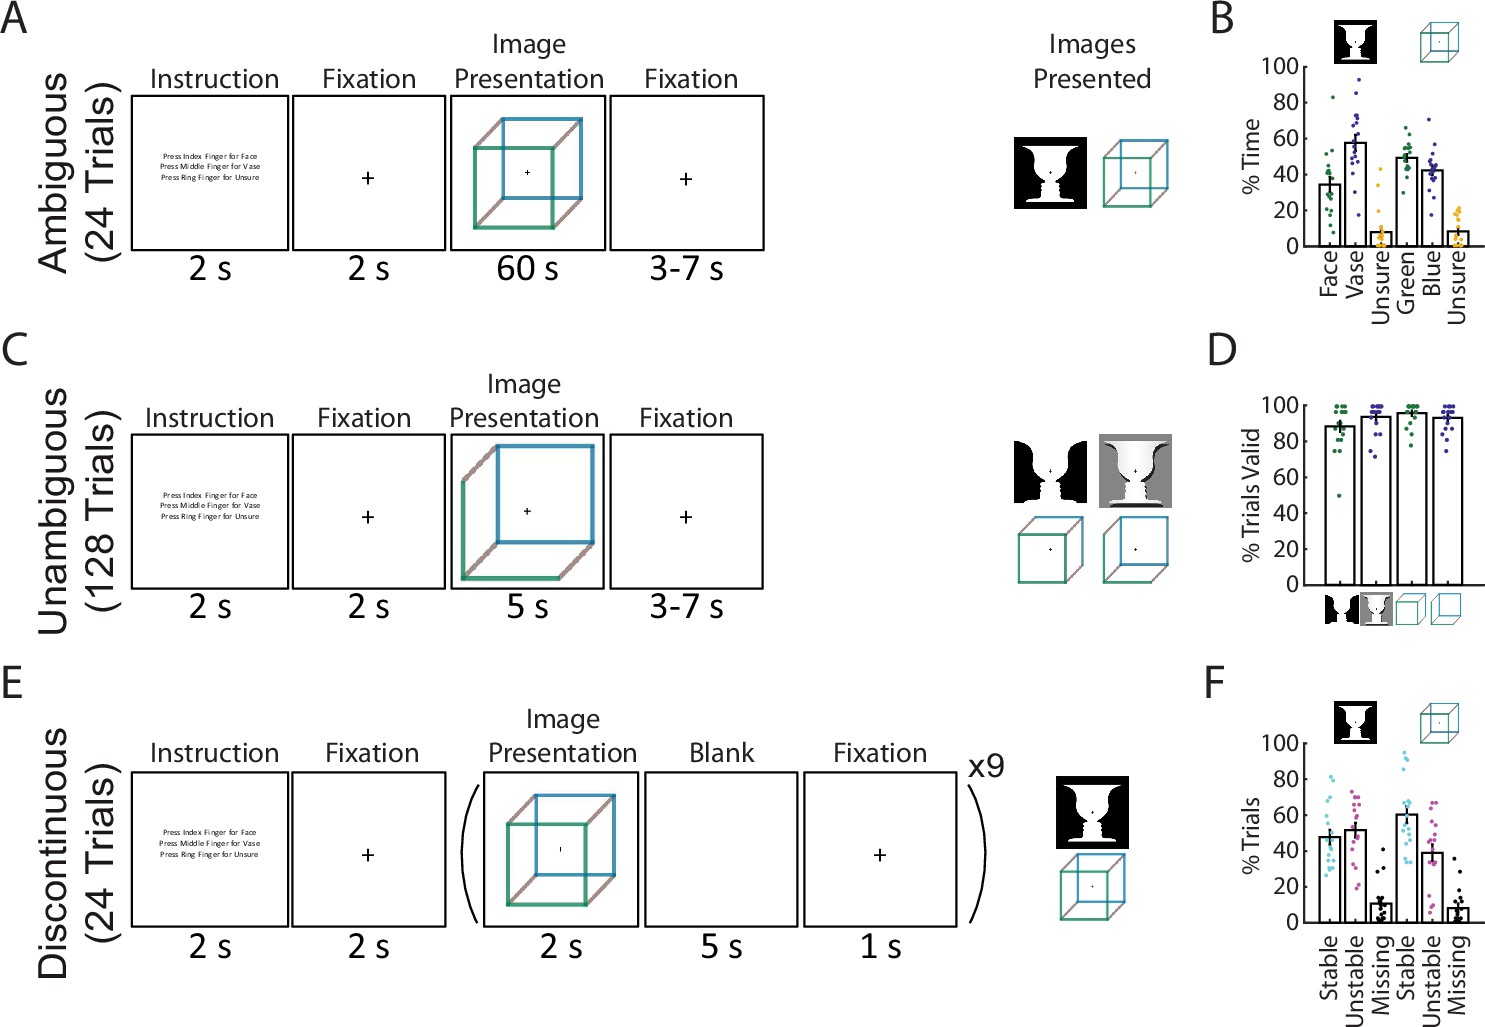
Paradigm and behavioral results.
(A) In the Ambiguous condition, bistable images were presented for 60 s each, and subjects pressed buttons to indicate their current percept. (B) Percentage of time spent in each perceptual state during the Ambiguous condition. (C) In the Unambiguous condition, bistable images which were modified to reduce their ambiguity were presented. (D) Percentage of valid trials for each image type during the Unambiguous condition. Valid trials consisted of the subject pressing the button only once for the intended percept. (E) In the Discontinuous condition, ambiguous images were shown nine times with interleaving blank periods. (F) Percentage of blank periods that were classified as Stable, Unstable, or Missing. ‘Stable’ indicates that perception was the same before and after the blank period, ‘Unstable’ that it was different, and ‘missing’ indicates that no button press was recorded during the pre or post image presentation period. (B, D, F) Dots indicate individual subjects; bars and error bars indicate group mean and standard error of the mean (SEM).
Figure 1—figure supplement 1
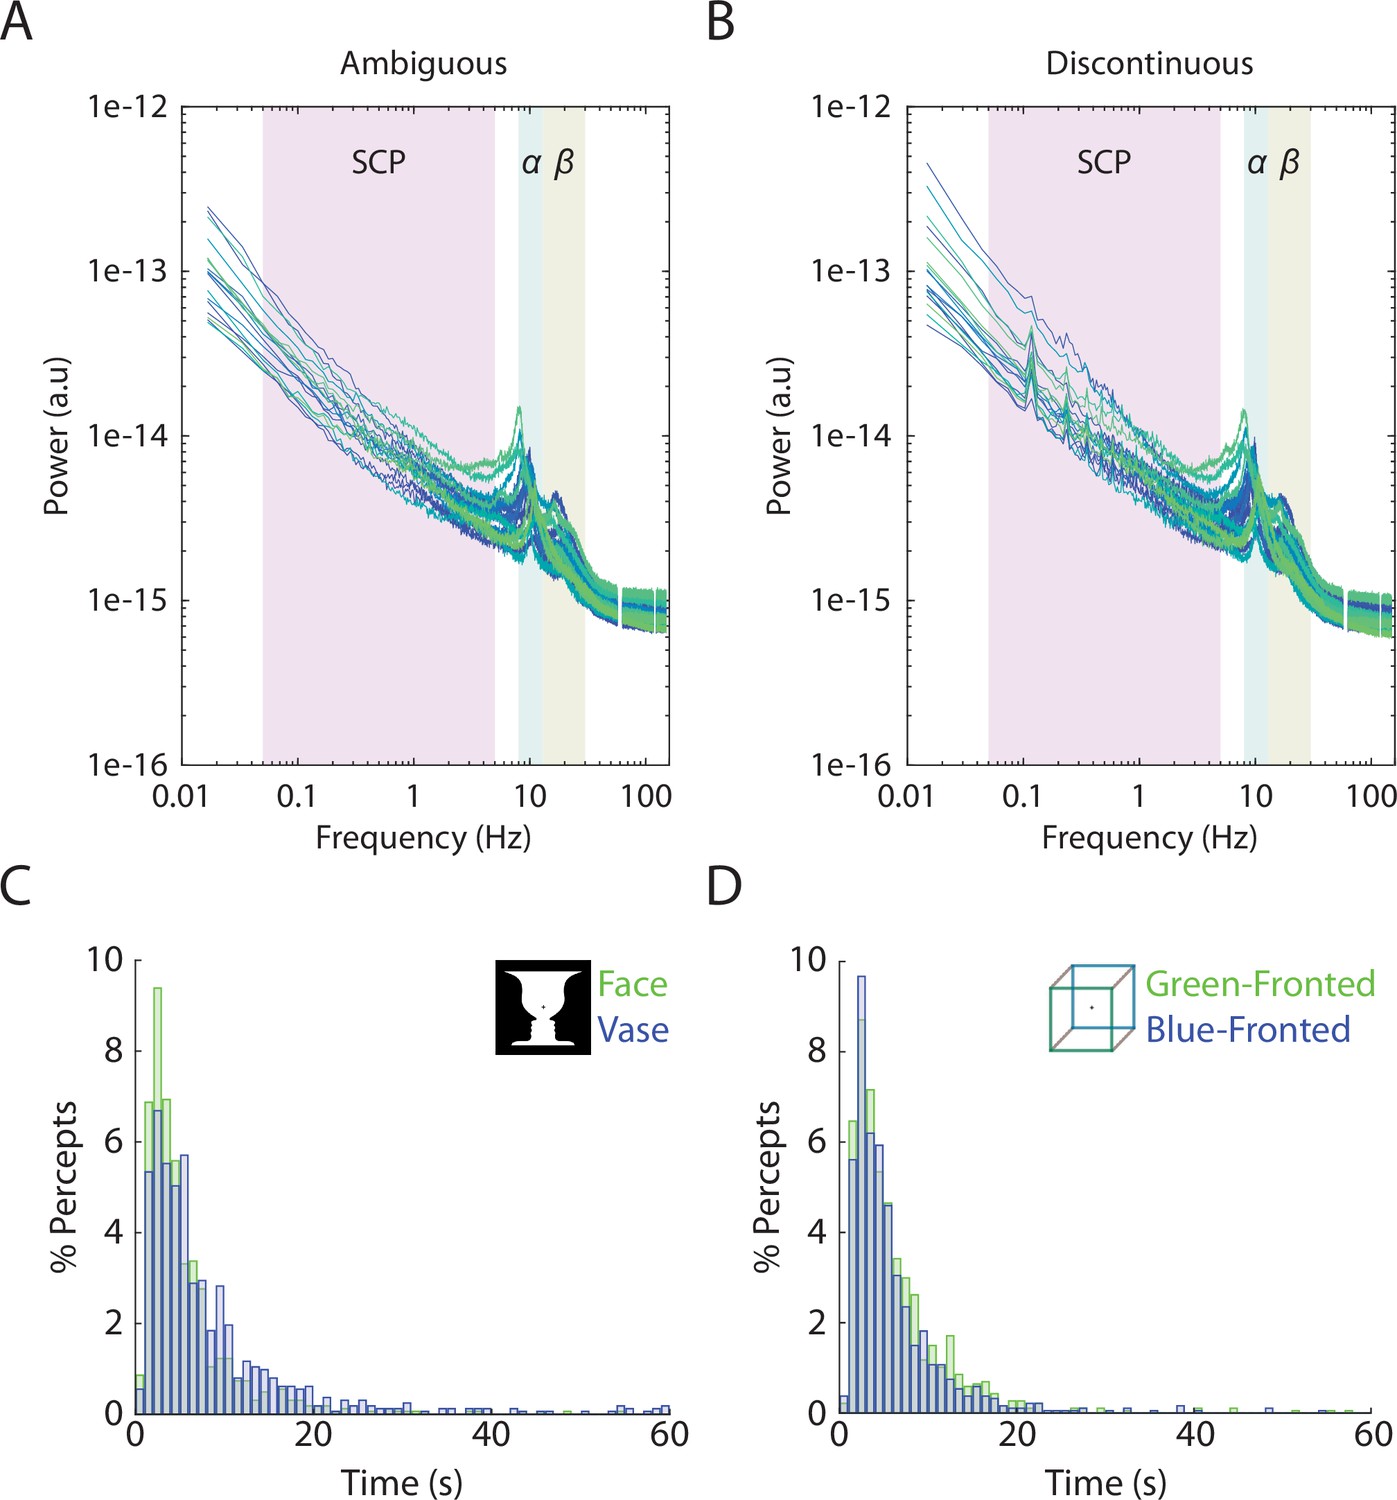
Individual-level power spectra and group-level duration histograms.
(A, B) Each line corresponds to a subject’s power spectrum averaged over all 272 MEG sensors. Shaded boxes correspond to the three frequency bands analyzed, slow cortical potential (SCP) (0.05–5 Hz), alpha (8–13 Hz) amplitude, and beta (13–30 Hz) amplitude. For the discontinuous condition, peaks can be seen in low frequencies corresponding to the task structure (8 s between consecutive image onsets gives rise to 0.125 Hz and its harmonics). Frequencies at line noise (60 Hz) and its harmonics are not plotted. (C, D) Histograms showing the distribution of percept durations, including data pooled across 19 subjects.
Figure 2 with 1 supplement
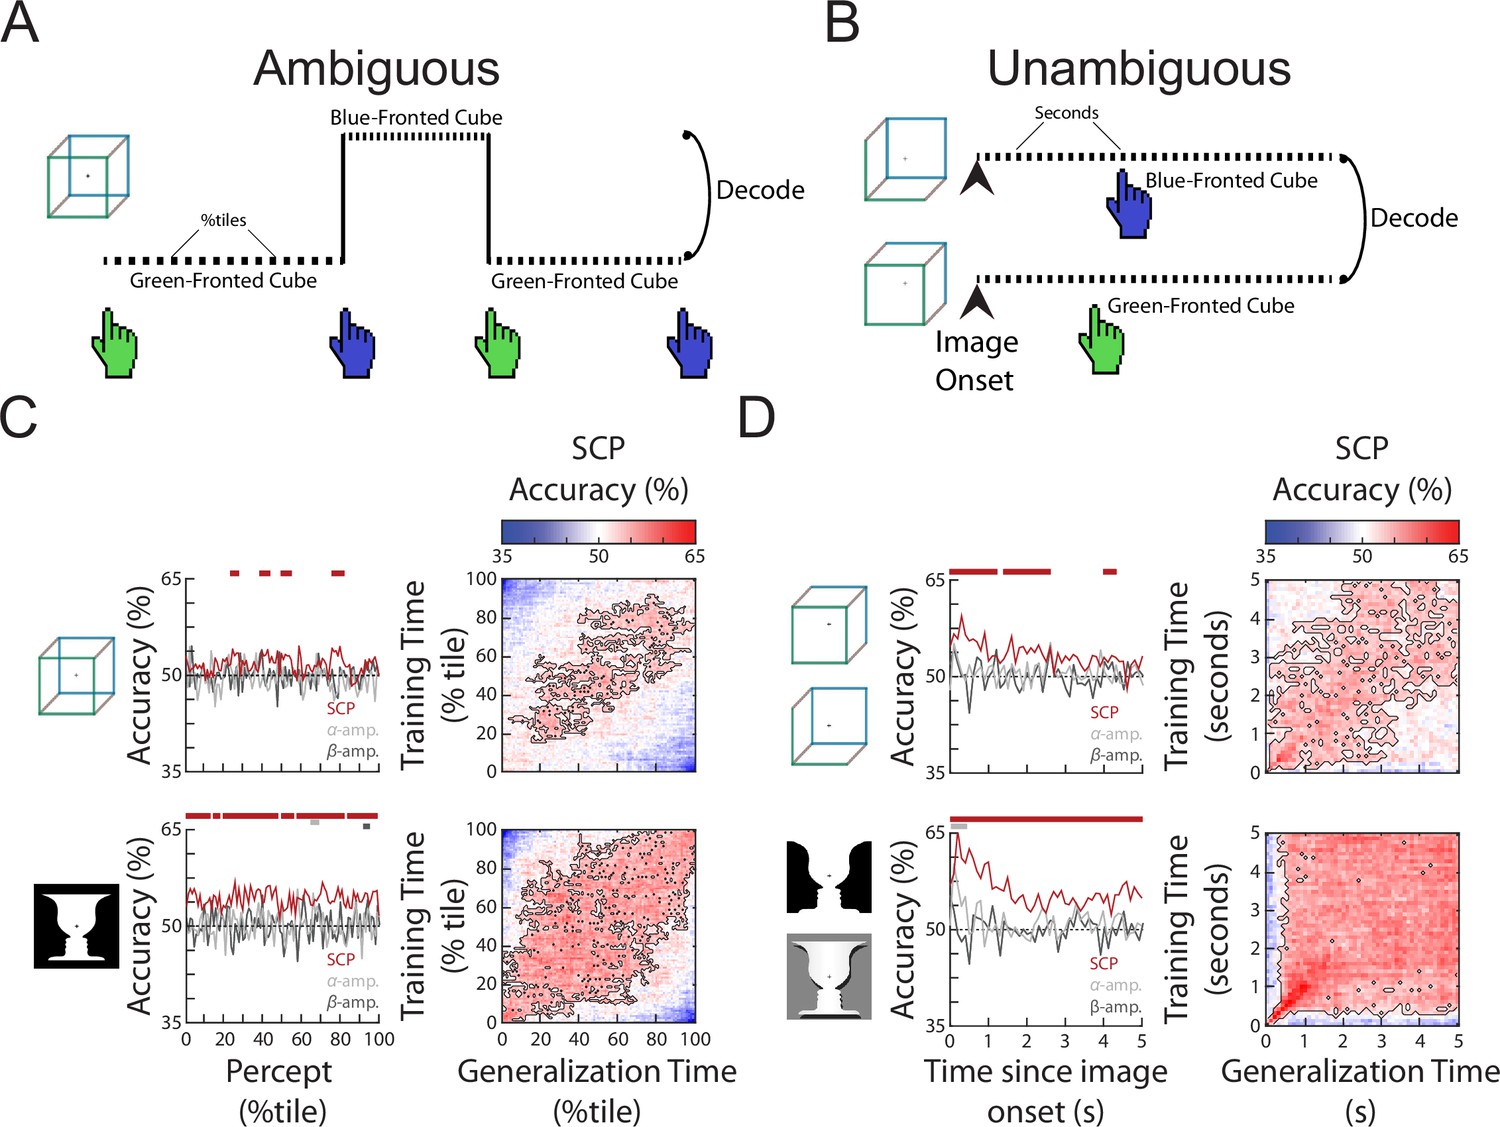
The content of subjective perception is encoded in slow cortical potential (SCP) activity.
(A) In the Ambiguous condition, subjects continuously reported their current perception using button presses. Neural activity during each percept was split into 100 percentiles according to time elapsed, and percept was then decoded at each temporal percentile. (B) In the Unambiguous condition, different disambiguated images were shown that emphasized one of the two percepts. For valid trials in which subjects’ reported percept matched the intended percept (see Figure 1D), image content was decoded separately at each time point during image presentation. (C) (Left) Decoding accuracy for perceptual content during the time course of a percept. Significant temporal clusters of percept decoding exist for both images using SCP as the decoder input, but not when alpha or beta amplitude was used as decoder input. (Right) Temporal generalization matrices. Significant clusters are outlined, showing generalization across a large proportion of the percept duration. (D) (Left) Decoding accuracy for unambiguous images during their presentation. Significant temporal clusters of image/percept decoding exist in the SCP range throughout image presentation, but not for alpha/beta amplitude. (Right) Temporal generalization matrices showing significant generalization across a large proportion of the image presentation duration.
Figure 2—figure supplement 1
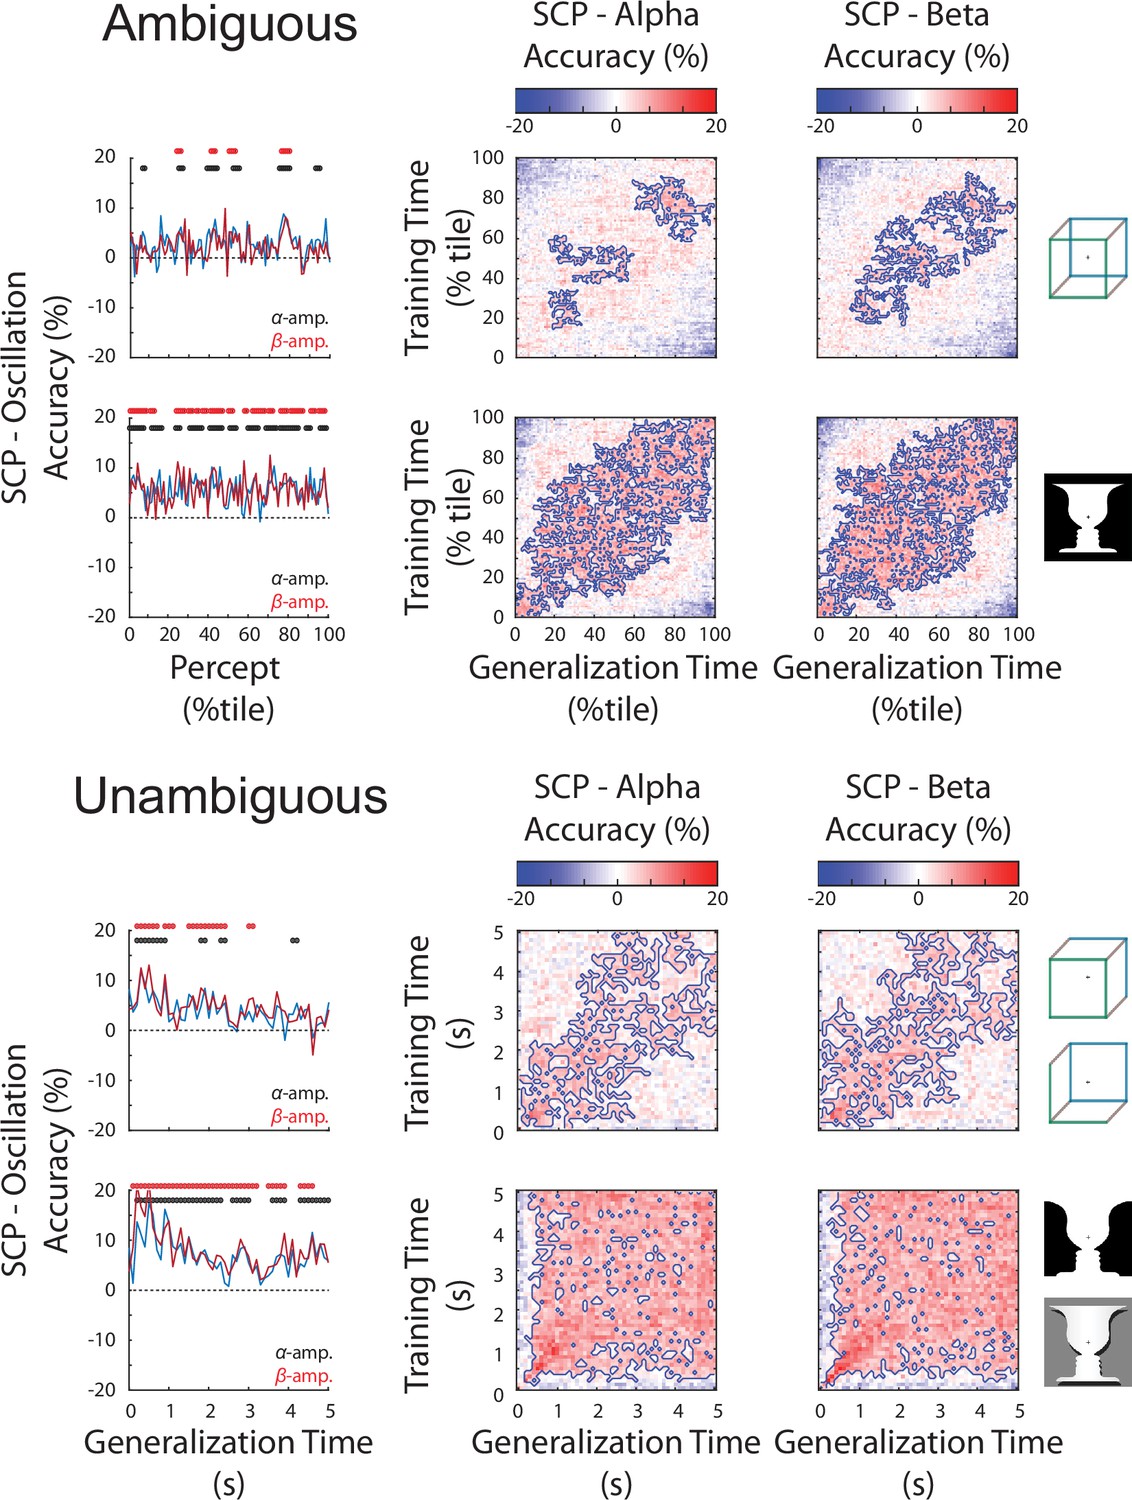
Slow cortical potential (SCP) has significantly higher decoding than alpha or beta oscillations in both the ambiguous (top) and unambiguous (bottom) conditions.
(Left) Difference in decoding accuracy between SCP and alpha/beta amplitude for perceptual content across the time course of a percept. Significant temporal clusters of percept decoding exist for both images. (Right) Difference in temporal generalization matrices (SCP – alpha or beta amplitude). Significant clusters are outlined, showing the temporal generalization locations where SCP has significantly greater decoding accuracy. Significance for all plots is established by cluster-based permutation test and presented at a p < 0.05, corrected level.
Figure 3

Method to define behaviorally relevant neural subspace.
(A) For the Ambiguous and Discontinuous conditions, a set of behavioral metrics was defined, which incorporated information about both the perceptual content and the perceptual switching dynamics. (B) Using a training set of MEG data, neural subspaces were defined by apply multilinear regression to activity from each sensor using the four behavioral metrics as predictors. The weights across sensors for each behavioral metric define the neural subspace relevant to that metric. (C) The test MEG dataset can then be projected into the subspace corresponding to a particular behavioral metric to provide a prediction of the metric value at each time point. (D) Accuracy of the prediction can then be tested by comparison to the actual behavioral data.
Figure 4 with 2 supplements
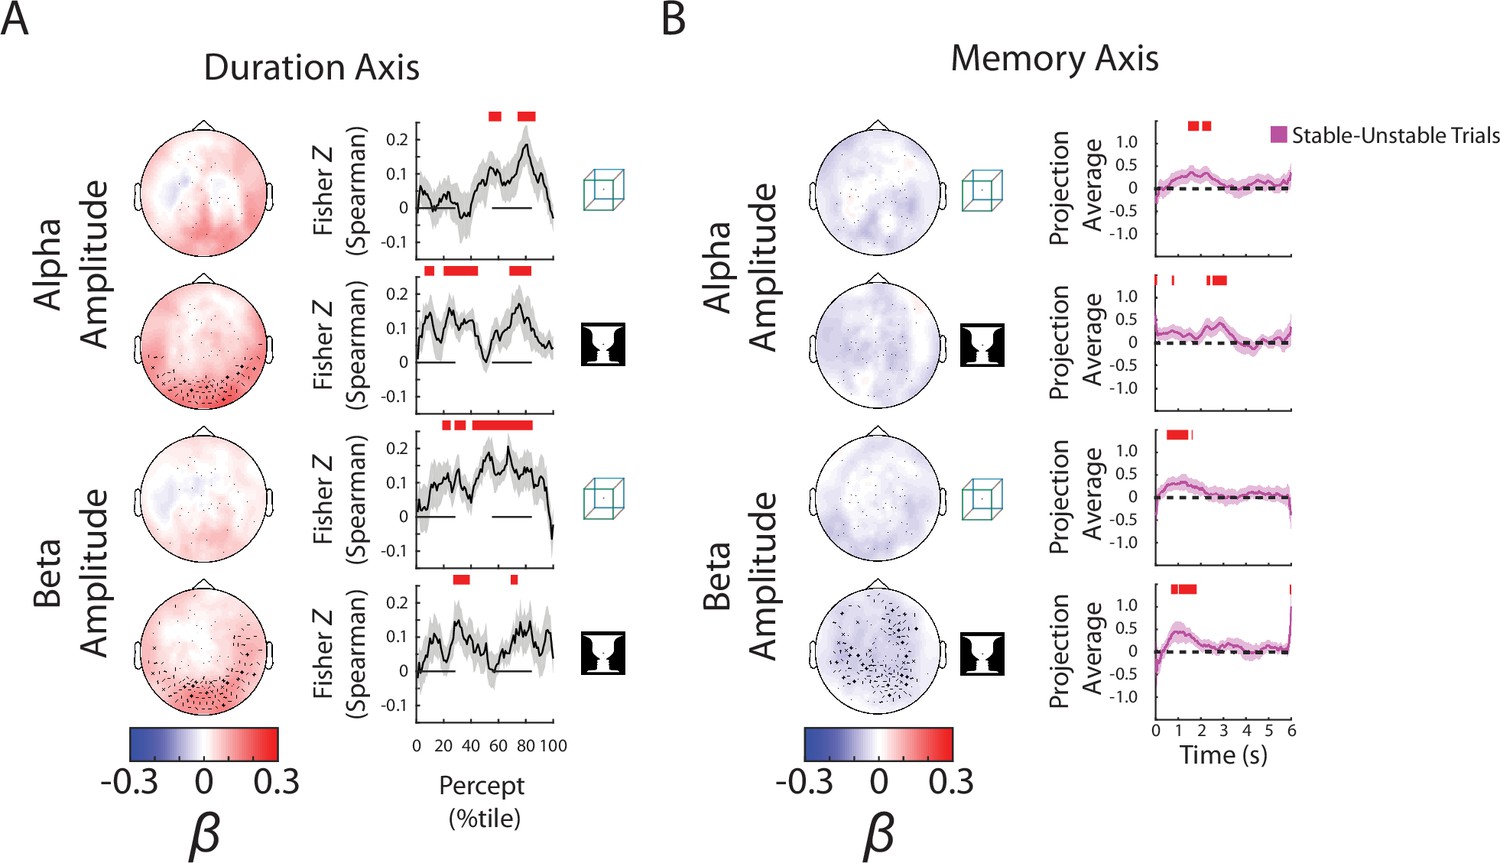
Alpha and beta amplitudes are involved in the switching process and perceptual memory trace.
(A) (Left) Group-average β weights for Duration axis in the ambiguous condition. Sensors whose β weights are significantly different from zero (Wilcoxon signed-rank test, cluster-corrected, p < 0.05) are marked with x. (Right) Mean Fisher z-transformed Spearman rho values, obtained by correlating predicted and actual behavioral values across trials for each subject. Shaded areas show group-level standard error of mean (SEM). Significant time points (p < 0.05, cluster-based permutation test) are indicated by the horizontal red bars. (B) (Left) Group-average β weights for Memory axis in the discontinuous condition. Sensors whose group-level β weights are significantly different from zero (Wilcoxon signed-rank test, cluster-corrected, p < 0.05) are marked with x. (Right) Difference in neural activity projected onto the Memory axis between the Stable and Unstable trials (i.e., blank periods sandwiched by the same percept or different percepts). Significant differences (p < 0.05, cluster-based permutation test) between them are indicated by red horizontal bars.
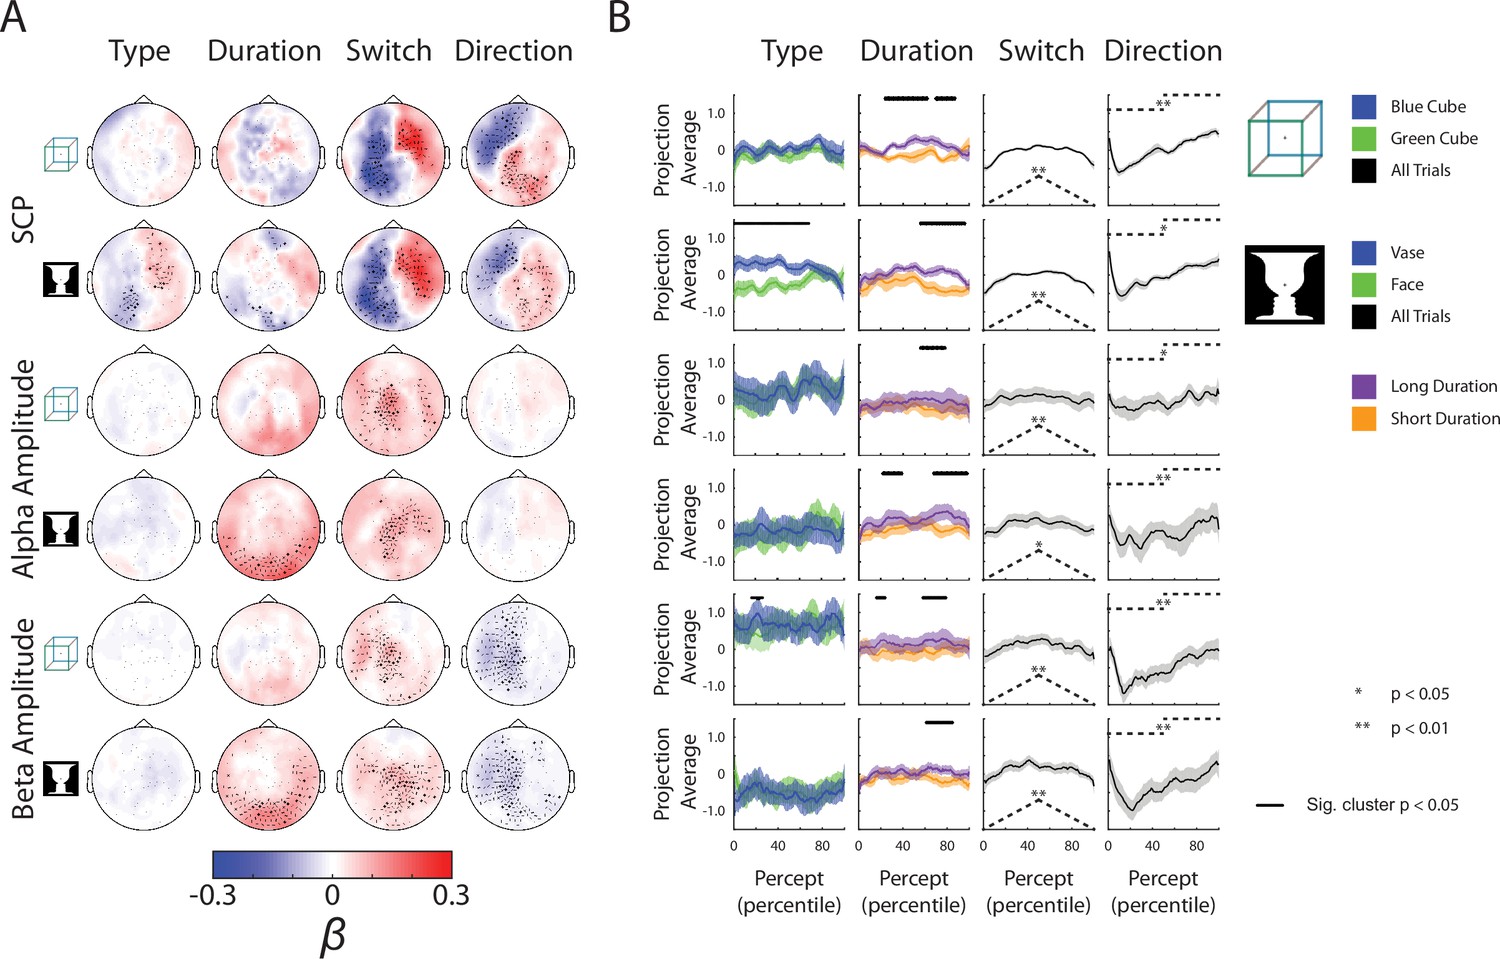
Figure 4—figure supplement 1
Complete neural subspace results for the Ambiguous condition.
(A) Group-average β weights. Sensors whose β weights are significantly different from zero (Wilcoxon signed-rank test, cluster-corrected, p < 0.05) are marked with x. (B) Test dataset projected onto each behavioral axis; shaded areas indicate SEM across subjects. For the Type axis, trials for the different percepts are projected and averaged separately, and difference between the trial-averaged projections are tested by a paired t-test across subjects (one-sided). For the Duration axis, the longest and shortest 50% of trials are averaged and compared by a paired t-test across subjects (one-sided). Significant temporal clusters (p < 0.05, cluster-based permutation test) are indicated by black horizontal bars at the top. For the Switch and Direction axes, all trials are projected and averaged, and compared to the actual behavioral metric (shown as dashed black lines here, also see Figure 3A) using a Spearman correlation for the Switch axis and a two-sample t-test (between the first and second half of the trial) for the Direction axis. Subsequently, the rho and t-stats are tested at the group level by a Wilcoxon sign-rank test against zero (one-sided).
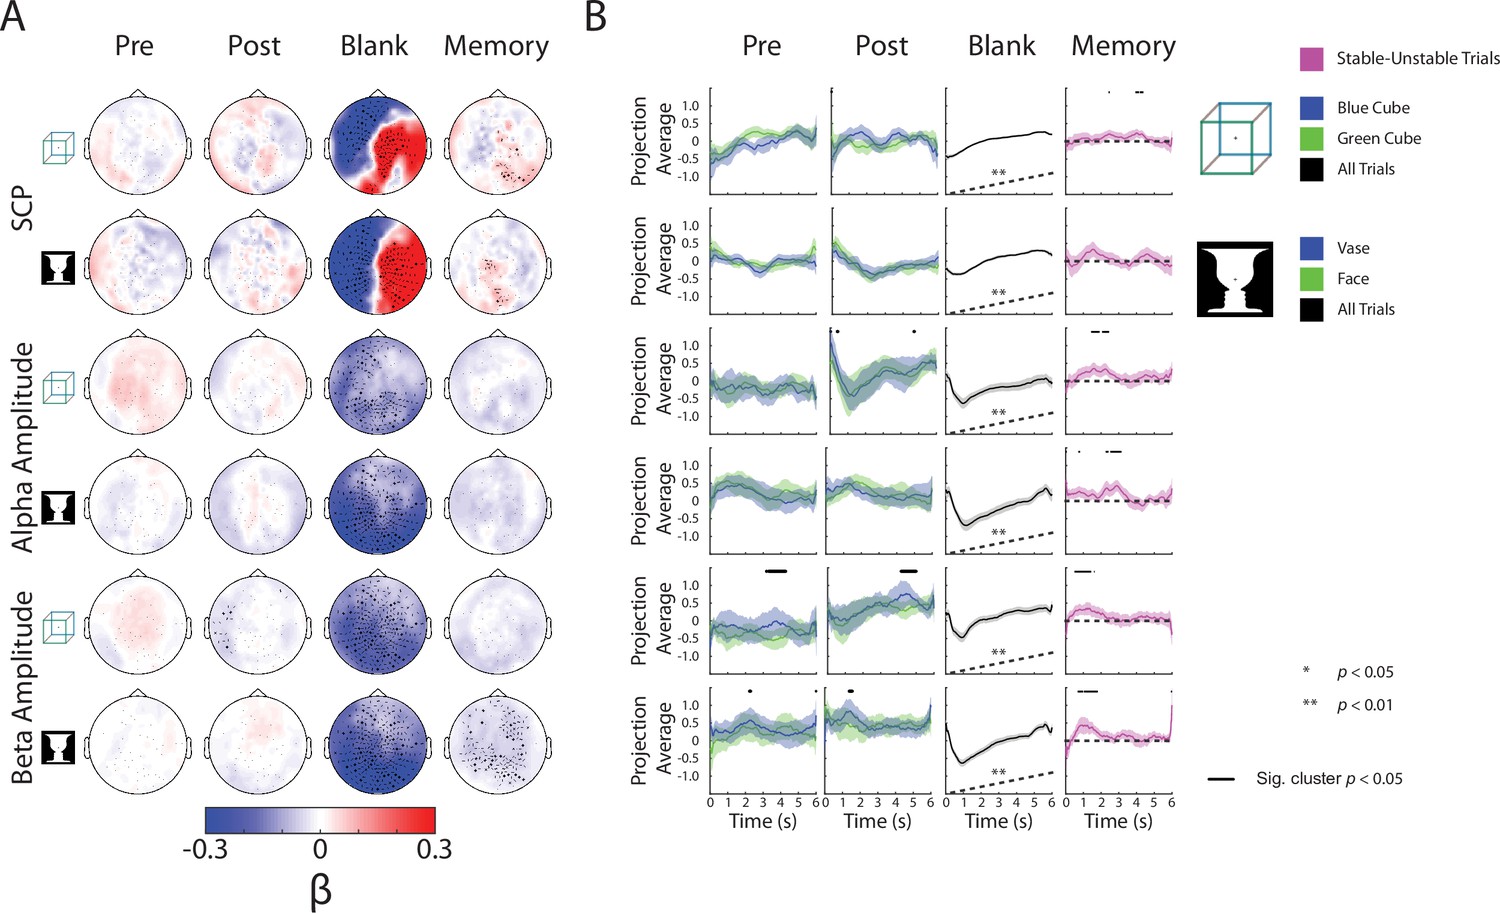
Figure 4—figure supplement 2
Complete neural subspace results for the Discontinuous condition.
(A) Group-average β weights. Sensors whose β weights are significantly different from zero (Wilcoxon signed-rank test, cluster-corrected, p < 0.05) are marked with x. (B) Test dataset, including data from the blank periods only, projected onto each behavioral axis; shaded areas indicate SEM across subjects. For Pre and Post axes, trials for the different percepts are projected separately, and difference between them tested by a paired t-test (one-sided) across subjects. For the Blank axis, all trials are projected and averaged and compared to the actual behavior (shown as black dashed line here; also see Figure 3A) using a Spearman correlation; subsequently, the rho values were tested at the group level by a Wilcoxon sign-rank test against zero (one-sided). For the Memory axis, stable and unstable trials are projected separately, and the difference between them is plotted and tested by a one-sample t-test across subjects (one-sided).
Author response image 1
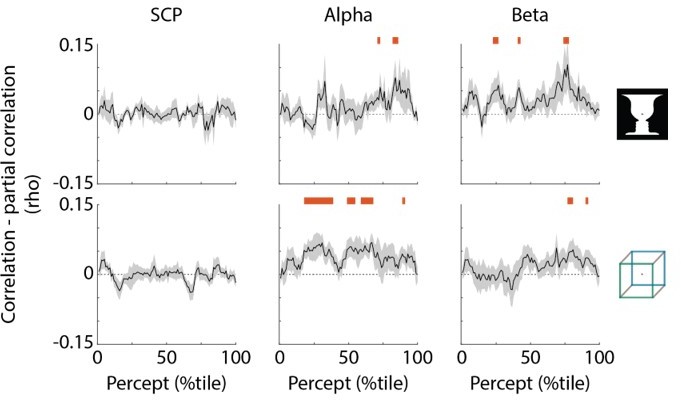
SCP carries unique information about perceptual stability.
Black trace shows reduction in correlation with percept duration when regressing out the other two neural features; shaded areas show s.e.m. across subjects. Red bars indicate time points where partial correlation was significantly reduced as compared to the original correlation (one-sided t-test, p<0.05, cluster-based permutation test with 1000 permutations).
Additional files
Download links
A two-part list of links to download the article, or parts of the article, in various formats.
Downloads (link to download the article as PDF)
Open citations (links to open the citations from this article in various online reference manager services)
Cite this article (links to download the citations from this article in formats compatible with various reference manager tools)
Frequency-specific neural signatures of perceptual content and perceptual stability
eLife 11:e78108.
https://doi.org/10.7554/eLife.78108


