Three-dimensional flagella structures from animals’ closest unicellular relatives, the Choanoflagellates
- Department of Cell Biology, University of Texas Southwestern Medical Center, United States
Figures
Figure 1 with 2 supplements
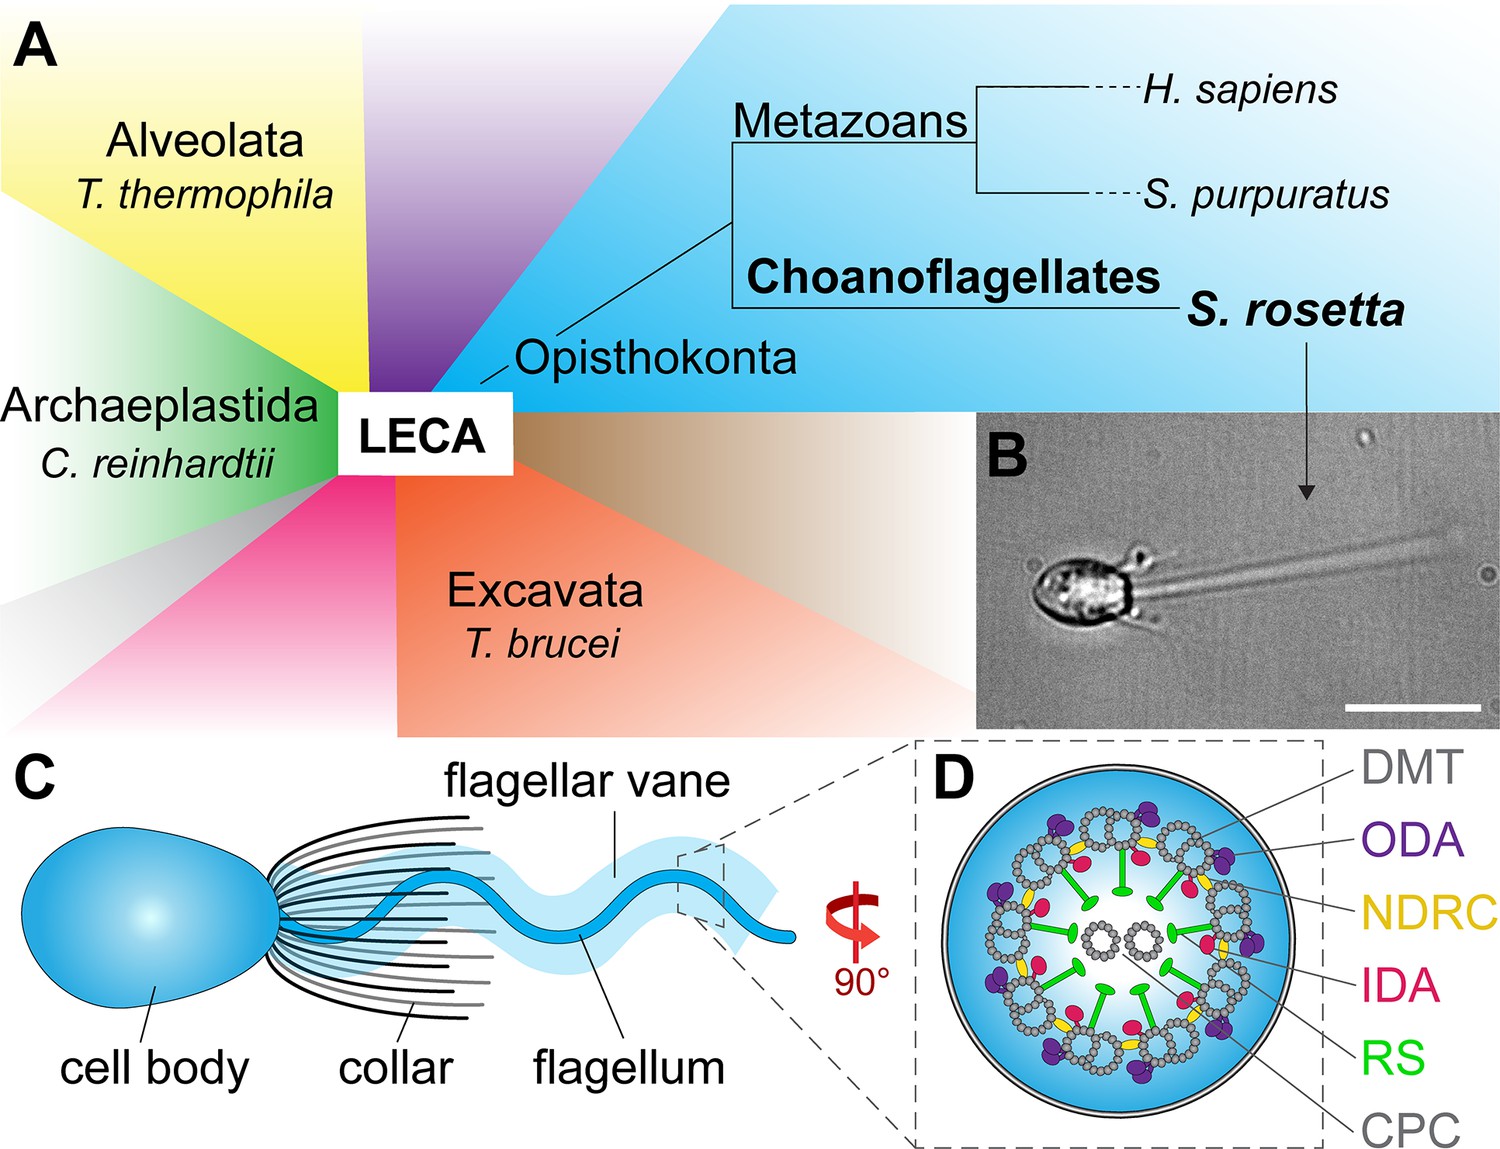
Phylogeny and flagellar features of the choanoflagellate S.rosetta.
(A) Phylogenetic tree showing major eukaryotic suprakingdoms (colored blocks) stemming from the last common eukaryotic ancestor (LECA). Suprakingdoms with representatives that have been imaged using cryo-ET are labeled (i.e. Alveolata, Opisthokonta, Excavata, and Archaeplastida) with example species. Choanoflagellates are part of the Opisthokonta branch and form a sister group with metazoans, having shared a last common unicellular ancestor more than 600 million years ago. Whereas metazoans are multicellular animals, the choanoflagellates have remained unicellular/colonial. (B) Fixed Salpingoeca rosetta cell (a marine choanoflagellate). A short movie of an S. rosetta cell swimming and additional images of selected S. rosetta cell types can be found in Figure 1—video 1 and Figure 1—figure supplement 1, respectively. (C) Overview cartoon of the choanoflagellate cell architecture, including the cell body and the ring of actin-based microvilli comprising the collar, which surrounds a single flagellum with a flagellar vane. (D) Cross-sectional diagram of the choanoflagellate flagellum indicating known flagellar components. The cross-section in this figure and throughout the paper are viewed from proximal towards the distal tip of the flagellum, and the longitudinal sections are shown with proximal on the left unless otherwise indicated. Labels: CPC, central pair complex; DMT, doublet microtubule; IDA and ODA, inner and outer dynein arm; N-DRC, nexin-dynein regulatory complex; RS, radial spoke. Scale bar: 10 µm (B).
Figure 1—figure supplement 1
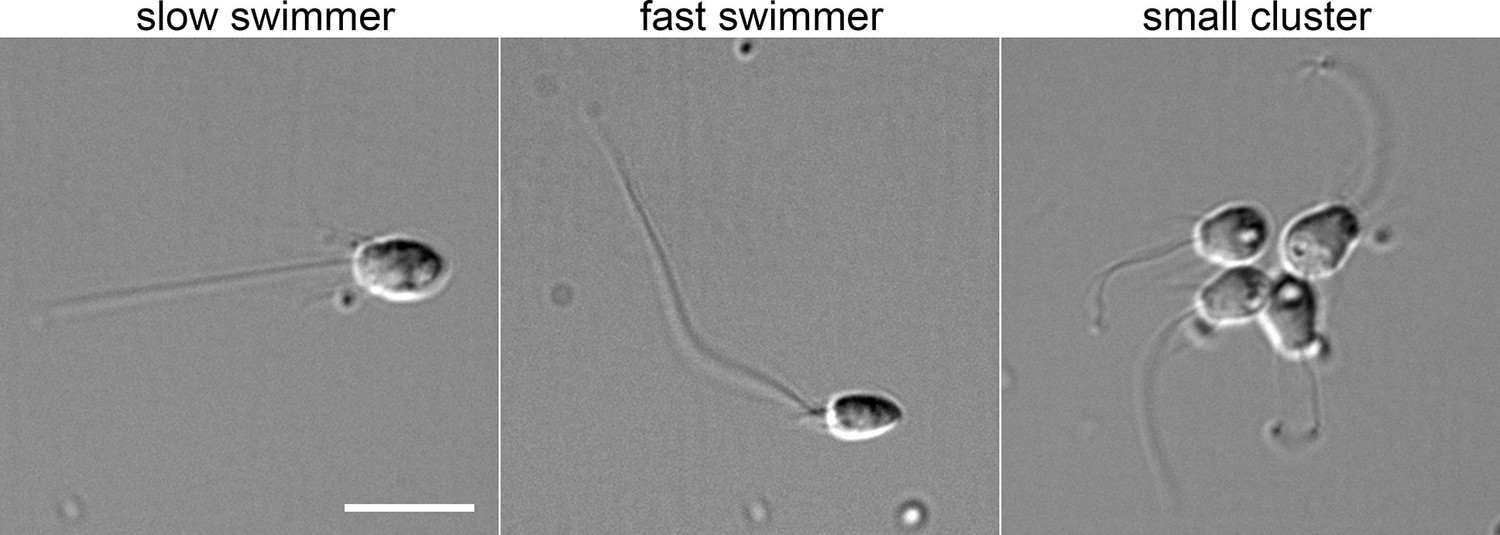
Morphology of a subset of S.rosetta cell types.
Examples of choanoflagellate cell morphology from a single culture. Slow swimmers have a relatively large, rounded cell body, whereas fast swimmers have a smaller, pointier cell body, shorter collar microvilli, and a longer flagellum. The cluster shown here is not a true ‘rosette’, but rather represents linked cells that likely recently divided. Cells were fixed with 2% glutaraldehyde and imaged at 60 x magnification using differential interference contrast light microscopy. Scale bar, 10 µm.
Figure 1—video 1
Choanoflagellate cell swimming in culture imaged by light microscopy at ×40 magnification.
Propelled by its single flagellum, a slow swimming S. rosetta cell (dark/larger oval) navigates through a field of bacterial prey (small circles). Captured bacteria also line the ring of collar microvilli at the base of the cell body. A recently divided doublet cell enters the field of view from the lower right near the end of the video.
Figure 2
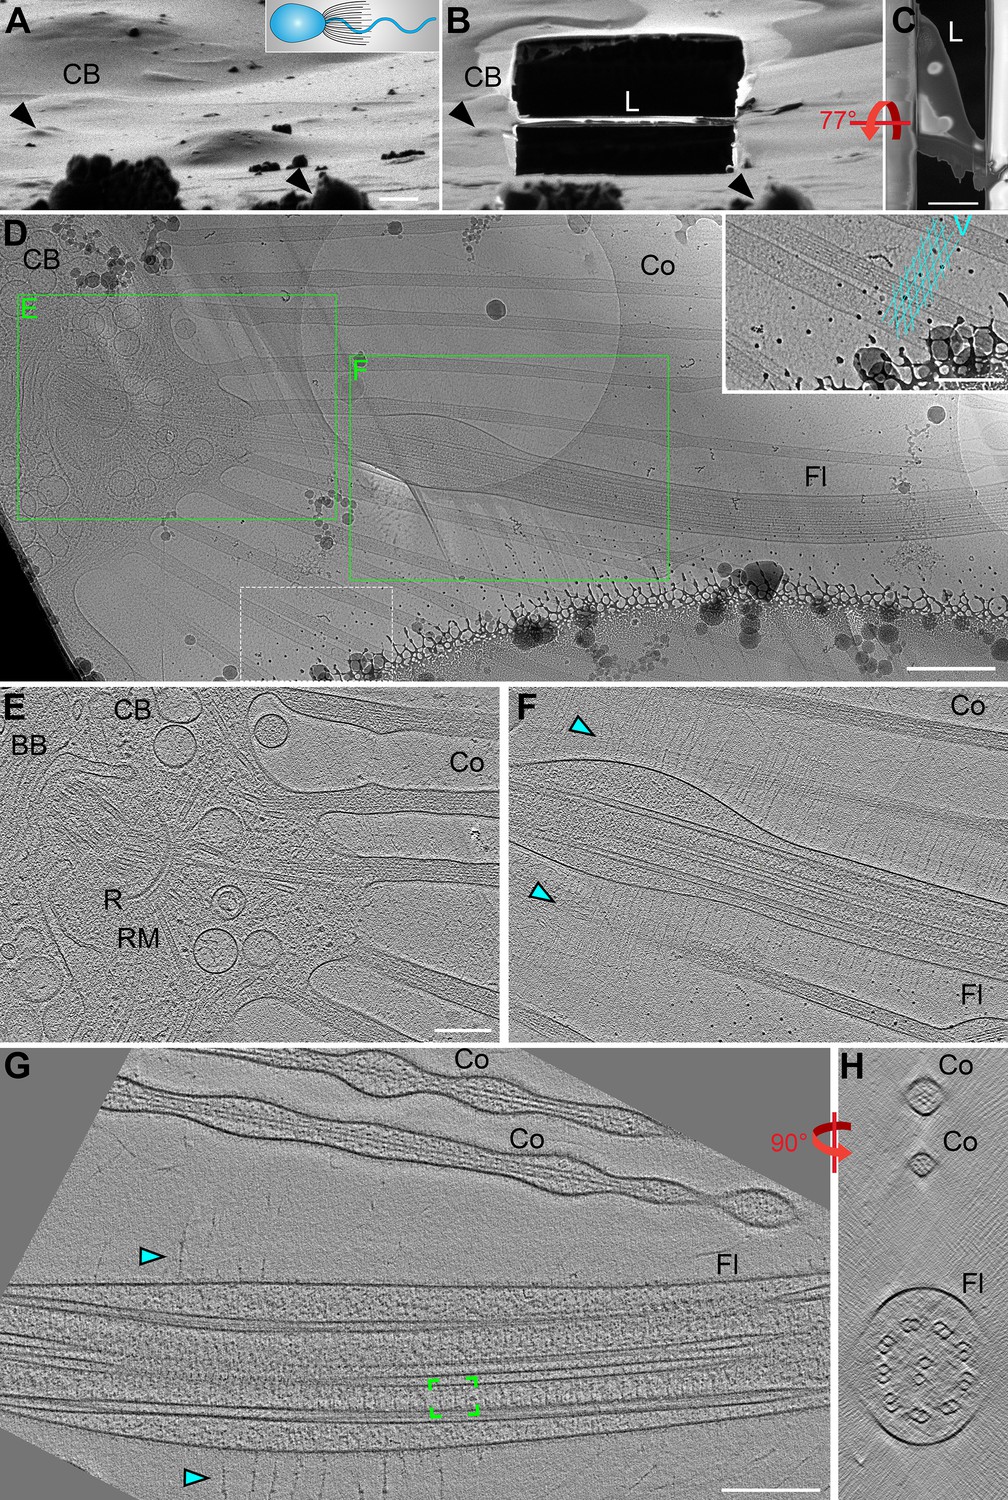
Cryo-FIB milling and cryo-ET enable visualization of flagellar structures.
(A,B) Choanoflagellate cell before (A) and after (B) cryo-FIB milling, as viewed by the ion beam. The cartoon denotes the cell’s orientation, with cell body (CB) to the left. Black arrowheads in A and B denote surface features in the ice to serve as landmarks for positional orientation. Note: the lamella (L) that includes the flagellum appears low relative to the cell body due to a visual illusion caused by the tilt and the several micron thick sputter/GIS-layer on top of the ice layer. (C) Perpendicular top view of the cryo-FIB milled lamella (shown in B) viewed with the electron beam. (D) Overview map of the milled flagellum (Fl), with green boxes indicating the positions of two sequential tomograms that were recorded from this lamella, shown in (E and F). The area within the white dashed line is magnified as an inset in the upper right corner, highlighting the regular meshwork of vane filaments which extend past the edges of the map. (E–F) Tomographic slices emphasizing the basal body (BB) and collar microvilli (Co) (E) and the proximal region of the flagellum (shown in F). Cyan arrowheads denote vane filaments. (G–H) Tomographic reconstruction of a whole (not cryo-FIB milled) S. rosetta flagellum in longitudinal (G) and cross-sectional (H) views. Green brackets indicate a single 96 nm axonemal repeat, thousands of which were used to generate the subtomogram averages shown in Figure 3. Other labels: R, ring of dense material (MTOC); RM, rootlet microtubules. Scale bars: 2 μm (C); 1 μm (A, applies also to B); 500 nm (D); 200 nm (D inset; E, applies also to F; G, applies also to H).
Figure 3 with 2 supplements
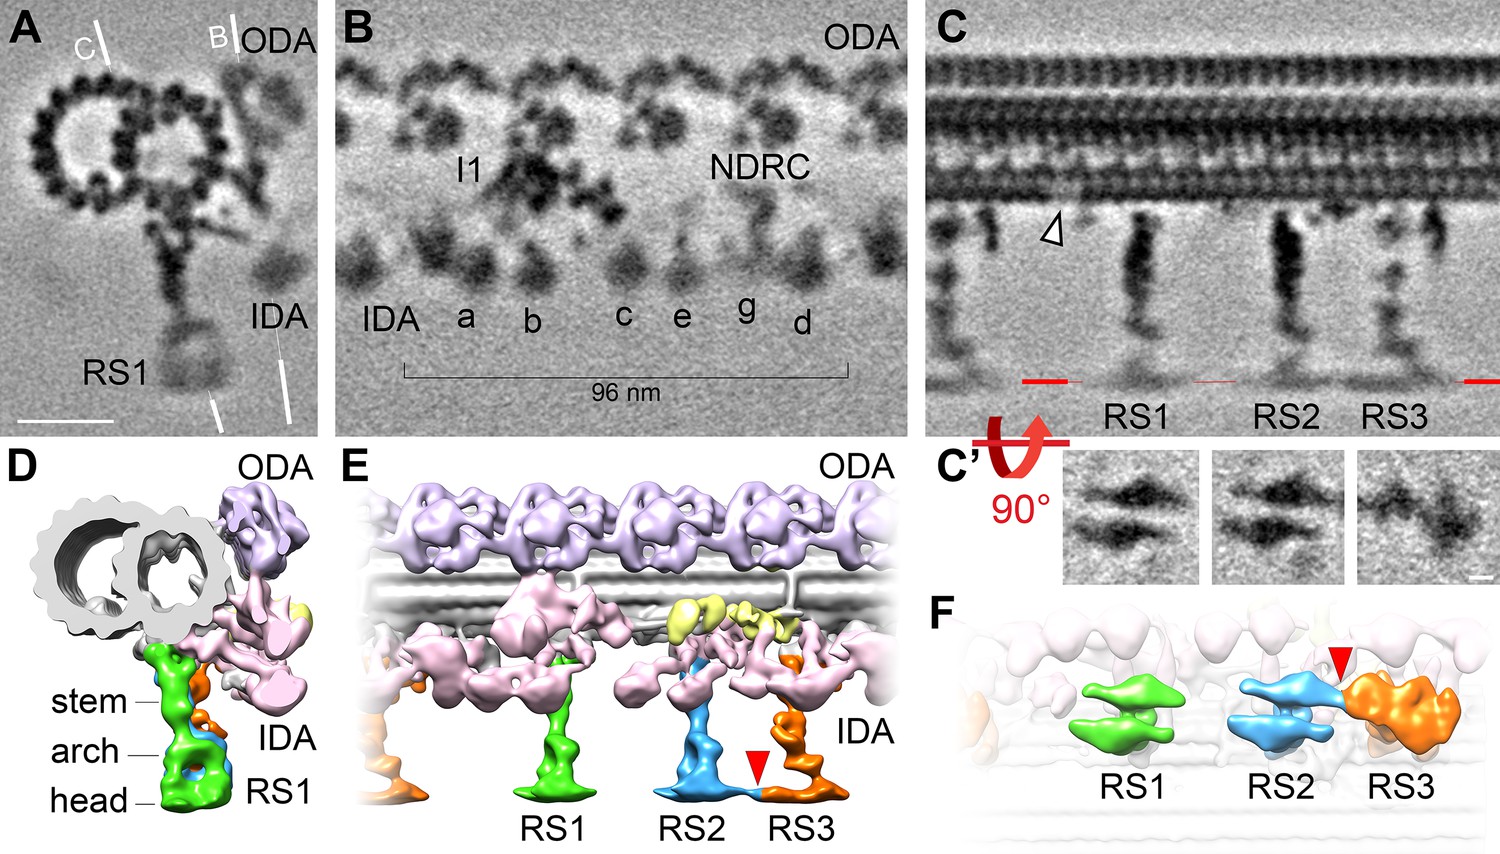
Cryo-ET of native choanoflagellate flagella reveals structural features of the 96 nm axonemal repeat.
(A–C) Cross-sectional (A) and longitudinal (B–C) slices through the subtomogram average of the S. rosetta flagellar doublet microtubule. The white lines in (A) indicate the positions of the slices shown in (B) and (C). The white arrowhead in (C) denotes a hole in the A-tubule; some blurring appears because the hole was not present in all averaged repeats (see classification in Figure 5). Resolution information and tomogram/particle numbers are in Figure 3—figure supplement 1 and Table 1. (C’) The radial spoke heads were blurred in the global subtomogram averages due to positional heterogeneity, therefore we performed local alignment refinements for each radial spoke head, which are displayed as viewed from the bottom. (D–F) Isosurface renderings of the averaged S. rosetta 96 nm axonemal repeat shown in cross-sectional (D), longitudinal (E), and bottom (F) views. Figure 3—figure supplement 2 includes additional information on DMT-specific features. Labels: outer dynein arms (ODA, lavender), inner dynein arms (IDA, a-e, g, pink), I1 dynein (I1, pink), nexin-dynein regulatory complex (NDRC, yellow), and radial spokes (RS1, 2, and 3, green, blue, and orange, respectively). Scale bars: 20 nm (A, applies to A-C); 5 nm (applies to all panels in C’).
Figure 3—figure supplement 1
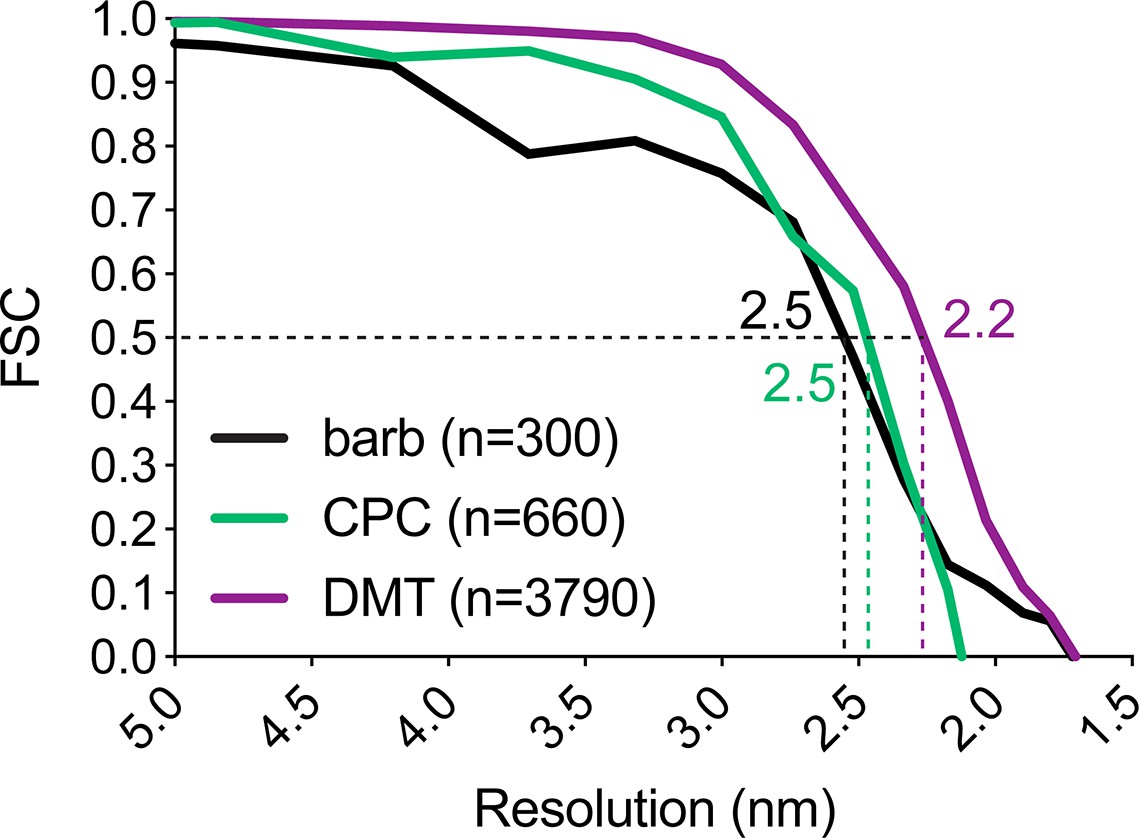
Resolution of averaged S. rosetta flagellar structures.
Resolution estimates for the barb average (black line) measured at its center, the central pair complex average (CPC, green line) measured at the base of C1a, and the 96 nm axonemal repeat (DMT, purple line) measured at the base of radial spoke 1 using the Fourier shell correlation method. Dotted lines and color-coded values indicate where the FSC curves intersect with the 0.5 criterion. Additional resolution information is listed in Table 1.
Figure 3—figure supplement 2
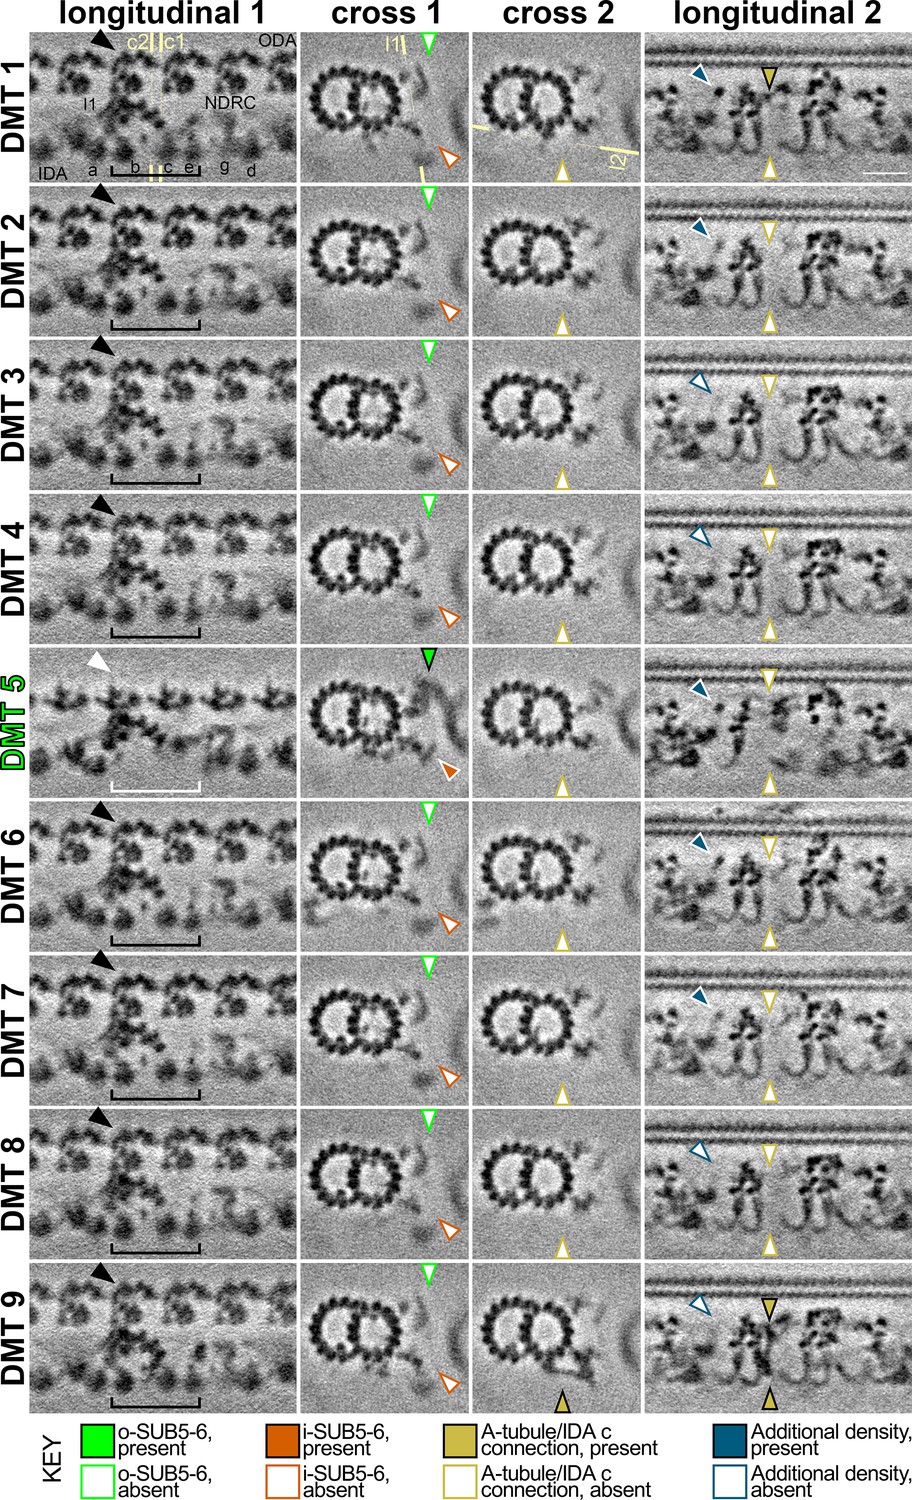
DMT-specific features in the S.rosetta flagellum.
Tomographic slices of the DMT-specific averages (from 54 tomograms, Table 1) show some features with asymmetric distribution. The column titled ‘longitudinal 1’ highlights the absence of outer and inner dyneins from DMT 5 (white arrowhead/bracket indicates absence, black arrowhead/bracket indicates presence of ODAs and selected IDAs), which are replaced by a bridge between DMTs 5 and 6 (called o-SUB5-6, white arrowhead). The yellow lines indicate the positions of cross-sections 1 and 2 (c1, c2), respectively. The column titled ‘cross 1’ highlights the presence (colored arrowheads) of the o-SUB5-6 (green) and i-SUB5-6 (orange) on DMT 5, whereas these features are absent in all other DMTs (white arrowheads). The column titled ‘cross 2’ highlights the presence (dark yellow arrowhead) of a unique connection between the A-tubule and the tail of IDAc only on DMT 9. The yellow line indicates the positions of slice shown in ‘longitudinal 2’. The column titled ‘longitudinal 2’ shows a bottom-up view of the unique connection between the A-tubule and the tail of IDA c on DMT 9 with a similar density in the upper part of DMT 1 (dark yellow arrowheads), which are absent from all other DMTs. An additional density (blue arrowheads) is also present or partially present on DMTs 1, 2, 5, 6, and 7, but only weakly present or absent from DMTs 3, 4, 8, and 9 (white arrowheads), corresponding to the area just beneath the A-tubule hole described in Figure 5. Scale bar: 20 nm (upper right panel, applies to all).
Figure 4

The flagellar structures of the unicellular choanoflagellate more closely resemble those of multicellular opisthokonts than unicellular organisms from other suprakingdoms.
Isosurface renderings of the 96 nm flagellar repeats from unicellular (top row) vs. multicellular (metazoan; bottom row) species. The summary on the bottom right highlights that the flagella of opisthokonts, including the unicellular/colonial S. rosetta, contain two dynein heads per ODA and reduced (R) radial spoke (RS) heads, whereas Tetrahymena (Alveolata) and Chlamydomonas (Archaeplastida) contain three dynein heads per ODA and broad-shaped (B) RS heads. The dynein heads in each ODA are indicated with black arrowheads and are pseudocolored in pale and darker purple, and in magenta where a third dynein is present, to help distinguish between ODAs with two or three dynein heads. Each organism contained one double-headed and six single-headed inner dynein arms (IDAs). The averaged axonemal structures from species other than S. rosetta were previously published (Lin et al., 2014).
Figure 5 with 3 supplements
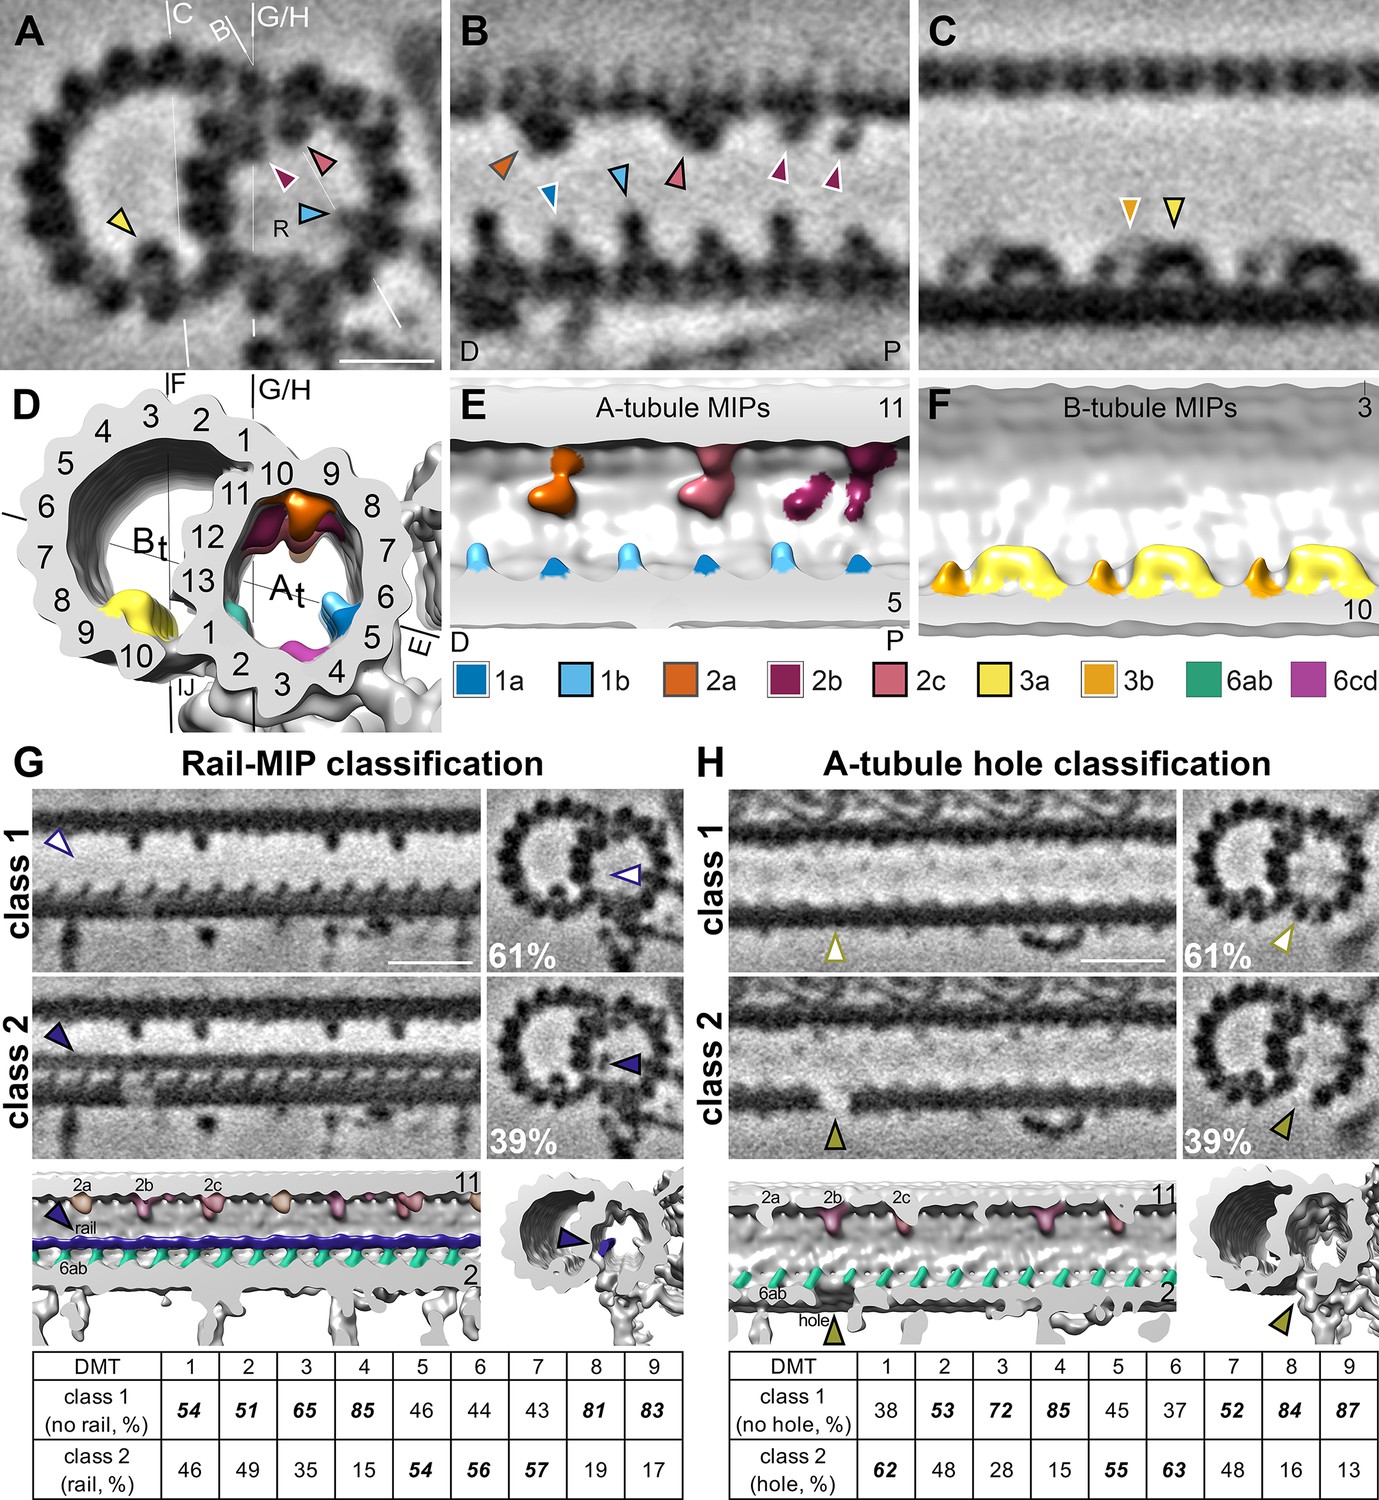
S. rosetta microtubule doublets contain unique holes and MIPs.
(A–F). Tomographic slices (A–C) and isosurface renderings (D–F) of the subtomogram average of S. rosetta doublet microtubules shown in cross (A, D) and longitudinal (B, C, E, F) section at the level of RS1. The white and black lines in (A) and (D), respectively indicate the viewing positions of the longitudinal slices in (B, C, and E-H). Note: panels (B and E) portray the distal (D) flagellum to the left, and the proximal (P) flagellum to the right. MIPs (and their corresponding arrowheads) are colored as indicated in the legend below panels (E/F). Because the MIPs repeat with a periodicity of 48 nm or less, only a 48 nm long segment of the 96 nm axonemal unit is shown. (G, H) Classification analyses focused on the region with the newly identified rail-MIP (G) and A-tubule hole (H) indicating their presence only in subsets of the axonemal repeats. Class 1 (top rows) lack the rail-MIP or A-tubule hole (empty arrowheads), whereas class 2 (bottom rows) contain the rail-MIP (navy blue arrowhead) or A-tubule hole (olive arrowhead), respectively. Percentages of repeats out of 7584 averaged particles are indicated for each class. The isosurface renderings highlight the position of the rail-MIP (navy blue) between protofilaments A1 and A13, adjacent to MIP 6ab (jade) (G), and of the A-tubule hole (olive arrowhead) in protofilament A2 (H). The tables show the doublet-specific distribution of the classes. Note: the rail-MIP and A-tubule hole distributions only partially overlap (Figure 5—figure supplement 1). Figure 5—figure supplement 2 indicates the presence of the rail-MIP in the proximal flagellum. Figure 5—figure supplement 3 shows two additional holes in the S. rosetta inner junction. Scale bars: 10 nm (A, applies also to B, C); 20 nm (G, applies to all other images in the panel); 20 nm (H, applies to all other images in the panel).
Figure 5—figure supplement 1
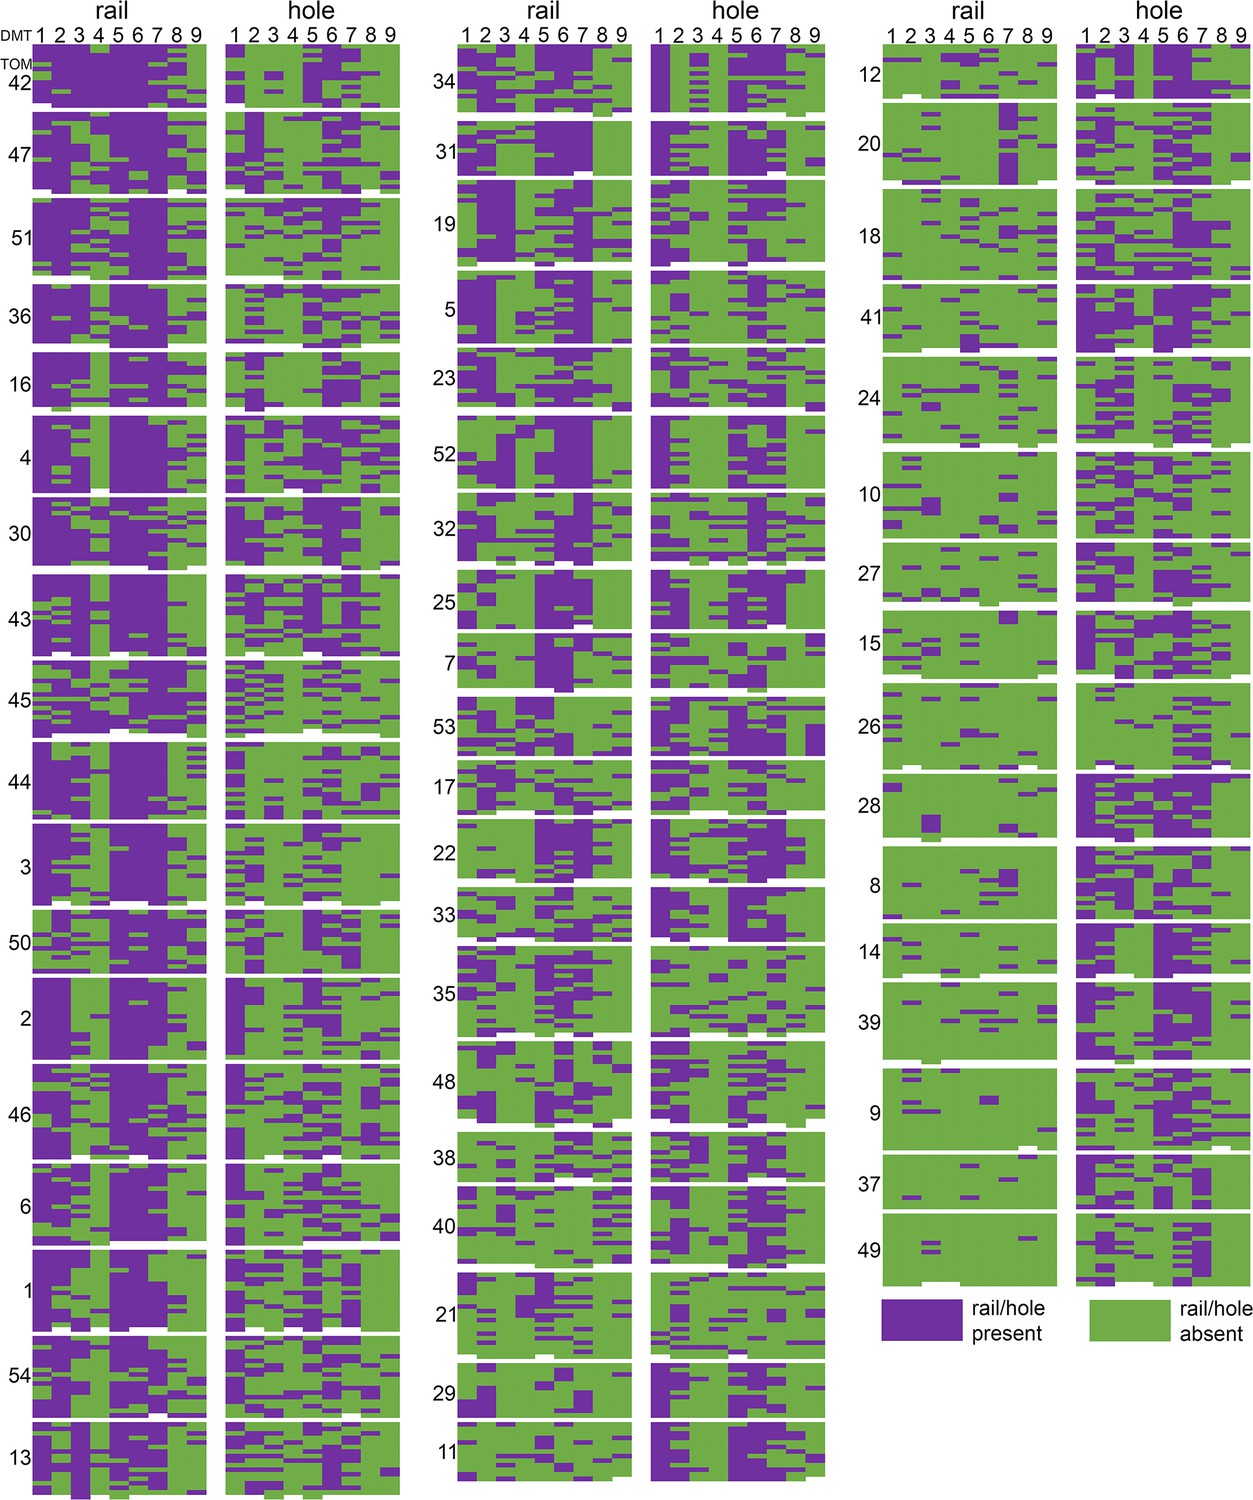
Distribution of rail-MIP and A-tubule hole classes by tomogram and doublet microtubule.
Each tomogram (TOM #) is represented by a block in which the columns indicate microtubule doublet (DMT1-9), and the rows represent individual 96 nm subvolumes within those DMTs, listed from distal (top) to proximal (bottom). For each tomogram, the rail-MIP classification results are displayed on the left, and the A-tubule hole classes are displayed on the right. Purple indicates the presence of either the rail-MIP or the A-tubule hole, whereas green denotes their absence. Rail-MIPs seem to be strongly present in certain tomograms (left), and almost completely absent in others (right). Holes, on the other hand, exhibit a more scattered distribution. Both features show some DMT-specificity or -preference, but there is only partial overlap between the presence/absence of a rail-MIP and A-tubule hole in the same subvolume.
Figure 5—figure supplement 2
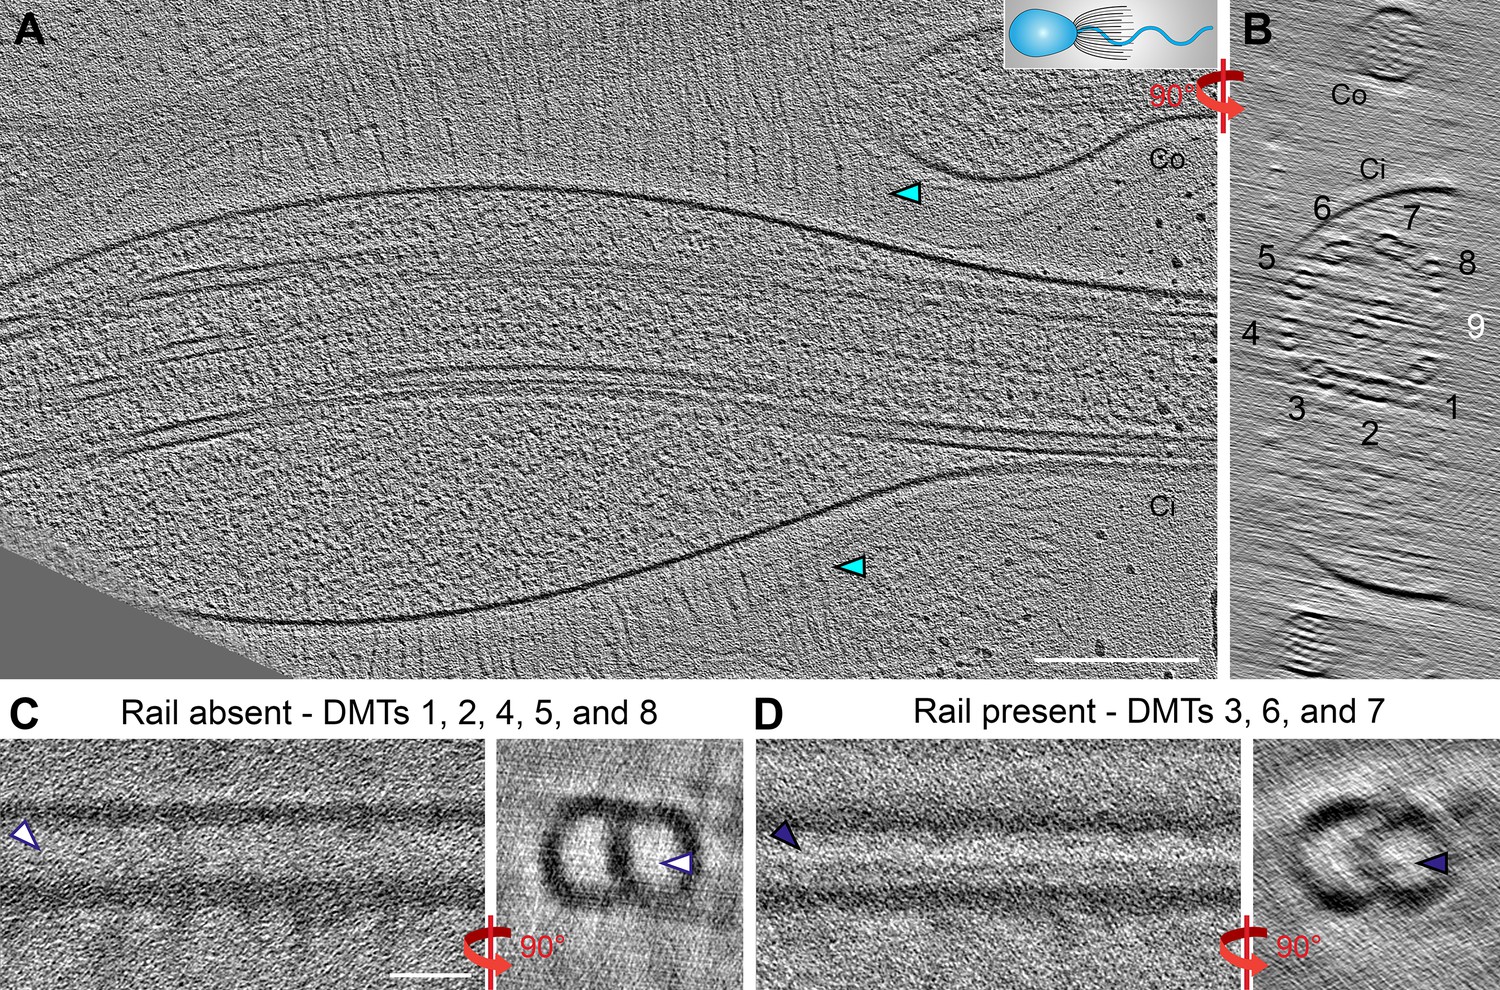
The rail-MIP is present in the proximal region of the S.rosetta flagellum.
(A–B) Longitudinal (A) and cross-sectional (B) tomographic slices through a cryo-FIB milled S. rosetta cell, targeting the proximal region of the flagellum close to the cell body. The cartoon in (A) denotes the cell’s orientation, with cell body to the left. Cyan arrowheads indicate vane filaments. Note: the flagellar membrane in this sample is slightly swollen, which is not unusual for cells that were actively swimming while they were plunge-frozen. DMT numbers are indicated, with DMT 9 in white to indicate its absence (the cryo-FIB-milling removed material from that side of the axoneme). (C, D) Two subtomogram averages of the 96 nm axonemal repeat were calculated from the tomogram shown in (A, B): in (C), repeats from DMTs 1, 2, 4, 5, and 8 were combined, showing an average that lacks the rail-MIP (white arrowheads), and in (D), repeats from DMTs 3, 6, and 7 were combined, showing the rail-MIP (navy blue arrowheads). Note: the doublet-specific averages shown here are noisy due to limited number of averaged particles. Scale bars: 200 nm (A, applies also to B); 20 nm (C, applies also to D).
Figure 5—figure supplement 3
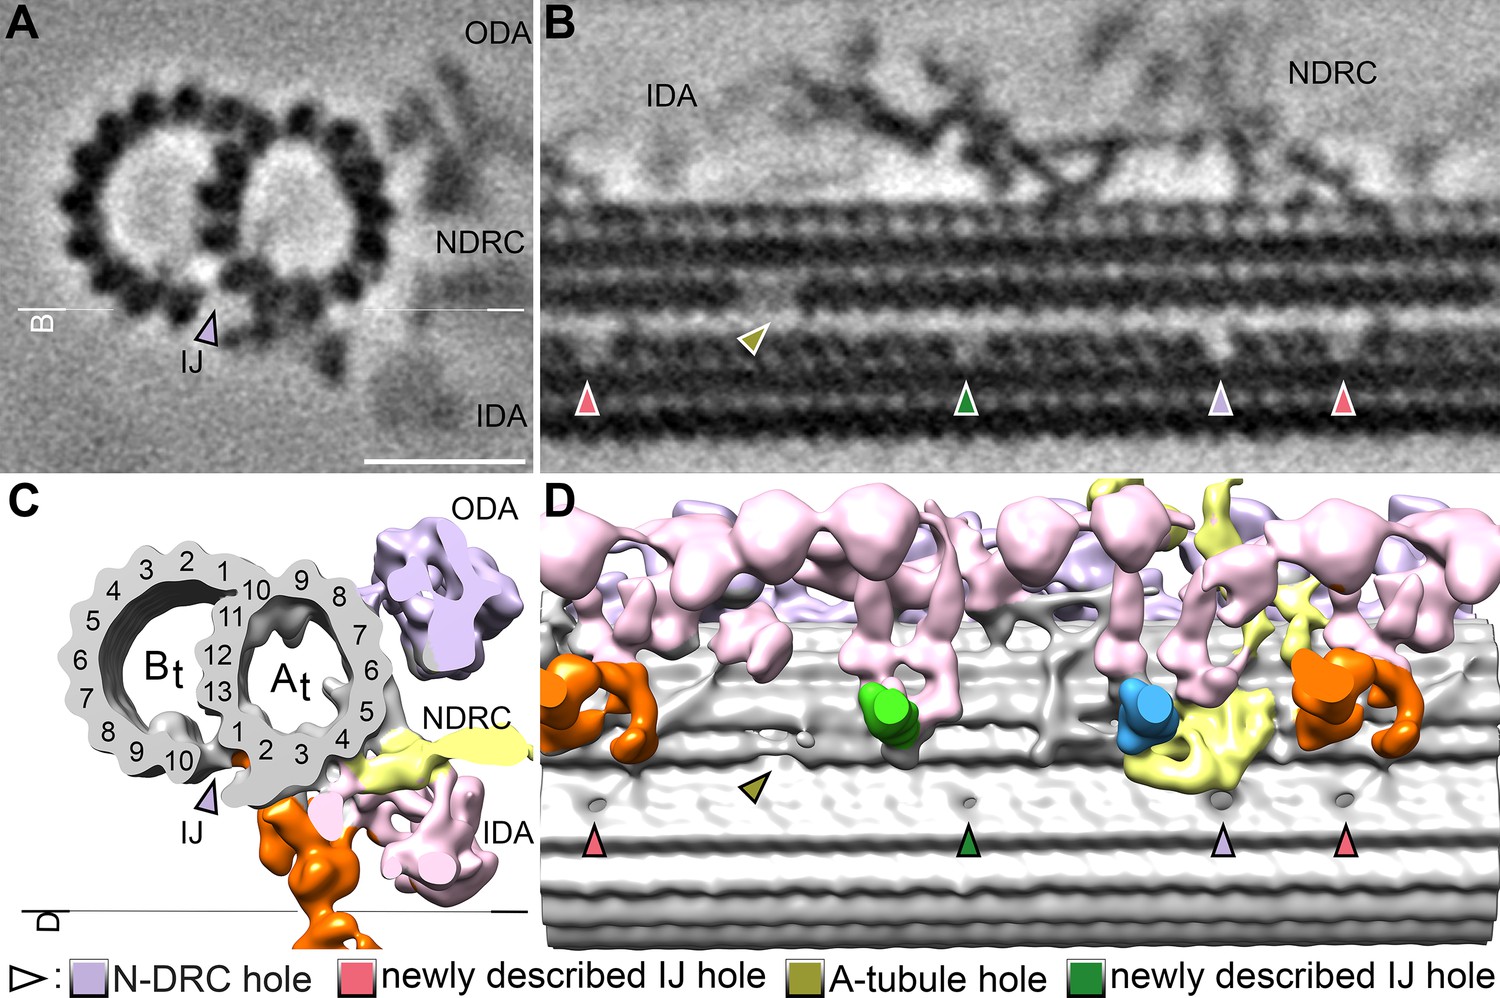
Additional holes in the doublet inner junction of the S.rosetta flagellum.
(A–B) Tomographic slices through the subtomogram average of the S. rosetta 96 nm axonemal repeat shown in cross-section (A) and longitudinal section (B). The white line indicates the location of the section shown in (B).(C–D) Isosurface renderings of the averages shown in (A, B). The black line indicates the view shown in (D). In all panels, the pale violet arrowheads indicate the previously reported hole near the N-DRC, the olive arrowheads indicate the A-tubule gap (see Figure 5 and Figure 5—figure supplement 1), and the green and pink arrows denote additional inner junction holes that have not been previously reported in other species. Other labels: IDA, inner dynein arms; NDRC, nexin-dynein regulatory complex; ODA, outer dynein arms. Scale bar: 20 nm (A, applies also to B).
Figure 6 with 2 supplements
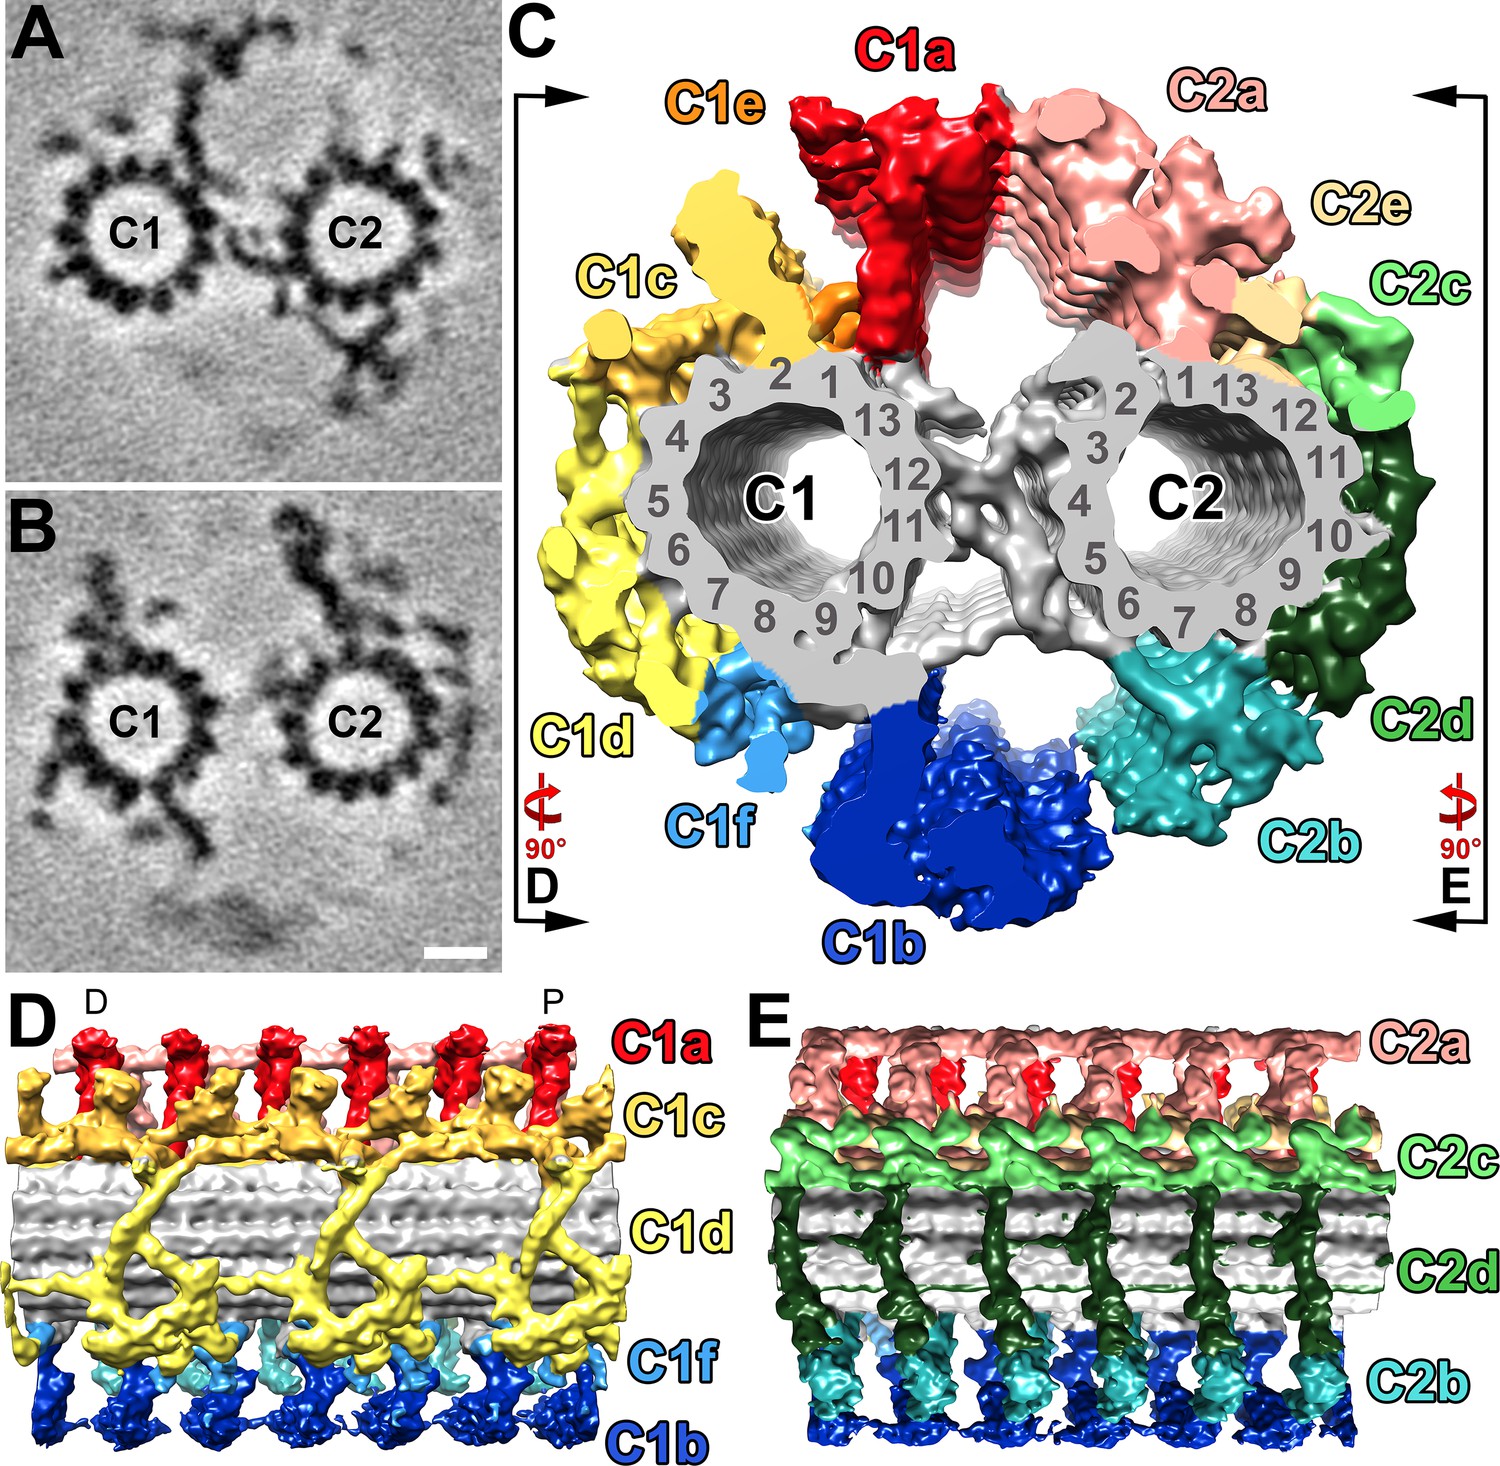
Structural features of the S.rosetta central pair complex.
(A–B) Tomographic slices at two different positions of the averaged S. rosetta CPC. The slice in (A) highlights CPC projections C1a, C2b, and the central bridge, whereas (B) highlights C1b-c, C2a, and C2c-e. Averages were generated using 1323 particles from 28 different tomograms (Resolution information in Figure 3—figure supplement 1 and Table 1). (C) Isosurface rendering of the averaged central pair complex; projection colors follow (Carbajal-González et al., 2013). Black lines and rotation arrows indicate the viewing directions of (D) and (E). (D–E) Isosurface renderings showing longitudinal side-views of the averaged S. rosetta CPC. Note: panel (D) is oriented with the distal side of the flagellum to the left, and proximal to the right (D and P, respectively). The orientation of the CPC in relation to the 5–6 bridge, vane, and barb structures is shown in Figure 6—figure supplement 1. Additional species comparisons are provided in Figure 6—figure supplement 2. Scale bar: 10 nm (B, applies also to A).
Figure 6—figure supplement 1
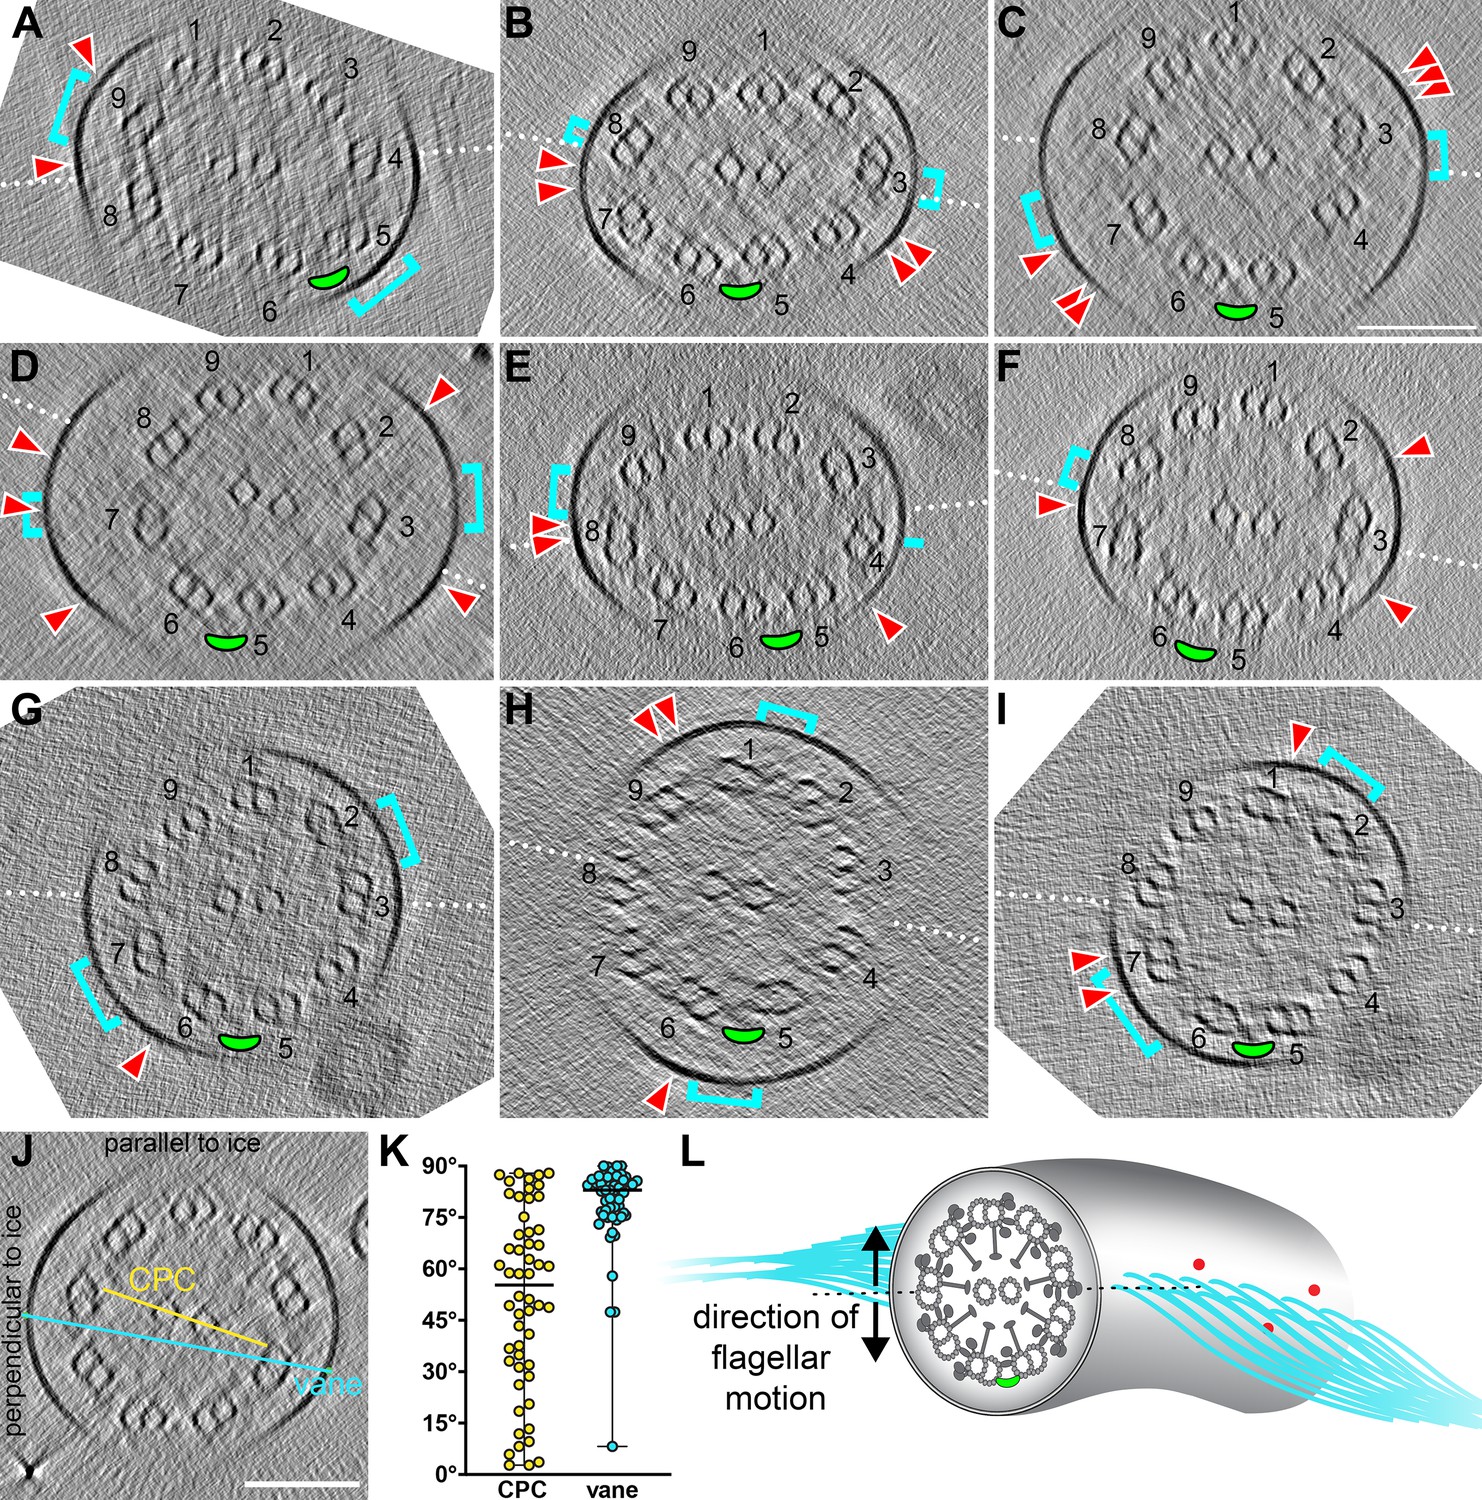
Relative orientation of CPC to DMTs and extra flagellar features.
(A–I) Tomographic slices through individual S. rosetta flagella shown in cross-section. The white dotted lines indicate the CPC plane (i.e. the plane that contains both CPC microtubules). DMTs are labeled (1-9), with the 5–6 bridge highlighted with a green ellipse. The cyan brackets indicate the position on the membrane where vane filaments protrude, and the red arrowheads indicate the position of barbs (within ~315 nm model depth). (J–K) The angle of the CPC (yellow) and vane (cyan) were measured relative to the ice layer (J) and plotted (K). Black horizontal lines indicate the median values. (L) Schematic representing the likely orientation of the CPC, 5–6 bridge (green ellipse), vane (cyan filaments), and barbs (red) in relation to the direction of flagellar motion (black arrows). Scale bar: 100 nm (C, applies to A-I; J).
Figure 6—figure supplement 2
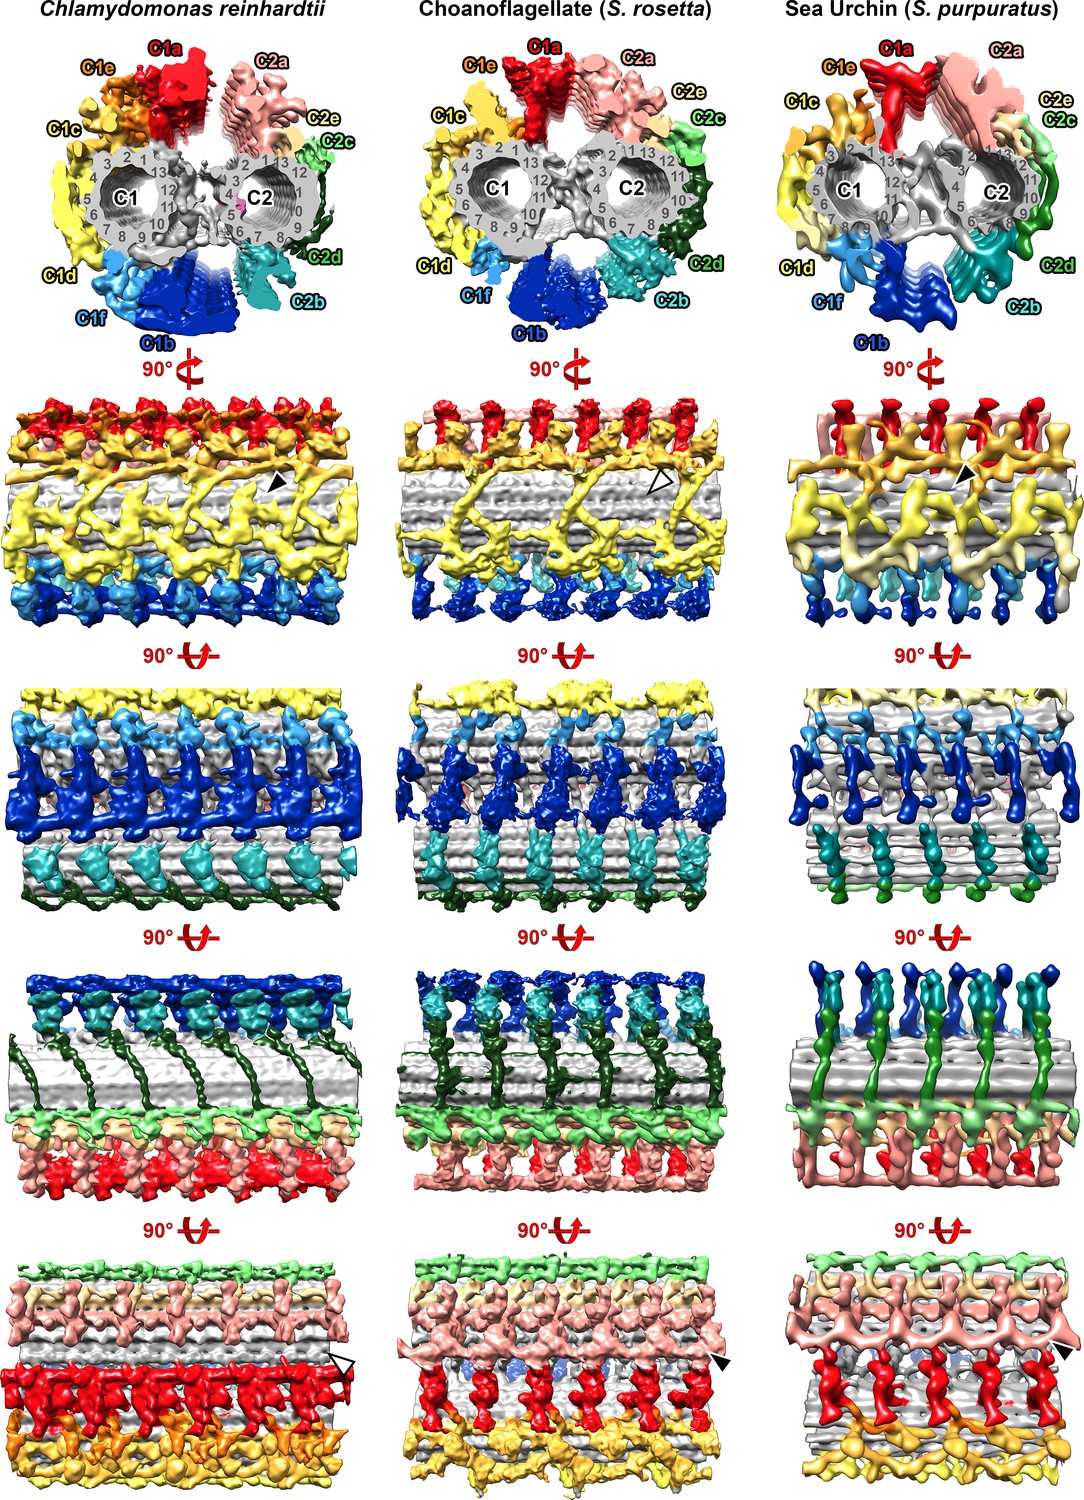
Evolutionary comparison of the central pair complex between Chlamydomonas reinhardtii, choanoflagellate (S.rosetta), and sea urchin (S. purpuratus).
Isosurface renderings are viewed in cross-section from proximal (top row) and rotated to generate the longitudinal views as indicated. Black and white arrowheads represent the presence and absence of indicated structures, respectively. The Chlamydomonas and sea urchin (S. purpuratus) data were previously published with EM Data Bank accession codes EMD-20160 and EMD-9385, respectively (Carbajal-González et al., 2013; Fu et al., 2019).
Figure 7 with 1 supplement
S. rosetta cells have a flagellar vane and adjacent barb structures.
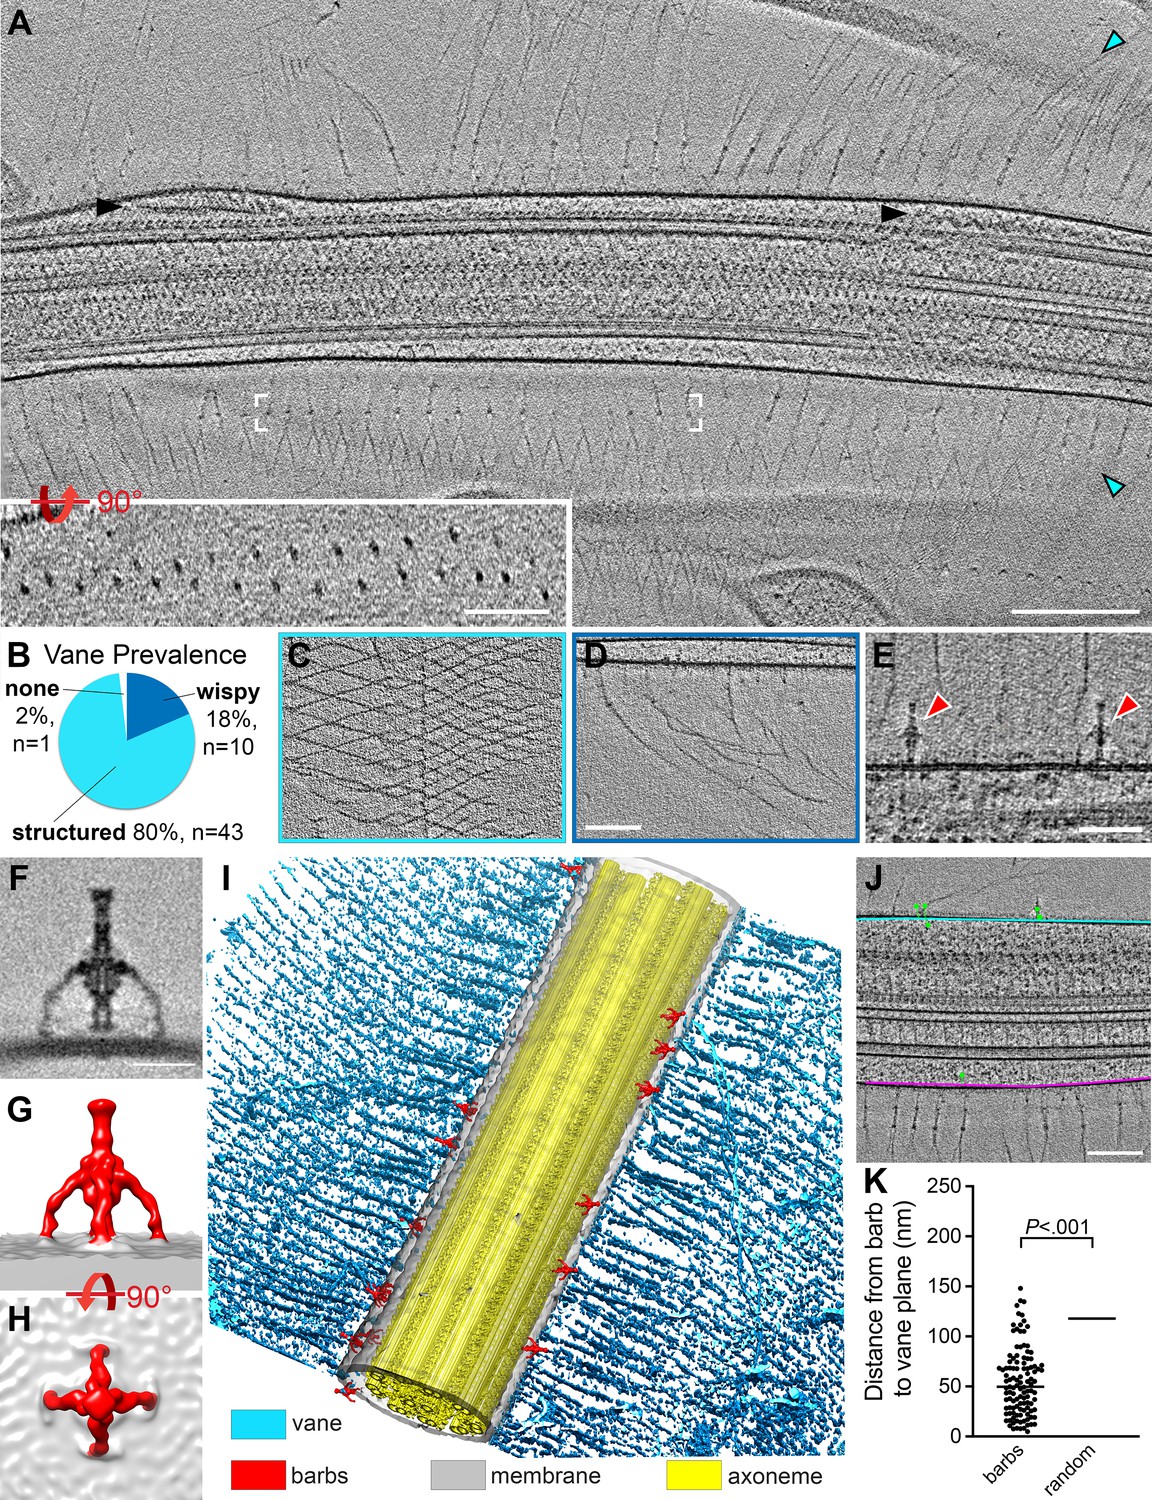
(A) Tomographic slice through a representative flagellum showing bilateral vane filaments (cyan arrowheads) extending from the flagellar membrane. Black arrowheads denote IFT trains. White brackets mark the region shown in the rotated inset, which shows that the vane is a bilayer of thin filaments with semi-regular spacing. (B-D) Most tomograms contained vane filaments with regular patterning (“structured”, light blue color in (B), example tomographic slice shown in (C)), whereas a smaller proportion contained only individual “wispy” hairs (dark blue color in (B), example tomographic slice shown in (D)). Of the 54 tomograms included in our analyses, only one did not contain vane filaments. (E) Tomographic slice showing two barb structures (red arrowheads), approximately 50 nm in height that protrude from the flagellar membrane near the plane of the vane filaments (cyan arrowheads). (F-H) Tomographic slice (F) and isosurface renderings (G, H) show side (F, G) and top (H) views of the averaged barb structures (red, 4x symmetrized, 600 particles). (I) Compiled isosurface rendering of the S. rosetta flagellum, indicating positions of the vane (cyan) and barbs (red) relative to the flagellar membrane (gray); the axoneme is shown in yellow. (J) Tomographic slice through a flagellum; the bases of the vane filaments are marked in cyan and pink representing the vane planes; the green dots correspond to the centers of the barb structures in this region (note: the model thickness encompasses the entire flagellum, so most of the barbs themselves are not visible in the tomographic slice, except for the top-right barb). Green lines connect the barb particle to the vane plane with the shortest possible 3D distance (calculated using the mtk function in IMOD). The barb angles cause some to appear inside the membrane, though rotating the model would show that they are indeed protruding externally. (K) Quantification of the distances between the barb base to the nearest vane plane for 115 barb particles within 13 tomograms. The black, horizontal lines indicate the median values for the barbs (50 nm, left) compared to a ‘random’ distribution, which assumes equal likelihood of the barbs being located at any given point around the flagellar circumference (115 nm, right. Individual data points are not shown due to their high number and regular distribution). p=2x10-17. Figure 7—figure supplement 1 shows vane filaments and barbs on the plasma membrane within the flagellar pocket, but not on the surface of E. pacifica (bacterial prey). Scale bars: Scale bars: 200 nm (A and inset); 100 nm (D, applies also to C); 50 nm (E); 20 nm (F); 100 nm (J).
Figure 7—figure supplement 1
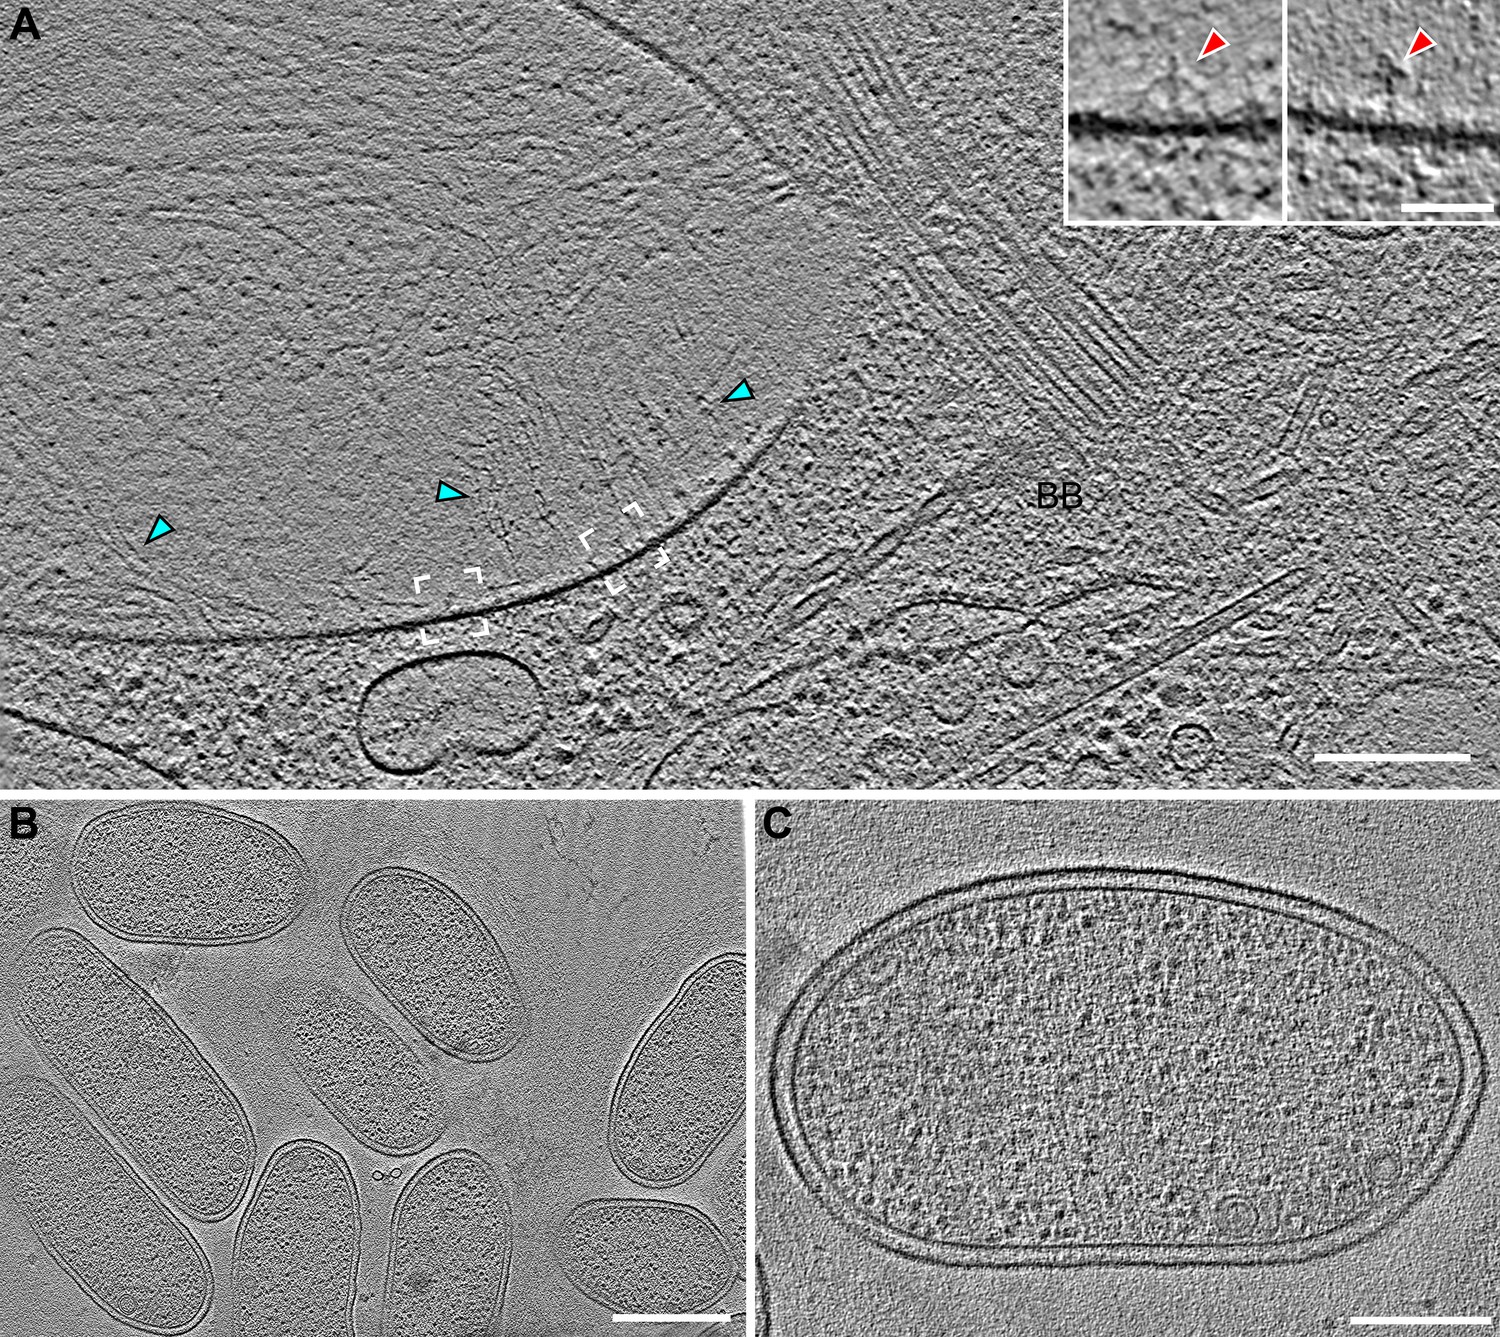
Vane filaments and barb-like structures are found in the flagellar pocket of S.rosetta, but not on or in the co-cultured bacterial prey cells.
(A) Tomographic slice through a cryo-FIB milled flagellar pocket/basal body region of a S. rosetta cell showing vane filaments (cyan arrowheads) attached to the plasma membrane in the flagellar pocket, which is separated from the flagellar membrane by a selective gating mechanism. White brackets denote positions of insets (left and right brackets correspond to left and right insets, respectively), which were slightly rotated to highlight the barb-like structures within the plasma membrane. (B, C) Representative tomographic slices through E pacifica bacteria, which are co-cultured with S. rosetta as a food source, showing smooth membranes that lack vane filaments and barb structures. Scale bars: 200 nm (A); 50 nm (A inset); 500 nm (B); 200 nm (C).
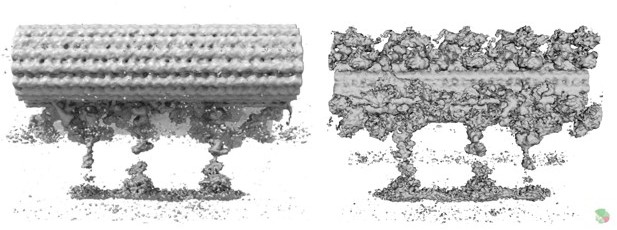
Author response image 1
Tables
Table 1
Summary of data included in this study.
| Specimen | Tomograms included | Averaged repeats | Resolutionat 0.5 Fourier shell correlation criterion (nm) | Resolution at 0.143 Fourier shell correlation criterion (nm) | Used in Figure(s) |
|---|---|---|---|---|---|
| S. rosetta slow/fast swimmers* | 54 | 7584 | 2.2 | 1.8 | 3, 4, 5 |
| Central Pair Complex† | 28 | 1323 | 2.5 | 2.2 | 6 |
| Barb structures (with 4-fold symmetry)‡ | 17 | 600 | 2.5 | 2.2 | 7 |
-
*
Resolution was estimated at the base of RS1 from a 64 voxel subvolume.
-
†
Resolution was estimated at the central portion of the barb from a 64 voxel subvolume.
-
‡
Resolution was estimated at C1a from a 32 voxel subvolume.
Additional files
Download links
A two-part list of links to download the article, or parts of the article, in various formats.
Downloads (link to download the article as PDF)
Open citations (links to open the citations from this article in various online reference manager services)
Cite this article (links to download the citations from this article in formats compatible with various reference manager tools)
Three-dimensional flagella structures from animals’ closest unicellular relatives, the Choanoflagellates
eLife 11:e78133.
https://doi.org/10.7554/eLife.78133


