The orphan ligand, activin C, signals through activin receptor-like kinase 7
- Department of Molecular Genetics, Biochemistry, and Microbiology, University of Cincinnati, United States
- Department of Pharmacology and Therapeutics, Centre for Research in Reproduction and Development, McGill University, Canada
- Merck &Co., Inc., United States
Figures
Figure 1 with 1 supplement
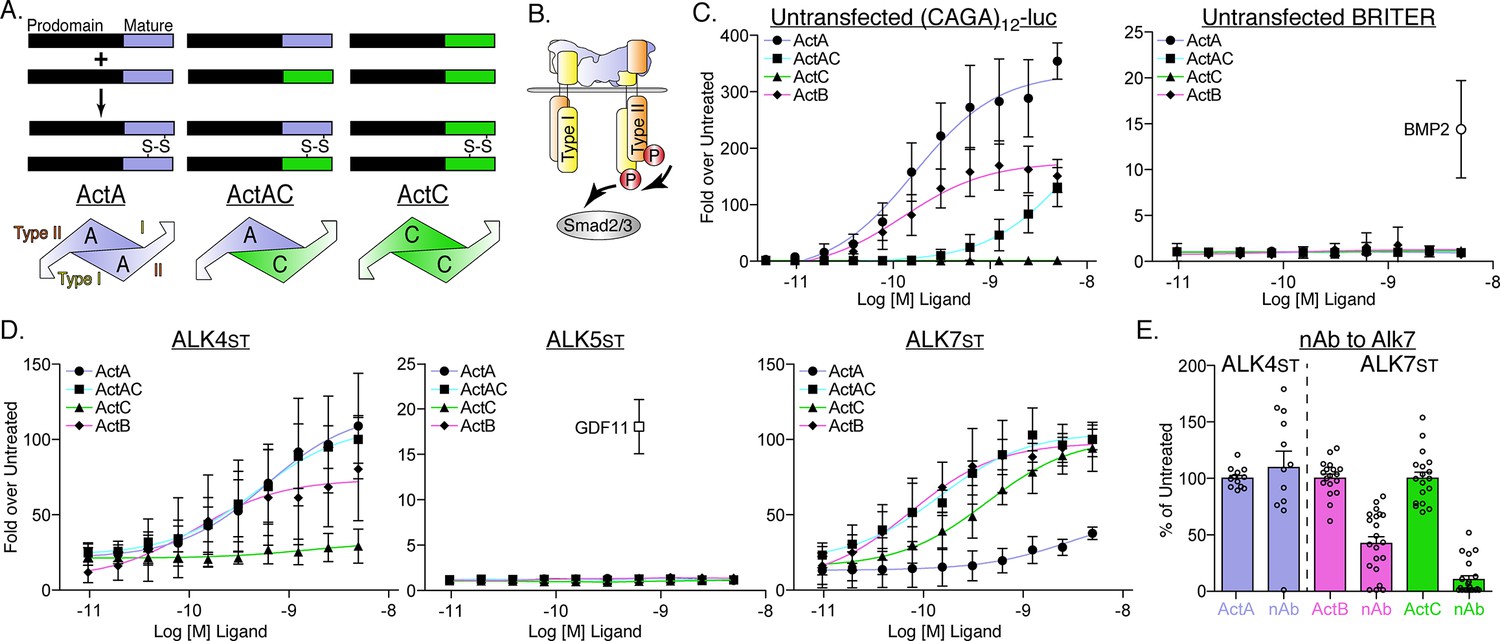
Differences in type I receptor utilization by ActA, ActAC, and ActC.
(A) Schematic displaying formation of activin A (ActA), activin AC (ActAC), and activin C (ActC) from dimerization of inhibinβA (blue) and inhibinβC subunits (green). (B) Generalized TGFβ signaling schematic displaying activin-SMAD2/3 signaling with type II (orange) and type I (yellow) receptor binding positions displayed for ActA. (C) Luciferase reporter assay in response to ActA, ActAC, or ActC titration in untransfected (CAGA)12-luciferase (luc) or BRITER HEKT cells. BMP2 was included as a positive control for the BRITER reporter. (D) ActA, ActAC, ActC, and ActB activation of (CAGA)12-luc HEK293T cells transfected with SB-431542-resistant (Ser to Thr, ST) type I receptors. In (C) and (D), each data point represents the mean ± SD of triplicate experiments measuring relative luminescence units (RLU). ALK4st and ALK7st transfection assays in (D) were normalized to 100-fold from mean of highest point. EC50 values are reported in Supplementary file 1. (E) Effects of an ALK7 neutralizing antibody (nAb) on ActA, ActB, and ActC induction of (CAGA)12-luc activity in cells expressing the indicated type I receptors. In (E), each data point represents a technical replicate within triplicate experiments with bars displaying the mean ± SD. In both (D) and (E), cells were treated with 10 μM SB-431542 to inhibit signaling activity of endogenous receptors.
Figure 1—figure supplement 1

Luciferase reporter assay displaying activin C (ActC) titration against constant activin A (ActA) (0.62 nM) in untransfected (CAGA)12-luciferase (luc).
Each data point represents the mean ± SD of triplicate experiments measuring relative luminescence units (RLU).
Figure 2 with 2 supplements
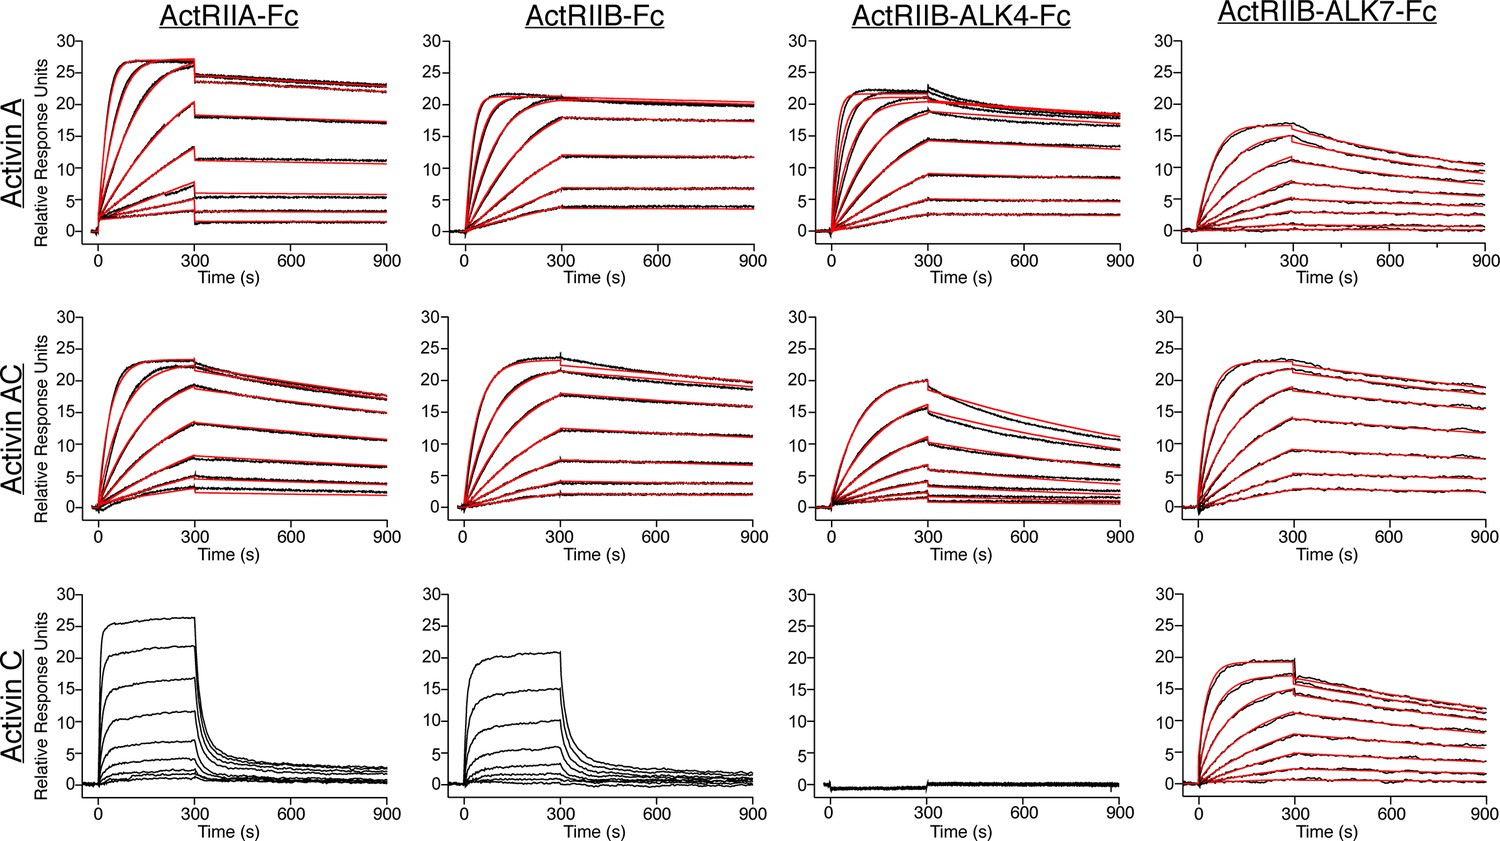
ActC binds activin type II receptors with low affinity.
Representative surface plasmon resonance (SPR) sensorgrams of activin A (ActA), activin AC (ActAC), and activin C (ActC) binding to protein A captured ActRIIA-Fc, ActRIIB-Fc, ActRIIB-ALK7-Fc, or ActRIIB-ALK4-Fc. Sensorgrams (black lines) are overlaid with fits to a 1:1 binding model with mass transport limitations (red lines). ActC binding to ActRIIA and ActRIIB were fit using a steady state model. Each experiment was performed in duplicate with the kinetic parameters summarized in Supplementary file 2.
Figure 2—figure supplement 1
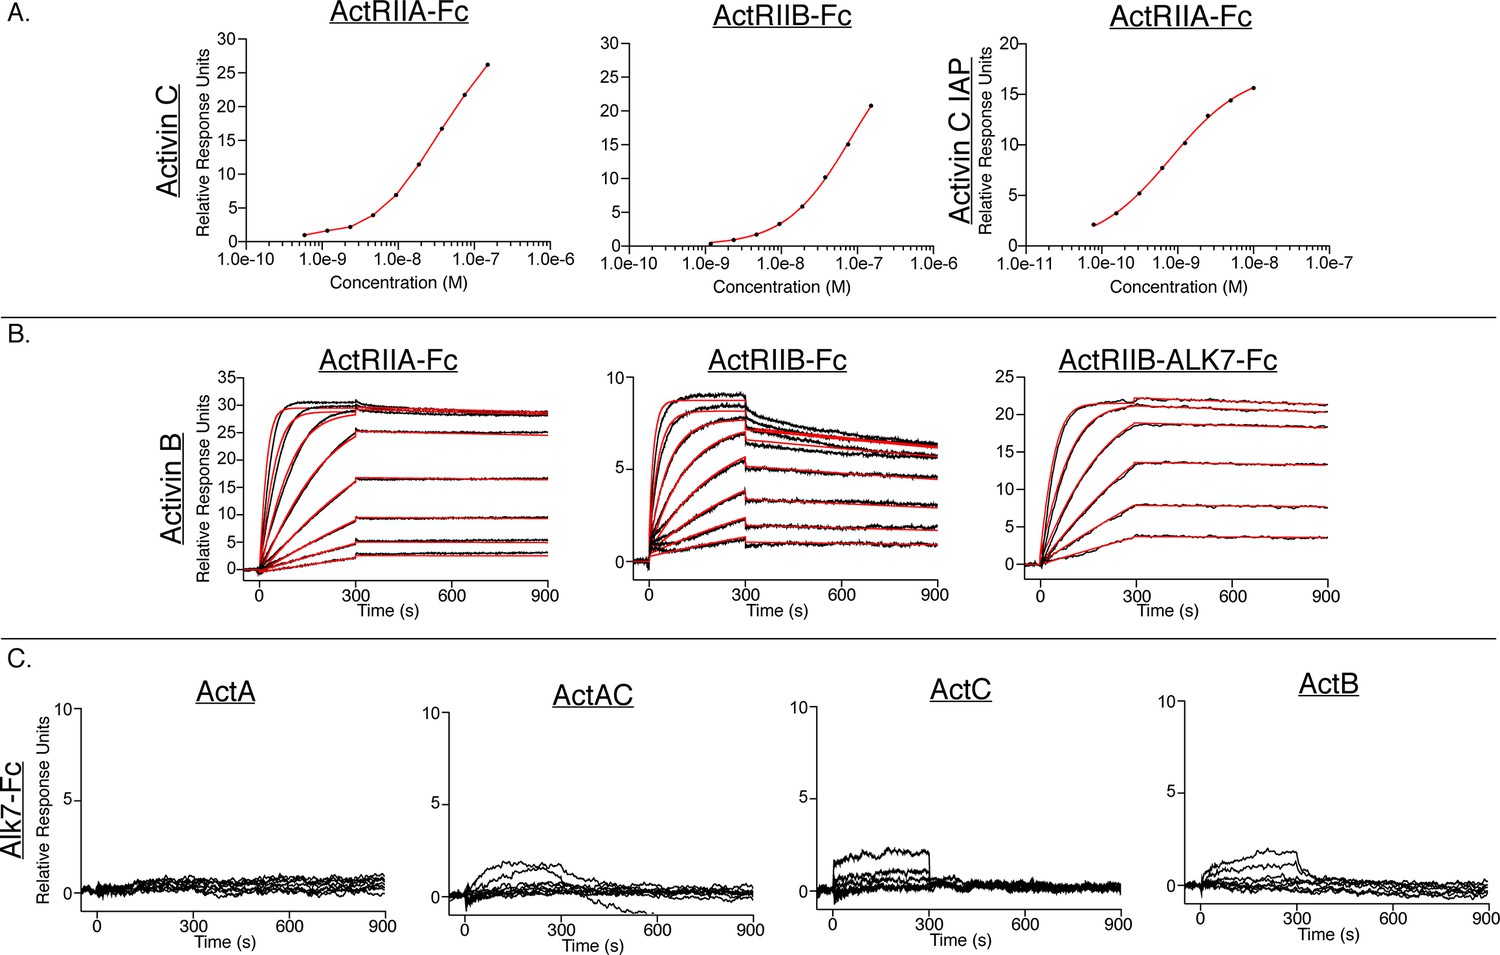
Additional surface plasmon resonance (SPR) sensorgrams of ActA, ActAC, and ActC binding to Alk7 and ActB binding to different receptors.
(A) Steady state analysis of the following experiments in Figure 2: activin C (ActC) binding to captured ActRIIA-Fc and ActRIIB-Fc and Figure 5F: ActC IAP binding to ActRIIA-Fc. (B) Representative SPR sensorgrams of activin B (ActB) binding to protein A captured ActRIIA-Fc, ActRIIB-Fc, or ActRIIB-ALK7-Fc. Sensorgrams (black lines) are overlaid with fits to a 1:1 binding model with mass transport limitations (red lines). (C) Representative SPR sensorgrams of activin A (ActA), activin AC (ActAC), ActC, and ActB with Alk7-Fc captured on a protein A chip. Each experiment was performed in duplicate with the kinetic parameters, if available, summarized in SI appendix Supplementary file 2.
Figure 2—figure supplement 2

Native gel analysis of type II receptors and ActA, ActAC, and ActC.
Native PAGE analysis of ActRIIA (A) and ActRIIB (B) with activin A (ActA) and activin AC (ActAC). Binary complexes were formed by titrating receptor from 1:1 to 3:1 molar ratio against constant ligand. (C) Native PAGE analysis of 1:3 receptor: ligand molar ratio with activin C (ActC).
Figure 3
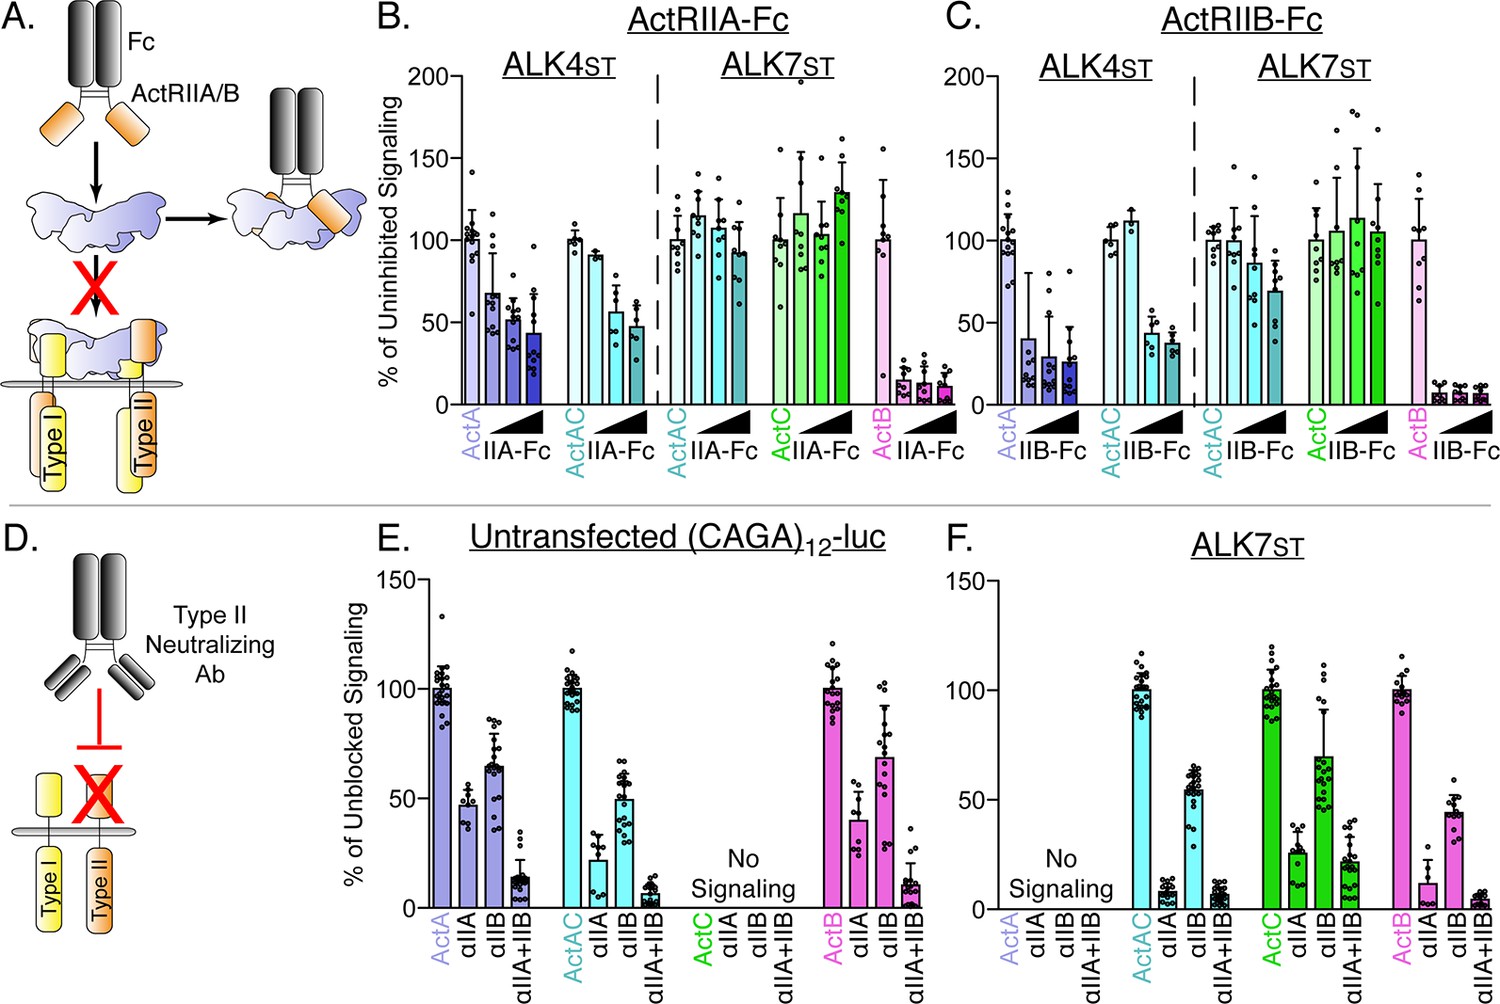
ActA and ActAC signal via activin type II receptors.
(A) Schematic representation of activin type II receptor Fc-fusion proteins as decoys. (B and C) HEK293T (CAGA)12-luciferase (luc) cells were transfected with ALK4st and ALK7st and treated with SB-431542 and activin A (ActA), activin AC (ActAC), activin (ActC), or activin B (ActB) (0.62 nM) as in Figure 1 in the presence of increasing quantities of either ActRIIA-Fc (B) or ActRIIB-Fc (C). (D) Schematic representation of neutralizing antibodies targeting the type II receptor extracellular domains (ECDs). (E and F) HEK293T (CAGA)12-luc cells following treatment with ActA, ActAC, ActC, or ActB (0.62 nM) in the presence or absence of neutralizing antibodies targeting ActRIIA, ActRIIB, or both. No signaling was observed by ActC in (E) or ActA in (F). Each data point represents technical replicates within triplicate experiments measuring relative luminescence units (RLU) with bars displaying the mean ± SD. Data are represented as percentage of uninhibited (B and C) or unblocked (E and F) signal.
Figure 4

Activin C is resistant to inhibition by follistatin but not inhibin A.
(A) HEK293T (CAGA)12-luciferase (luc) cells were transfected with ALK4st and ALK7st and treated with SB-431542 and activin A (ActA), activin AC (ActAC), activin C (ActC), or activin B (ActB) (0.62 nM) with increasing quantities (12.5 nM or 25 nM) of either follistatin-288 (Fst-288) (A) or follistatin-like 3 (Fstl3) (B). (C) Luciferase assay following treatment with either ActA (ALK4st signaling) or ActC (ALK7st signaling) at a constant concentration (0.62 nM) along with titration of inhibin A (InhA). Each data point represents technical replicates within triplicate experiments measuring relative luminescence units (RLU) with bars displaying the mean ± SD. Data are represented as percentage of uninhibited. IC50 values are reported in Supplementary file 1.
Figure 5

Type II interface of ActC is distinct from other activins.
(A) Sequence alignment across the activin class displays critical differences at the canonical type II receptor binding site. IAP motif is boxed in black. (B) Structure and schematic representation of the ActA/ActRIIB/ALK4 complex (PDB: 7OLY). ALK4 is in yellow, ActRIIB is in orange, activin A (ActA) is in blue. (C) Comparison of type II receptor interface between ActA/ActRIIB and the ActC/ActRIIB model, centered on the IAP (ActA) and IQP (activin C [ActC]) motifs. The ActC model was built from (PDB:7OLY) (Thompson et al., 2005). (D) Comparison (left) of the Fst-288 interface between ActA/Fst-288 (PDB:2BOU) and the ActC/Fst-288 model, centered on the IAP (ActA) and IQP (ActC) motifs. Schematic of ActA/Fst-288 included (right) for clarification. (E) ALK7st-dependent luciferase assay following treatment with ActC purchased from R&D systems, or recombinant ActC wildtype (WT) (IQP) or ActC Gln267Ala (IAP) transiently produced in HEK293T cells. Each data point represents the mean ± SD of triplicate experiments measuring relative luminescence units (RLU). EC50 values are reported in Supplementary file 1. (F) Average surface plasmon resonance (SPR) sensorgrams of ActC WT (IQP) and ActC Gln267Ala (IAP) binding to protein A captured ActRIIA-Fc or ActRIIB-Fc. Sensorgrams (black lines) are overlaid with fits to a 1:1 binding model with mass transport limitations (red lines). Each experiment was performed in duplicate. (G) ALK7st-dependent luciferase reporter assay following treatment of ActC WT (IQP) and ActC Gln267Ala (IAP) (0.62 nM) with increasing concentrations (12.5 nM or 25 nM) of either Fst-288 or Fstl3. Each data point represents technical replicates within triplicate experiments measuring relative luminescence units (RLU) with bars displaying the mean ± SD.
Figure 6 with 1 supplement

ActC activates SMAD2 through ALK7 in differentiated adipocytes.
(A) Representative images of isolated adipose-derived stromal vascular fraction (SVF) or cultured 3T3-L1 cells prior to differentiation (left, Day-0) and following differentiation (right, Day-10). Scale bars are 20 µm. Schematic shown in upper right for visualization of timeline. (B) Western blot (WB) showing phosphorylated SMAD2 (pSMAD2) and total SMAD2/3 in 3T3-L1-derived adipocytes following treatment with activin A (ActA), activin B (ActB), or activin C (ActC) (2 nM) for 1 hr. (C) WB following treatment of SVF-derived adipocytes with ActB or ActC (2 nM) with or without Fst-288 (800 ng/ml) for 1 hr. (D) Quantitative PCR (RT-qPCR) of Acvr1c expression in differentiated 3T3-L1 cells and SVF adipocytes. Bars display mean ± SD of three experimental replicates. (E) WB following treatment of SVF-derived adipocytes with ActB or ActC (2 nM) in the presence or absence of a neutralizing antibody targeting ALK7 for 1 hr. (F) Representative images of SVF-derived adipocytes following treatment with ActA, ActB, or ActC during differentiation with or without Fst-288. (G) RT-qPCR of target genes Pparg2, Cebpa, and Pnpla2 following treatment with ActA, ActB, or ActC during differentiation. Oil Red O quantification based on images in (F). Significance is represented as: * p<0.05, ** is p<0.01, *** p<0.001 and **** p<0.0001. Each experiment was performed in triplicate. While representative westerns are shown, supplemental westerns can be found in Figure 6—figure supplement 1.
Figure 6—figure supplement 1

Supplemental adipocyte-pSMAD2/SMAD2/3 western blots.
Supplemental westerns for representative blots shown in Figure 6. Boxes are drawn to display which data were used for figure generation. Antibodies used: pSMAD2 (cell signaling, 138D4) and SMAD2/3 (millipore, 07–408).
Figure 7 with 3 supplements
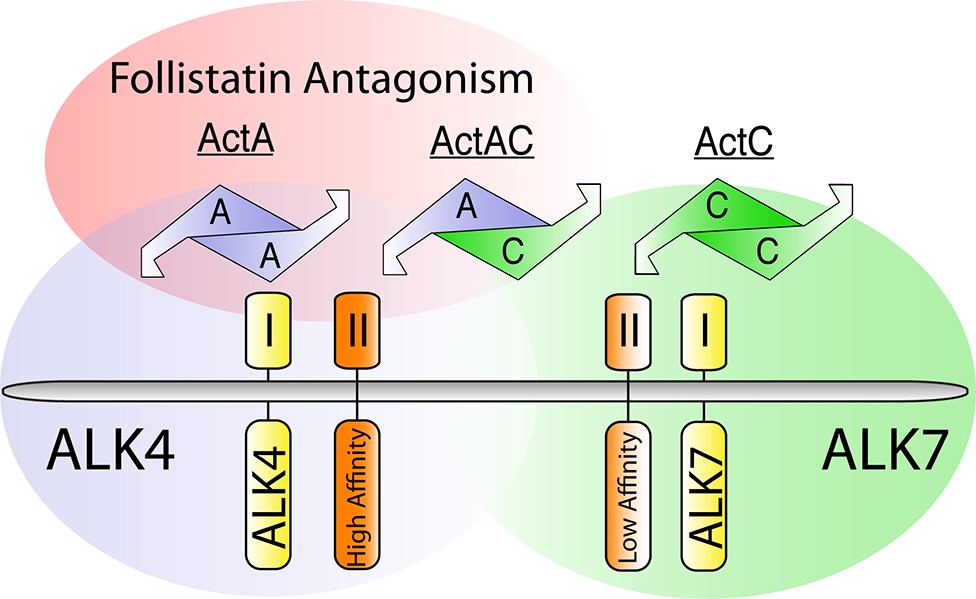
Difference between ActA and ActC in type I receptor specificity, type II receptor affinity, and follistatin antagonism.
Gradients of follistatin antagonism (red), activin receptor-like kinase 4 (ALK4)-dependent signaling (blue), activin receptor-like kinase 7 (ALK7)-dependent signaling (green), and activin type II receptor affinity (orange) for activin A (ActA), activin AC (ActAC), and activin C (ActC). Ligands and type I receptors are shown schematically.
Figure 7—figure supplement 1

Sequence alignment of activin and TGFβ ligands.
Sequence comparison of the mature ligand for human activin subclass (activin A [ActA], activin B [ActB], activin C [ActC], activin E [ActE], GDF8 and GDF11), TGFβ1, TGFβ2, and TGFβ3. Numbering includes the signal sequence and prodomain (not shown). Fingertip residues are boxed in red. The conserved IAP motif is highlighted with a black box. Secondary structure elements are represented as arrows or cylinders for β-strands and α-helices, respectively. Disulfide bonds are boxed in yellow.
Figure 7—figure supplement 2

Modeling ActC/ALK7 interactions.
Comparison of the fingertip interface between activin A (ActA)/activin receptor-like kinase 4 (ALK4) (PDB:7OLY) and models of ActA/activin receptor-like kinase 7(ALK7), activin C (ActC)/ALK4, and ActC/ALK7. The ActC and ALK7 models were built from (PDB:7OLY) (Thompson et al., 2005). Sequence alignment on the left highlights the diversity of fingertip residues within the ligands and the extension of the β4–β5 loop in ALK4 and activin receptor-like kinase 5 (ALK5). All proteins in alignments are human.
Figure 7—figure supplement 3
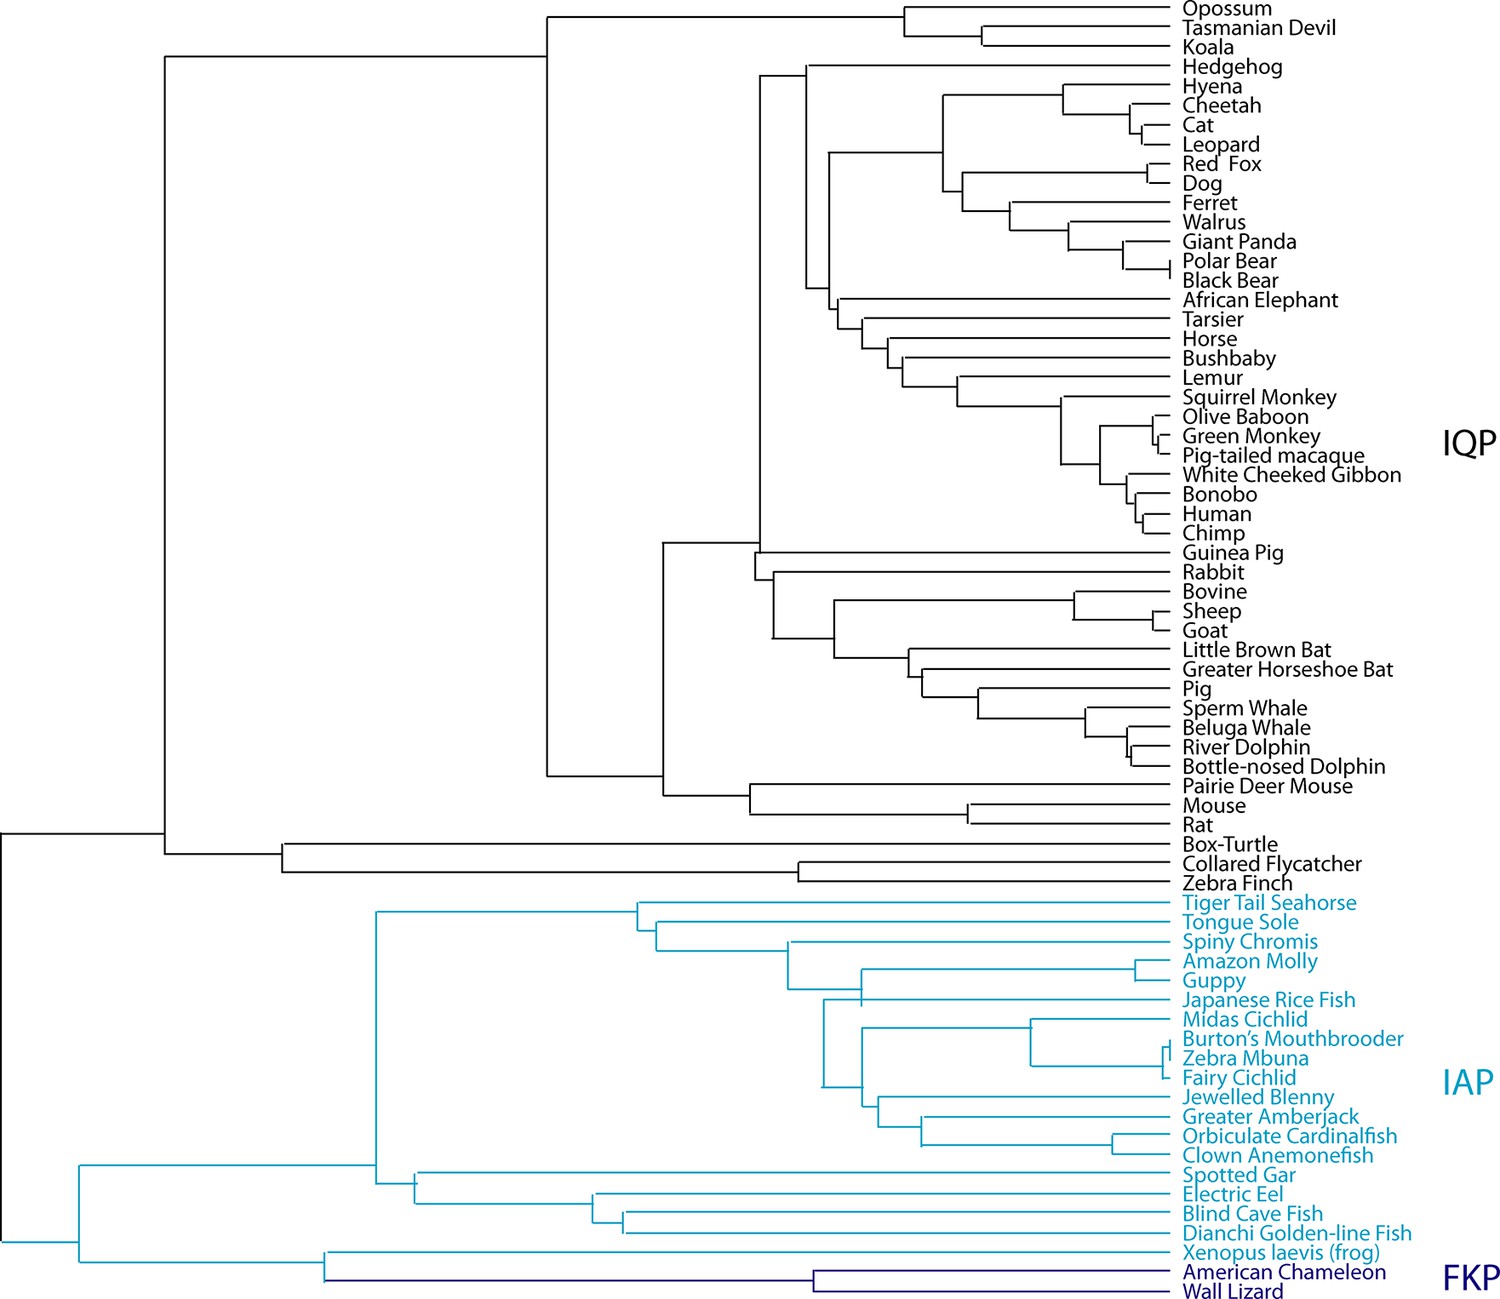
Phylogenetic history of ActC.
Phylogenetic analysis of full-length activin C (ActC) across a large variety of species with focus on the type II receptor interface variance. Species with the IQP variant shown in black, with the IAP variant in blue, and with the FKP variant in purple.
Additional files
-
Supplementary file 1
Linear regression analysis.
The activity data corresponding to Figures 1B, D, 4C, 5E were imported into GraphPad prism and fit using a non-linear regression to calculate the EC50 or IC50 with standard error was calculated from triplicate experiments.
- https://cdn.elifesciences.org/articles/78197/elife-78197-supp1-v1.docx
-
Supplementary file 2
SPR Kinetic Analysis.
- https://cdn.elifesciences.org/articles/78197/elife-78197-supp2-v1.docx
-
Supplementary file 3
qPCR primer sequences.
- https://cdn.elifesciences.org/articles/78197/elife-78197-supp3-v1.docx
-
Transparent reporting form
- https://cdn.elifesciences.org/articles/78197/elife-78197-transrepform1-v1.docx
-
Source data 1
Luciferase, SPR and raw image data for all figures.
- https://cdn.elifesciences.org/articles/78197/elife-78197-data1-v1.zip
Download links
A two-part list of links to download the article, or parts of the article, in various formats.
Downloads (link to download the article as PDF)
Open citations (links to open the citations from this article in various online reference manager services)
Cite this article (links to download the citations from this article in formats compatible with various reference manager tools)
The orphan ligand, activin C, signals through activin receptor-like kinase 7
eLife 11:e78197.
https://doi.org/10.7554/eLife.78197


