Neuroendocrinology of the lung revealed by single-cell RNA sequencing
- Department of Pediatrics, Stanford University School of Medicine, United States
- Department of Biochemistry and Howard Hughes Medical Institute, Stanford University, United States
- Department of Bioengineering, Stanford University, United States
- Chan-Zuckerburg Biohub, United States
Figures
Figure 1 with 1 supplement
Single cell RNA sequencing of mouse PNECs reveals expression of dozens of peptidergic genes.
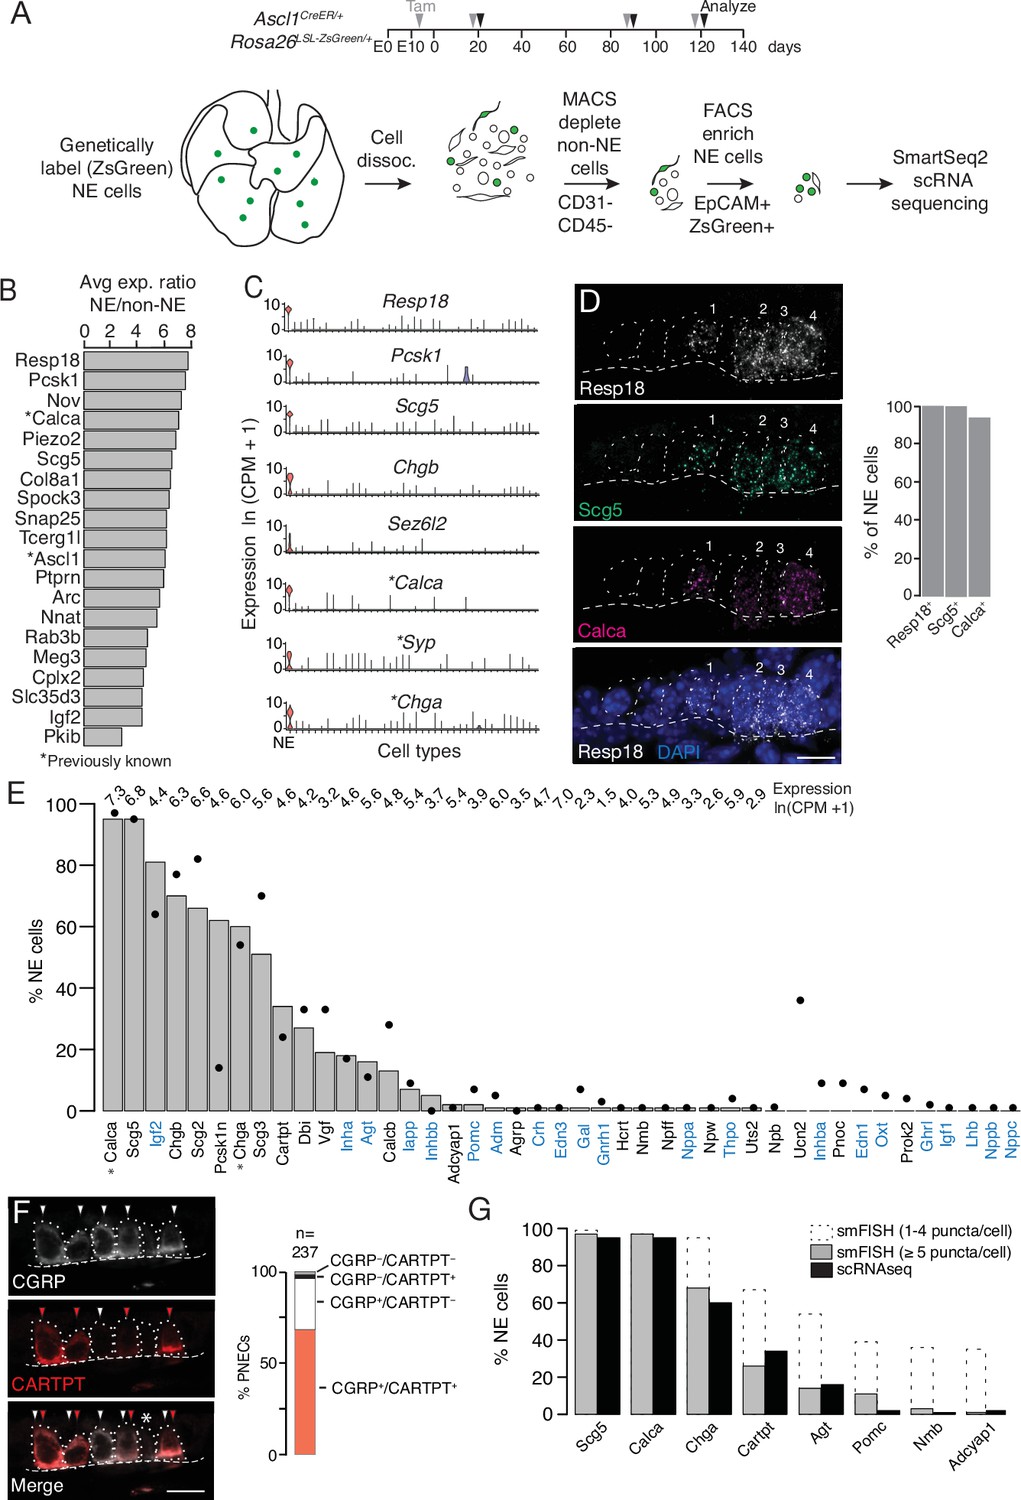
(A) Strategy for labeling, enrichment, and scRNA-seq of exceedingly rare PNECs. Timeline (top) of tamoxifen (Tam) injections (gray arrowheads) of Ascl1CreER/+;Rosa26LSL-ZsGreen/+ mice beginning at embryonic day (E) 13 - E14 to permanently induce ZsGreen expression in pulmonary neuroendocrine cells (PNECs or NE cells). Lungs were dissected at indicated ages (black arrowheads, postnatal day (PN) 21, PN90, and PN120) and mechanically and enzymatically dissociated (dissoc.) into single cells. Endothelial (CD31+) and immune (CD45+) cells were depleted by magnetic-cell sorting (MACS) then PNECs enriched by fluorescence-activated cell sorting (FACS) EpCAM+/Zsgreen+ double-positive cells. Sorted cells were analyzed by plate-based scRNA-seq using SmartSeq2 protocol. (B) Most sensitive and specific PNEC markers identified by scRNA-seq, ranked by ratio of the natural logs of the average expression (ln (counts per million, CPM + 1)) of the marker in PNECs (NE cells) vs. non-PNEC (non-NE) lung epithelial cells in mouse lung cell atlas (Travaglini et al., 2020). *, previously known PNEC marker. (C) Violin plots showing expression of five new markers (Resp18, Pcsk1, Scg5, Chgb, Sez6l2) and three previously known markers (*; Calca, Syp, Chga) across 40 cell types from mouse lung cell atlas (Travaglini et al., 2020). From left to right (x-axis): (1) neuroendocrine (NE, PNEC), (2) club, (3) multiciliated, (4) basal, (5) goblet, (6) alveolar type 1, (7) alveolar type 2, (8) glial, (9) smooth muscle, (10) myofibroblast, (11) adventitial fibroblast, (12) alveolar fibroblast, (13) pericyte, (14) mesothelial, (15) chondrocyte, (16) artery, (17) vein, (18) capillary aerocyte, (19) capillary-general, (20) lymphatic, (21) B cells, (22) Zbtb32+ Bcells, (23) plasma, (24) CD8+ T, (25) CD4+ T, (26) regulatory T, (27) Ly6g5bt + T, (28) natural killer, (29) Alox5+ lymphocyte, (30) neutrophil, (31) basophil, (32) alveolar macrophage, (33) interstitial macrophage, (34) plasmacytoid dendritic, (35) myeloid dendritic type 1, (36) myeloid dendritic type 2, (37) Ccr7+ dendritic, (38) classic monocyte, (39) nonclassical monocyte, (40) intermediate monocyte. (D) Close-up of neuroepithelial body (NEB) in PN155 wild type (C57BL/6NJ) mouse lung probed by multiplex single molecule RNA fluorescence in situ hybridization (smFISH) to detect expression of indicated PNEC markers, with DAPI nuclear counterstain. Dashed circles, individual PNECs (numbered); dashed line (basement membrane). Scale bar, 10 μm. Quantification (right) of clustered PNECs that express indicated markers (n=76 cells scored in left lobe and right lower lobe). Note classic marker Calca (CGRP) was not detected in 6% of Resp18+Scg5+double-positive PNECs. (E) Quantification of peptidergic gene expression in PNECs by scRNA-seq. Bars show percent of profiled PNECs (NE cells, n=176) with detected expression of the 43 peptidergic genes indicated; values above bars are log-transformed mean gene expression (ln (CPM + 1)) among expressing cells. Black dots, expression values from a second PNEC dataset (filled circles, n=92 PNECs) in which PNECs were genetically labeled using CgrpCreER;Rosa26LSL-ZsGreen mice, sorted, and isolated on a microfluidic platform (Ouadah et al., 2019). (Comparison by Fisher’s exact test (two-tailed) of the proportions of PNECs detected in the two scRNA-seq datasets is provided in Supplementary file 4, with caveat that the comparison is of results from different techniques on different samples.) *, Previously known mouse PNEC peptidergic genes; blue highlight, classic hormone genes. (F) Micrograph of NEB from PN90 Ascl1CreER/+;Rosa26LSL-ZsGreen/+ mouse lung immunostained for CGRP and newly identified PNEC neuropeptide CARTPT. White arrowheads, CGRP+ PNECs; red arrowheads, CARTPT+ PNECs; *, CGRP- CARTPT- double-negative PNEC. Right panel, quantification of CGRP and CARTPT staining in PNECs defined by Ascl1-CreER-lineage label (n=237 PNECs scored in three PN60 Ascl1CreER/+;Rosa26LSL-ZsGreen/+ mice). (G) Quantification of PNEC (NE cell) expression of the indicated peptidergic genes by scRNA-seq (black bars, n=176 cells) and multiplex smFISH (grey bars and dashed extensions, n=100cells scored in NEBs from 2 mice, see Figure 2). Grey bars, cells with high expression (>5 puncta/cell); dashed extensions, cells with low expression (1–4 puncta/cell). Fisher’s exact test (two-tailed) gave p=1 (not significant) for all comparisons of proportions of expressing PNECs for each gene as detected by smFISH (>5 puncta/cell) vs. scRNA-seq (black bars); when the comparisons included cells with 1–4 puncta/cell by smFISH, differences were significant (p<0.05) for Chga, Cartpt, Agt, Pomc, Nmb, and Adcyap1 but not for Scg5 and Calca (p=0.9 for both).
-
Figure 1—source data 1
Corresponds to Figure 1G.
- https://cdn.elifesciences.org/articles/78216/elife-78216-fig1-data1-v1.xlsx
Figure 1—figure supplement 1
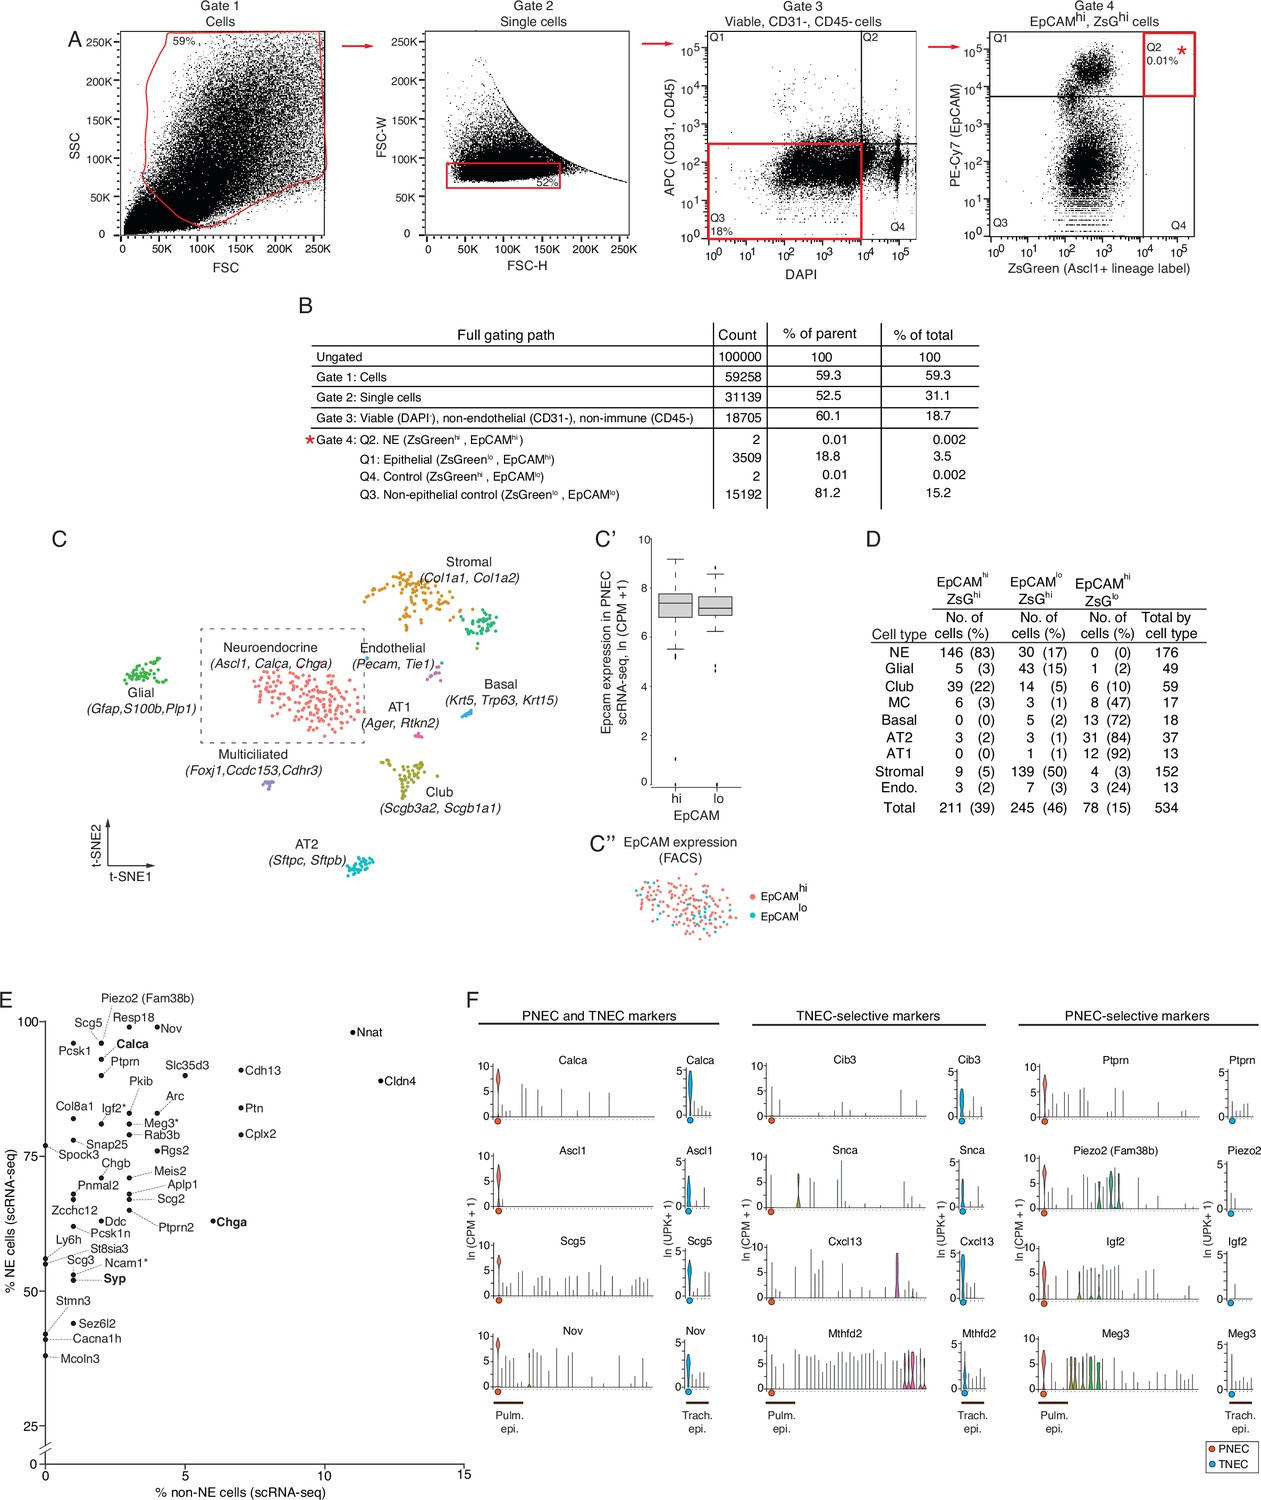
FACS enrichment strategy for PNECs.
(A) Fluorescence-Activated Cell Sorting (FACS) gating path of adult (PN120) mouse lung cells with PNECs genetically lineage-labeled with ZsGreen and with immune (CD45+) and endothelial cells (CD31+) depleted by MACS prior to flow sorting as shown in Figure 1A. Red boxes, cell population selected at each gate; percentage values, percent of cells within the indicated gate. Gate 1, side scatter (SSC) and forward scatter (FSC) to separate cells (from debris). Gate 2, forward scatter width (FSC-W) and height (FSC-H) to separate single cells (from doublets and larger aggregates). Gate 3, DAPI to select viable cells, and APC to exclude endothelial (CD31+) and immune (CD45+) cells. Gate 4 (Q2),ZsGreen+ (Ascl1 genetic lineage label) and EpCAM+ (epithelial) to enrich for neuroendocrine (NE) cells; alternative gates were also used at this step to sort control cells (Q1, ZsGreenloEpCAMhi; Q4, ZsGreenlo EpCAMhi). (B) Results of an analytic sort of 100,000cells using above scheme. Count, number of cells within each gate. % of parent, % of analyzed cells at that sort; % of total, % of total analyzed cells (100,000). (C) Computational clustering using t-distributed stochastic neighbor embedding (t-SNE) of the expression profiles of 534 experimental and control cells sorted as above and analyzed by scRNA-seq. Identity of the cells (dots) in each cluster (colors) was assigned by cluster-selective expression of the canonical lung cell type markers indicated. (C’) Box and whisker plots comparing Epcam RNA levels (determined by scRNA-seq) in PNECs obtained from sorted ZsGreenhi EpCAMhi (left) vs. ZsGreenhi EpCAMlo (right) cell populations. Note EpCam RNA levels in PNECs obtained from both sorted populations are indistinguishable. (C'') t-SNE clustering of the 176 PNECs in the boxed region of panel C highlighting PNECs obtained from the ZsGreenhi EpCAMhi (pink dots) vs. ZsGreenhi EpCAMlo (teal dots) sorted populations. Note intermingling of PNECs from the two sorted populations. (D) Number and fraction of cells obtained by each gating strategy. NE, neuroendocrine (PNECs); AT2, alveolar type 2; AT1, alveolar type 1; Endo, endothelial. (E) Scatterplot showing sensitivity (% NE cells that express the marker) vs. specificity (% non-NE epithelial cells that express the marker) of a panel of PNEC markers by scRNA-seq. Among the most sensitive and specific genes, several genes are likely also PNEC-selective (indicated by asterisk). The most PNEC-selective genes are also indicated. Classic PNEC genes (bold font). NE, neuroendocrine. (F) Violin plots comparing expression of representative top marker genes in common (PNEC and TNEC markers) between pulmonary neuroendocrine cells (PNECs) and tracheal neuroendocrine cells (TNECs), and the TNEC-selective and PNEC-selective markers (Supplementary file 1). The 40 lung cell types in the mouse lung cell atlas are indicated along x-axis (left to right) as in Figure 1C, beginning with PNECs (orange dot) at left. Pulmonary epithelial cells (Pulm epi.) indicated along x-axis. TNEC expression of each gene is compared to other tracheal epithelial cells (Trach. epi.); data from Montoro et al., 2018. The 6 tracheal epithelial cell types along the x-axis (left to right) are listed in the following order: TNEC (blue dot), basal, club, ciliated, tuft, and ionocyte. Expression of tracheal cells reported as log-normalized unique molecular identifiers per 10,000 (ln (UPK+1)), y-axis.
Figure 2 with 1 supplement
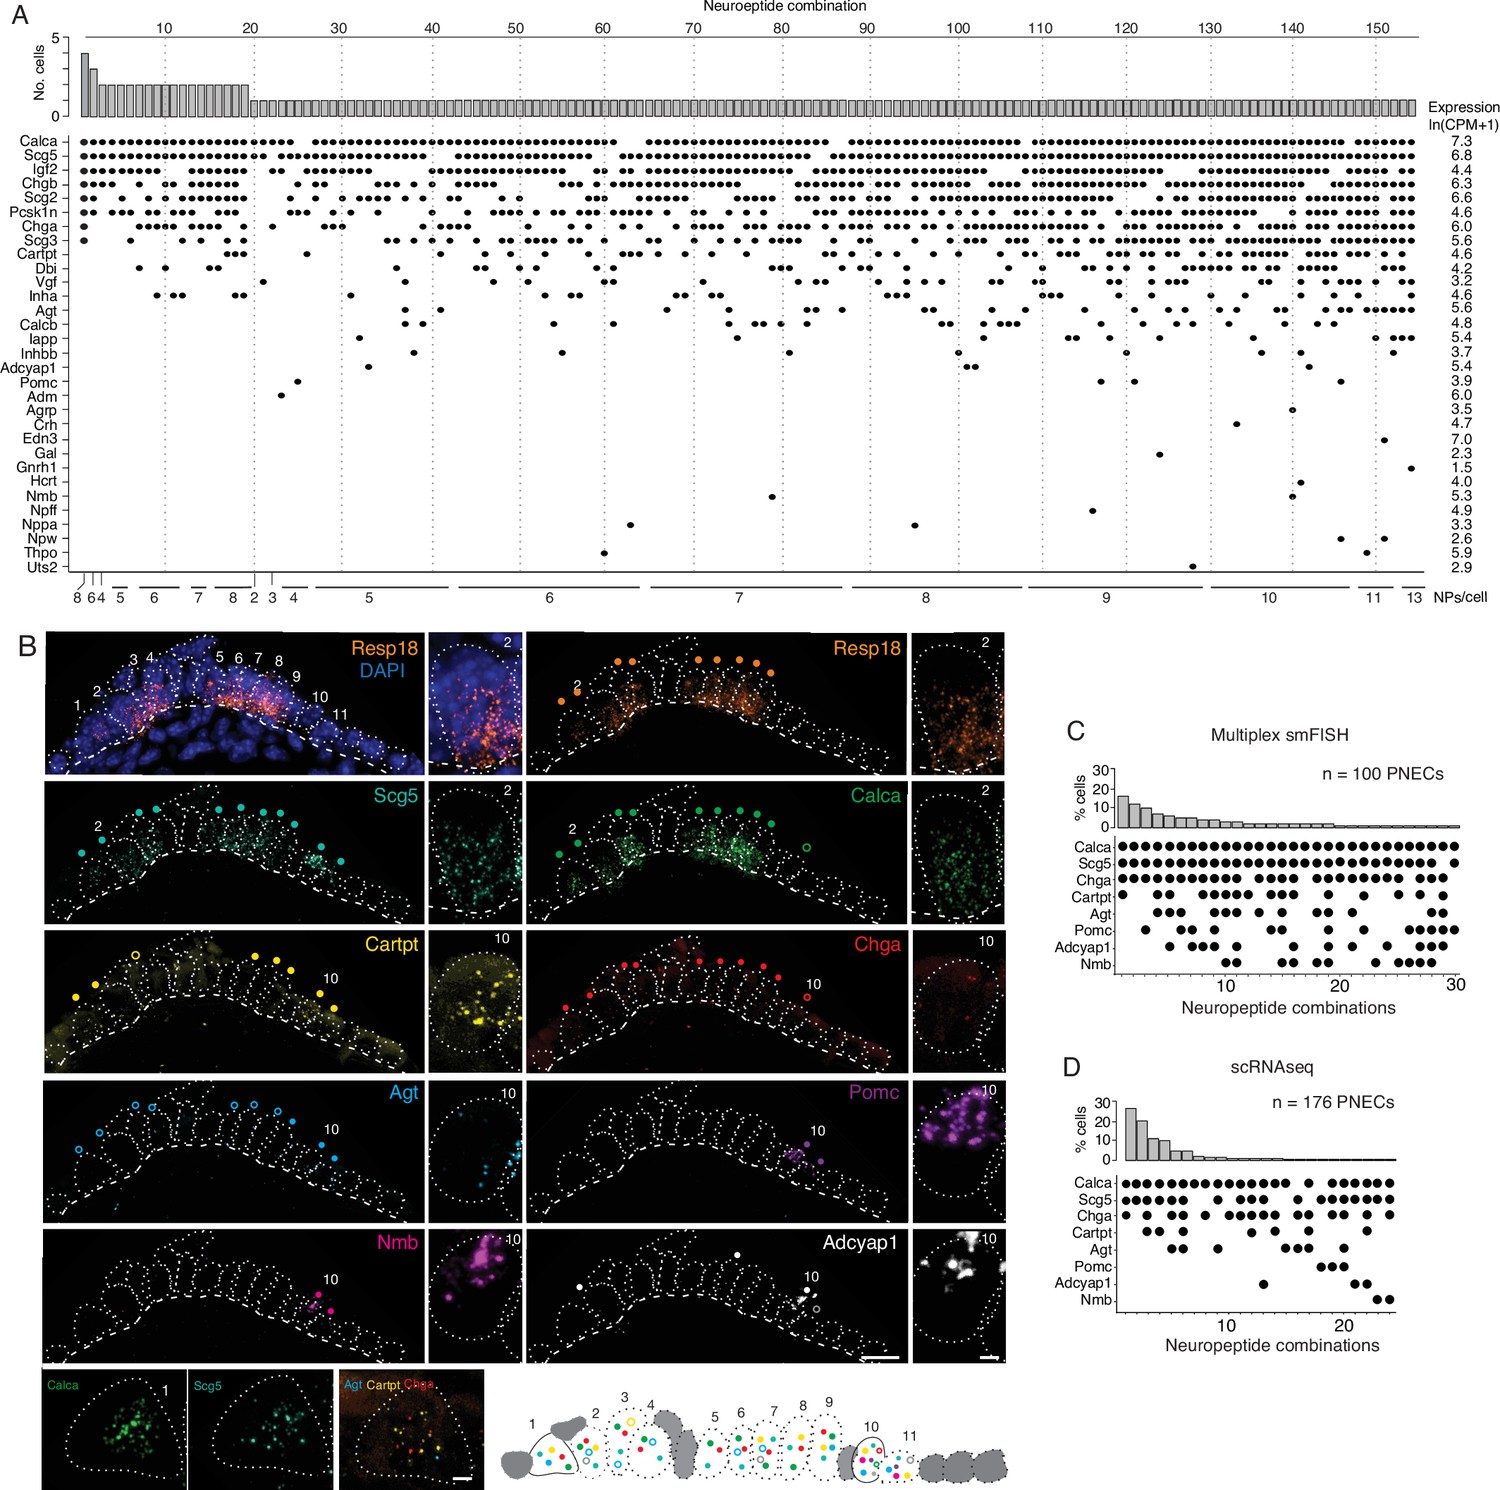
PNECs express myriad combinations of peptidergic genes.
(A) Peptidergic genes expressed in individual PNECs (n=176) from scRNA-seq. Histogram (top) shows number of PNECs expressing each of the 154 observed combinations of expressed peptidergic (NP) genes (dots, bottom). Values at right are average expression level of peptidergic genes among expressing cells; values at bottom are number of expressed peptidergic genes for each combination (NPs/cell). Each PNEC expressed 7.2±1.9 (mean ± SD) peptidergic genes (range 2–13, median 7, mode 6). (B) Micrograph of NEB from adult PN155 wild type mouse lung probed by multiplex smFISH (RNAscope) for PNEC marker Resp18 and the indicated peptidergic genes including ones detected by scRNA-seq in most (Scg5, Calca), some (Cartpt, Chga), or rare (Agt, Pomc, Nmb, Adcyap1) PNECs. Epithelial cells are outlined (white dots), basement membrane is indicated by dashed line, and individual PNECs numbered (n=11) with close-up of the indicated PNEC shown at right and PNEC 1 at bottom. Scale bar, 2μm. Filled colored circles above cells, PNECs with high expression of gene (≥5 puncta; filled circles); open circles, PNECs with low expression of gene (1–4 puncta, open circles). Schematic (bottom) shows summary of expression of the eight peptidergic genes (using colored circles as above) in the 11 PNECS in this NEB optical plane. Grey cells, other (non-PNEC) epithelial cells in field of view. Bar, 10μm. (C) Percent of PNECs expressing each of the 30 observed combinations of the eight peptidergic genes probed by smFISH (n=100 PNECs scored in NEBs from two wild-type mice). Filled circles, expressed peptidergic gene. (D) Percent of PNECs expressing each of the 24 observed combinations of the same eight peptidergic genes in scRNA-seq dataset (n=176 PNECs).
Figure 2—figure supplement 1
Peptidergic gene expression in PNECs.
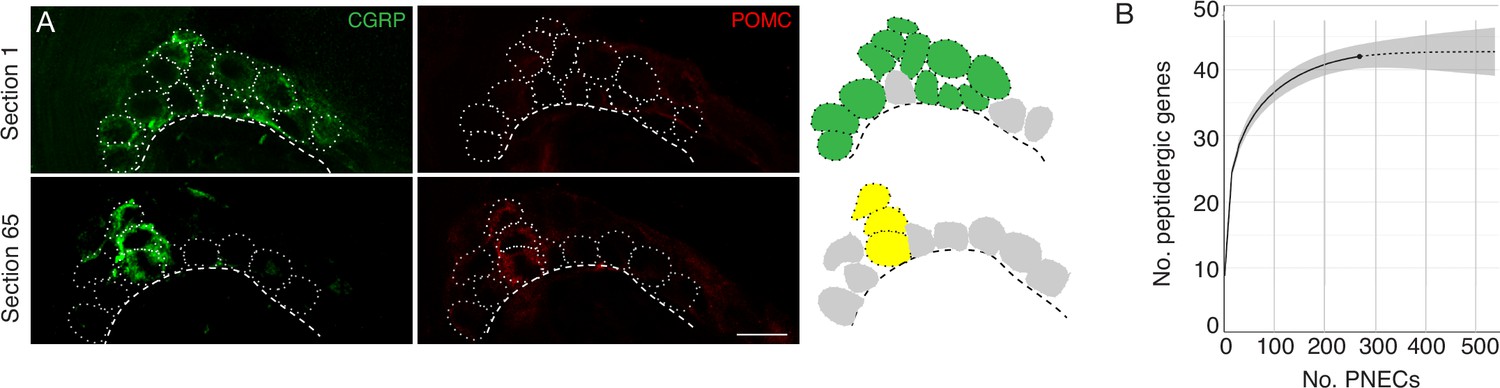
(A) Clustering of the rare POMC-expressing PNECs in a NEB. Fluorescence confocal micrographs (left) and schematics (right) of a NEB in adult PN68 wild type (CD-1) mouse lung immunostained for CGRP (green) and POMC (red). Two optical sections (separated by 65μm) of the same NEB are shown. Dotted circles, individual PNECs; dashed lines, basement membrane. In schematic at right, green fill circles are CGRP+, POMC- PNECs, yellow fill circles are CGRP+ POMC + double-positive PNECs, and gray fill circles are non-CGRP-expressing cells in cluster. Scale bar, 10μm. (B) Integrated rarefaction (interpolation, solid line) and prediction (extrapolation to 500 PNECs, dashed extension) curve showing cumulative number of distinct peptidergic genes expressed by PNECs, as determined by bootstrapping with 200 re-samplings of the scRNA-seq profiles of 268 individual PNECs (176 flow-sorted and 92 captured by microfluidics). Grey shading, 95% confidence intervals. Rarefaction curve is based on detected expression but not magnitude of expression of each peptidergic gene in each profiled PNEC (Figure 2).
Figure 3 with 1 supplement
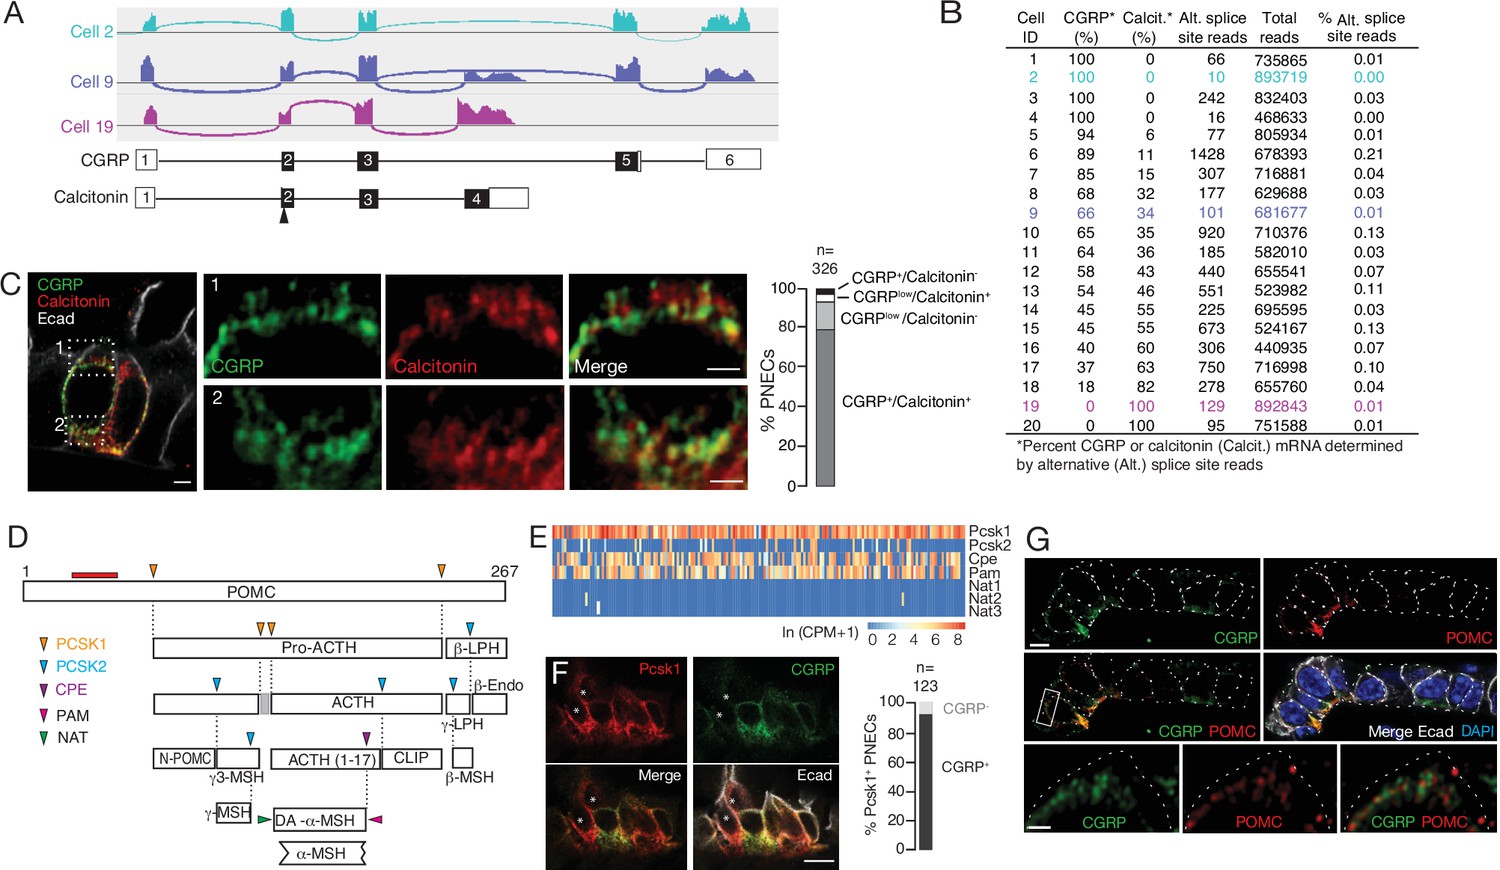
Additional PNEC peptidergic diversity from post-transcriptional processing.
(A) Sashimi plots (top) showing mapped scRNA-seq reads for Calca gene and deduced alternative splicing patterns for three representative PNECs (cells 2, 9 and 19 in B), and the resultant mRNAs structures (bottom) encoding either CGRP or calcitonin, with exons numbered (black fill, coding exons). Arrowhead, translation start site. Note cell 2 expresses only CGRP, cell 19 expresses only calcitonin mRNA, and cell 9 expresses both. (B) Quantification of alternative splicing of Calca mRNA as above for 20 randomly selected Calca-expressing PNECs (sashimi plots in Figure 3—figure supplement 1). (C) Fluorescence super-resolution (AiryScan SR) confocal micrograph (left) of neighboring PNECs in adult PN68 wild type mouse lung immunostained for CGRP (green), calcitonin (red), and E-cadherin (Ecad, white) to show epithelial cell boundaries, with DAPI nuclear counterstain (blue). Close-ups of boxed regions (right) show split and merged channels of apical (1) and basal (2) regions of a PNEC. Most PNECs express both of these peptides (see quantification at right), but note that the neuropeptide (CGRP) and hormone (calcitonin) localize to separate vesicles. Scale bar, 2μm (inset 2μm). Right, quantification of immunostaining (n=326 PNECs scored in 3mice). (D) Classical post-translational processing scheme for pro-opiomelanocortin (POMC) in anterior pituitary, showing cleavage sites (arrowheads) of endopeptidases proprotein convertase subtilisin/kexin type 1 (PCSK1, orange) and PCSK2 (blue), and carboxypeptidase E (CPE, purple), and modification sites (arrowheads) of peptidyl-glycine–amidating monooxygenase (PAM amidation site, red) and N-acetyltransferase (NAT acetylation site, green) (Harno et al., 2018). ACTH, adrenocorticotrophic hormone; β-LPH, lipotropin, MSH, melanocyte stimulating hormone, Endo, endorphin. Gray box, junctional peptide; red bar, antigen (residues 27–52) of POMC antibody in panel G. In pituitary, other PCSK2 cleavage events produce additional peptides (γ3-MSH, ACTH (1-17), γ-LPH, β-endorphin) although γ−MSH and β-MSH are likely not produced in mouse due to absence of those dibasic cleavage sites. (E) Heatmap of expression of POMC processing genes in individual PNECs (n=176) from scRNA-seq dataset. Note expression of Pcsk1, Cpe, and Pam in most (94%, 65%, 74%), Pcsk2 in some (16%), and Nat2 and Nat3 in rare (1%) PNECs; none expressed Nat1. This predicts production of all the major pituitary peptides in PNECs, with individual PNECs producing different sets of POMC peptides due to differential expression of the processing enzymes. (F) Micrograph of NEB in adult PN90 wild type (CD-1) mouse lung immunostained for PCSK1 (red), CGRP (green), and E-cadherin (Ecad, white). Right, quantification of immunostaining (n=123 PNECs scored in three mice). Most PNECs co-express PCSK1 and CGRP, although rare PNECs (~10%) express only PCSK1 (asterisks in micrograph). Scale bar, 10μm. (G) Super-resolution confocal micrograph of NEB in adult PN155 wild type (CD-1) mouse lung immunostained for CGRP (green), POMC (red), and E-cadherin (Ecad, white), with DAPI counterstain (blue). Bottom panel, close-up of boxed region showing separate POMC and CGRP puncta. Quantification (n=347 distinct puncta scored in 8 PNECs co-expressing CGRP and POMC) showed 157 CGRP+ puncta, 190 POMC+ puncta, and no puncta with co-localization of the two. Bar, 10μm (inset 2μm).
Figure 3—figure supplement 1
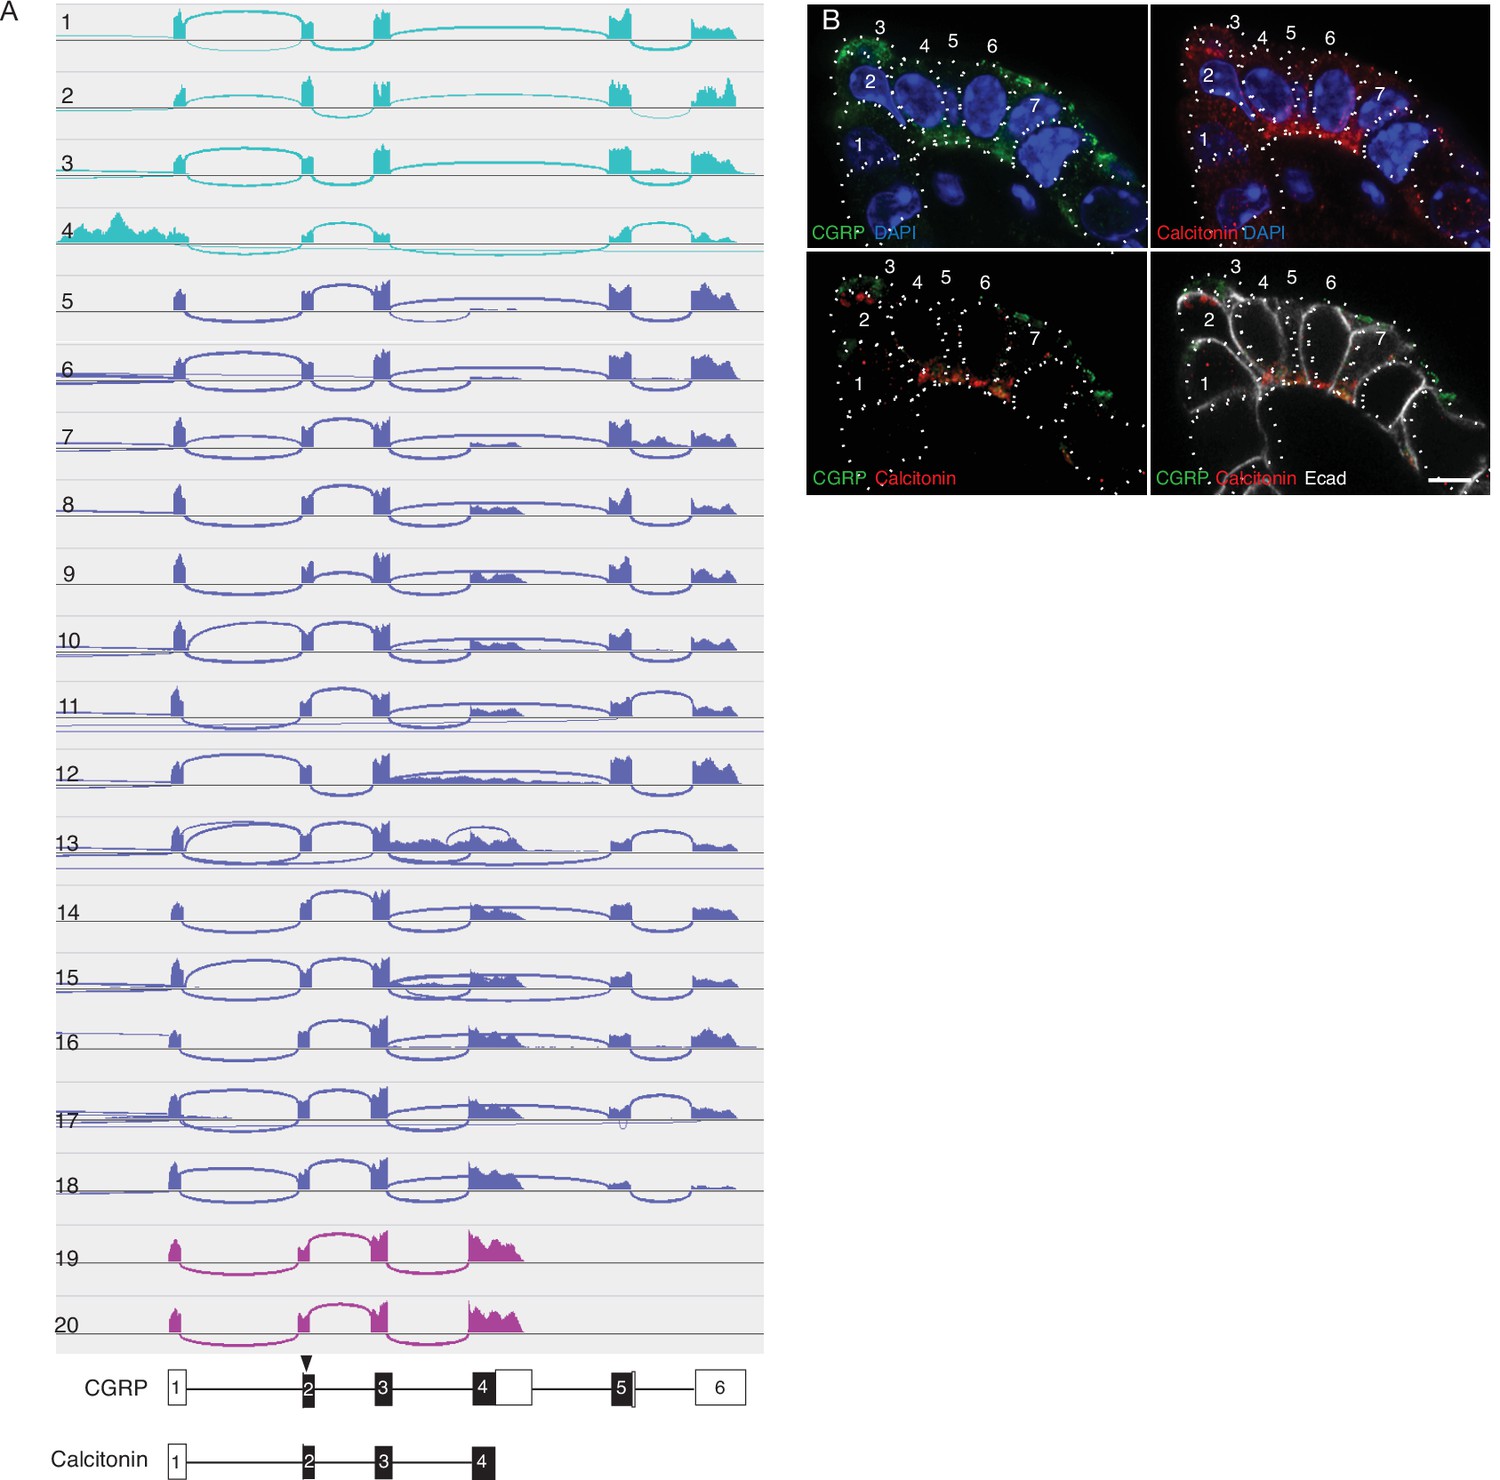
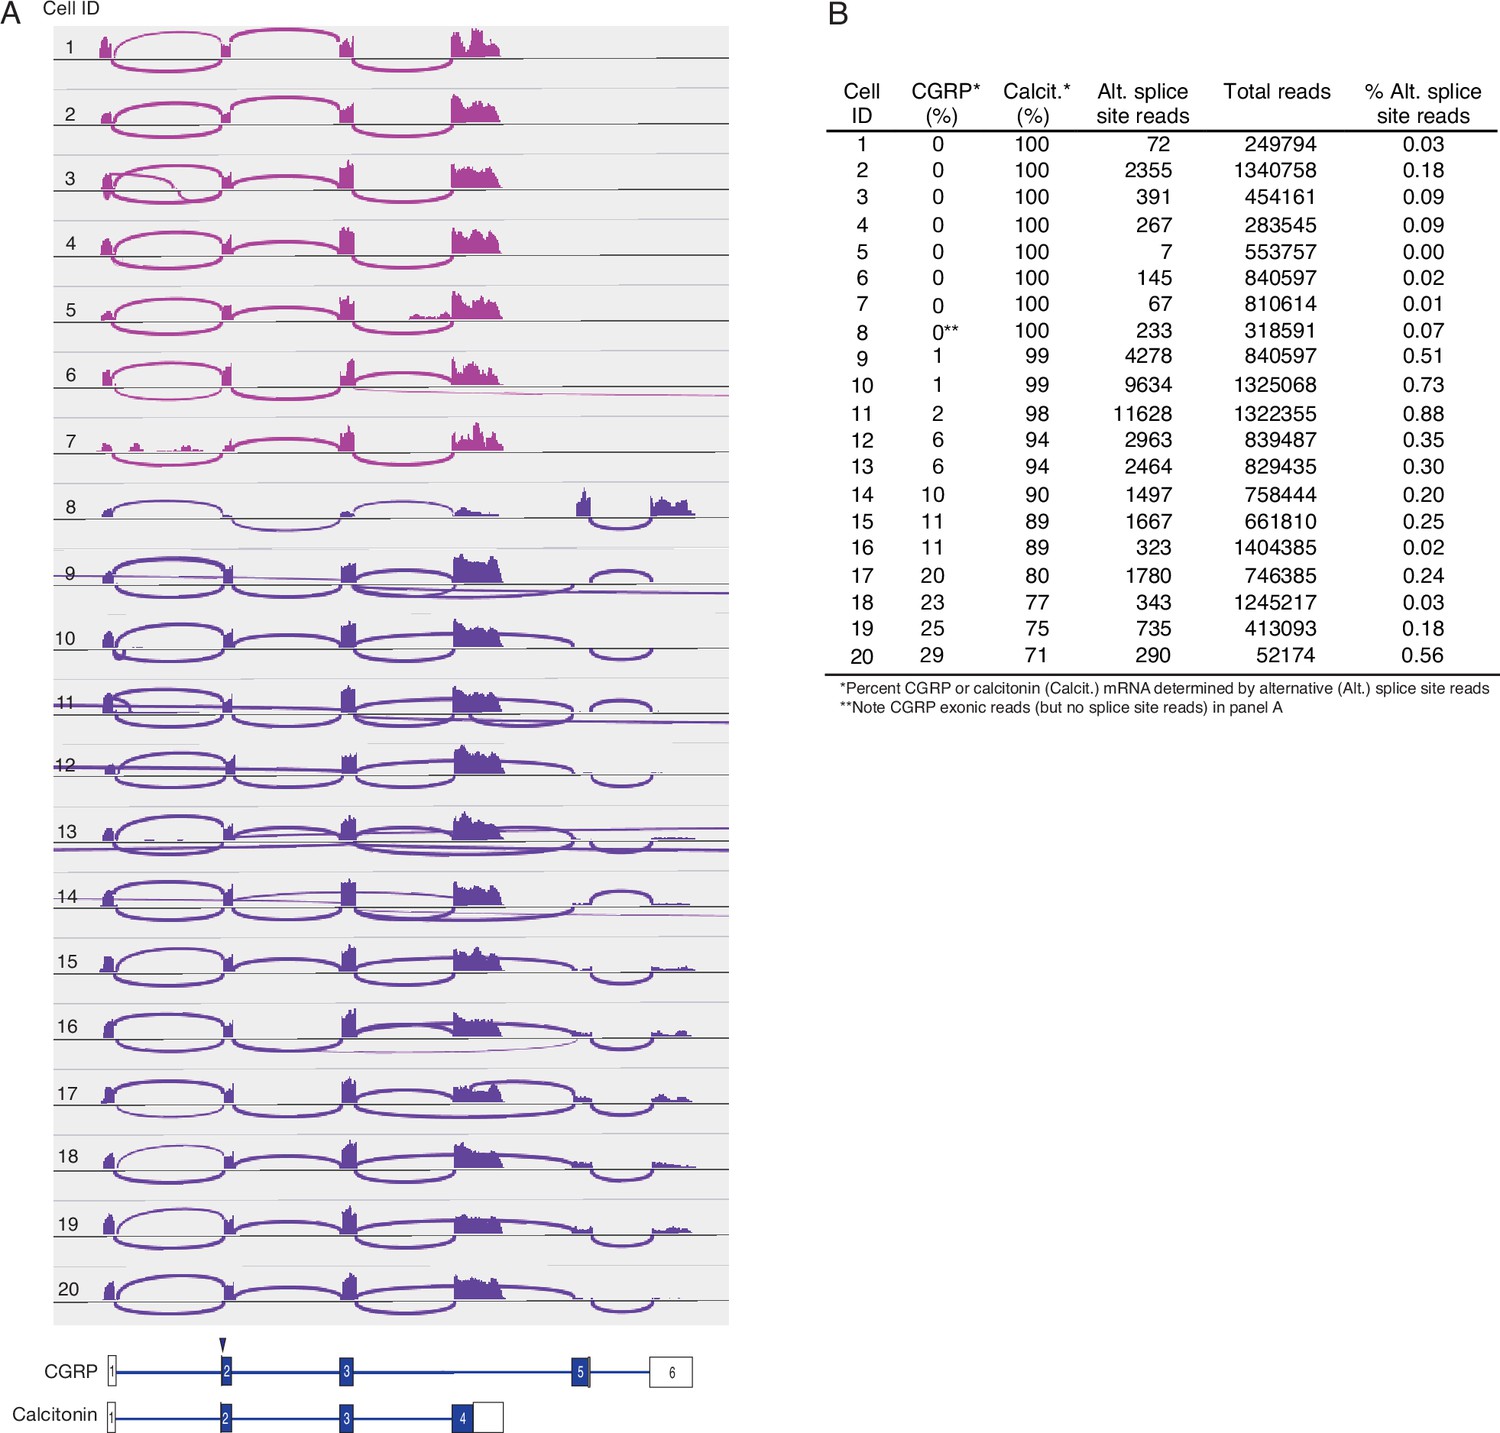
Calca alternative splicing in mouse PNECs.
(A) Sashimi plots (top) as in Figure 3A showing mapped scRNA-seq reads for Calca gene and deduced alternative splicing patterns for the 20 PNECs in Figure 3B. Schematics (bottom) show structures of the resultant mRNAs encoding either CGRP or calcitonin, with exons (boxes) numbered and translational start site (arrowhead) and coding exons (black fill) indicated. Aqua, PNECs expressing only CGRP mRNA; magenta, PNECs expressing only calcitonin; blue, PNECs expressing both. (B) Fluorescence confocal micrograph of a NEB in adult (PN68) mouse lung immunostained for CGRP (green), calcitonin (red), E-cadherin (Ecad, white) to show cell boundaries, with DAPI nuclear counterstain (blue). Individual PNECs are numbered. Note that most PNECs in this NEB express both CGRP and calcitonin, but PNEC 3 expresses only CGRP whereas PNECs 1 and 2 express calcitonin but little or no CGRP. Bar, 5μm.
Figure 4 with 2 supplements
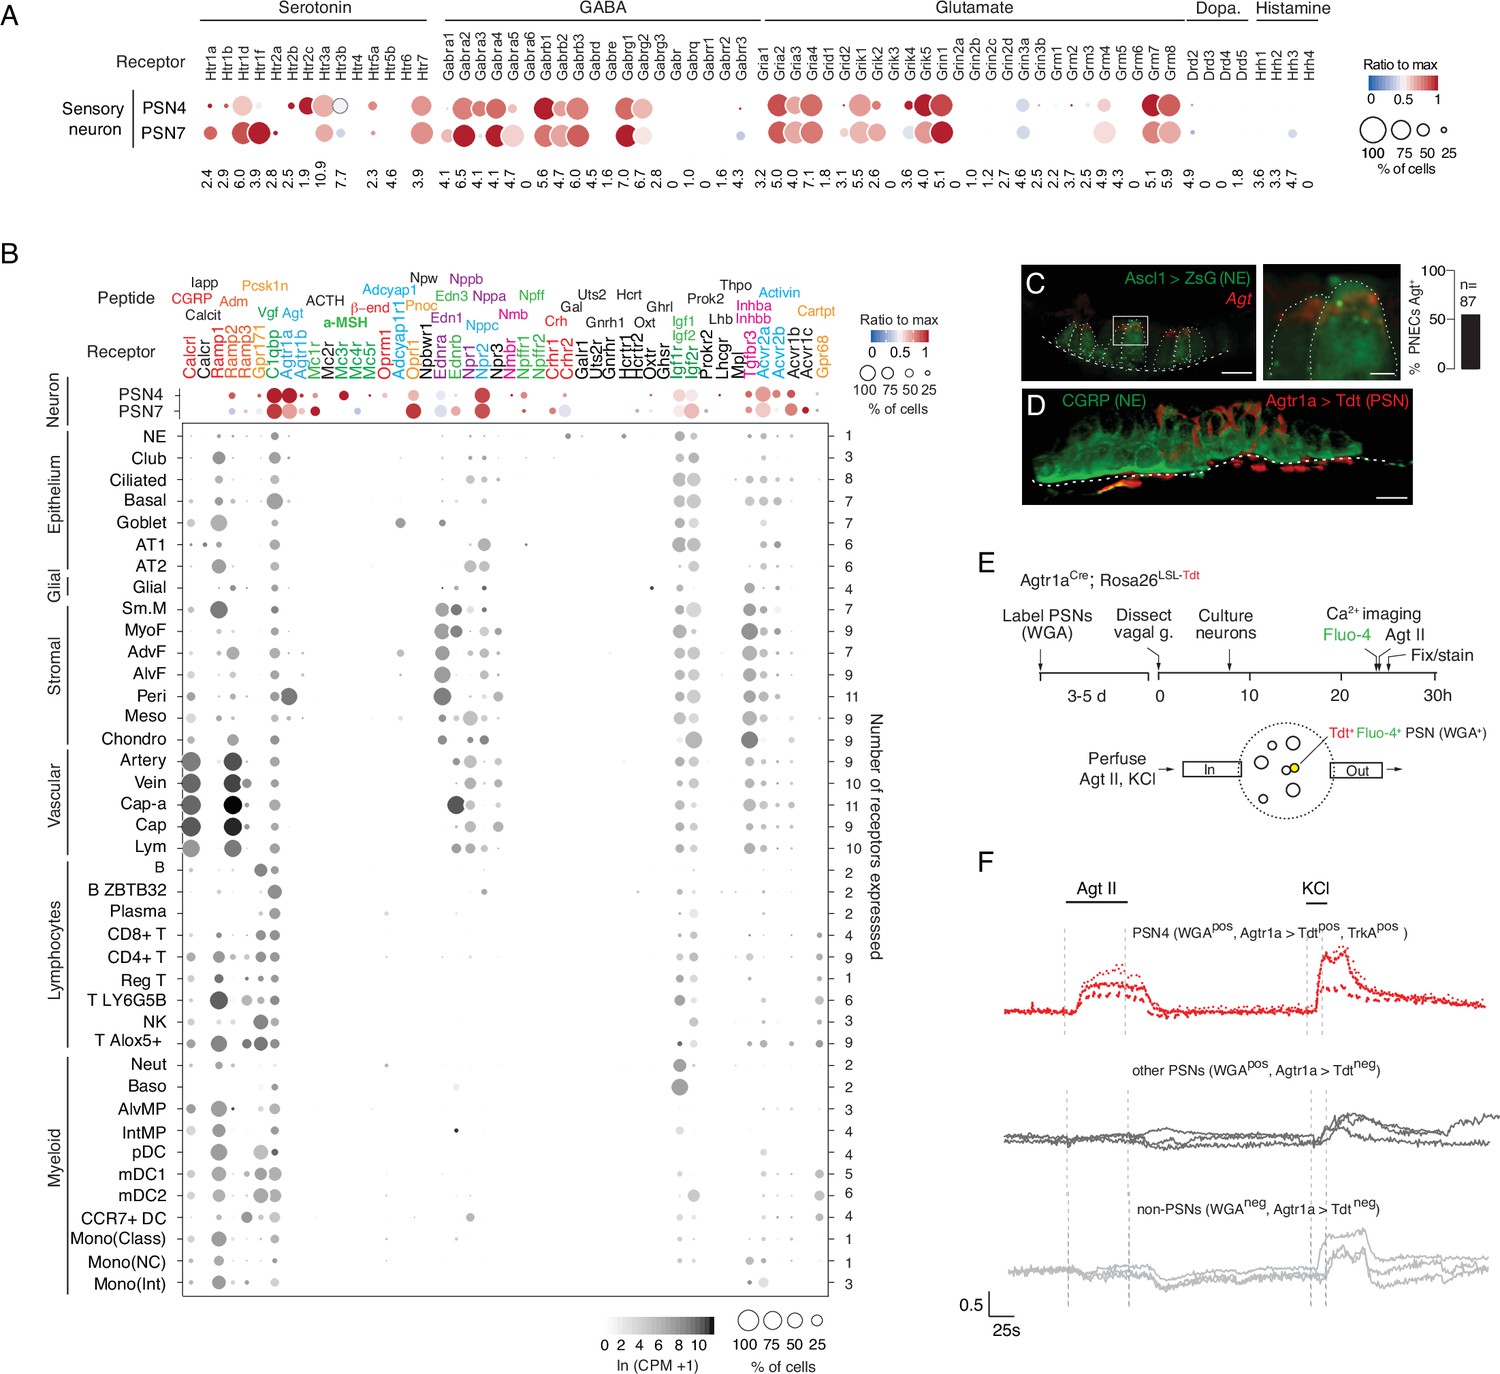
Predicted lung cell targets of PNEC signals from expression of their receptors.
(A) scRNA-seq dot plot of mean expression level (dot heatmap, ratio relative to maximum value for 10 pulmonary sensory neuron (PSN) subtypes, Liu et al., 2021) and percent of cells in population with detected expression (dot size) in the NEB-innervating PSN subtypes (PSN4, PSN7) of genes encoding receptors for each of the indicated PNEC neurotransmitters. (B) scRNA-seq dot plot of expression in PSN4 and PSN7 (as above) and mean level of expression (dot intensity) and percent of cells in population with detected expression (dot size) in cell types (arranged by tissue compartment) in mouse lung cell atlas Travaglini et al., 2020 of genes encoding receptors for indicated PNEC peptidergic ligands (shown above corresponding receptor genes). Ligands with expressed receptors are colored; receptors without detectable expression and their corresponding ligands are shown in black. Values (at right), number of PNEC peptidergic signal receptors expressed in at least 10% of the cells of that cell type. CGRP, calcitonin gene-related peptide; Calcit, Calcitonin; Adm, adrenomedullin; Iapp, islet amyloid polypeptide (Amylin); Vgf, neuroendocrine regulatory peptide; Agt, angiotensinogen; α-MSH, alpha melanocyte-stimulating hormone; β-end, β-endorphin; Pnoc, prepronociceptin; Edn1, endothelin-1; Edn3, endothelin-3; Nppc, C-type natriuretic peptide; Nmb, neuromedin B; Npff, neuropeptide FF; Crh, corticotropin releasing hormone; Igf1, insulin-like growth factor 1; Igf2, insulin-like growth factor 2; Inhba, inhibin a; Inhbb, inhibin b; Pcsk1n, proprotein convertase substilisin/kexin type 1 inhibitor; Adcyap1, pituitary adenylate cyclase-activating polypeptide; Npw, neuropeptide W; Nppb natriuretic peptide B; Nppa, natriuretic peptide A; Gal, galanin; Uts2, urotensin II; Gnrh1, gonadotropin-releasing hormone 1; Hcrt, hypocretin; Ghrl, ghrelin; Oxt, oxytocin. Cell types: NE, neuroendocrine (PNEC); AT1, alveolar epithelial cell, type 1; AT2, alveolar epithelial cell, type 2; Sm.M, smooth muscle; MyoF, myofibroblast; AdvF, adventitial fibroblast; AlvF, alveolar fibroblast; Peri, pericyte; Meso, mesothelial; Chondro, chondrocyte; Cap-a, capillary aerocyte; Cap, general capillary (Cap-g); Lym, lymphatic cell; B ZBTB32, B cells (ZBTB32+); Reg T, T cells (regulatory); T LY6G5B, T cells (LY6G5B+); NK, natural killer; T Alox5+, T cells (Alox5+); Neut, neutrophil; Baso, basophil; AlvMP, alveolar macrophage; IntMP, interstitial macrophage; pDC, plasmacytoid dendritic; mDC1, myeloid dendritic, type 1; mDC2, myeloid dendritic, type 2; CCR7+ DC, dendritic cell (Ccr7+); Mono(Class), monocyte (classical); Mono(NC), monocyte (non-classical); Mono(Int), monocyte (intermediate). (C) Photomicrograph of NEB in adult (PN57) Ascl1CreER; Rosa26LSL-ZsGreen mouse lung with PNECs (NE cells) labeled with Zsgreen (green) and probed by smFISH (PLISH) for Angiotensinogen (Agt) mRNA (red). Dashed white line, basement membrane. In close up of boxed region (right), note localization of Agt mRNA near apical (luminal) surface of PNECs. Scale bars, 10μm (2μm, right panel). Quantification (right) of Agt-expressing PNECs (n=87 PNECs scored in two animals). (D) NEB of adult (PN90) Agtr1aCre mouse with Cre-responsive reporter virus (AAV-flex-tdTomato) injected into vagal ganglion and co-stained for tdTomato (red, Agtr1a-expressing PSNs) and for CGRP (green, PNECs). Agtr1a-expressing PSNs penetrate basement membrane (dashed white line) of NEB and terminate at or near its apical surface. Scale bar, 10μm. (E) Scheme for isolation and functional imaging of Agtr1a-labeled pulmonary sensory neuron (PSN) response to Agt II. (Top panel) Wheat germ agglutinin (WGA) was instilled into trachea of Agtr1aCre;Rosa26LSL-tdTom mice to retrograde label PSNs and genetically label Agtr1a-expressing PSNs (tdTomato) in vagal ganglia. Ganglia were dissected, dissociated into single cells, and cultured overnight before loading with calcium indicator Fluo-4 and addition of Agt II. (Bottom) Diagram of labeled, dissociated vagal ganglion cells on confocal microscope platform with perfusion chamber to flow in Agt II or KCl (positive control). Following imaging, cells were stained for PSN4 marker TRKA. (F) Representative neuronal traces showing evoked Ca2+ changes measured by Fluo-4 fluorescence (y-axis, fold change in fluorescence relative to baseline, ΔF/F) of three NEB-innervating PSN4 neurons (WGApos, Agtr1aCre-lineage-positive (Agtr1a>Tdtpos), TRKApos; upper traces, red) and six control ganglion cells from same animal (three other PSNs, middle traces, black; three non-PSNs, lower traces, grey) in response to Agt II (0.5–1μM for interval indicated) and to KCl (50mM). The individual (separated) traces of these nine neurons are shown in Figure 4—figure supplement 2C along with three representative PSN7 traces, and the results of all viable (KCl responsive) sensory neurons analyzed (n=189, including 100 PSNs) across 11 experiments are provided in the source data for this panel. PSN4 traces, cells 1, 9, 23 of experiment 6, plate a; ‘other PSN’ traces, cells 11, 25, 27 of experiment 6, plate a; ‘non-PSN’ traces, cells 9, 10, 11 of experiment 6, plate b. Graph scale, 25s (x-axis), 0.5 Fluo-4 ratio (y-axis).
-
Figure 4—source data 1
Corresponds to Figure 4F.
- https://cdn.elifesciences.org/articles/78216/elife-78216-fig4-data1-v1.xlsx
Figure 4—figure supplement 1
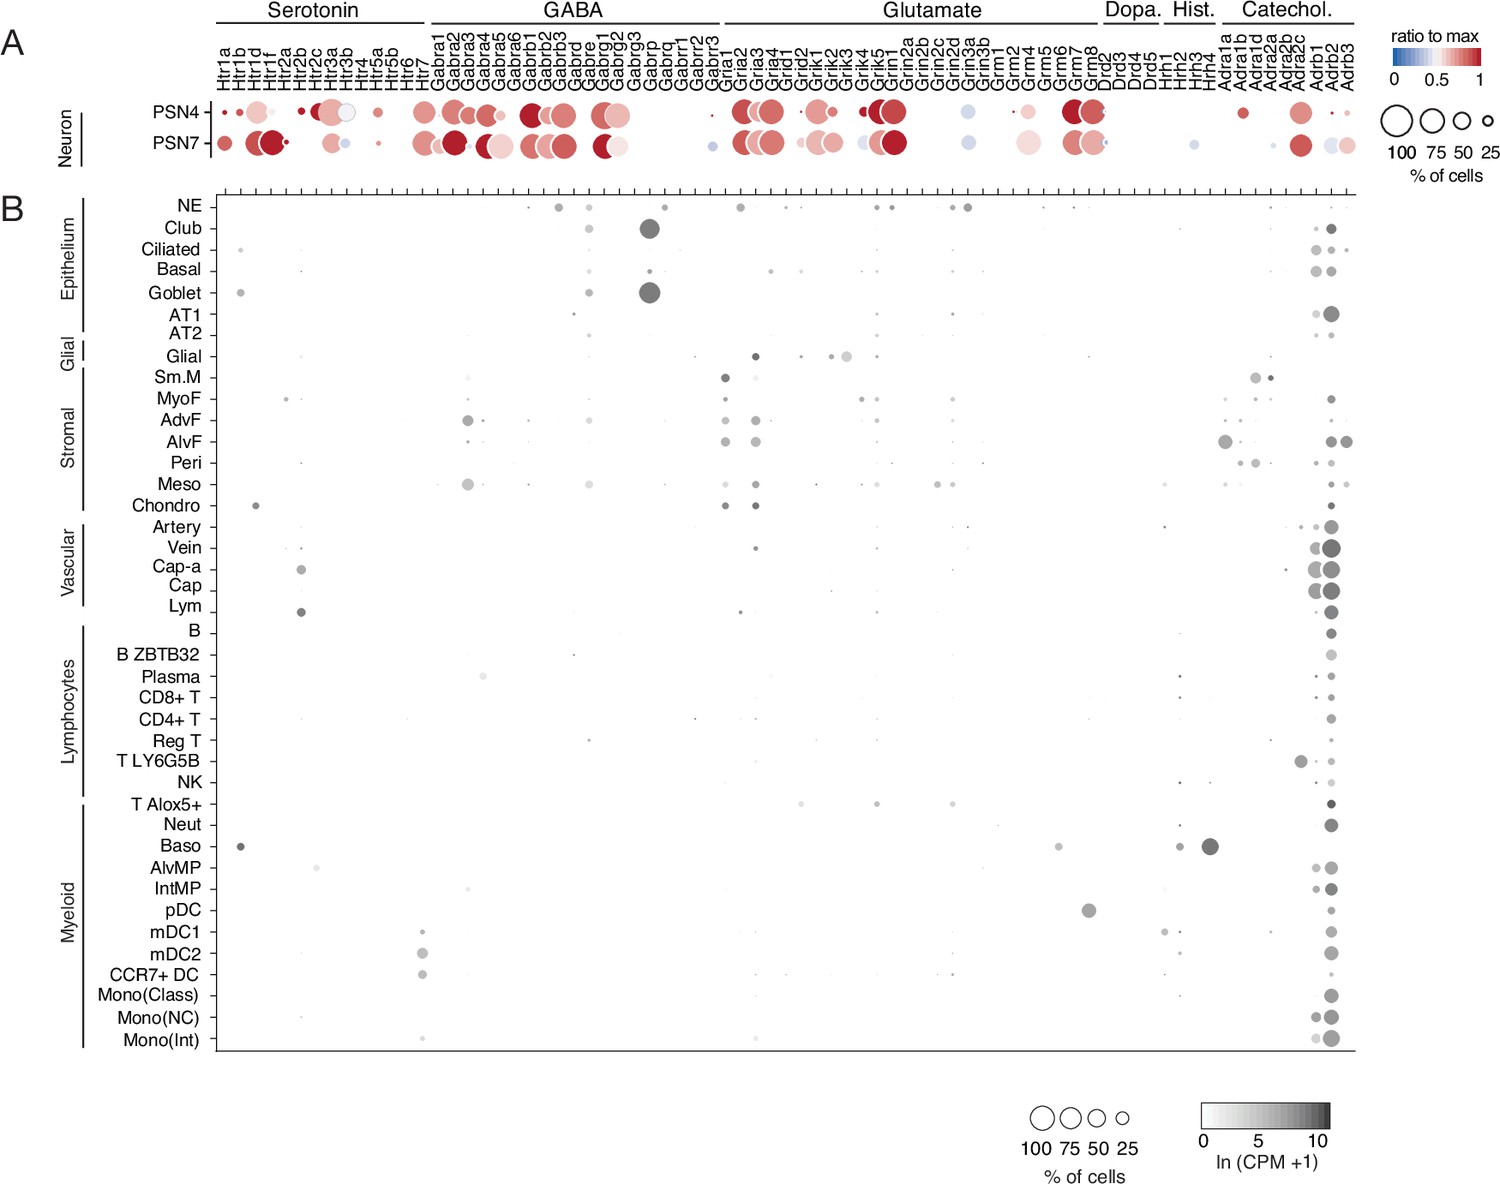
Mouse lung cell expression of receptors for PNEC neurotransmitters.
(A) scRNA-seq dot plot (reproduced from Figure 4 to facilitate comparison with panel B) of mean level of expression (dot heat map, ratio relative to maximum value for 10 pulmonary sensory neuron (PSN) subtypes, Liu et al., 2021) and percent of cells in population with detected expression (dot size) in the NEB-innervating PSN subtypes (PSN4, PSN7) of genes encoding receptors for each of the indicated PNEC neurotransmitters. (B) scRNA-seq dot plot of mean level of expression (dot intensity, ln (CPM + 1)) and percent of cells in population with detected expression (dot size) in cell types (arranged by tissue compartment) in mouse lung cell atlas Travaglini et al., 2020 of genes encoding receptors and associated subunits for indicated PNEC neurotransmitters (top). Cell types: NE, neuroendocrine (PNECs); AT1, alveolar epithelial cell, type 1; AT2, alveolar epithelial cell, type 2; Sm.M, smooth muscle; MyoF, myofibroblast; AdvF, adventitial fibroblast; AlvF, alveolar fibroblast; Peri, pericyte; Meso, mesothelial; Chondro, chondrocyte; Cap-a, capillary aerocyte; Cap, general capillary (Cap-g); Lym, lymphatic cell; B ZBTB32, B cells (ZBTB32+); Reg T, T cells (regulatory); T LY6G5B, T cells (LY6G5B+); NK, natural killer; T Alox5+, T cells (Alox5+); Neut, neutrophil; Baso, basophil; AlvMP, alveolar macrophage; IntMP, interstitial macrophage; pDC, plasmacytoid dendritic; mDC1, myeloid dendritic, type 1; mDC2, myeloid dendritic, type 2; CCR7+ DC, dendritic cell (Ccr7+); Mono(Class), monocyte (classical); Mono(NC), monocyte (non-classical); Mono(Int), monocyte (intermediate).
Figure 4—figure supplement 2
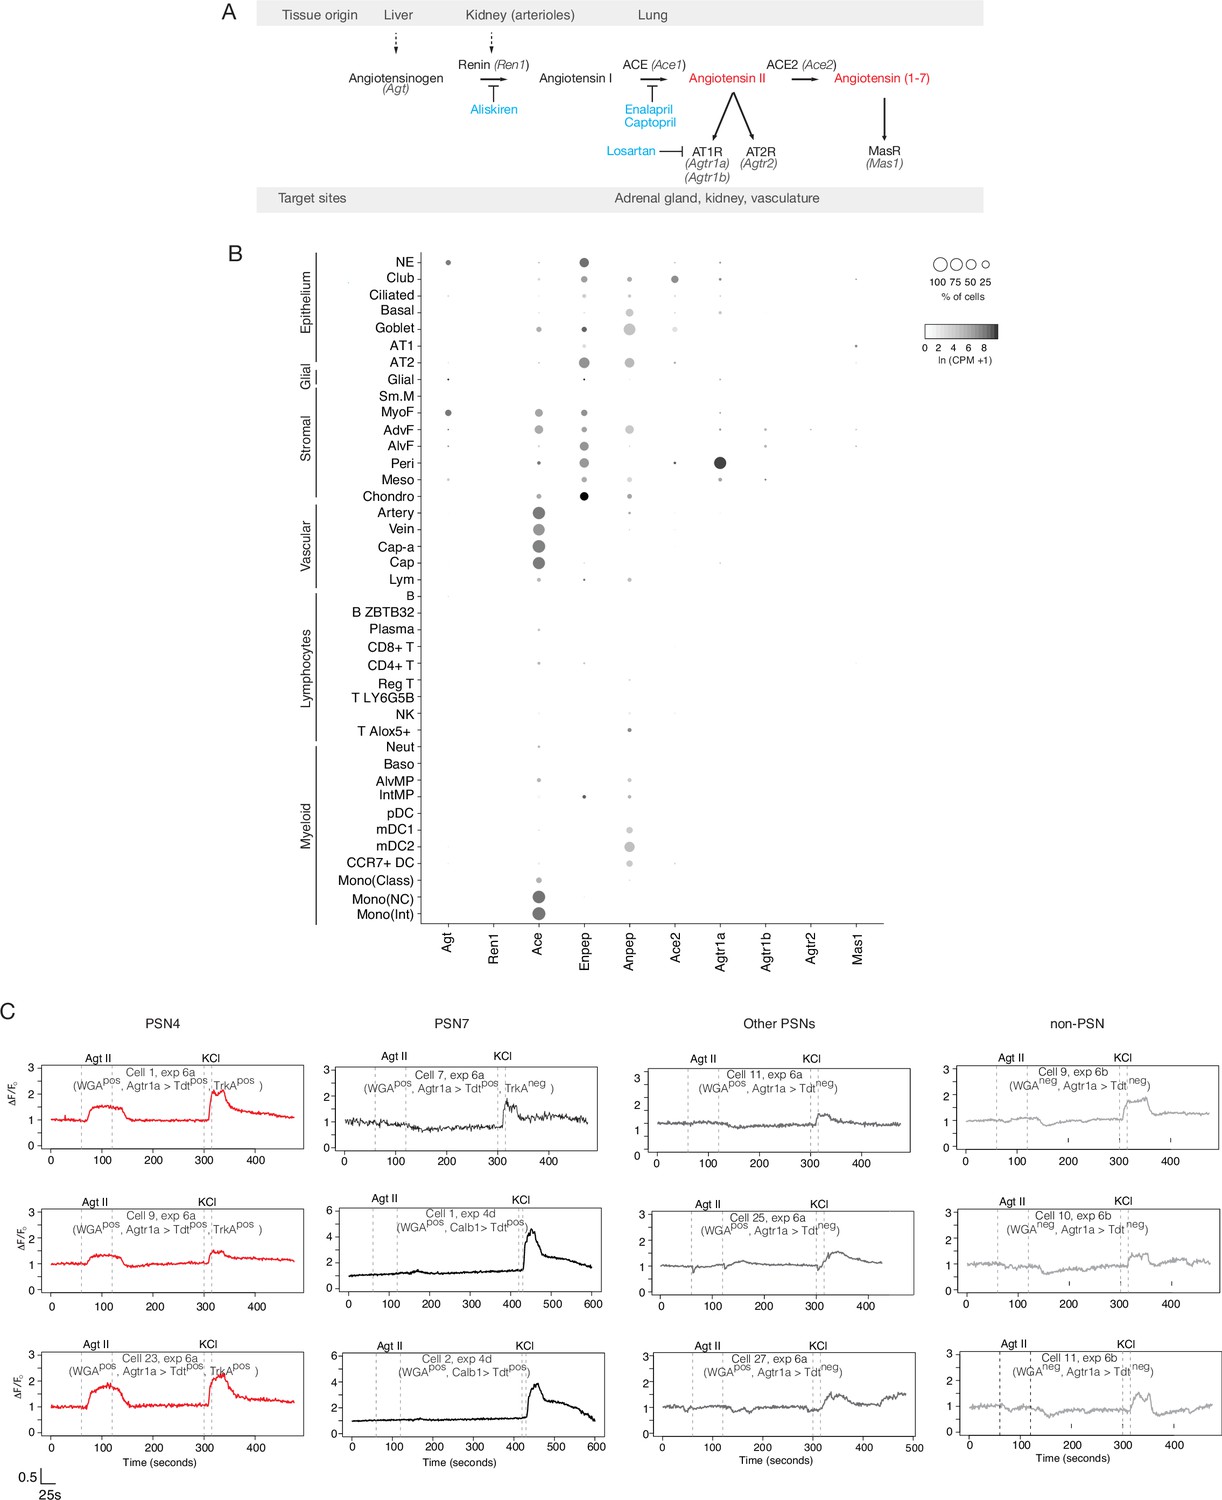
Mouse lung cell expression of renin-angiotensinogen pathway genes.
(A) Schematic of classical renin-angiotensinogen pathway showing sites of expression (tissue origin) of pro-hormone and processing enzymes, and hormone receptors (target sites) of the mature hormones (red). Some clinically significant anti-hypertensive drugs (blue) and the proteins they target are indicated. Renin (Ren1) catalyzes the first step in converting the pro-peptide angiotensinogen (Agt) to angiotensin I. In the lung, angiotensin converting enzyme (ACE, Ace1) converts angiotensin I to the active fragment, angiotensin II (Agt II). (B) scRNA-seq dot plots showing expression levels (dot intensity) and percent of cells in population with detected expression (dot size) in mouse lung cells Travaglini et al., 2020 of indicated genes in the angiotensin pathway. Note that the only cell types with prominent expression of angiotensinogen (Agt) are PNECs (Figure 4C) and myofibrobasts. Although PNECs directly contact the terminals of pulmonary sensory neuron subtypes PSN4 and PSN7 (Figure 4D, see Liu et al., 2021; Diaz de Arce et al, manuscript in preparation) and presumably provide the angiotensin that activates PSN4 (Figure 4E and F and panel C below), there are occasional alveolar projections of PSN4 (Diaz de Arce et al, manuscript in preparation) so it is possible that ligand secreted by alveolar myofibroblasts can also activate PSN4 through its alveolar terminals. (C) Individual (separated) neuronal traces of the nine sensory neurons from Figure 4F showing evoked Ca2+ changes measured by Fluo-4 fluorescence (y-axis, fold change in fluorescence relative to baseline (ΔF/F)) in response to angiotensin II (Agt II, 0.5–1μM for interval indicated) and to KCl (50mM). Three representative traces of pulmonary sensory neuron PSN7 are also included. The cell ID, experiment, and plate of each trace is indicated (as provided in Source Data for Figure 4F). Agtr1aCre- lineage-positive (Agtr1a>Tdtpos); Calbindin 1 (Calb12A-dgCre) lineage-positive (Calb1>Tdt + ). Graph scale, 25s (x-axis), 0.5 Fluo-4 ratio (y-axis).
Figure 5 with 2 supplements
Patterns of sensory gene expression in individual PNECs.
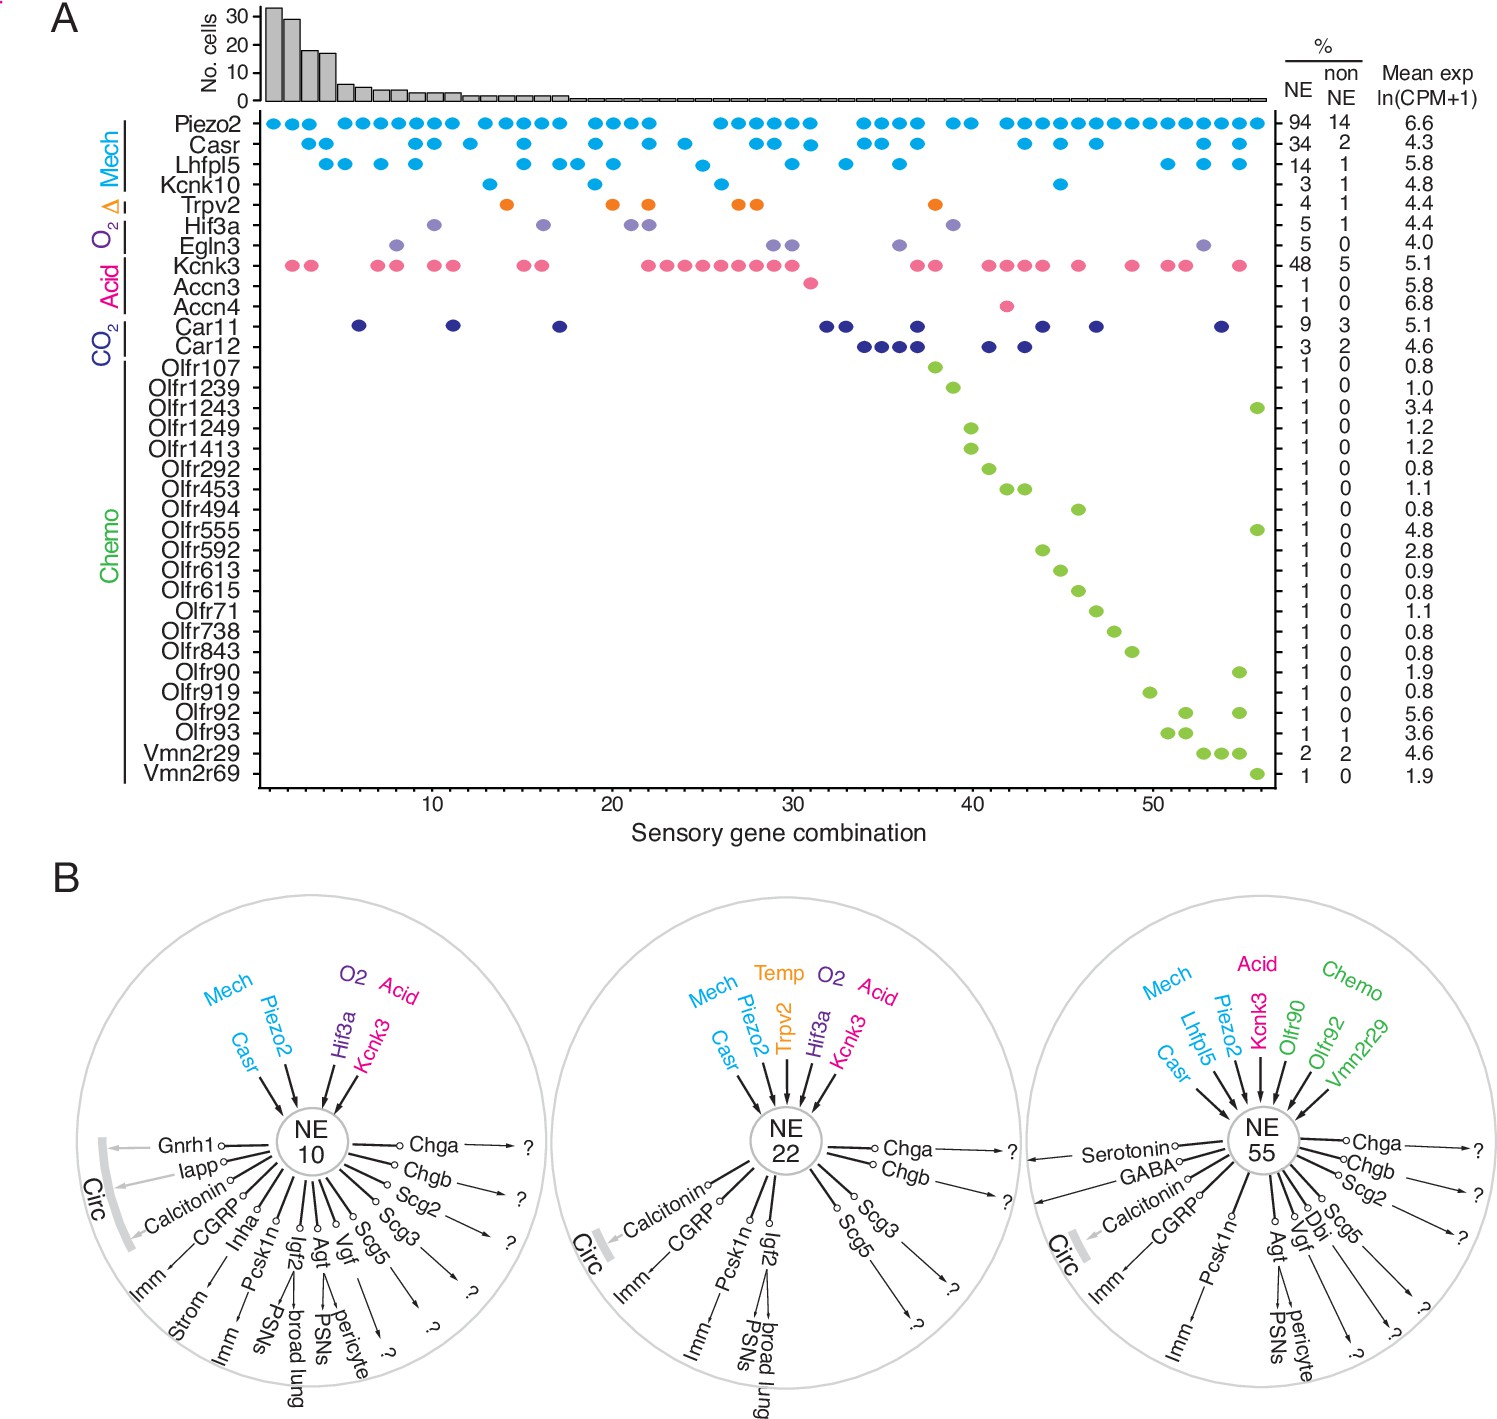
(A) Patterns of expression from scRNA-seq profiles of sensory genes (colored dots, expressed genes) in individual PNECs (n=176). Histogram shows number of PNECs observed with the pattern of sensory gene expression below it. Values at right are percent of PNECs (NE) and other (non-NE) profiled cells that express the gene and the mean expression level for expressing PNECs. Sensory genes are grouped by modality: mechanosensing (Mech); thermosensing (Δ); oxygen sensing (O2); acid-sensing (Acid); CO2-sensing, carbonic anhydrases (CO2), chemosensing (Chemo). Note the 56 different combinations of expressed sensory genes, with most PNECs predicted to be multimodal because they express more than one class of sensor. (B) Schematics of sensor and signal genes expressed by three individual PNECs. Number in center indicates sensory gene combination in panel A. Genes above number are expressed sensory genes, and genes below number are expressed signal genes with arrows indicating lung targets (cells that express receptor) or signals without identified lung targets that may enter circulation (circ) to target other organs.?, signals without known receptors. Imm, multiple immune populations; PSN, pulmonary sensory neurons.
Figure 5—figure supplement 1
Mouse lung cell expression of sensory genes.
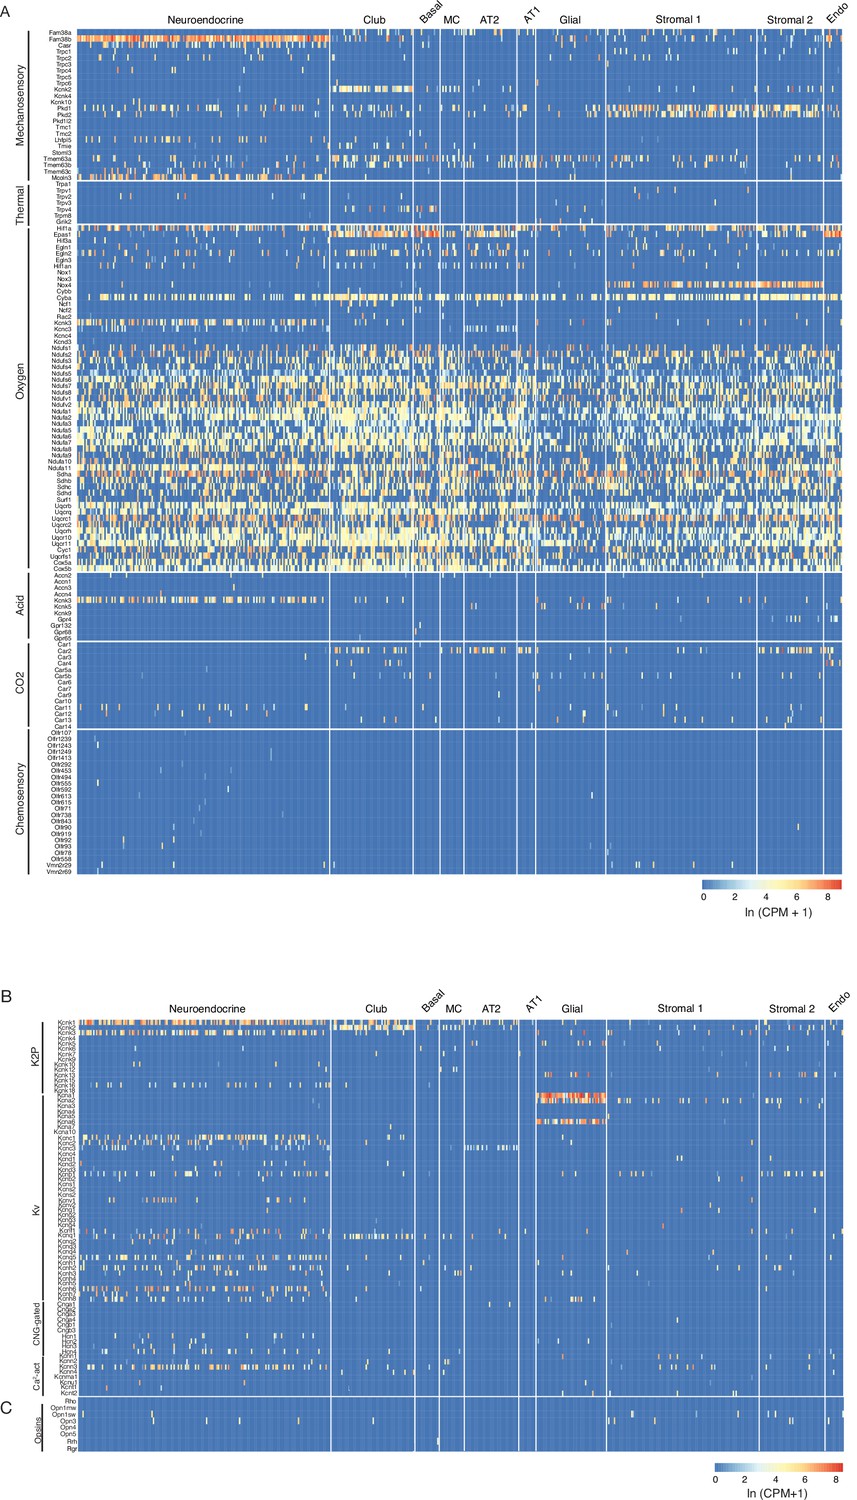
(A) Heatmaps showing expression levels (ln (CPM + 1)) in individual PNECs (Neuroendocrine, n=176) and other lung cell types as indicated (see Figure 1—figure supplement 1). Sensory genes are grouped by sensory modality; only olfactory receptor genes (Olfr) expressed in PNECs are shown in heatmap. Genes of the NADPH oxidase complex previously proposed to participate in PNEC hypoxic response: Cybb/p91phos, Cyba/p22phox, Ncf2/p67phox, Rac2/Rho GTPase. Mcoln3, a TRP family channel, is also expressed in auditory hair cell stereocilia, but role in mechanosensation not established. (B) Heatmaps as above showing expression of voltage and ligand-gated potassium and calcium channels. K2P, potassium 2-pore channel; Kv, voltage-gated potassium channel; CNG-gated, cyclic nucleotide-gated channel; Ca2-act, calcium-activated channel. Note the many PNEC-specific ion channel genes identified including Kcnc3, Kcnk16, Kcnc1, Kcnc2, Kcnb1, Kcnv1, Kcnf1, Kcnq5, Kcnh2, Kcnh6, and Kcnh7. (C) Heatmap as above showing expression of opsin genes. MC, multiciliated cell; AT2, alveolar epithelial type 2cell; AT1, alveolar epithelial type 1cell; Stromal 1 and Stromal 2, stromal cell populations. Endo, endothelial cells; K2P, potassium 2-pore channels; Kv, voltage-gated potassium channels, CNG-gated, cyclic nucleotide-gated channels; Ca2+ act, calcium-activated channels.
Figure 5—figure supplement 2
Mouse lung cell expression of TNF family ligand and receptor genes.
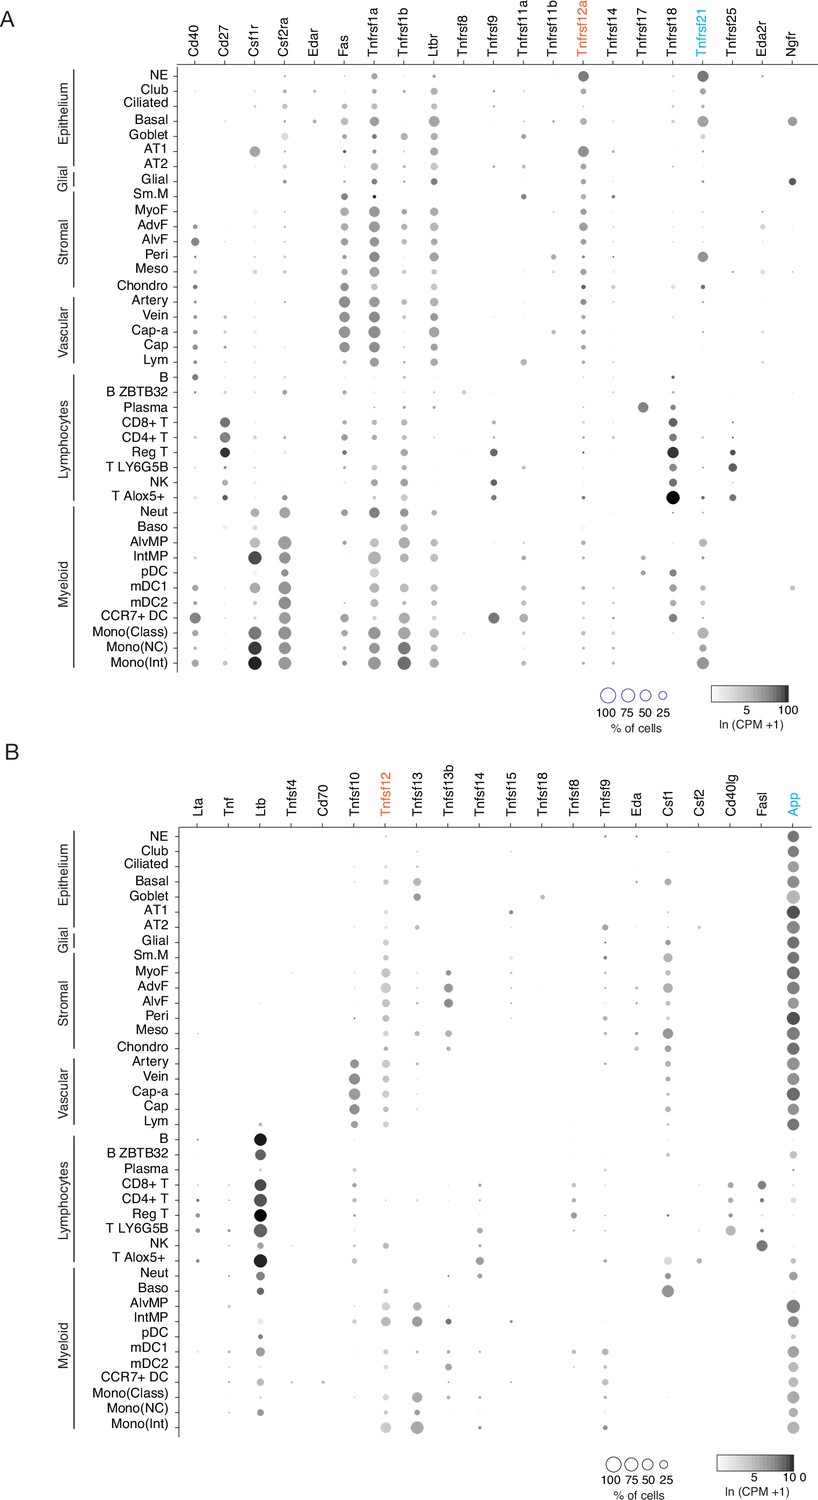
(A) scRNA-seq dot plots showing level of expression (dot intensity, ln (CPM + 1)) and percent of cells in population with detected expression (dot size) of TNF family receptor genes. Note PNEC (NE cell) expression of Tnfrsf12a (orange highlight) and Tnfrsf21 (blue). (B) scRNA-seq dot plots showing expression as above of TNF ligands. Note the expression of cognate ligands for the TNF receptors expressed in PNECs, Tnfsf12 (orange, ligand of Tnfrsf12a) and App (blue, ligand of Tnfrsf21). Cell types: NE, neuroendocrine (PNECs); AT1, alveolar epithelial cell, type 1; AT2, alveolar epithelial cell, type 2; Sm.M, smooth muscle; MyoF, myofibroblast; AdvF, adventitial fibroblast; AlvF, alveolar fibroblast; Peri, pericyte; Meso, mesothelial; Chondro, chondrocyte; Cap-a, capillary aerocyte; Cap, general capillary (Cap-g); Lym, lymphatic cell; B ZBTB32, B cells (ZBTB32+); Reg T, T cells (regulatory); T LY6G5B, T cells (LY6G5B+); NK, natural killer; T Alox5+, T cells (Alox5+); Neut, neutrophil; Baso, basophil; AlvMP, alveolar macrophage; IntMP, interstitial macrophage; pDC, plasmacytoid dendritic; mDC1, myeloid dendritic, type 1; mDC2, myeloid dendritic, type 2; CCR7+ DC, dendritic cell (Ccr7+); Mono(Class), monocyte (classical); Mono(NC), monocyte (non-classical); Mono(Int), monocyte (intermediate).
Figure 6 with 6 supplements

Expression of sensory and signaling genes in normal human PNECs and a pulmonary carcinoid.
(A) Histogram of peptidergic gene expression in normal human PNECs (n=55 PNECs from 2subjects) by scRNA-seq. Bars show percent of PNECs with detected expression of the indicated peptidergic gene; values above bars are mean gene expression (ln (CPM + 1)) in expressing cells. Peptidergic genes are listed in same order as orthologous mouse genes in Figure 1E, and ellipses show percent of mouse PNECs that express the orthologous genes (from Figure 1E, Supplementary file 4) for comparison. Among the 41 total peptidergic genes detected in human PNECs, the 14 genes at right ("human-specific") were expressed in human but not mouse PNECs; genes in parentheses were expressed only in mouse PNECs. *, previously known human PNEC peptidergic genes; blue font, classic hormone genes. Box and whisker plots (right) show quantification of peptidergic genes expressed per cell in human (H) and mouse (M) PNECs. Human values: 12.2±2.7 (mean ± SD; range 6–18, median 12, mode 12) expressed peptidergic genes. (B) Combinations of peptidergic genes expressed in individual human PNECs (n=55) from scRNA-seq. Histogram (top) shows number of PNECs expressing each of the 54 observed combinations of expressed peptidergic genes (dots, bottom). Values at right are mean expression (ln (CPM + 1)) of indicated gene in expressing cells. *, individual PNECs diagrammed in panel C (#38, blue; #50, magenta). (C) Schematics (as in Figure 5) of sensor and signal genes expressed by individual human PNECs (combination #38, cell ID F21_B001235; #50, cell ID D5_B003269). Sensory and secretory genes expressed by cell #50 and by either cell #38 or the composite tumor cell (in panel E) are highlighted in magenta. (D) Histogram as in panel A of peptidergic gene expression in PNEC-like tumor cells of a human bronchial carcinoid (n=330 profiled tumor cells from one subject) from scRNA-seq. Pink bars show percent of tumor cells with detected expression of the indicated peptidergic gene; values above bars are mean gene expression (ln (CPM + 1)) in expressing cells. To facilitate comparison, the percent of normal human PNECs that express each peptidergic gene (black ellipses, from panel A) and peptidergic gene expression in the single normal PNEC that most closely matches the tumor cell profile (magenta ellipses, PNEC #50 in panels B), (C) are included in plot. Tumor-specific (spec), peptidergic genes expressed in tumor but not normal PNECs. (E) Schematic (as in panel C) of sensor and signal genes expressed by a ‘composite’ carcinoid tumor cell (T) from data in D. Genes shown are those expressed in>15% of the profiled tumor cells, plus POMC (14% of tumor cells), INHBB (14%), and OPNSW1 (6%). Genes expressed by both ‘composite’ tumor cell and normal PNEC #50 (panel C) are highlighted in magenta.
Figure 6—figure supplement 1
Human PNEC markers.
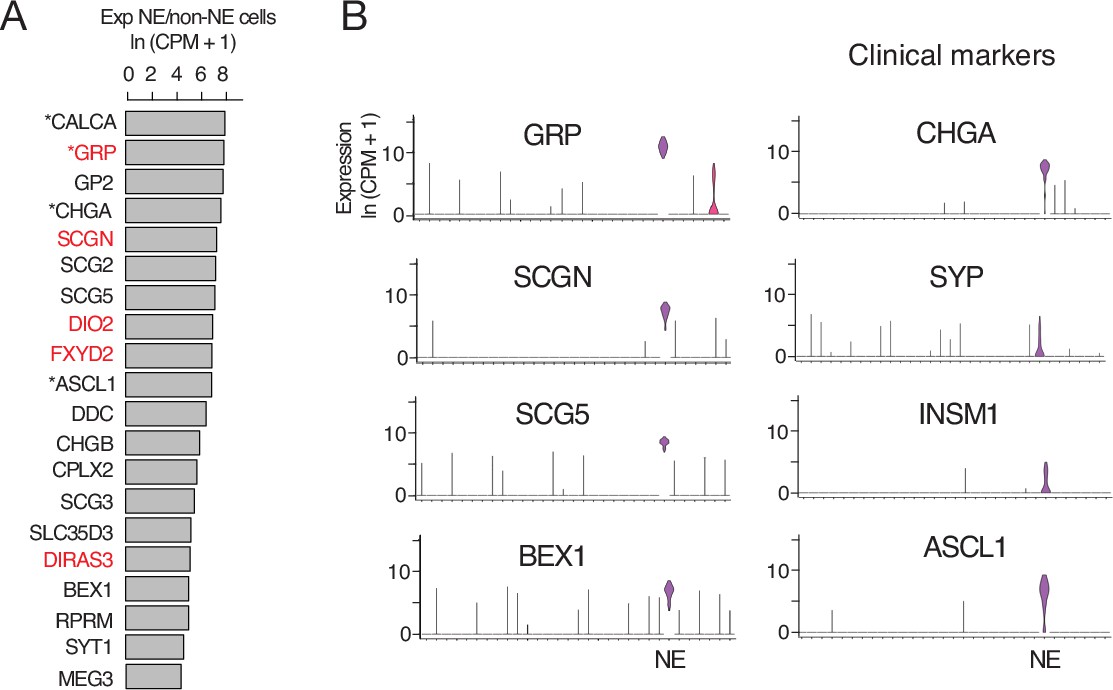
(A) Most sensitive PNEC-specific markers identified by scRNA-seq (SS2) of human PNECs. Markers are ranked by ratio of their expression (ln (CPM+ 1)) in PNECs (NE cells) to that of all other epithelial cells in human lung cell atlas (Travaglini et al., 2020). *, previously known PNEC marker. Red highlight, human-specific PNEC markers. (B) Violin plots comparing expression of most sensitive newly identified marker genes (left, GRP, SCGN, SCG5, BEX1) to the four PNEC markers used most often clinically (right). Note Secretogogin (SCGN) is a human-specific and highly sensitive and specific PNEC marker. GRP, gastrin-releasing peptide; SCGN, secretogogin; SCG5, secretogranin 5; BEX1, brain-expressed 1; CHGA, chromogranin A; SYP, synaptophysin; INSM1, insulinoma-associated 1; ASCL1, achaete-scute like homolog-1. Log-transformed expression values, ln (CPM+ 1).
Figure 6—figure supplement 2
Alternative splicing of CALCA transcripts in human PNECs.
(A) Sashimi plots as in Figure 3 for 20 randomly-selected CALCA-expressing human PNECs. Schematics (bottom) show structures of human reference mRNAs encoding either CGRP or calcitonin, with exons (boxes) numbered, and translational start site (arrowhead) and coding exons (blue fill) indicated. PNECs 1–7 expressed only calcitonin mRNAs and PNECs 8–20 expressed both calcitonin and CGRP mRNAs. (B) Quantification of CALCA alternative splicing in A. Note none of the human PNECs expressed exclusively CGRP mRNA, in contrast to mouse where most cells express both CGRP and calcitonin mRNA or exclusively CGRP (Figure 3).
Figure 6—figure supplement 3
Human lung cell expression of receptors for human PNEC neuropeptides, peptide hormones, and neurotransmitters.
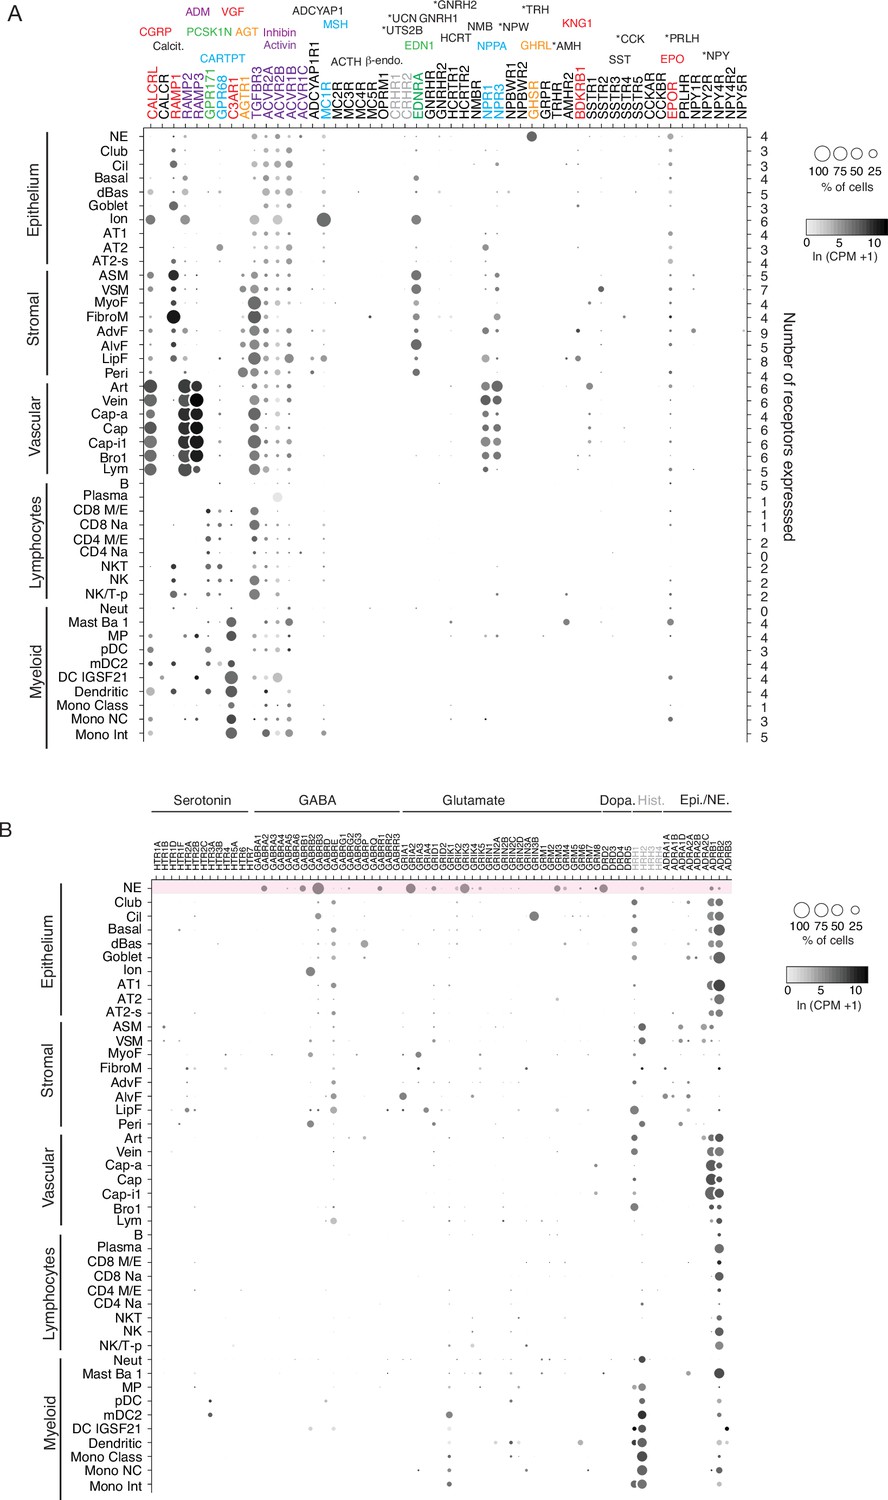
(A) scRNA-seq dot plots showing expression level (dot intensity) and percent of indicated human lung cell types with detected expression (dot size) of indicated receptor genes for PNEC peptidergic signals and neurotransmitters. Expression values from human lung cell atlas (Travaglini et al., 2020). The corresponding ligands for each receptor are shown above the receptor gene and color matched. Some receptor genes are subunits for more than one hormone (gray lettering) or not expressed in any cells in the human lung cell atlas (black lettering). No expression was detected for 17 of the 33 peptidergic PNEC signals including 10 of the 14 human-specific peptidergic signals (asterisks). Values (at right), number of PNEC peptidergic signal receptors expressed in at least 10% of the cells of that cell type. (B) Dotplots of receptor genes for neurotransmitters predicted to be made by human PNECs. Histamine receptors (grey) are also included because histamine is predicted to be made by mouse (though not human) PNECs (see Supplementary file 7). Top row (highlighted pink) shows neurotransmitter receptors expressed in human PNECs, predicting autocrine signaling. Cell types: NE, neuroendocrine (PNECs); Cil, ciliated; dBas, differentiating basal; Ion, ionocyte; AT1, type 1 alveolar epithelial cell; AT2, type 2 alveolar epithelial cell; AT2-s, AT2 signaling; ASM, airway smooth muscle, VSM, vascular smooth muscle; MyoF, myofibroblast; FibroM, fibromyocyte; AdvF, adventitial fibroblast; AlvF, alveolar fibroblast; LipF, lipofibroblast; Peri, pericyte; Art, artery; Cap-a, aerocyte; Cap, general capillary (Cap-g); Cap-i1, capillary intermediate 1cell; Bro1, bronchial vessel 1cell; Lym, lymphocytes; B, B cells; CD8 M/E, CD8+ memory/effector T; CD8 Na, CD8+ Naïve T; CD4 M/E, CD4+ memory/effector T; CD4 Na, CD4+ Naïve T; NKT, natural killer T cell; NK/T-p, proliferating natural killer/T cells; Neut, neutrophils; Mast Ba 1; MP, macrophage; pDC, plasmacytoid dendritic cell; mDC2, myeloid dendritic cell 2; DC IGSF21, IGSF21+ dendriticcell; Mono Class, classical monocyte; Mono NC, non-classical monocyte; Mono Int, intermediate monocyte.
Figure 6—figure supplement 4
Patterns of sensory gene expression in human PNECs.
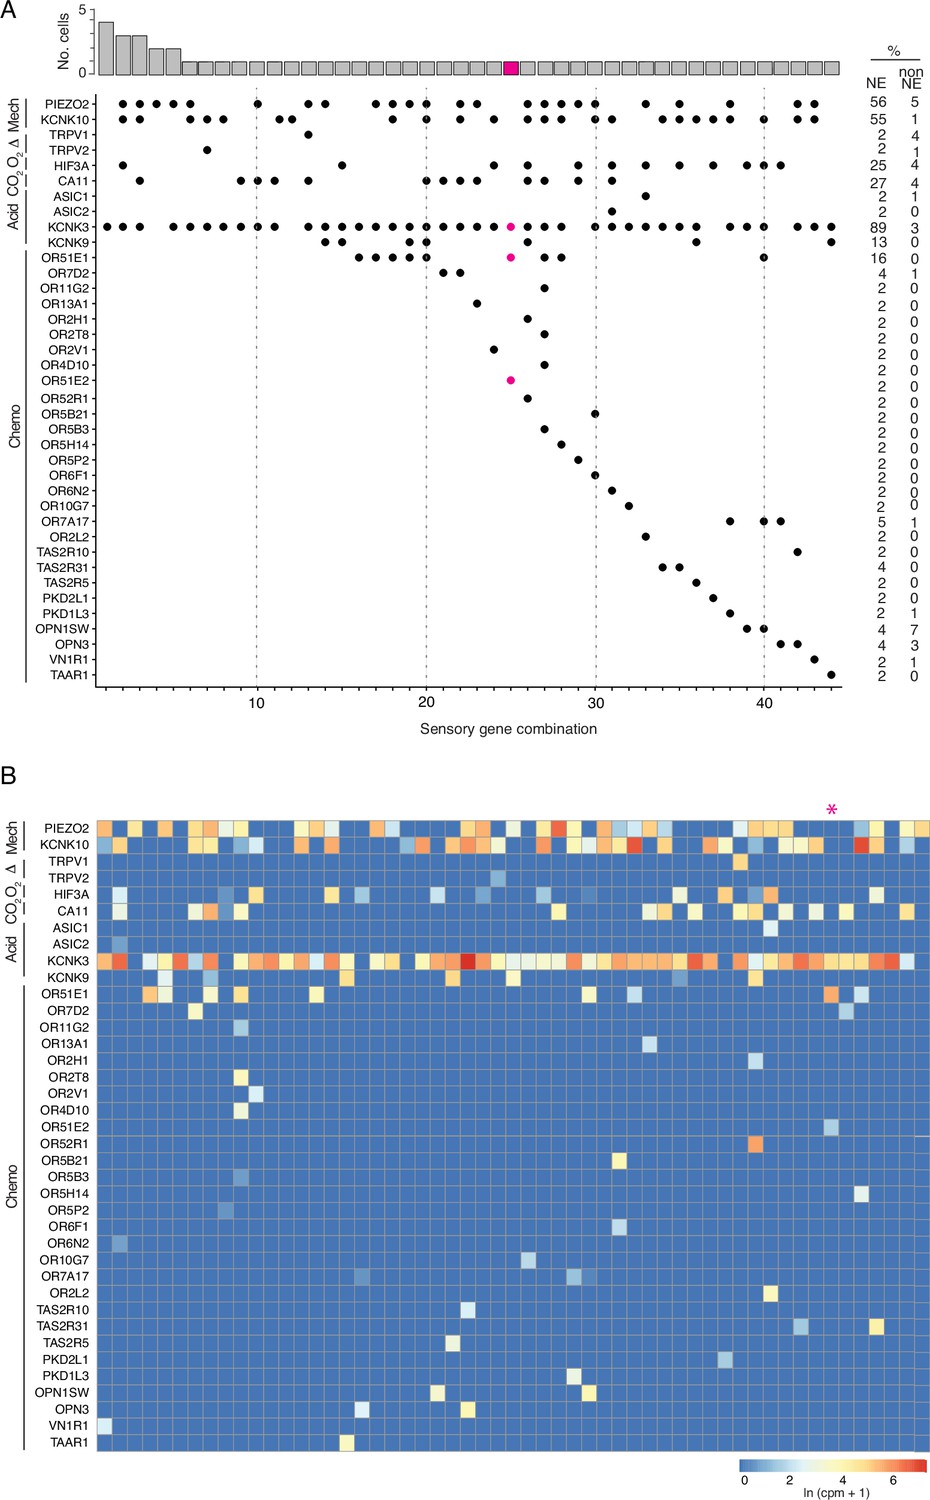
(A) Patterns of expression of sensory ion channels and other sensory genes (dots, expressed genes) in individual PNECs from scRNA-seq profiles (n=55 PNECs). Columns show the 40 identified combinations of expressed sensory genes, and histogram (top) shows number of profiled PNECs expressing each combination. Note sensory gene combination 25 (highlighted in magenta, cell ID, N1_B00124) is a PNEC that appears specialized for oxygen sensing because it expresses OR51E1 and OR51E2, a close family member and ortholog of Olfr78 implicated in acute hypoxia-sensing in mouse carotid body (Chang et al., 2015), and acid-sensitive channel KCNK3 but no mechanosensory channels. Values at right are percent of PNECs (NE) and other (non-NE) profiled cells that express the gene. Mech, mechanosensory; Therm, thermosensing; O2, oxygen-sensing; Acid, acid-sensing; CO2, carbonic anhydrases; Chemo, chemosensory genes. (B) Heatmaps showing log-transformed expression values (ln (CPM + 1)) for the sensory genes in panel A in the 55 PNECs (columns).
Figure 6—figure supplement 5
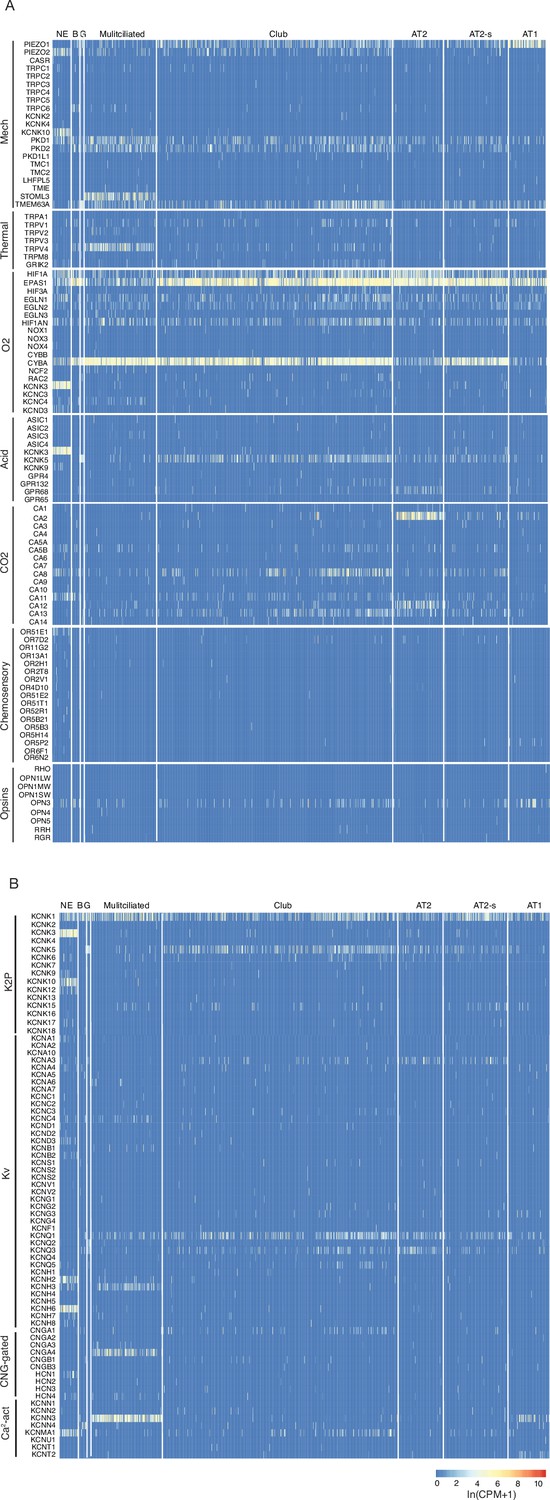
Human lung cell expression of sensory genes and potassium and calcium channel genes.
(A) Heatmaps showing log-transformed expression values (ln (CPM + 1)) for selected genes of the indicated sensory modalities in PNECs and other human lung epithelial cells (Travaglini et al., 2020). Cell types: NE, neuroendocrine (PNECs); B, basal; G, goblet; Multiciliated, multiciliated; AT2, alveolar type 2cells; AT2-s, alveolar type 2 signaling; AT1, alveolar type 1; Mechano, mechanosensory; O2, oxygen-sensing; Acid, acid-sensitive channel; CO2, carbonic anhydrases. Oxygen sensory genes include genes of the NADPH-oxidase complex previously implicated in PNEC oxygen sensing. See Supplementary file 7 for full set of gene names and annotations. (B) Heatmaps as above showing expression of voltage and ligand-gated potassium and calcium channels. K2P, potassium 2-pore channel; Kv, voltage-gated potassium channel; CNG-gated, cyclic nucleotide-gated channel; Ca2-act, calcium-activated channel.
Figure 6—figure supplement 6
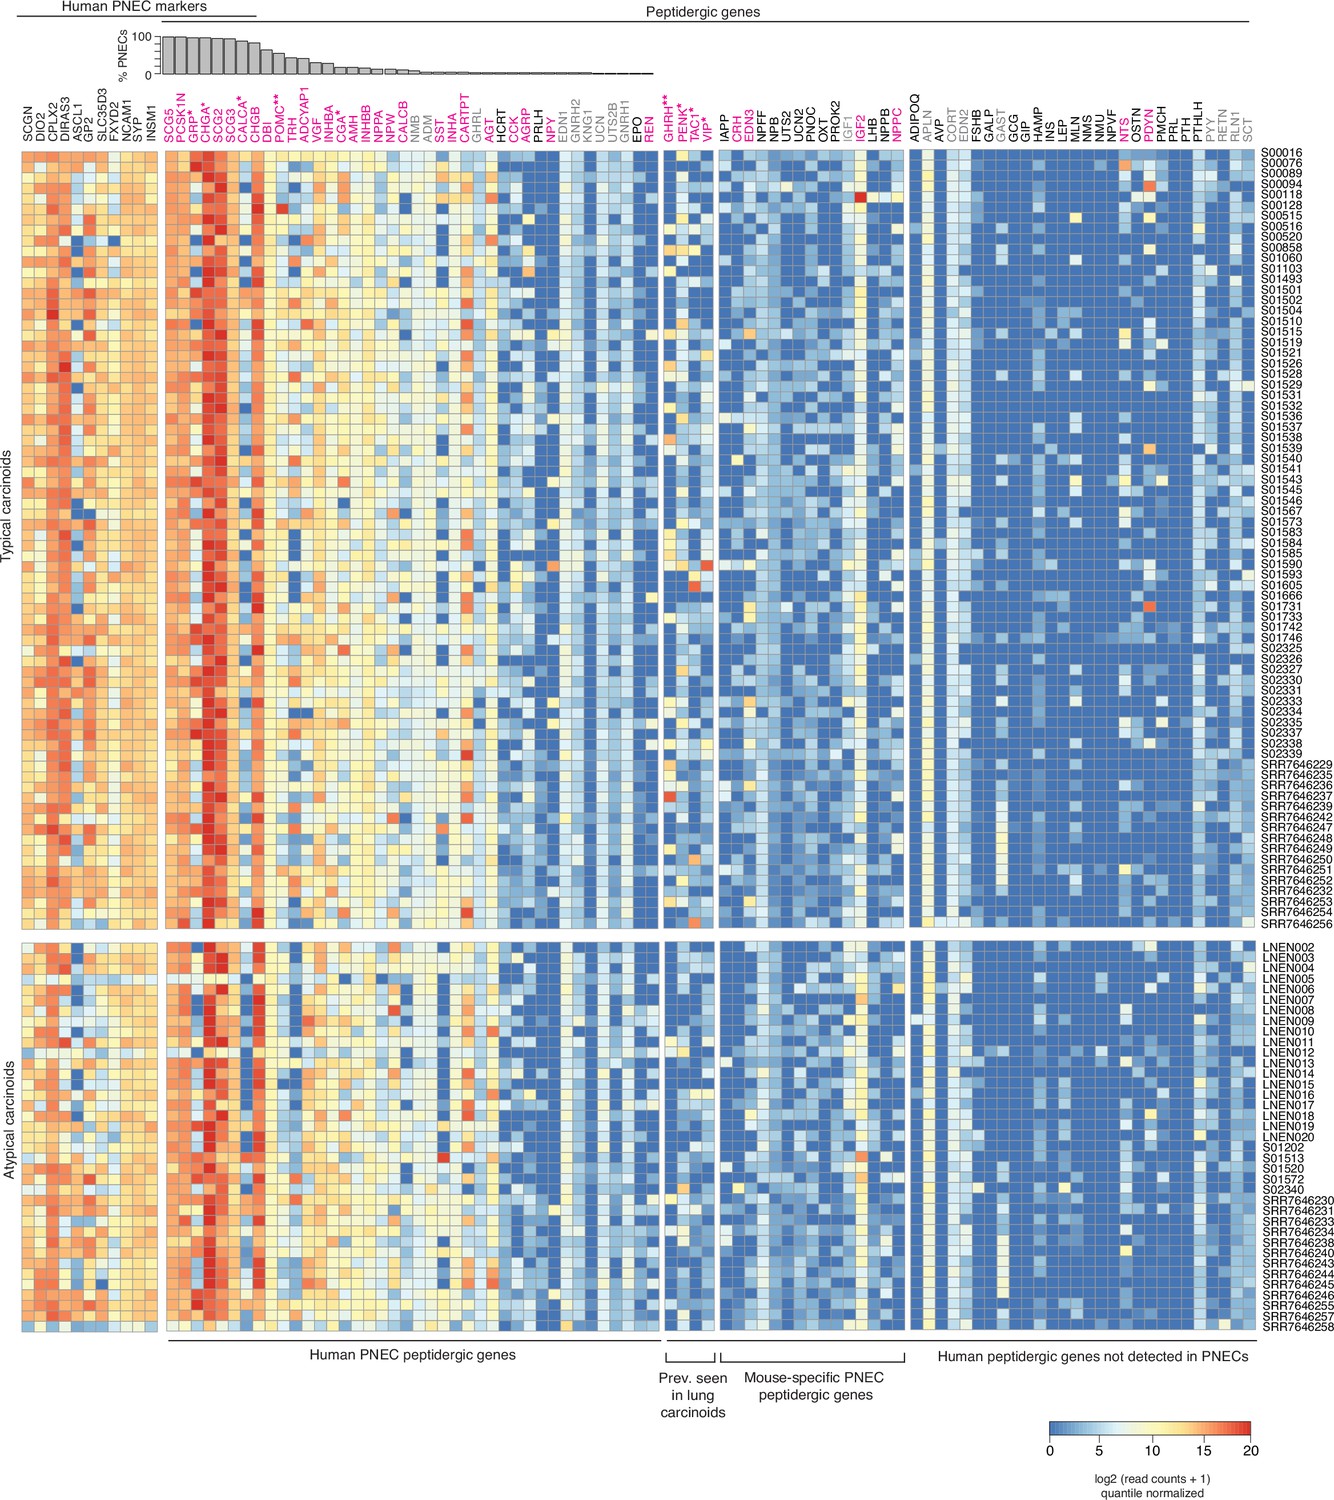
Expression of peptidergic genes in human lung carcinoids profiled by bulk RNA-seq.
Heatmap showing log-transformed, quantile-normalized expression levels of all human peptidergic genes, and for comparison the top PNEC markers indicated, in 74 histopathologically ‘typical’ and 37 ‘atypical’ human lung carcinoids transcriptomically profiled by bulk RNA-seq (patient identifiers at right; Alcala et al., 2019; Fernandez-Cuesta et al., 2014; Laddha et al., 2019). Histogram shows fraction of normal human PNECs that express each peptidergic gene (from Figure 6A). Magenta font, peptidergic genes with prominent expression in at least some patients; gray font, uniform but low/moderate expression of peptidergic genes, which could derive from tumor-infiltrating cells rather than the tumor cells themselves (e.g., Apln could derive from tumor-infiltrating capillary cells Gillich et al., 2020). *, peptidergic genes previously reported in lung carcinoids. **, peptidergic genes associated with established endocrinopathies of lung carcinoids. Prev., previously.
Tables
Key resources table
| Reagent type (species) or resource | Designation | Source or reference | Identifiers | Additional information |
|---|---|---|---|---|
| Antibody | Anti-PC1/Pcsk1 (rabbit polyclonal) | Abcam | Cat# ab3532, RRID:AB_303882 | 1:750 dilution |
| Antibody | Anti-CGRP (rabbit polyclonal) | Sigma | Cat# C8198, RRID:AB_259091 | 1:500 dilution |
| Antibody | Anti-POMC (rabbit polyclonal) | Phoenix Pharmaceuticals | Cat# H-029–30 | 1:500 dilution |
| Antibody | Anti-CARTPT (rabbit polyclonal) | Phoenix Pharmaceuticals | Cat# H-003–62 | 1:2000 dilution |
| Antibody | APC–conjugated anti-mouse CD31 (mouse monoclonal) | BioLegend | Cat# 102409 | 1:800 dilution |
| Antibody | APC-anti-mouse CD45 (mouse monoclonal) | BioLegend | Cat# 103111 | 1:800 dilution |
| Antibody | APC-anti-mouse F4/80 (mouse monoclonal) | BioLegend | Cat# 123115, clone BM8 | 1:800 dilution |
| Antibody | PE-Cy7-conjugated anti-mouse CD326 (mouse monoclonal) | Thermo Fisher Scientific | Cat# 25-5791-80, clone G8.8 | 1:400 dilution |
| Antibody | Anti-IgG A488 (goat polyclonal) | Invitrogen | Cat# A11034 | 1:250 dilution |
| Antibody | Anti-IgG A555 (goat polyclonal) | Invitrogen | Cat# A21229 | 1:250 dilution |
| Antibody | Anti-IgG A633 (goat polyclonal) | Invitrogen | Cat# | 1:250 dilution |
| Antibody | Anti-rat IgG (donkey polyclonal) | Jackson ImmunoResearch | Cat# 712-605-153 | 1:250 dilution |
| Biological sample (Homo sapiens, male and female) | Lung tissue | Stanford University | NA | NA |
| Biological sample (H. sapiens, female) | Human pulmonary carcinoid tissue | Stanford University | NA | NA |
| Strain, strain background (Mus musculus, male and female) | Wild type: CD-1 and C57BL/6NJ | Charles River | Strain Code 022, Strain Code 027 | NA |
| Strain, strain background (M. musculus, male and female) | Ascl1CreERT2 | Kim et al., 2011a. PMID:21483754 | NA | NA |
| Strain, strain background (M. musculus, male and female) | Agtr1a-Cre; B6(C3)-Agtr1atm1.1(cre)Ekrs/J | The Jackson Laboratory | JAX: 030553 | NA |
| Strain, strain background (M. musculus, male and female) | Agtr1a-2A-Cre; B6.FVB-Agtr1aem1(cre)Zak/J | The Jackson Laboratory | JAX: 031487 | NA |
| Strain, strain background (M. musculus, male and female) | Calb1-2A-dgCre: B6.Cg-Calb1tm1.1(folA/cre)Hze | The Jackson Laboratory | JAX: 023531 | NA |
| Strain, strain background (M. musculus, male and female) | Mouse: Rosa26Zsgreen1, B6.Cg-Gt(ROSA)26Sortm6(CAG-ZsGreen1)Hze/J | Madisen et al., 2009 | Stock No: 007906 | NA |
| Commercial assay or kit | RNAscope Hiplex in situ hybridization assay | Advanced Cell Diagnostics (ACD) | Cat#324140 | NA |
| Commercial assay or kit | RNAscope Hiplex assay probe Mm-Agt-T1 | Advanced Cell Diagnostics (ACD) | Cat#426941-T1 | NA |
| Commercial assay or kit | RNAscope Hiplex assay probe Mm-Nmb-T2 | Advanced Cell Diagnostics (ACD) | Cat#459931-T2 | NA |
| Commercial assay or kit | RNAscope Hiplex assay probe Mm-Adcyap1-T3 | Advanced Cell Diagnostics (ACD) | Cat#405911-T3 | NA |
| Commercial assay or kit | RNAscope Hiplex assay probe Mm-Cartpt-T5 | Advanced Cell Diagnostics (ACD) | Cat#432001-T5 | NA |
| Commercial assay or kit | RNAscope Hiplex assay probe Mm-Pomc-T6 | Advanced Cell Diagnostics (ACD) | Cat#314081-T6 | NA |
| Commercial assay or kit | RNAscope Hiplex assay probe Mm-Chga-T9 | Advanced Cell Diagnostics (ACD) | Cat#447851-T9 | NA |
| Commercial assay or kit | RNAscope Hiplex assay probe Mm-Calca-T7 | Advanced Cell Diagnostics (ACD) | Custom probe | NA |
| Commercial assay or kit | RNAscope Hiplex assay probe Mm-Scg5-T10 | Advanced Cell Diagnostics (ACD) | Custom probe | NA |
| Software, algorithm | Integrative Genomics Viewer (IGV v2.4.14) | Katz et al., 2010. PMID:21057496 | https://software.broadinstitute.org/software/igv/ | NA |
| Software, algorithm | Seurat v2.3.4 | Butler et al., 2018. PMID:29608179 | https://satijalab.org/seurat/ | NA |
Additional files
-
Supplementary file 1
Mouse airway neuroendocrine cell markers.
- https://cdn.elifesciences.org/articles/78216/elife-78216-supp1-v1.docx
-
Supplementary file 2
Extant PNEC markers.
- https://cdn.elifesciences.org/articles/78216/elife-78216-supp2-v1.docx
-
Supplementary file 3
Expression of neurotransmitter biosynthetic, vesicular loading and reuptake genes in mouse PNECs.
- https://cdn.elifesciences.org/articles/78216/elife-78216-supp3-v1.docx
-
Supplementary file 4
Summary of mouse and human peptidergic gene expression in PNECs.
- https://cdn.elifesciences.org/articles/78216/elife-78216-supp4-v1.docx
-
Supplementary file 5
PNEC peptidergic genes, receptors, and classic functions.
- https://cdn.elifesciences.org/articles/78216/elife-78216-supp5-v1.docx
-
Supplementary file 6
Sensory genes (mouse).
(a) Mechanical. (b) Thermal. (c) Mrgprs. (d) Acid. (e) Oxygen. (f) CO2. (g) TRP family. (h) Olfactory. (i) Pheromone. (j) Taste. (k) K2P channels. (l) Kv channels.
- https://cdn.elifesciences.org/articles/78216/elife-78216-supp6-v1.xlsx
-
Supplementary file 7
Sensory genes (human).
(a) Mechanical. (b) Thermal. (c) Mrgprs. (d) Acid. (e) Oxygen. (f) CO2. (g) TRP family. (h) Olfactory. (i) Pheromone. (j) Taste. (k) K2P channels. (l) Kv channels.
- https://cdn.elifesciences.org/articles/78216/elife-78216-supp7-v1.xlsx
-
Supplementary file 8
Expression of neurotransmitter biosynthetic, vesicular loading and reuptake genes in human PNECs.
- https://cdn.elifesciences.org/articles/78216/elife-78216-supp8-v1.docx
-
MDAR checklist
- https://cdn.elifesciences.org/articles/78216/elife-78216-mdarchecklist1-v1.docx
Download links
A two-part list of links to download the article, or parts of the article, in various formats.
Downloads (link to download the article as PDF)
Open citations (links to open the citations from this article in various online reference manager services)
Cite this article (links to download the citations from this article in formats compatible with various reference manager tools)
Neuroendocrinology of the lung revealed by single-cell RNA sequencing
eLife 11:e78216.
https://doi.org/10.7554/eLife.78216


