SARS-CoV-2 antibody dynamics in blood donors and COVID-19 epidemiology in eight Brazilian state capitals: A serial cross-sectional study
- Department of Electronic Systems Engineering, University of São Paulo, Brazil
- Imperial College London, United Kingdom
- MRC Centre for Global Infectious Disease Analysis, Imperial College London, United Kingdom
- Abdul Latif Jameel Institute for Disease and Emergency Analytics, Imperial College London, United Kingdom
- Faculdade Ciências Médicas de Minas Gerais, Brazil
- Universidade Federal do ABC, Brazil
- Institute for Applied Economic Research (Ipea), Brazil
- Fundação Oswaldo Cruz, Brazil
- Universidade Federal do Ceará, Brazil
- Fundação Pró Sangue Hemocentro de São Paulo (FPS), Brazil
- Centro de Hematologia e Hemoterapia do Paraná (HEMEPAR), Brazil
- Fundação Hospitalar de Hematologia e Hemoterapia do Amazonas (HEMOAM), Brazil
- Fundação de Hematologia e Hemoterapia da Bahia (HEMOBA), Brazil
- Centro de Hematologia e Hemoterapia do Ceará (HEMOCE), Brazil
- Fundação HEMOMINAS, Brazil
- Fundação de Hematologia e Hemoterapia de Pernambuco (HEMOPE), Brazil
- Instituto Estadual de Hematologia Arthur de Siqueira Cavalcanti (HEMORIO), Brazil
- Universidade Federal do Amazonas, Brazil
- Centro Universitário do Norte, Brazil
- Vitalant Research Institute, United States
- University of California, San Francisco, United States
- Harvard TH Chan School of Public Health, United States
- Department of Zoology, University of Oxford, United Kingdom
- Instituto de Medicina Tropical, University of São Paulo, Brazil
Figures
Figure 1
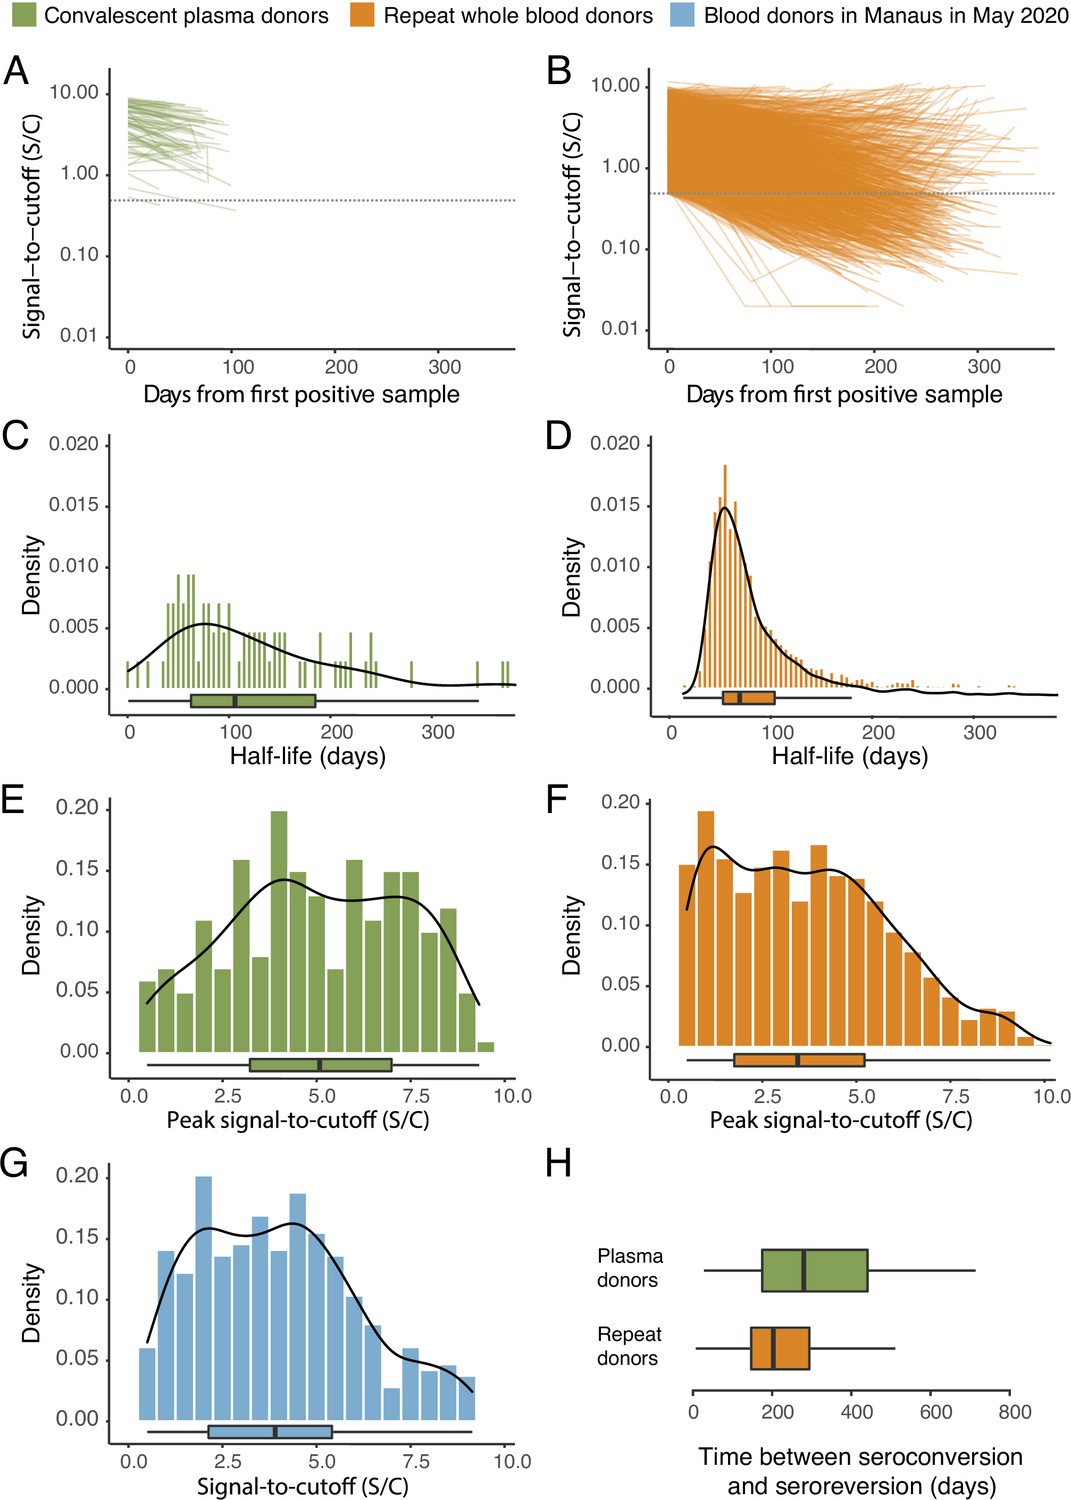
SARS-CoV-2 anti-nucleocapsid (N) IgG dynamics in mild and moderate disease cohorts.
(A) and (B) Trajectories of signal-to-cutoff (S/C) values for the Abbott anti-N chemiluminescent microparticle immunoassays in 218 SARS-CoV-2-infected convalescent plasma donors (A) and 7675 repeat whole blood donors (B). Time is measured from the first positive test. (C) and (D) Probability distribution of the half-lives following infection in SARS-CoV-2-infected convalescent plasma donors (C) and repeat whole blood donors (D). Binned (bars) and smoothed kernel (lines) densities are shown. (E), (F), and (G) Comparison of the probability distribution of the highest S/C measured in plasma donors and seropositive repeat blood donors that donated before 31 May 2020 and the S/C distribution in Manaus in May 2020. (H) Estimated time between seroconversion and seroreversion (positive-negative conversion) at a threshold of 0.49 S/C for repeat blood donors and convalescent plasma donors. In all figures, box plots show the median (central lines), interquartile range (hinges), and range extending to 1.5 times the interquartile range from each hinge (whiskers).
Figure 2 with 2 supplements
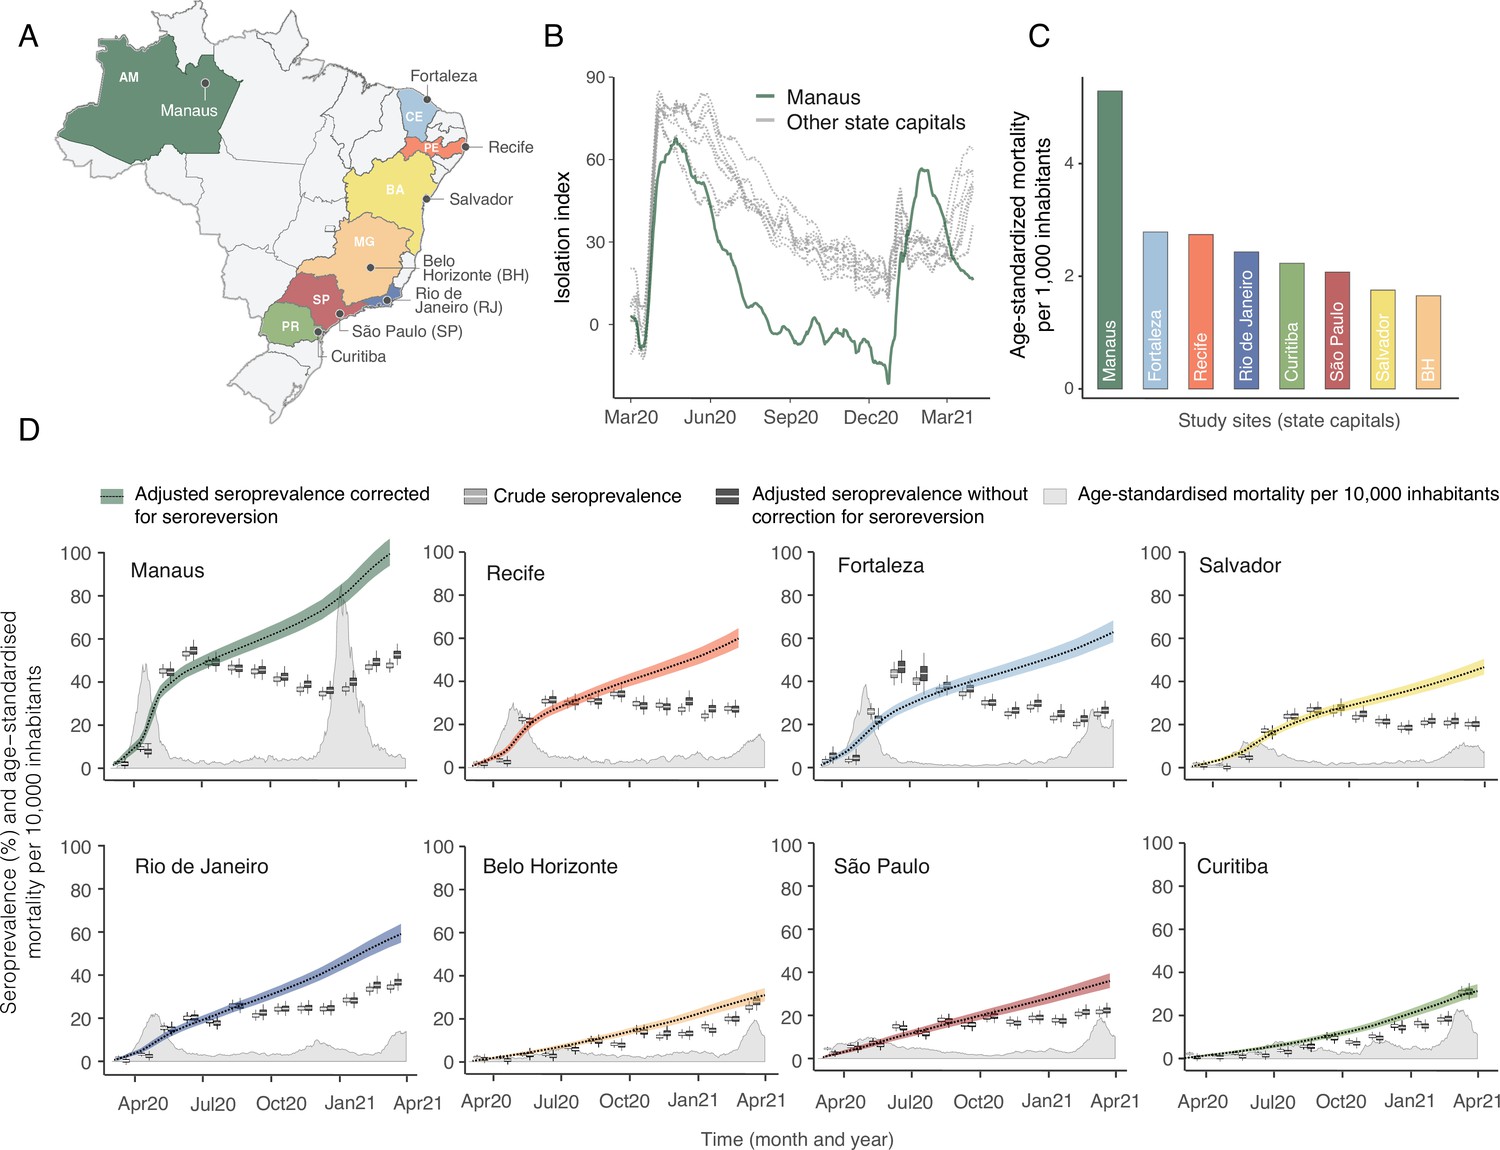
Overview of study site locations, mortality, and mobility data.
(A) Map of the Brazilian states with the location of the eight capital cities. (B) Homestay index for the eight cities. Data were obtained from Fiocruz, available at https://bigdata-covid19.icict.fiocruz.br/. (C) Cumulative mortality due to severe acute respiratory syndrome (SIVEP-Gripe system) standardised for age and sex by the direct method using the total Brazilian age-sex structure as reference. Cumulative over the period from 1 March 2020 to 31 March 2021. (D) Weekly SARS-CoV-2 seroprevalence in blood donors across eight Brazilian state capitals. Three seroprevalence estimates are shown: (i) crude seroprevalence (i.e. the proportion of positive tests); (ii) seroprevalence adjusted for sensitivity, specificity, and reweighted by age and sex but not corrected for seroreversion; and (iii) adjusted seroprevalence estimated by our seroreversion corrected model (continuous curves), which accounts for seroreversion in addition to sensitivity, specificity, and age-sex distribution. Both infections and reinfections in seronegative donors are considered to estimate the adjusted seroprevalence, which can surpass 100%. The grey-filled curve shows age-standardised mortality per 10,000 residents. Ribbons and whiskers represent 95% Bayesian credible intervals.
Figure 2—figure supplement 1
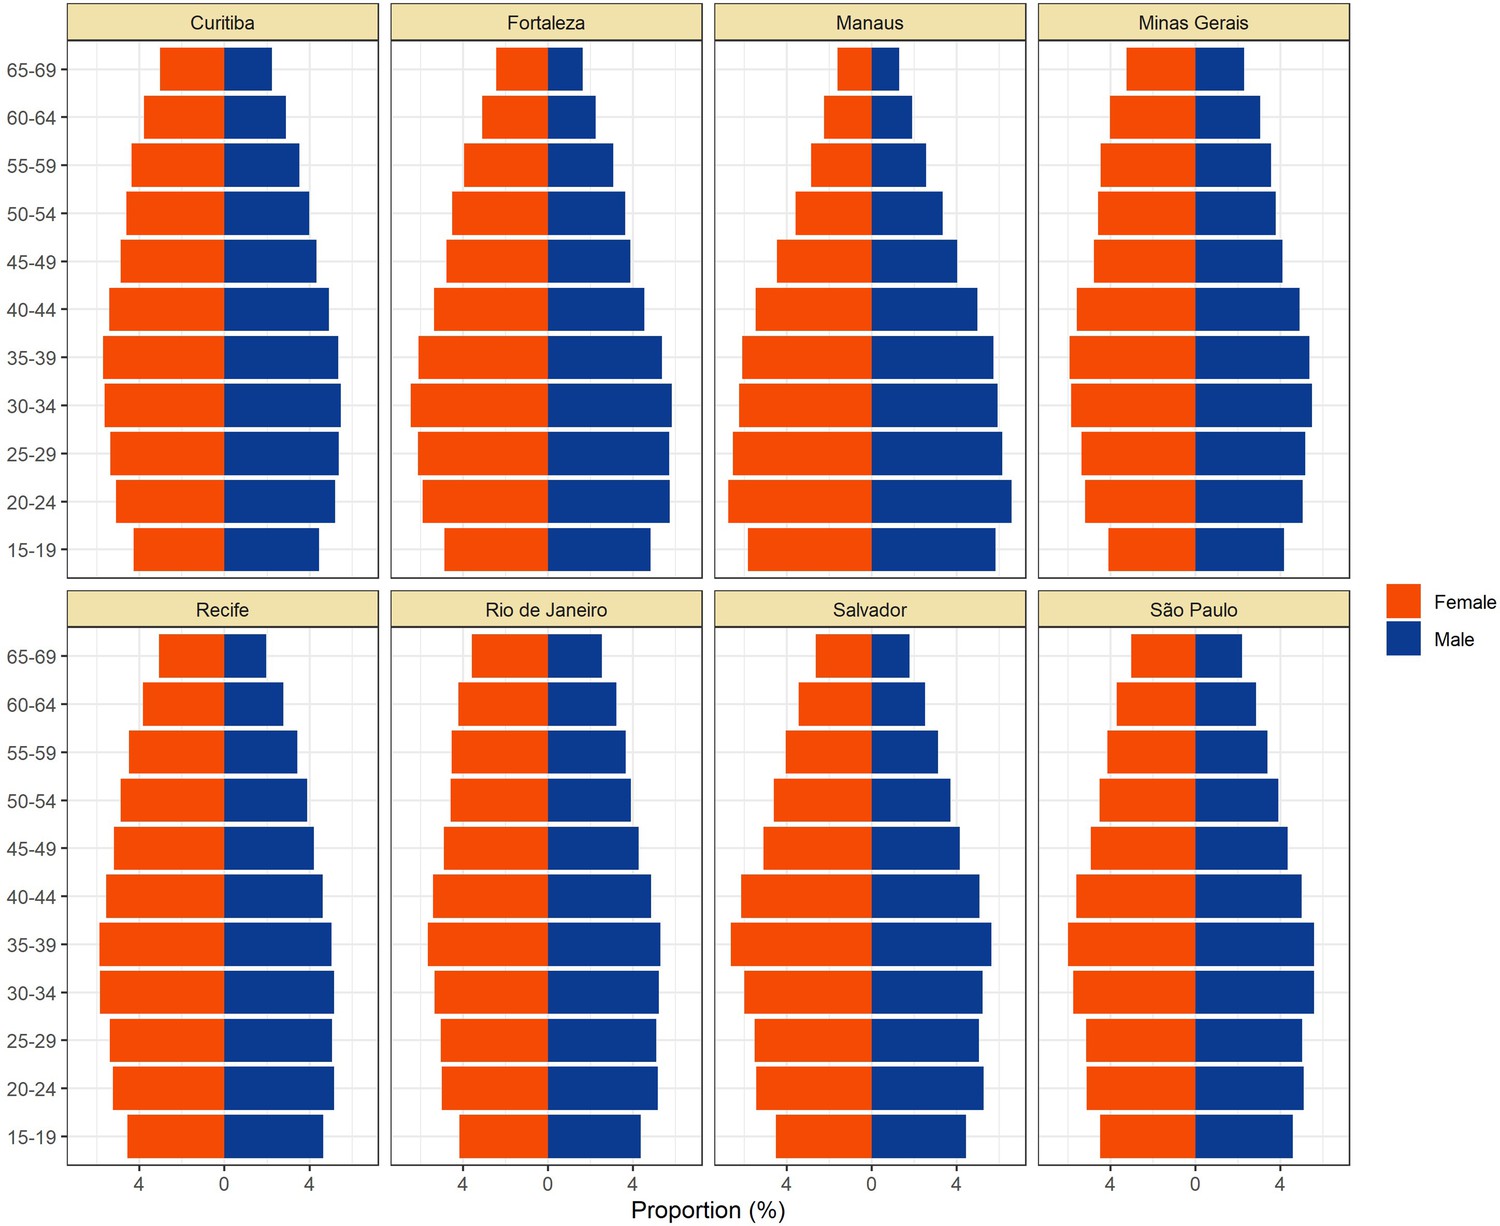
Population pyramids for the eight cities obtained from the projected population estimates for 2020.
Data was extracted from https://demografiaufrn.net/laboratorios/lepp/. The proportions are relative to the population between 15 and 69.
Figure 2—figure supplement 2
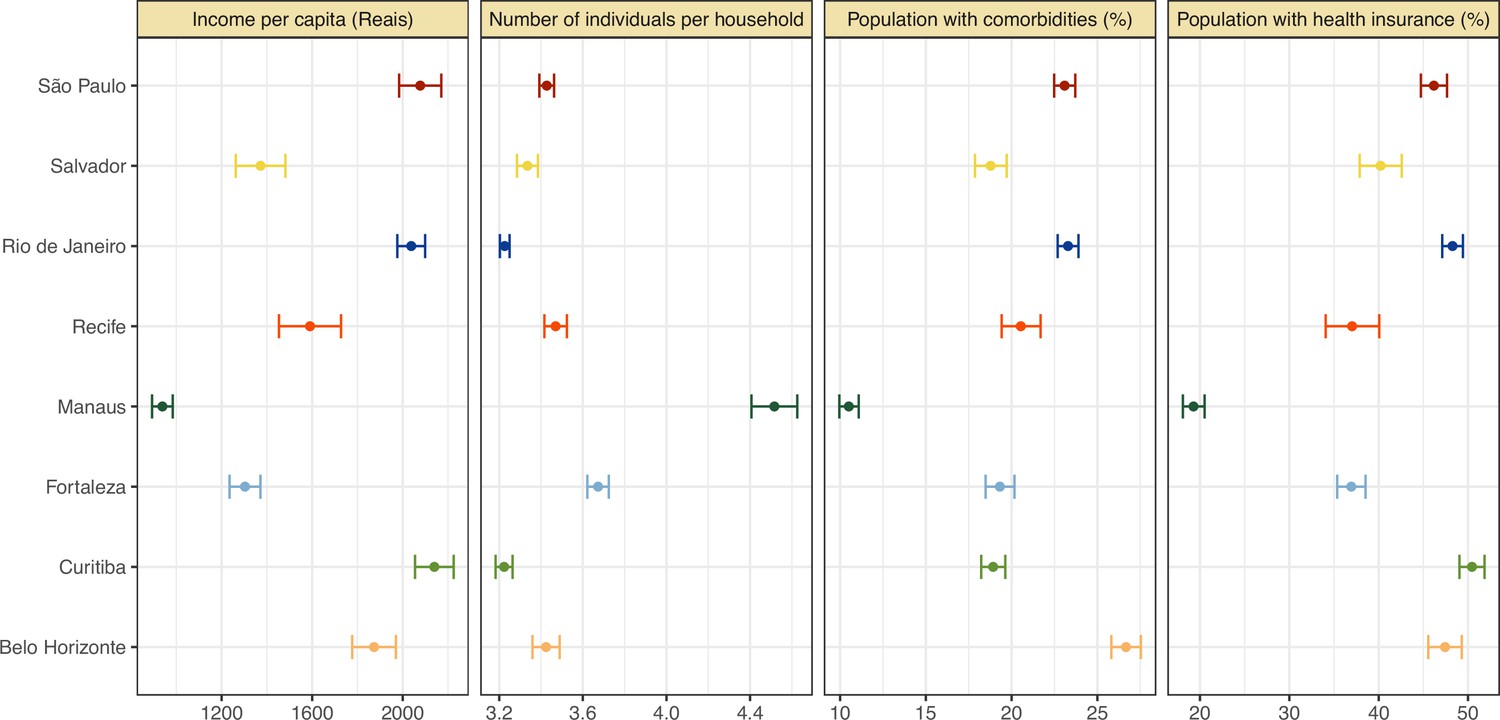
Proportion of population with health insurance, any comorbidity, number of individuals per household, and income per capita for each municipality.
The information on health insurance, incidence of comorbidities, number of individuals per household, as well as household income per capita was retrieved from the National Household Sample Survey (Pesquisa Nacional por Amostra de Domicílios COVID-19), a national telephone survey conducted by the Brazilian Institute of Geography and Statistics (IBGE) with over 1,888,560 interviews between May and September 2020. The data on comorbidities included chronic obstructive pulmonary disease, diabetes, hypertension, or cardiovascular disease such as myocardial infarction, angina, or heart failure.
Figure 3
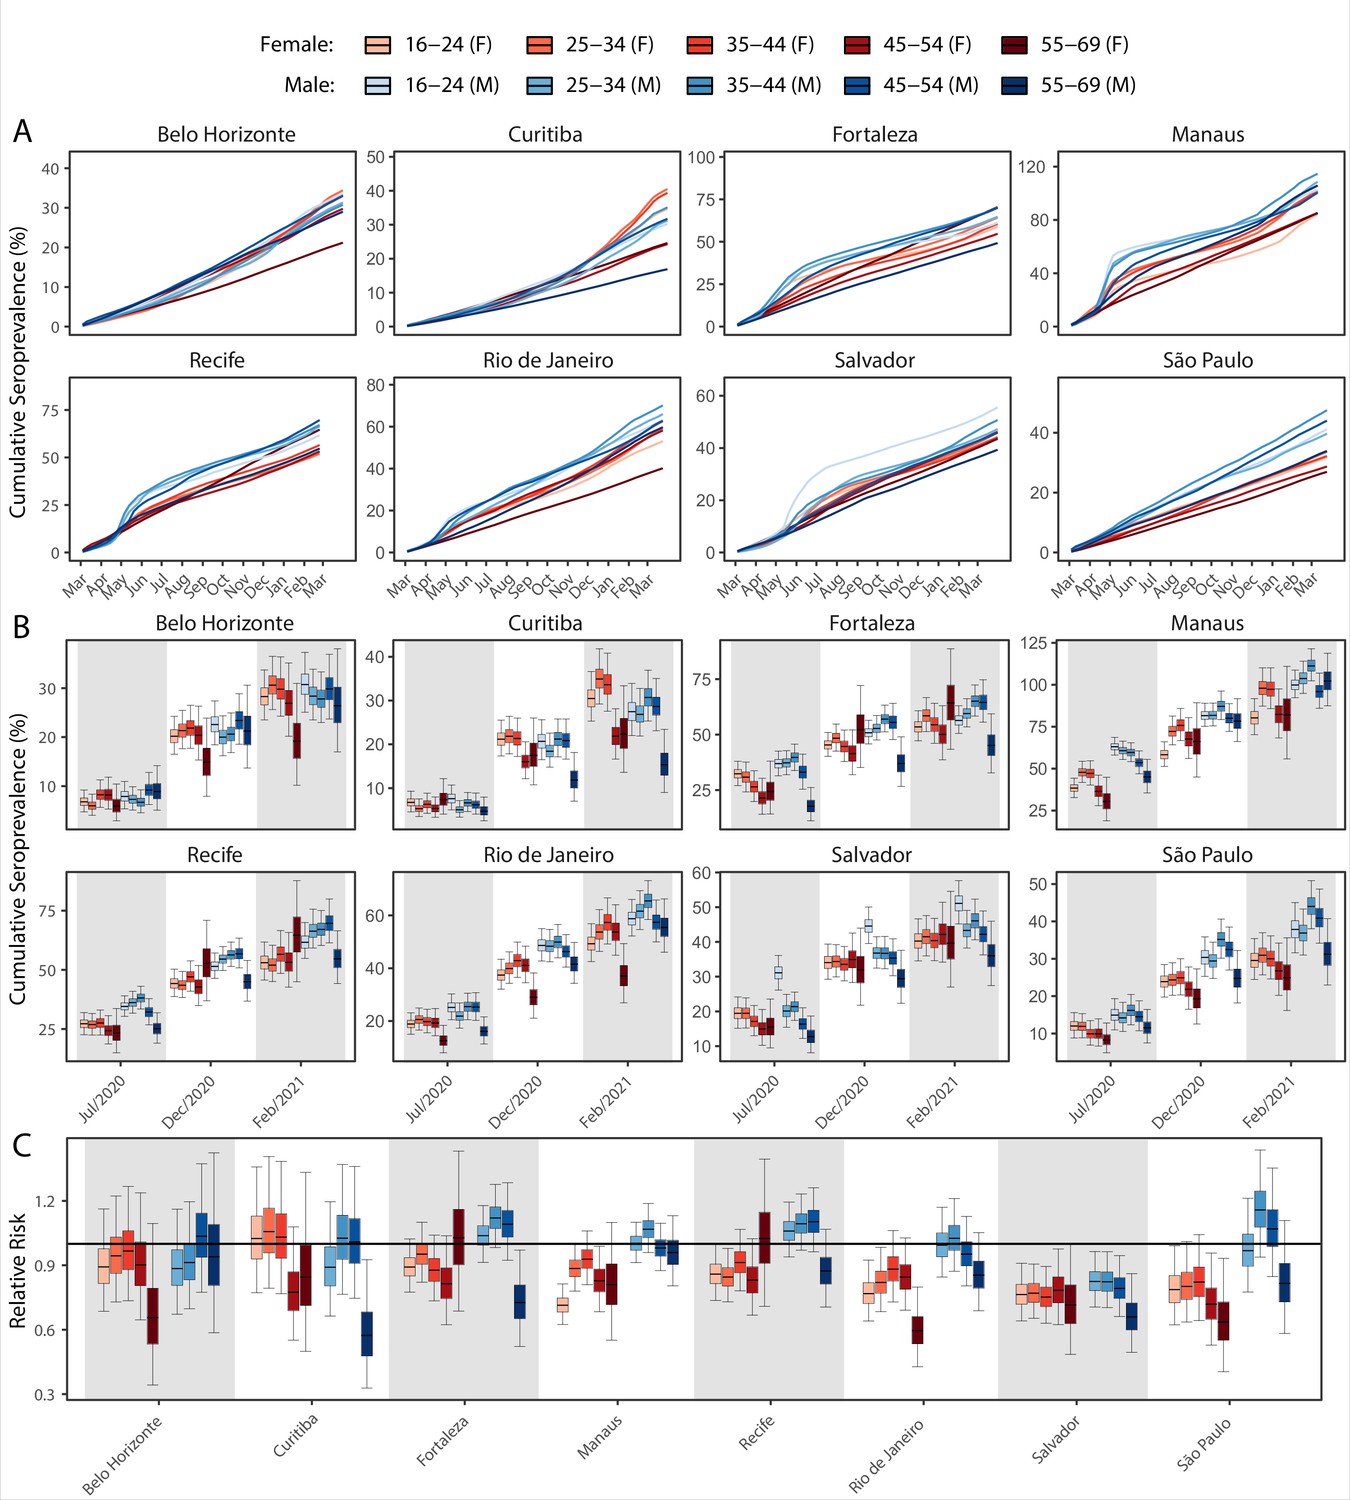
Age-sex patterns in blood donor seroprevalence in eight Brazilian cities.
(A) Estimated cumulative seroprevalence by age-sex group. (B) Transversal cuts of figure (A) on 8 July 2020, 16 December 2020, and 24 February 2021 (last week where seroprevalence was estimated for all cities). (C) Relative risk of the cumulative seroprevalence estimated in December 2020 with men aged 16–24 as the reference category in each city. Note that since cities use different values as reference, only relative risks of age-sex groups from the same city can be compared. Box plots show posterior distributions of the relative risks, with the median (central lines), interquartile range (hinges), and 95% confidence intervals (whiskers).
Figure 4 with 1 supplement

Infection fatality rates (IFRs) in eight Brazilian state capitals as of 15 December 2020.
The number of deaths was obtained from the SIVEP-Gripe reporting system including all SARI deaths with symptom onset between 1 March 2020 and 15 December 2021. (A) Age-specific IFRs. (B) Association between age-standardised mortality rate and cumulative seroprevalence in blood donors for each of the eight cities by December 2020. The black line is a linear regression fit to the coloured points, each representing one of the eight cities. (C) Crude and age-adjusted overall IFRs, for the age range of 16–64 years, in each of the eight participating cities. (D) Overall IFR of the eight cities for the age range of 16–64 years obtained with our age-specific IFR estimates compared with the overall IFR calculated using age-specific IFRs from Brazeau et al., 2020 and O’Driscoll et al., 2021.
Figure 4—figure supplement 1
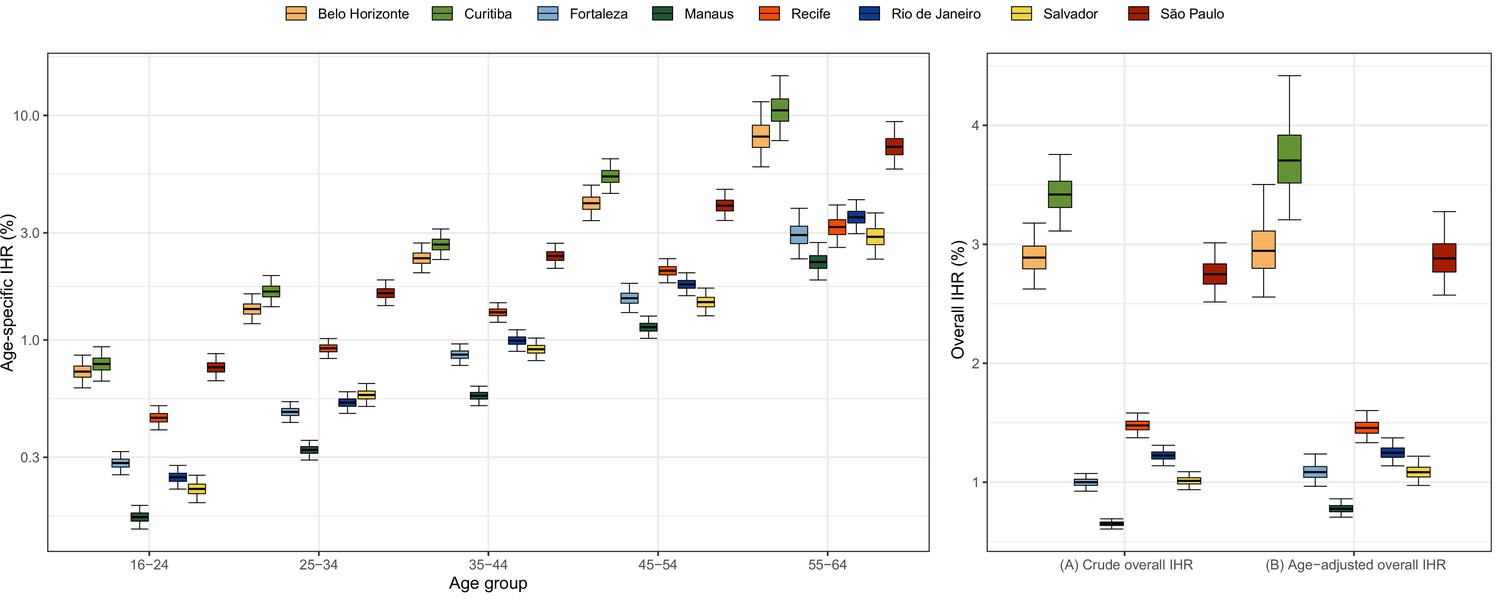
Estimated age-specific and overall infection hospitalisation rates (IHRs) for the eight cities in the period between March and December 2020.
Note that IHR depends not only on intrinsic disease severity but also on access to healthcare and availability of hospital resources, which can vary across cities.
Figure 5 with 1 supplement
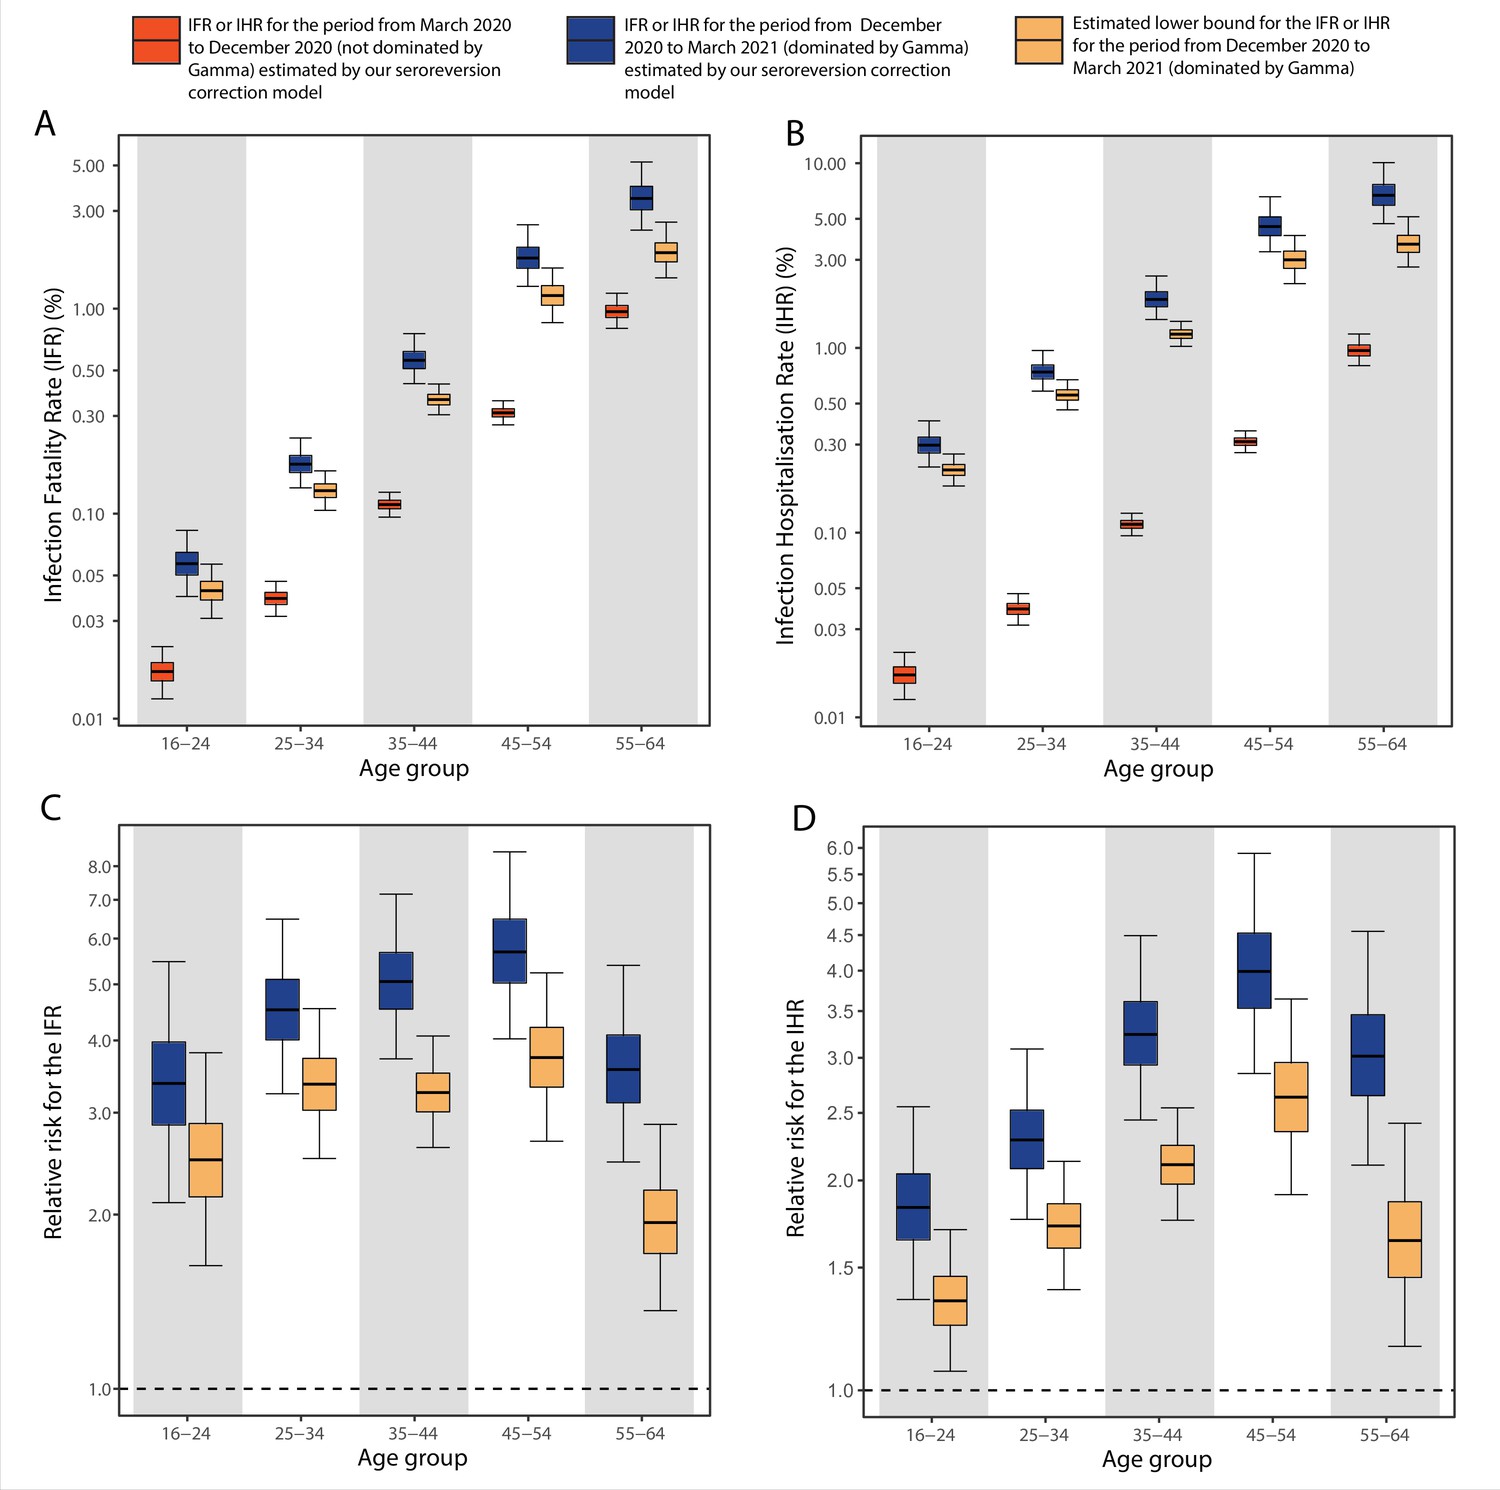
Comparison of infection-to-hospitalisation and infection-to-fatality rate estimates during the non-Gamma and Gamma period in Manaus.
(A) Estimated infection fatality rates (IFRs) and (B) infection hospitalisation rates (IHR s) for Manaus in the periods from 1 March 2020 to 15 December 2020 (non-Gamma dominated) and 16 December 2020 to 31 March 2021 (Gamma dominated). For the Gamma-dominated period, estimates shown are lower bounds that were calculated assuming a maximum proportion of reinfections (see Materials and methods). (C) Relative risks of the lower bound estimate of the iIFRs in the Gamma-dominated period using the estimated IFRs in the non-Gamma period as reference and (D) similarly for IHRs.
Figure 5—figure supplement 1

Attack rate in Manaus estimated by our seroreversion correction model for the periods March 2020–December 2020, December 2020–March 2021 and the estimated upper bound for the attack rate.
Appendix 1—figure 1
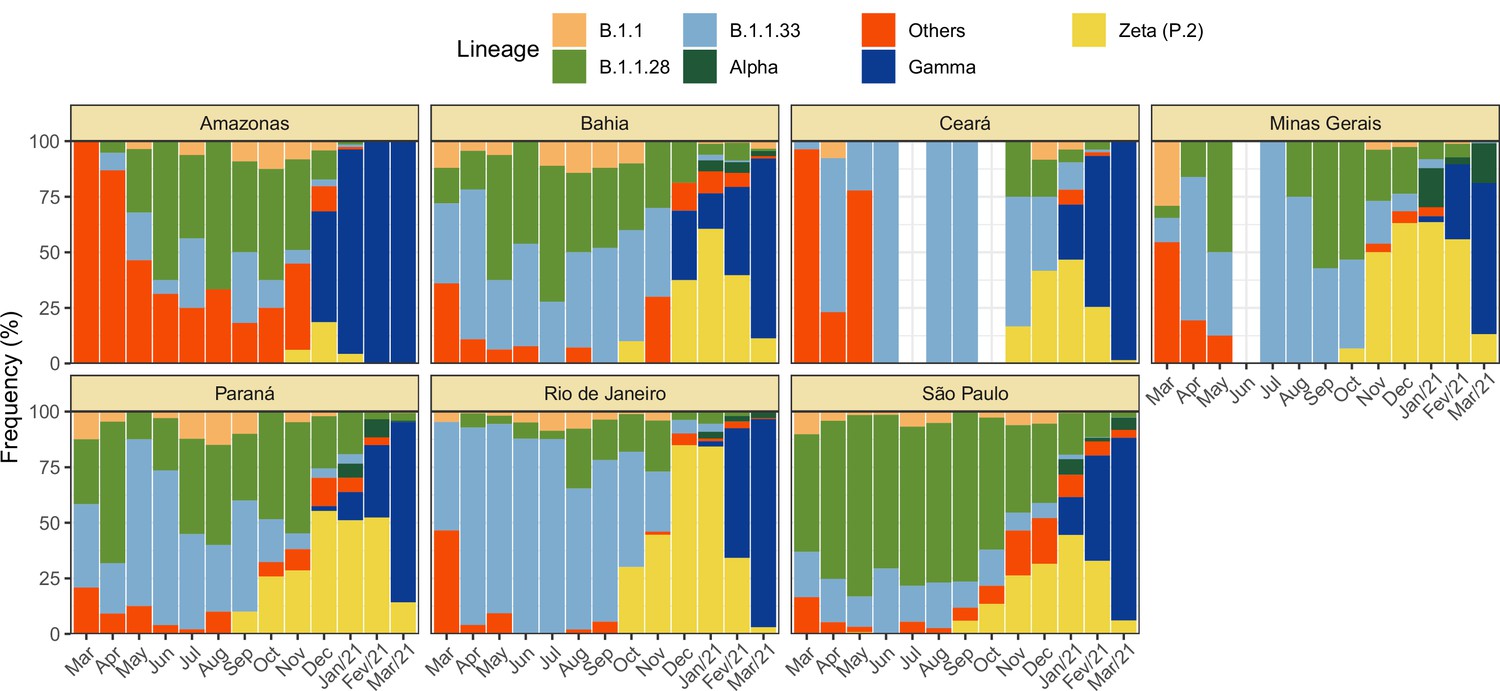
Monthly frequency of each lineage among cases confirmed by PCR for each state from March 2020 to March 2021.
Data was extracted from http://www.genomahcov.fiocruz.br/. Lineage data was not available for the state of Pernambuco.
Appendix 1—figure 2
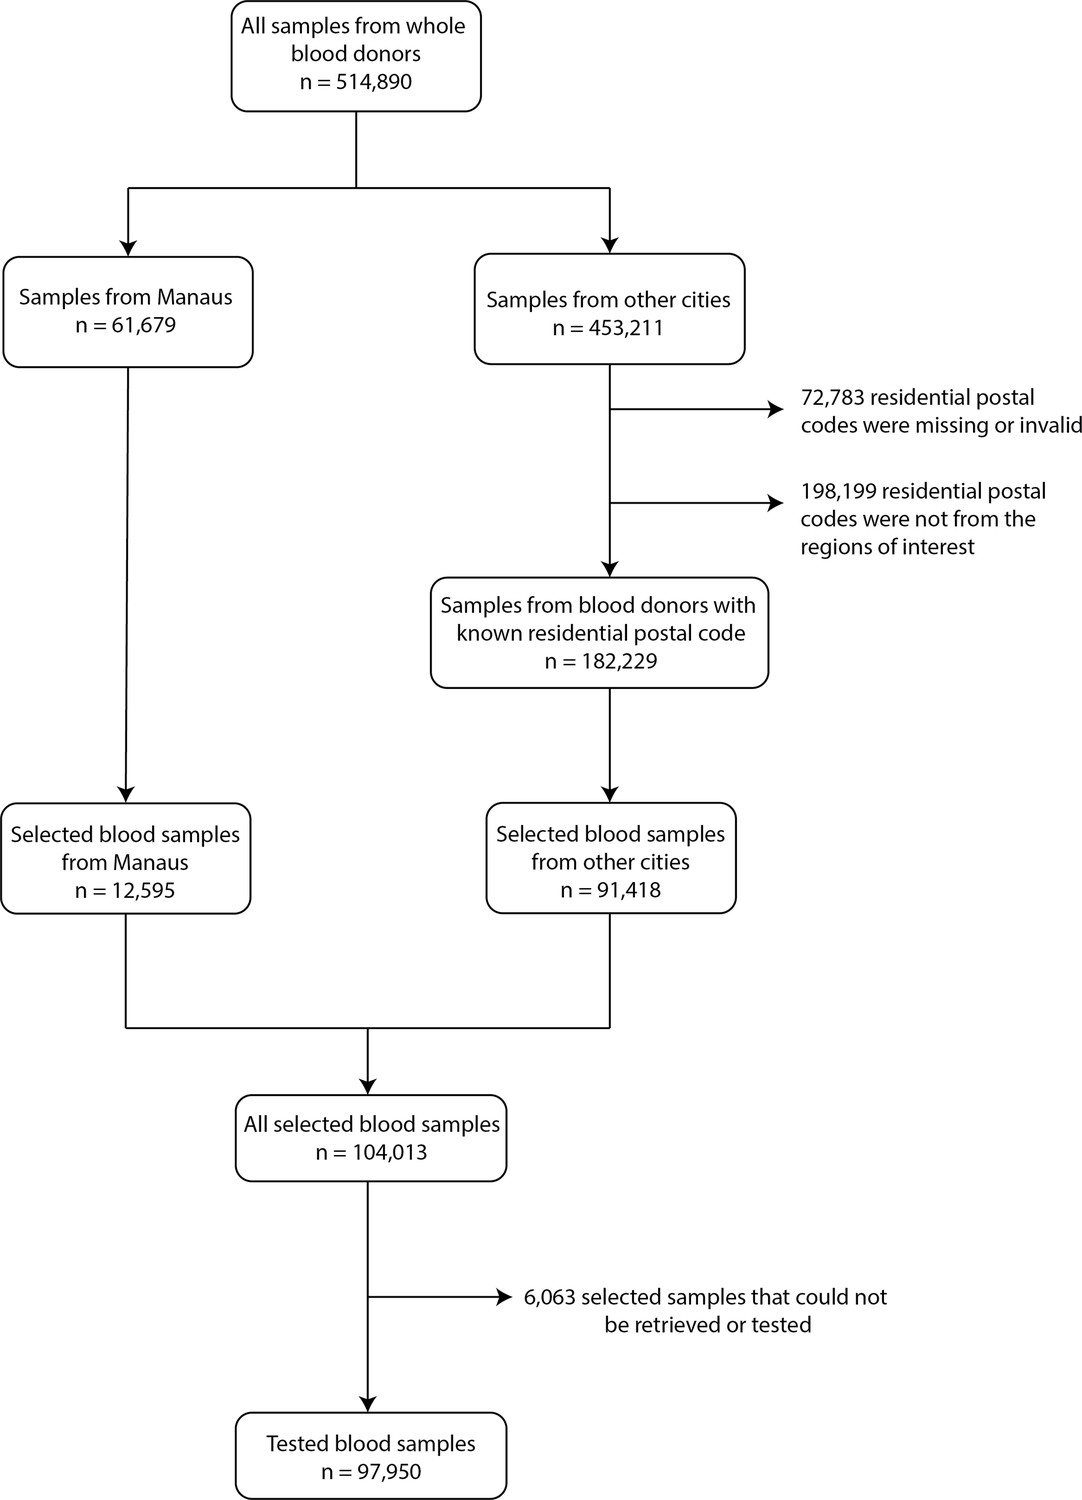
Flowchart describing the procedure used to select blood samples.
Samples were selected based on the residential postal code of blood donors to generate a representative set of test results. In Manaus, samples were selected consecutively without any postal code restriction, as postal codes could not be reliably collected in this city.
Appendix 1—figure 3
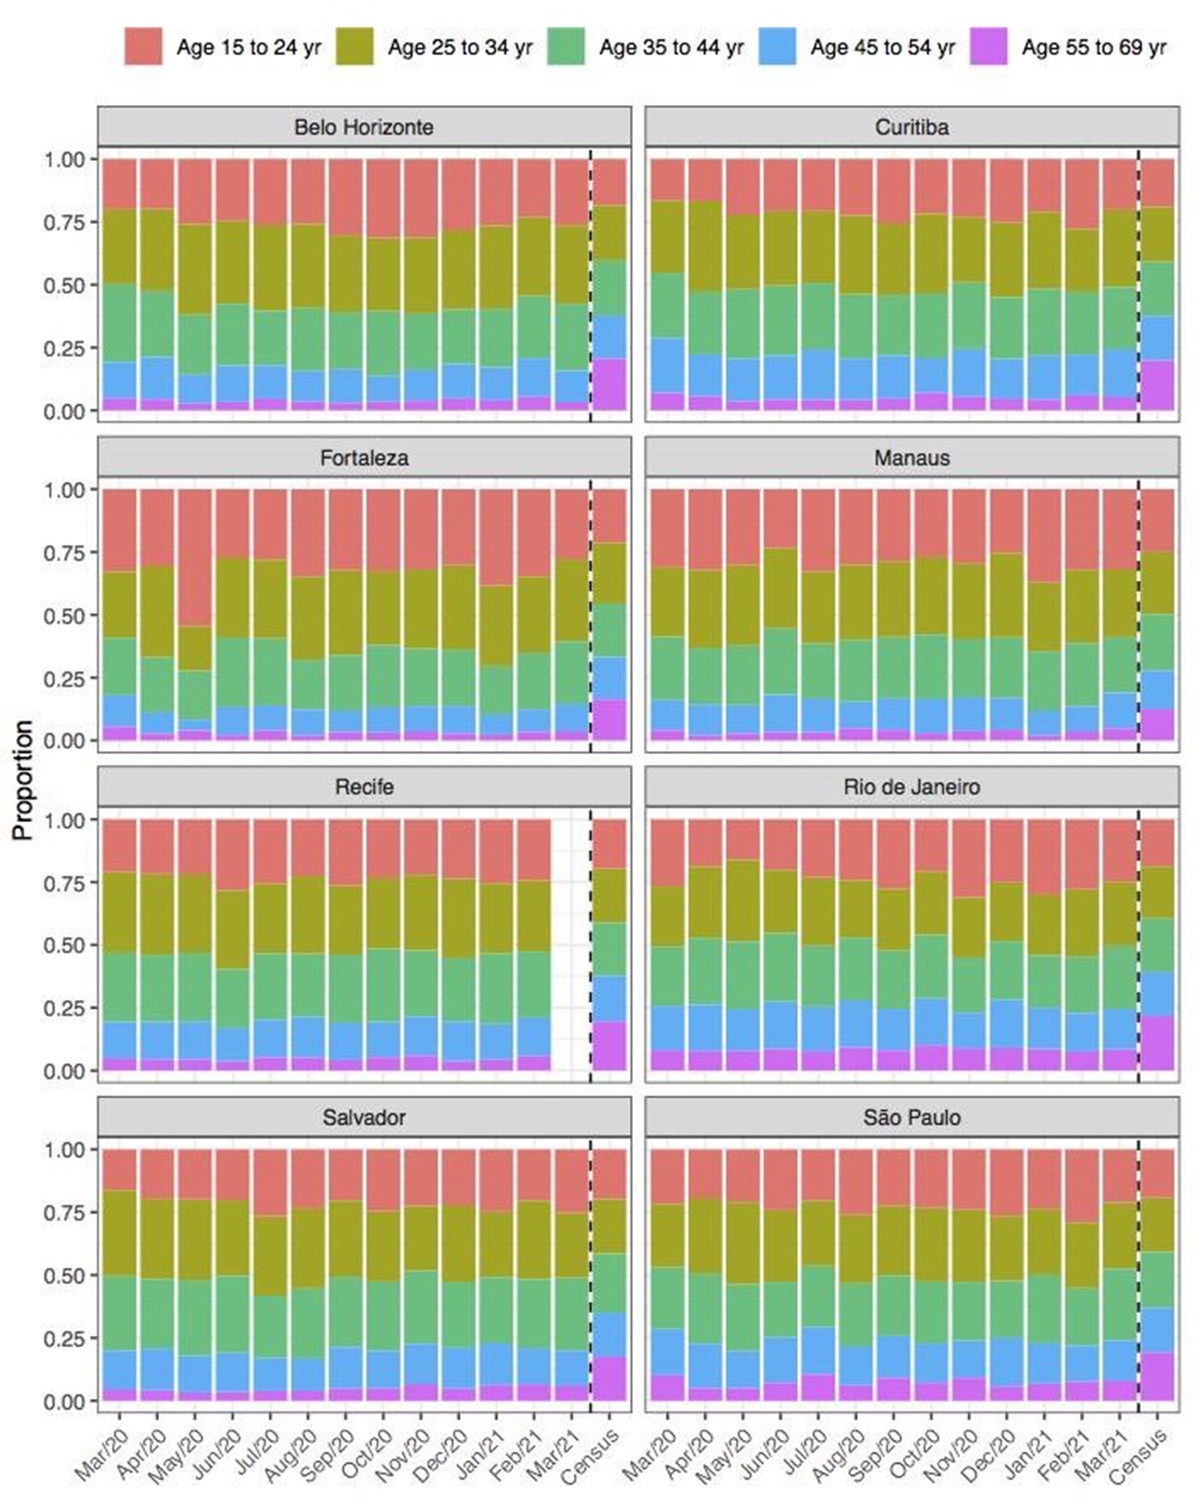
Comparison of age structure in blood donors tested for SARS-CoV-2 IgG antibodies population size projections for 2020 based on the last available 2010 census.
Appendix 1—figure 4

Comparison of sex structure in blood donors tested for SARS-CoV-2 IgG antibodies and the sex distribution at the last Brazilian census (2010).
Appendix 1—figure 5
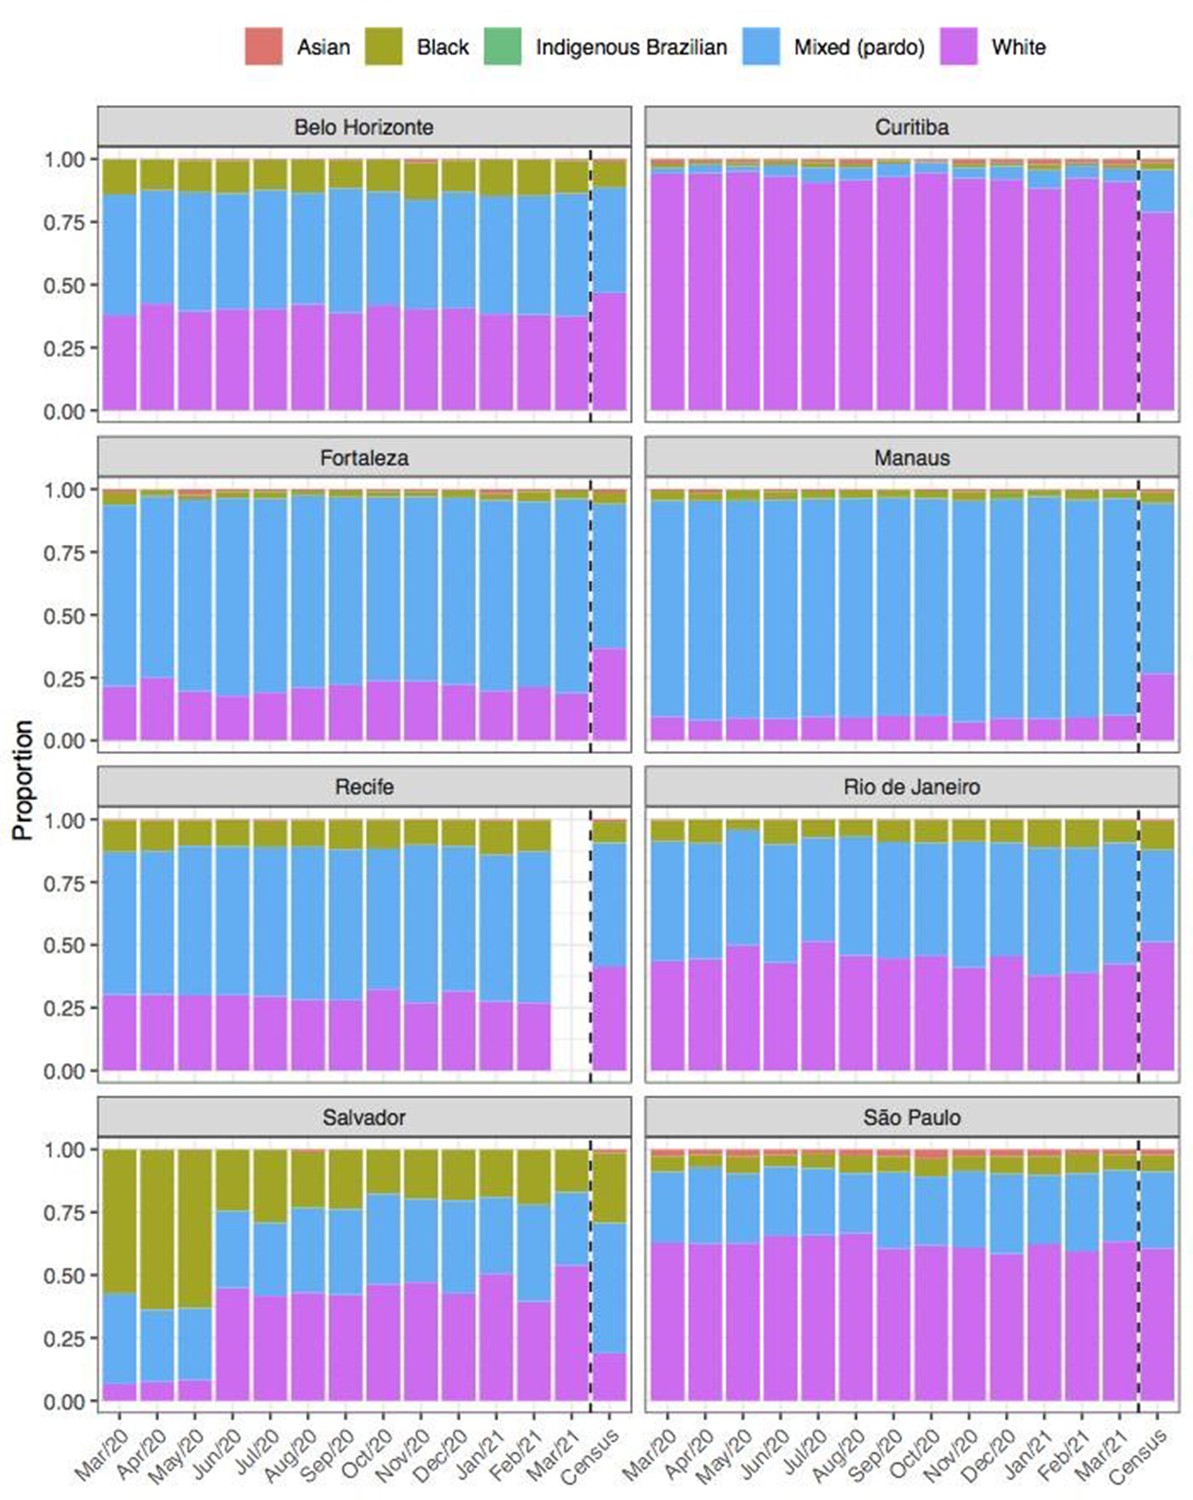
Comparison of self-declared skin colour among blood donors tested for anti-SARS-CoV-2 IgG antibody and the distribution of skin colour at the last available Brazilian census (2010).
Appendix 1—figure 6
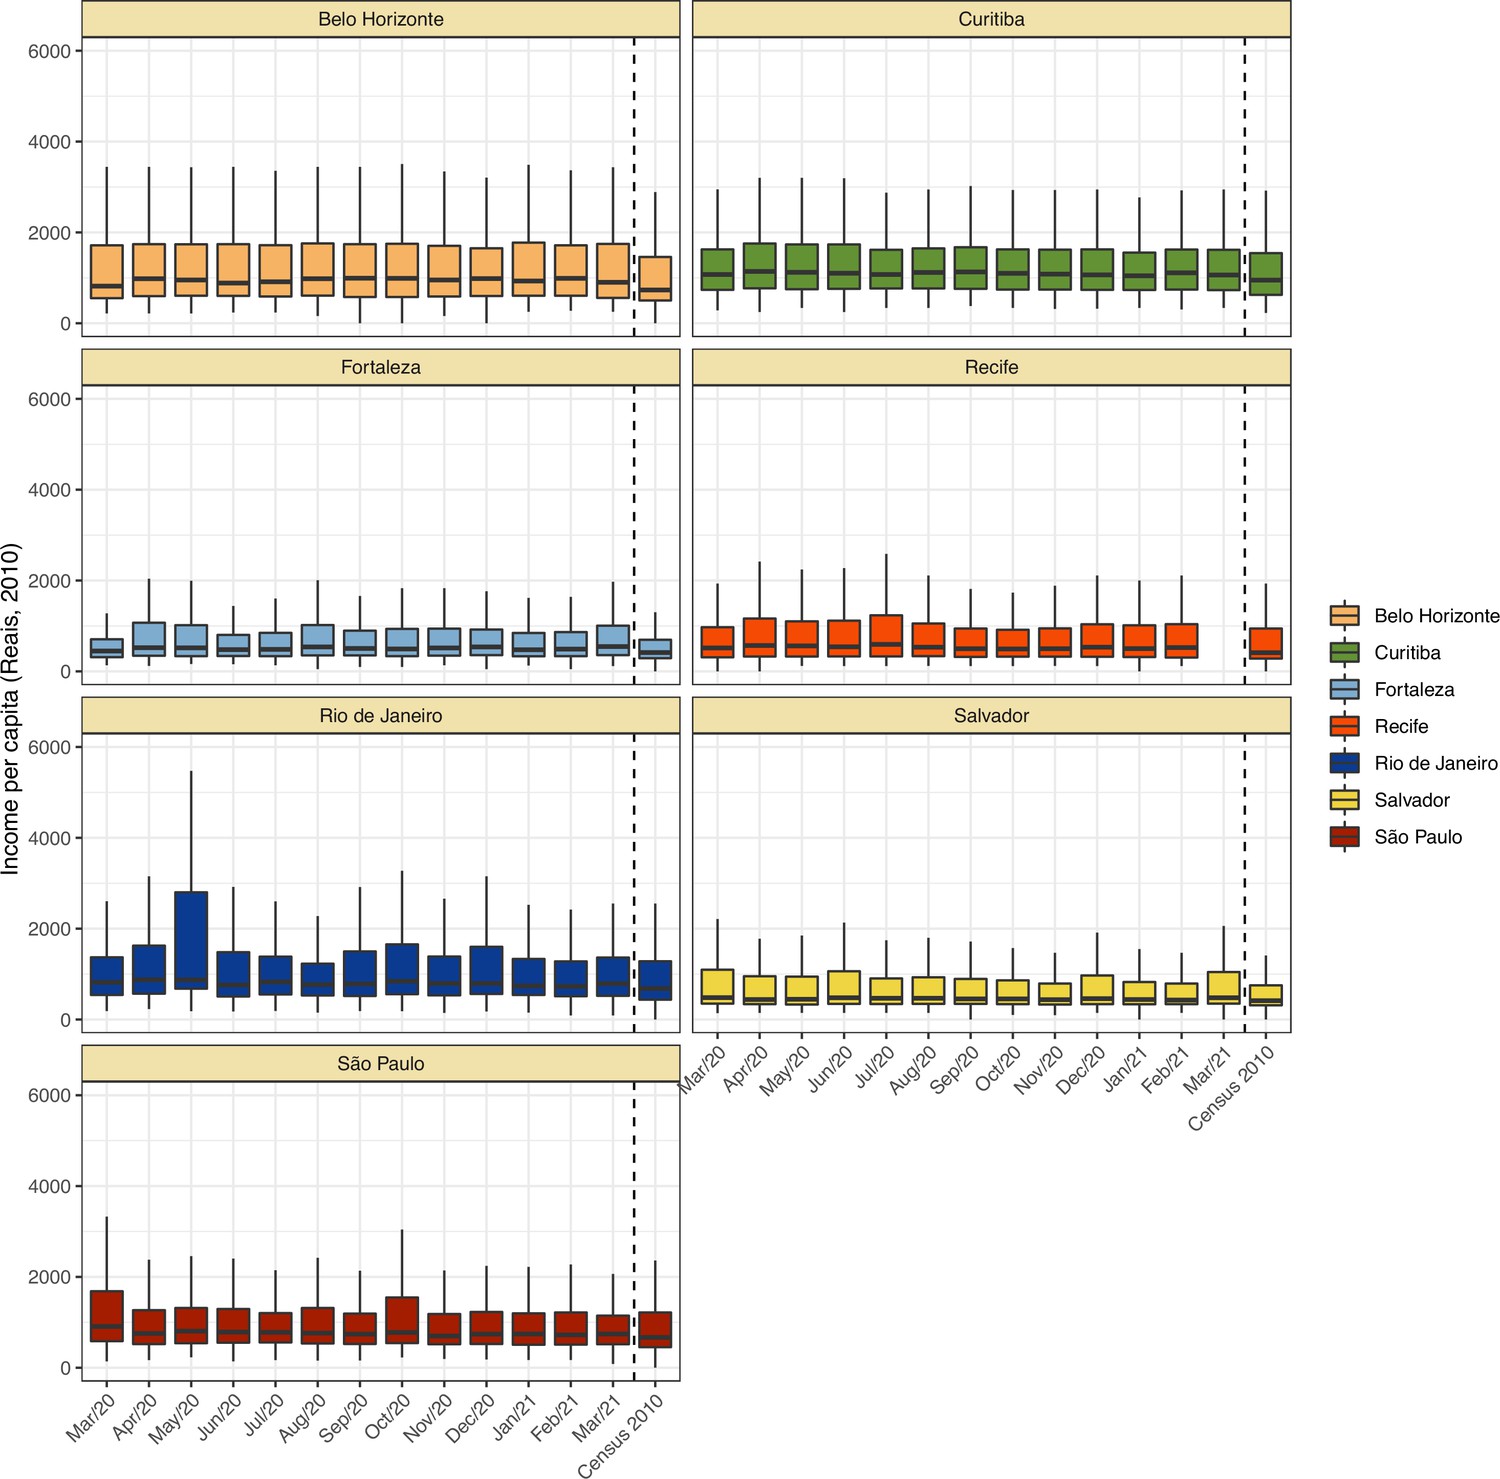
Comparison of income per capita of the census tract of selected blood donors and the income per capita distribution at the last available Brazilian census (2010) for each municipality.
Information on census tracts was not available for Manaus.
Appendix 1—figure 7
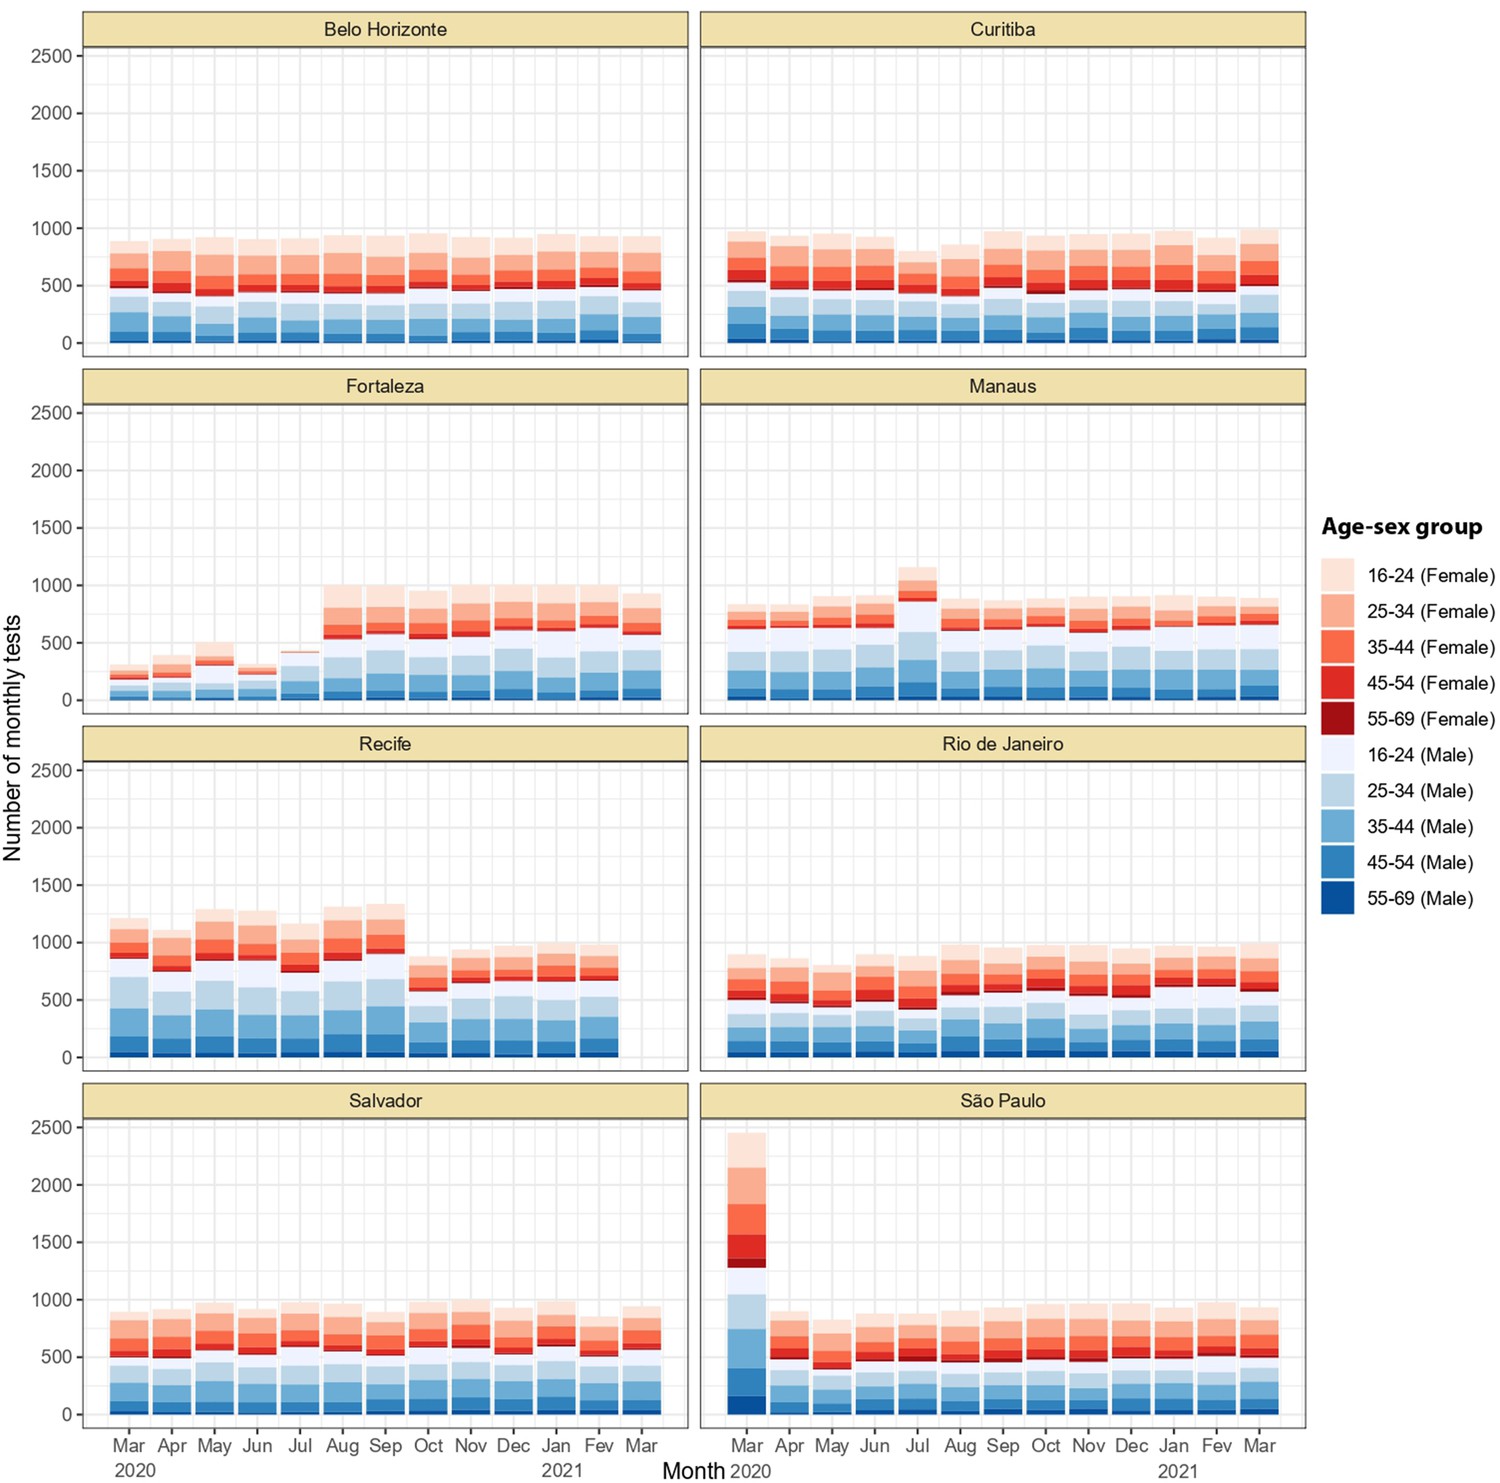
Monthly number of tests disaggregated by age group and sex.
Around 1,000 monthly tests were applied between March 2020 and March 2021, except for Recife where tests were applied until February 2021.
Appendix 1—figure 8
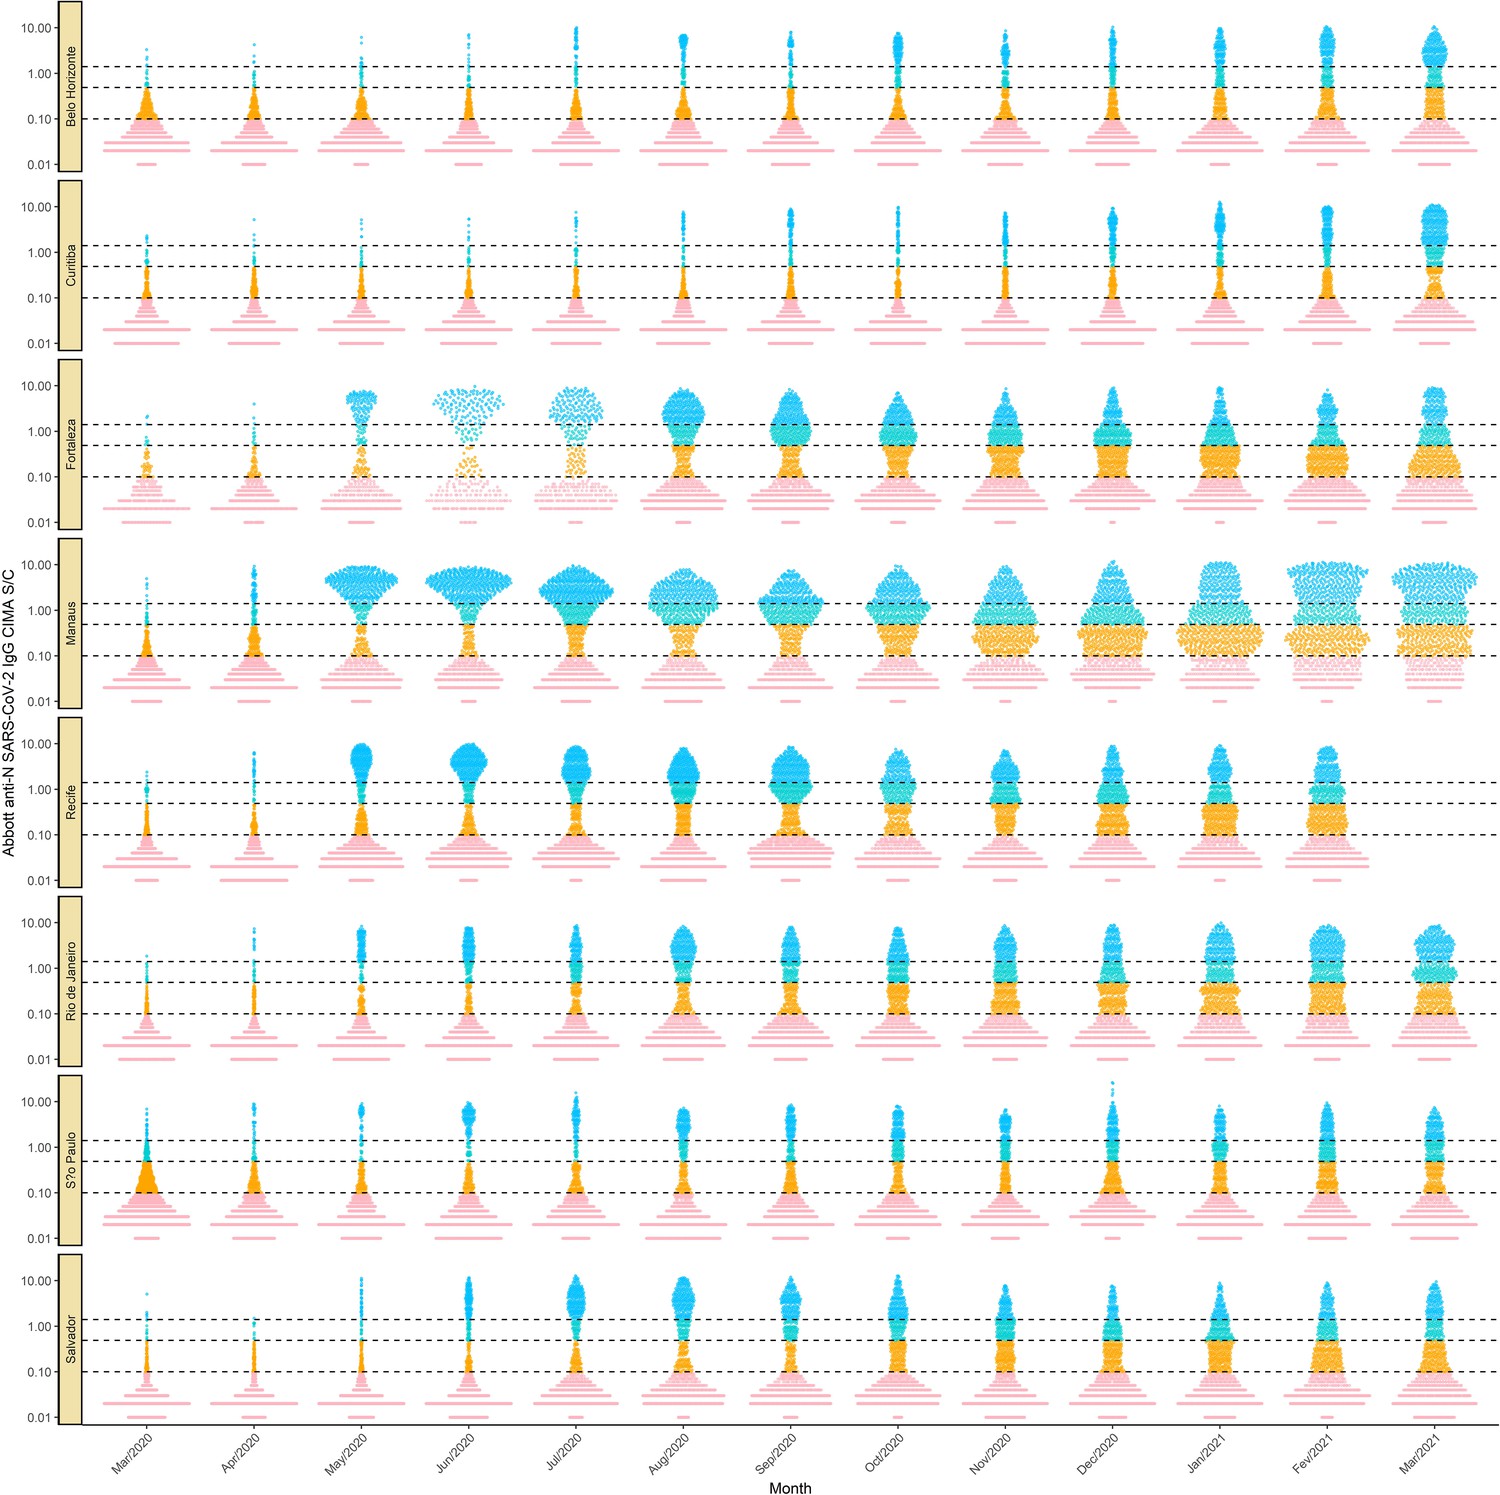
Monthly antibody signal-to-cutoff (S/C) reading in each of the eight cities.
Each point represents the test result of a blood donor. The dashed lines represent the thresholds 1.4 (the threshold recommended by the manufacturer), 0.49 (the lower threshold recommended by the manufacturer and used in the main analyses of this paper), and 0.1, which we use in validation analyses.
Appendix 1—figure 9
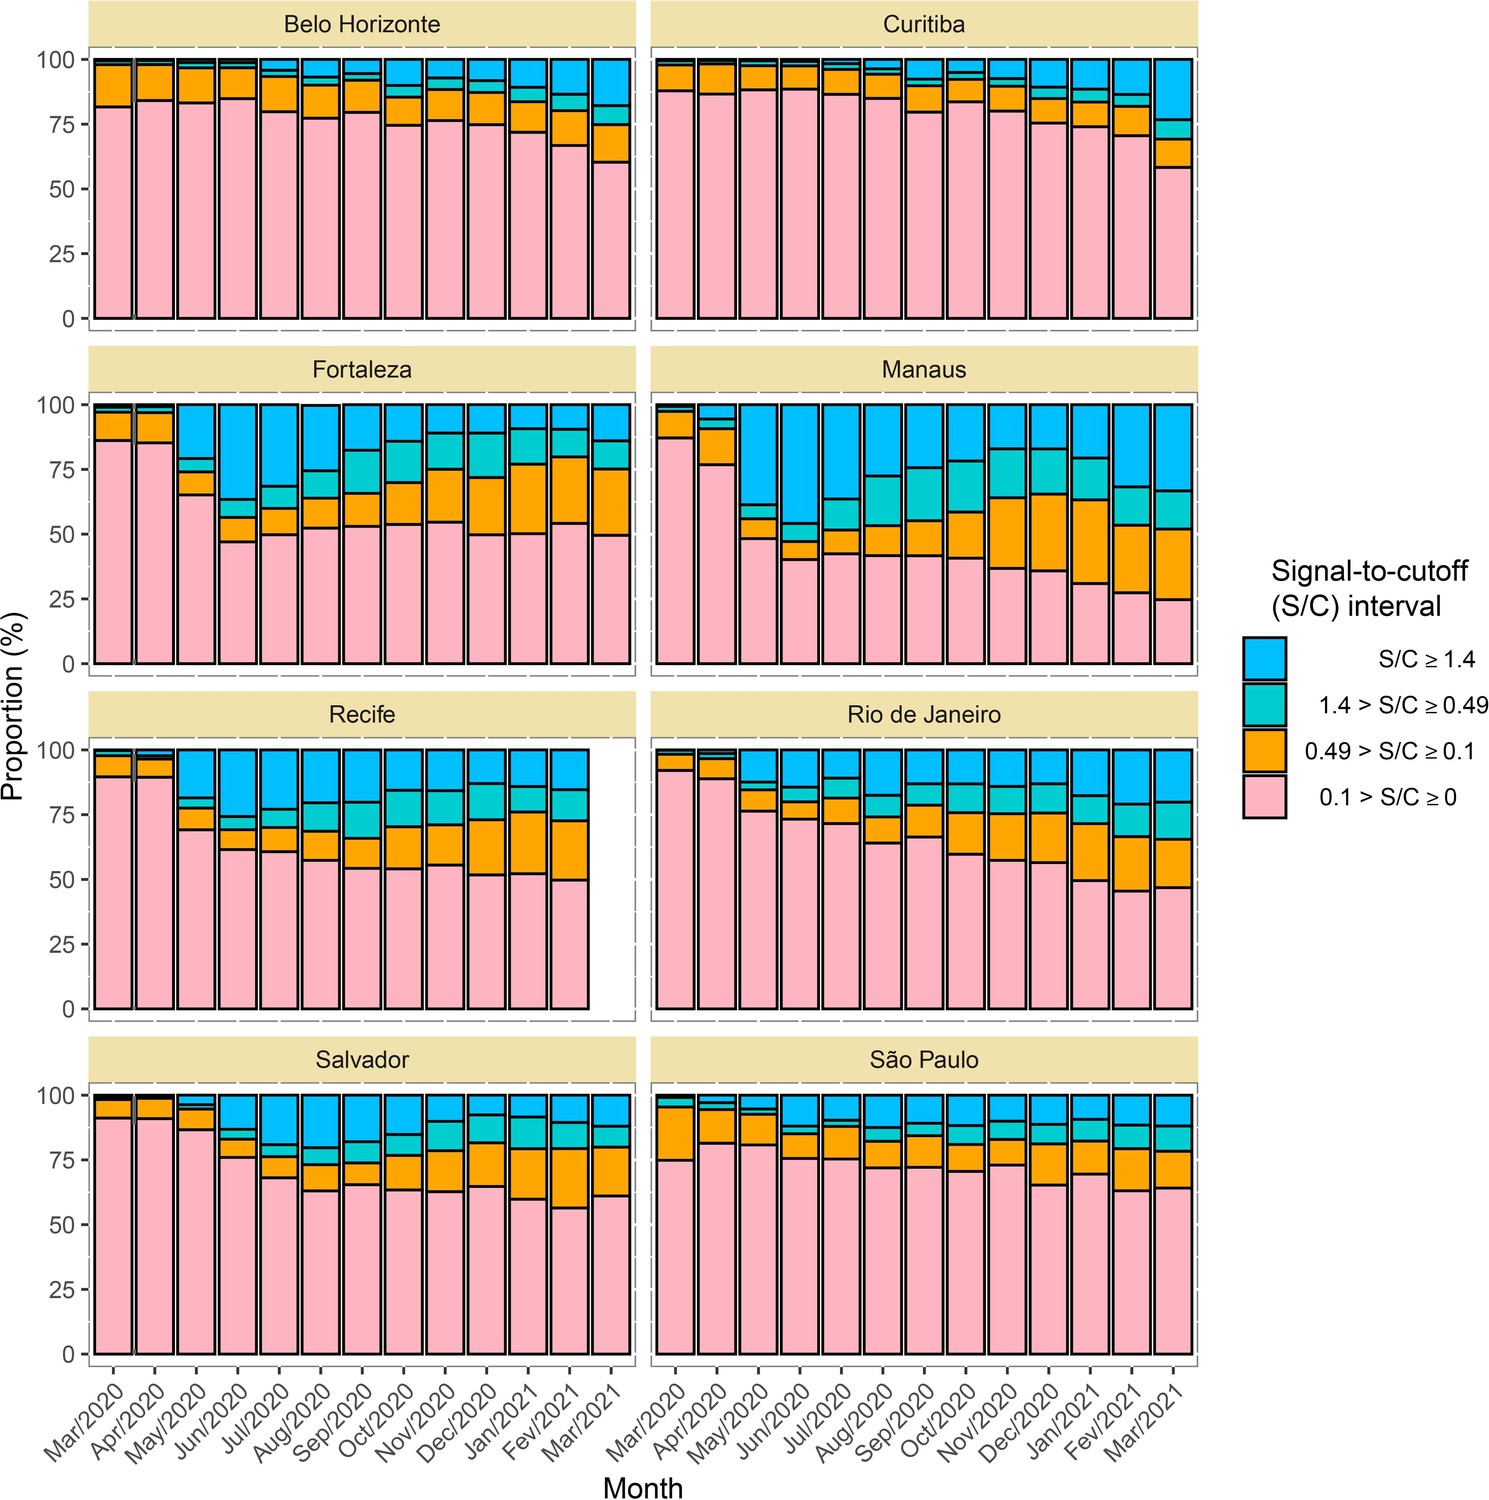
Time series of the proportional distributions of raw signal-to-cutoff (S/C) readings in monthly blood donor samples.
The thresholds were chosen as follows: 1.4 is the manufacturer’s recommended upper threshold for assay positivity, which maximises specificity; 0.49 is the manufacturer’s lower recommended threshold, which improves sensitivity following antibody waning; and 0.1 S/C is an even lower threshold used for this analysis, which still provides specificity of 86% (112 false positives in 821 pre-pandemic blood donation samples) but further improves sensitivity in the face of antibody waning.
Appendix 1—figure 10
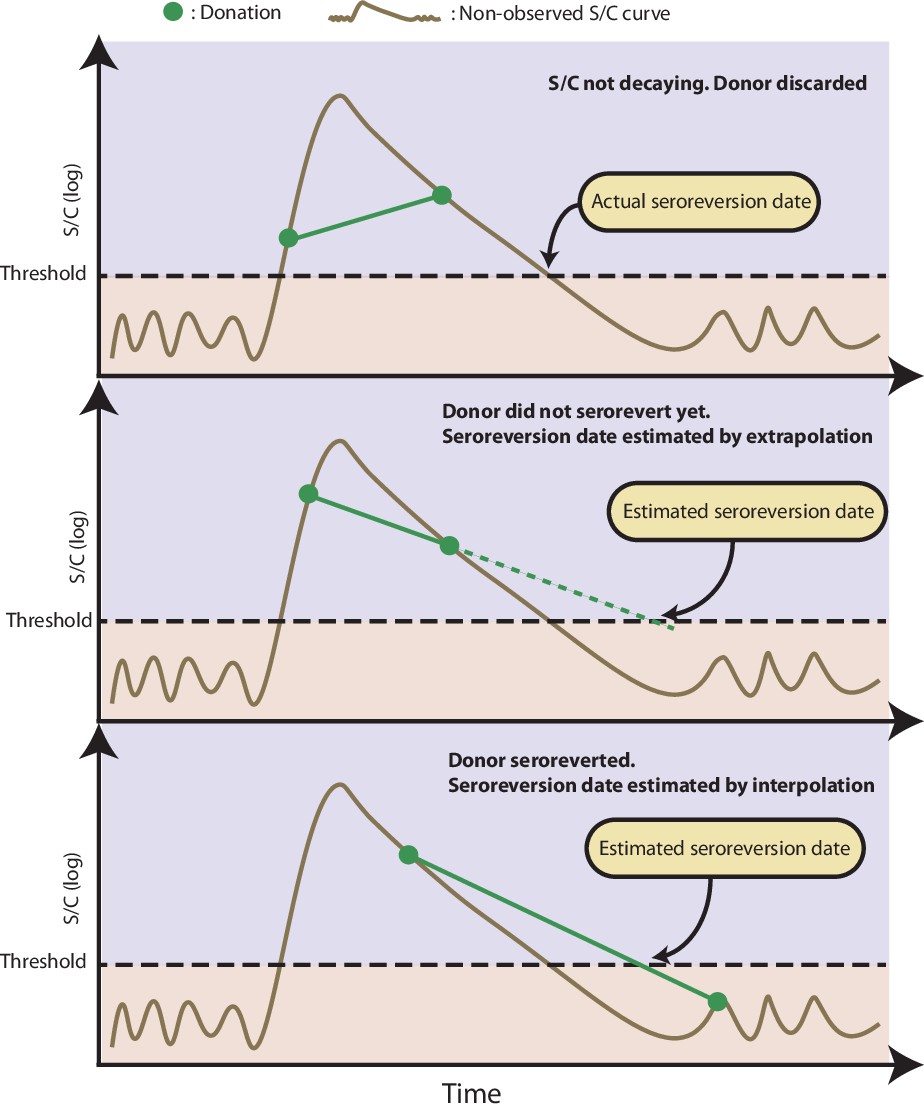
Illustration of the procedure used to estimate the time of seroreversion for each repeat blood donor.
This figure shows three donors with the same idealized signal-to-cutoff (S/C) curve but different donation dates. The first donor was discarded because the observed S/C was rising. The second donor did not become negative yet after seroconversion, thus the seroreversion date is estimated by extrapolating an exponential curve that contains the last two positive results. The third donor became negative after seroconversion; hence, the seroreversion date was estimated by applying an exponential interpolation that contains the last positive result and the first negative result after seroconversion.
Appendix 1—figure 11

Probability of a test being positive a given number of weeks after seroconversion given that seroconversion occurred in terms of the method used to estimate it.
In this work, we use the estimate of obtained from repeat blood donors (green curve).
Appendix 1—figure 12
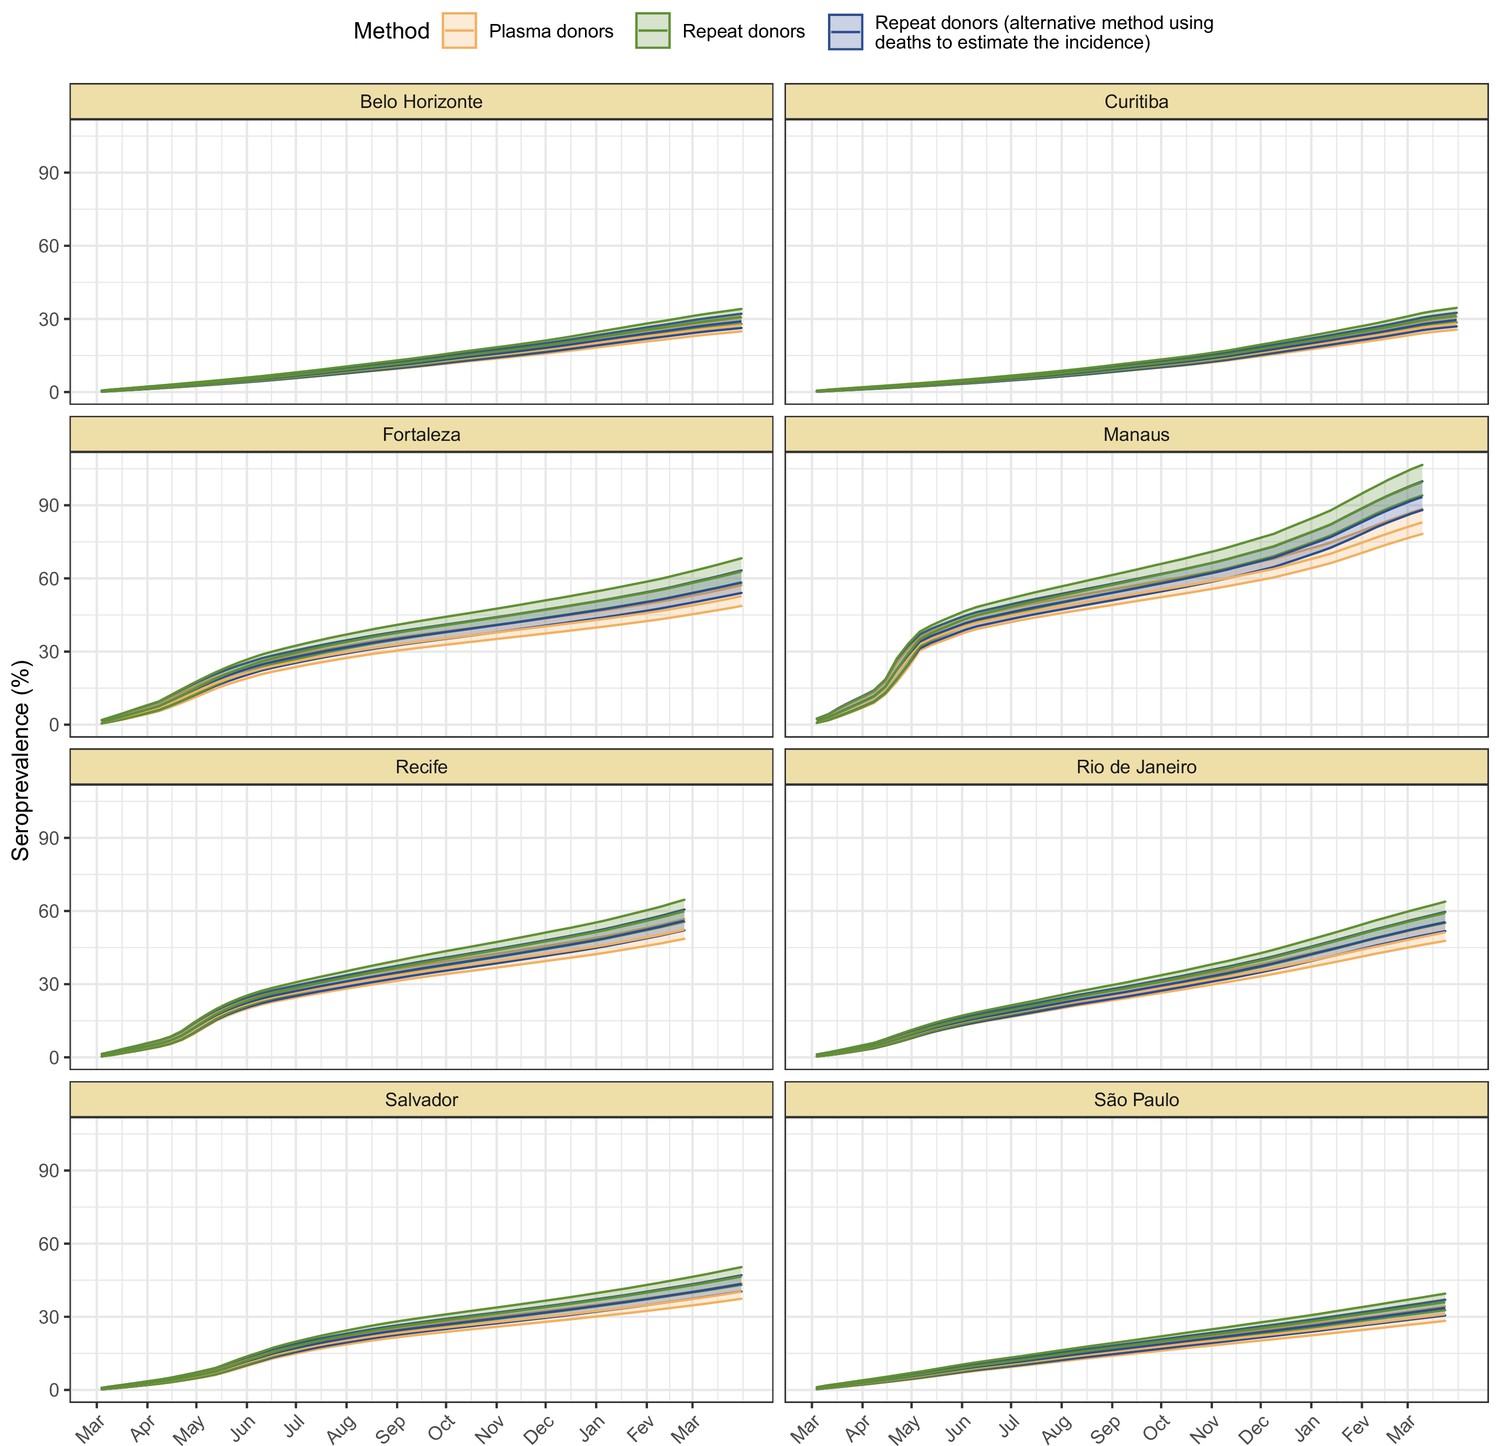
Cumulative seroprevalence estimated with 95% credible intervals (ribbons) using three different methods to calculate the time-to-seroreversion distribution.
For the analyses in this paper, we consider the seroprevalence curve in green, obtained using repeat donors to estimate the time to seroreversion.
Appendix 1—figure 13
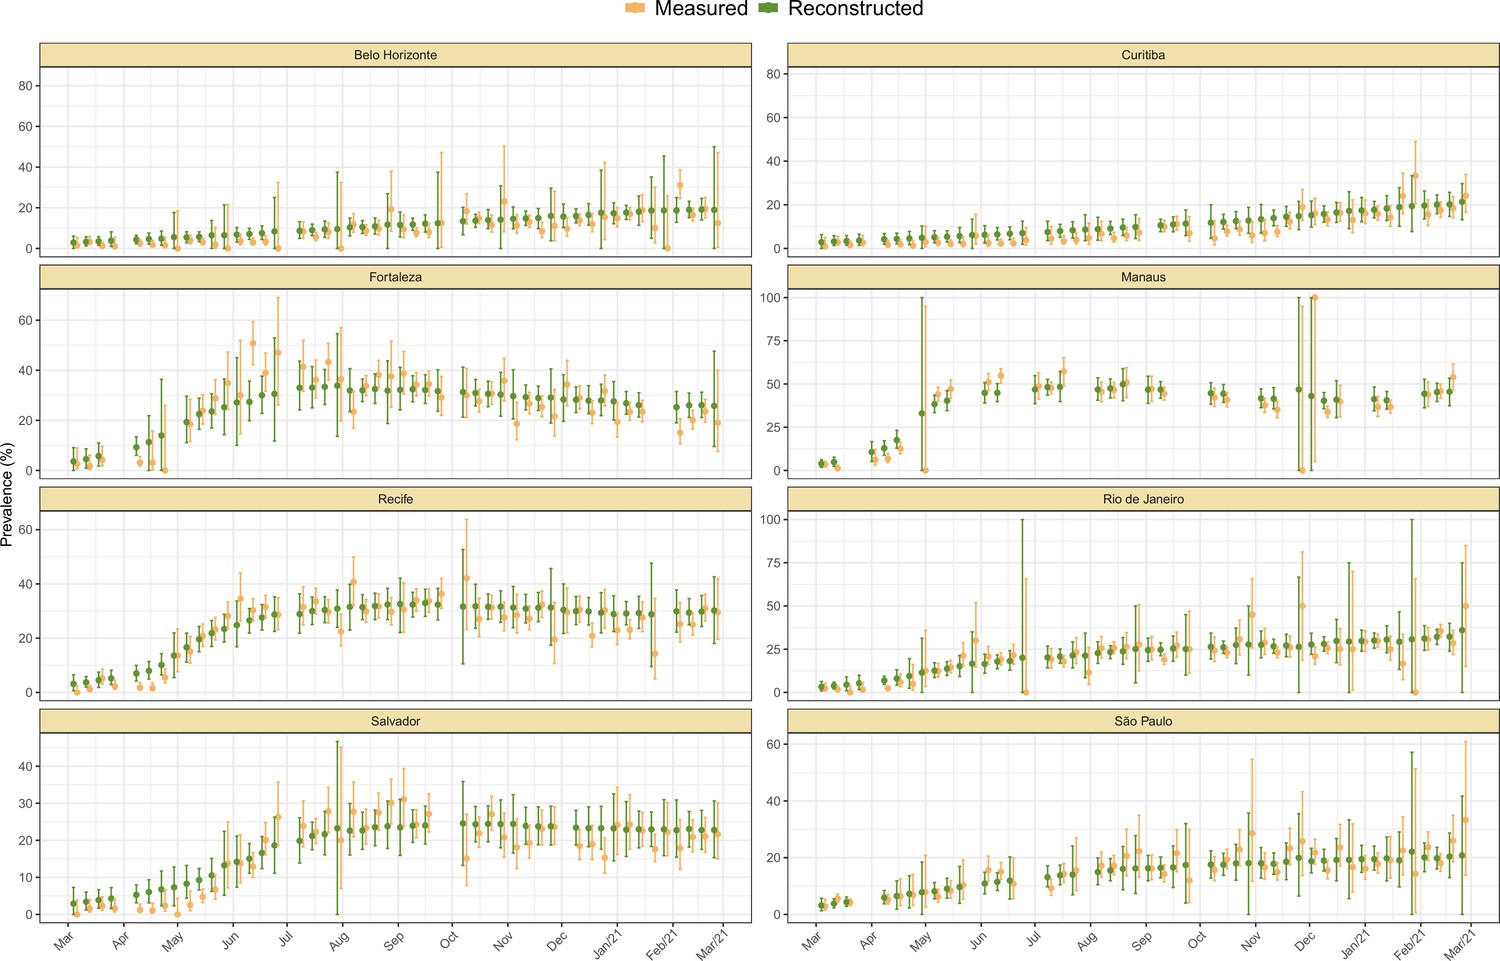
Measured weekly crude seroprevalence compared to the crude seroprevalence reconstructed by our proposed seroreversion correction model.
The high similarity between both quantities shows that the seroprevalence estimated by the model is compatible with the observations.
Appendix 1—figure 14
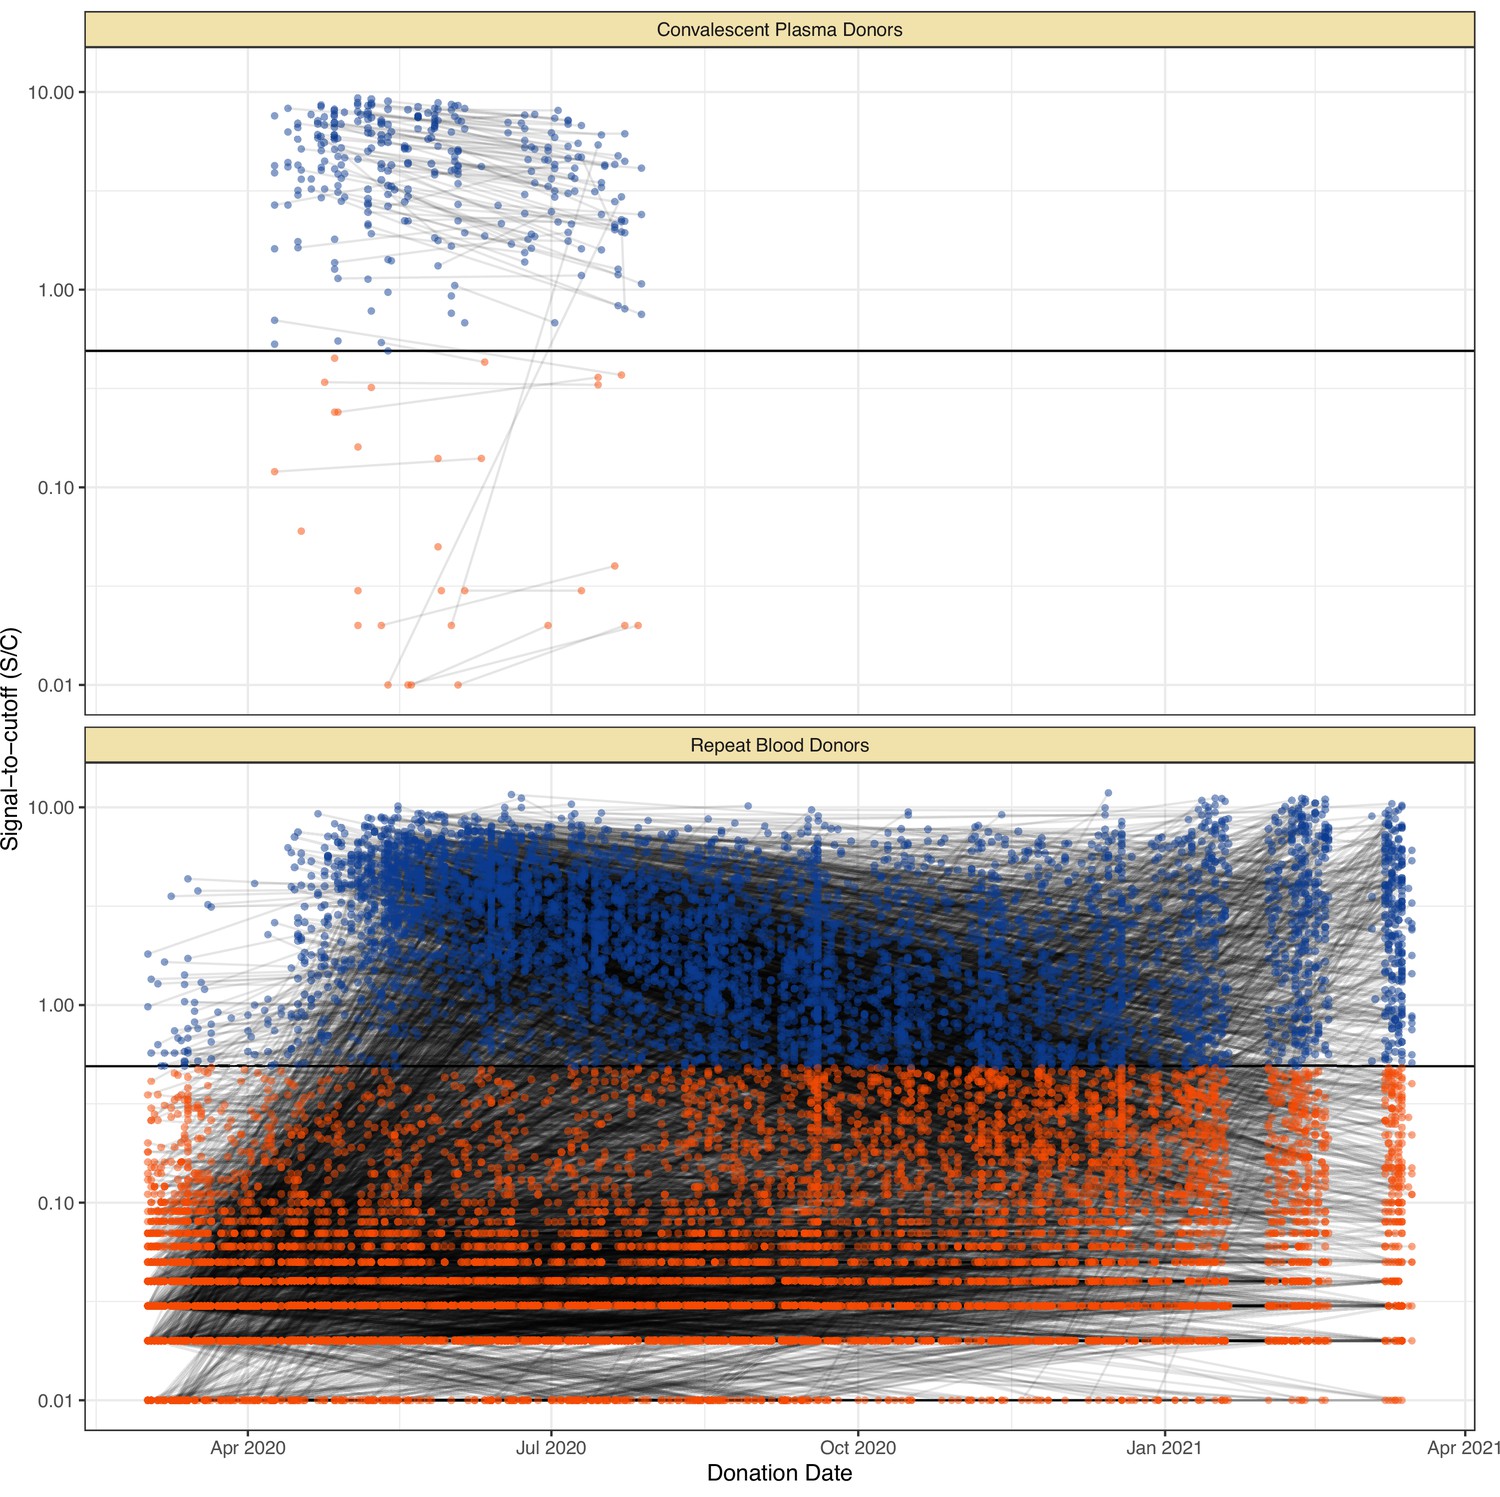
Serial donations of 218 convalescent plasma donors (symptomatic and known date of onset, PCR-positive) and 7675 repeat whole blood donors (unknown if symptomatic or date of onset, unknown PCR status) included in this study.
These cohorts were used to determine the rate of antibody waning and time-to-seroreversion distributions for the anti-nucleocapsid chemiluminescent microparticle immunoassays.
Appendix 1—figure 15
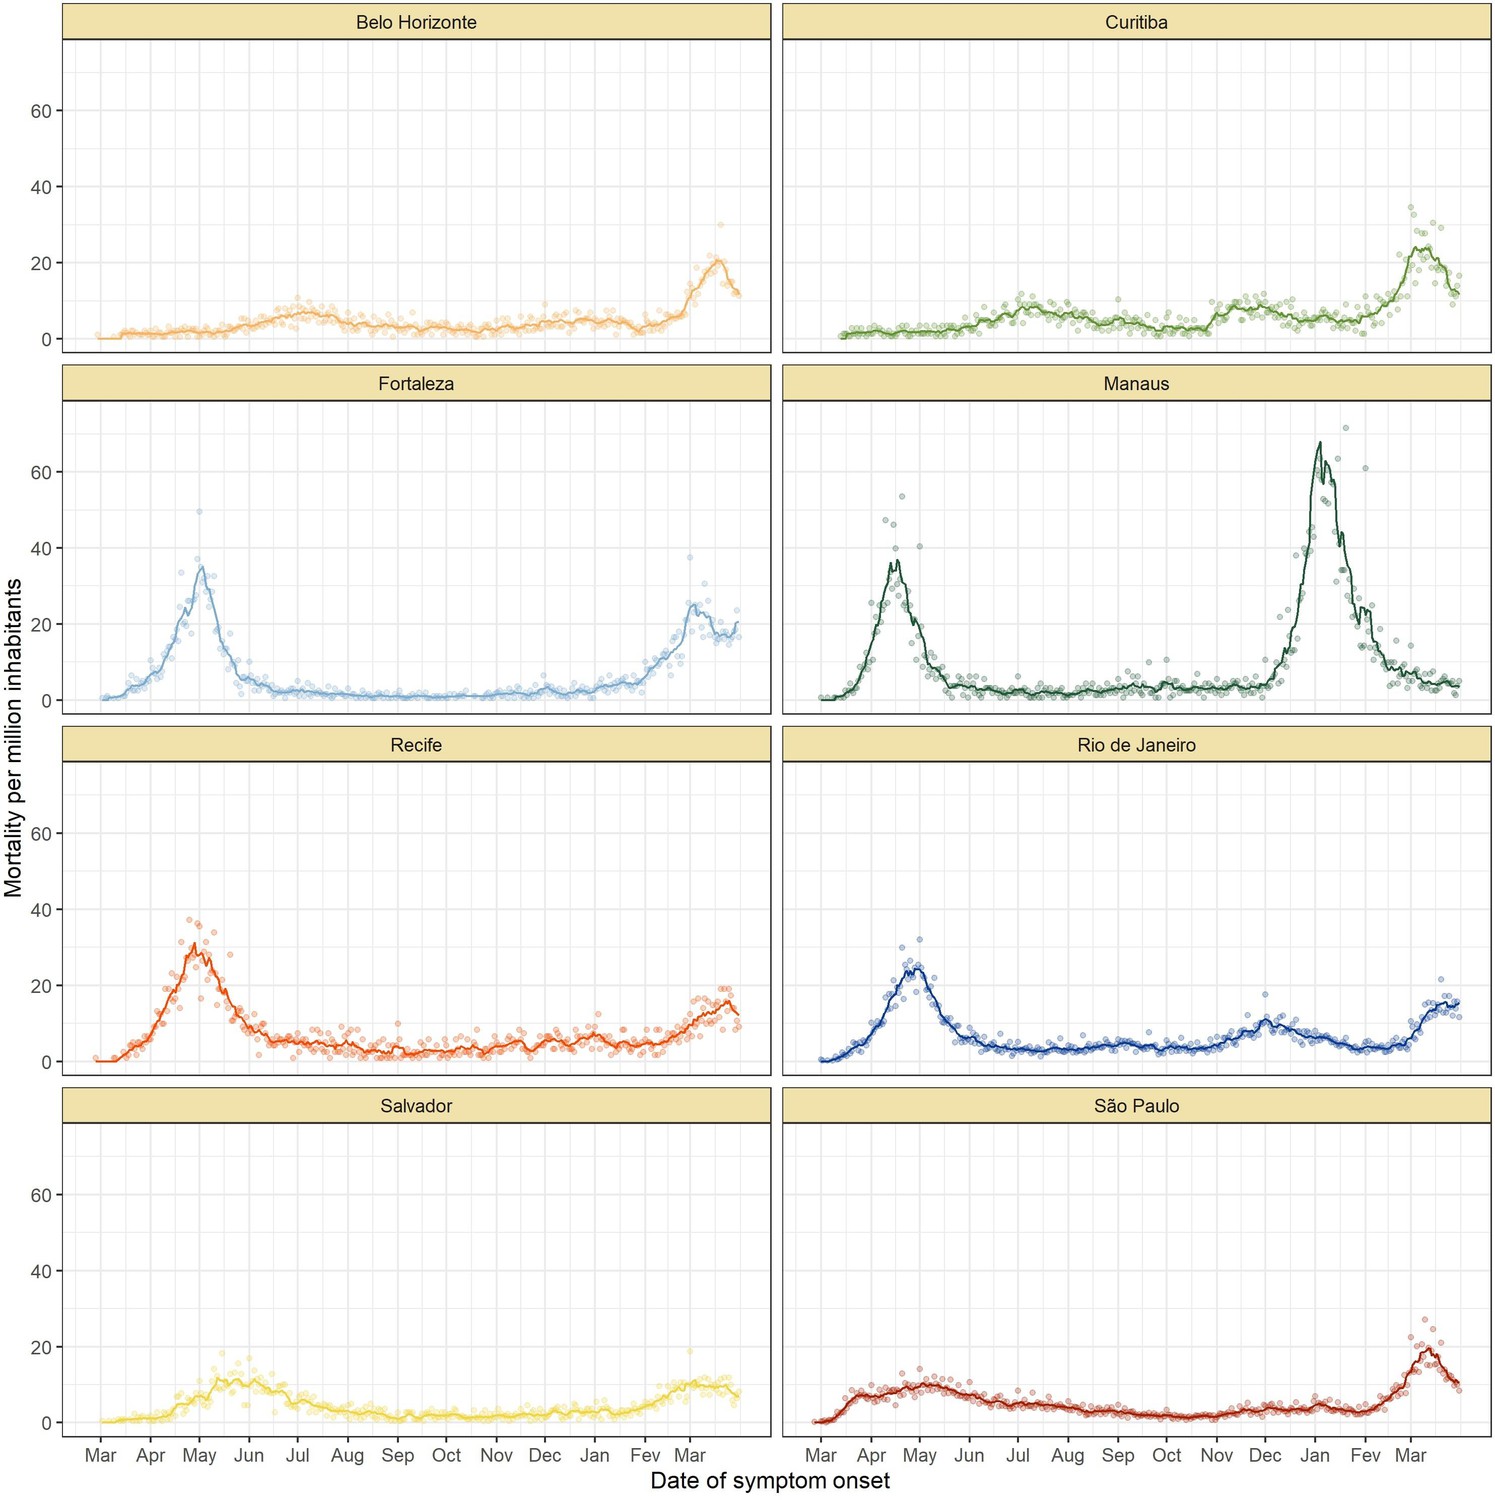
Mortality by severe acute respiratory infection per million inhabitants in each of the eight cities without any age standardisation.
Appendix 1—figure 16
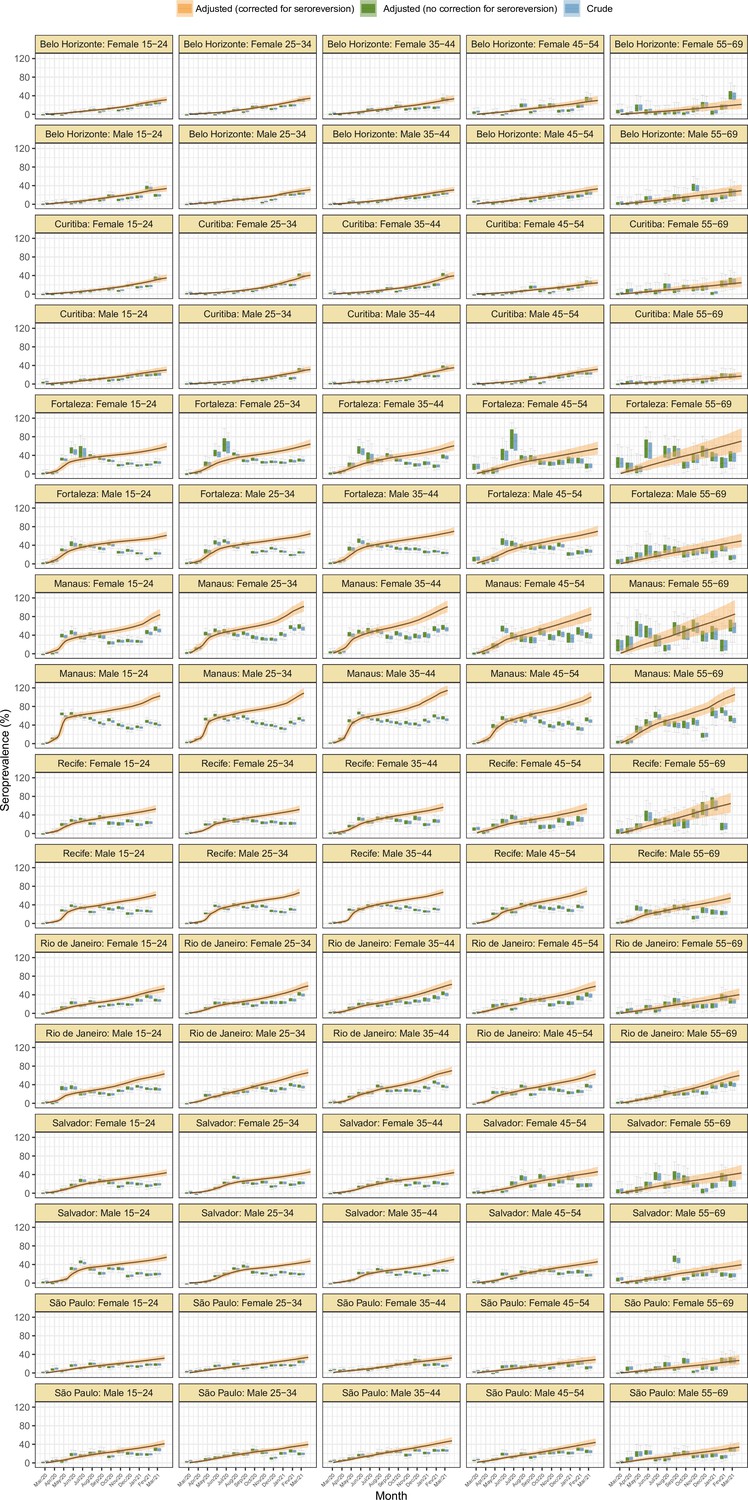
Seroprevalence estimates disaggregated by age and sex for the eight cities.
As in Figure 2D, three seroprevalence estimates are shown: (i) crude seroprevalence; (ii) seroprevalence adjusted for sensitivity, specificity, and reweighted by age and sex, but not corrected for seroreversion; and (iii) adjusted seroprevalence estimated by our seroreversion corrected model (continuous curves), which accounts for seroreversion in addition to sensitivity, specificity, and age-sex distribution. This seroprevalence estimate consists in the sum of infections and reinfections among seronegative donors; hence, it can be larger than 100%.
Appendix 1—figure 17
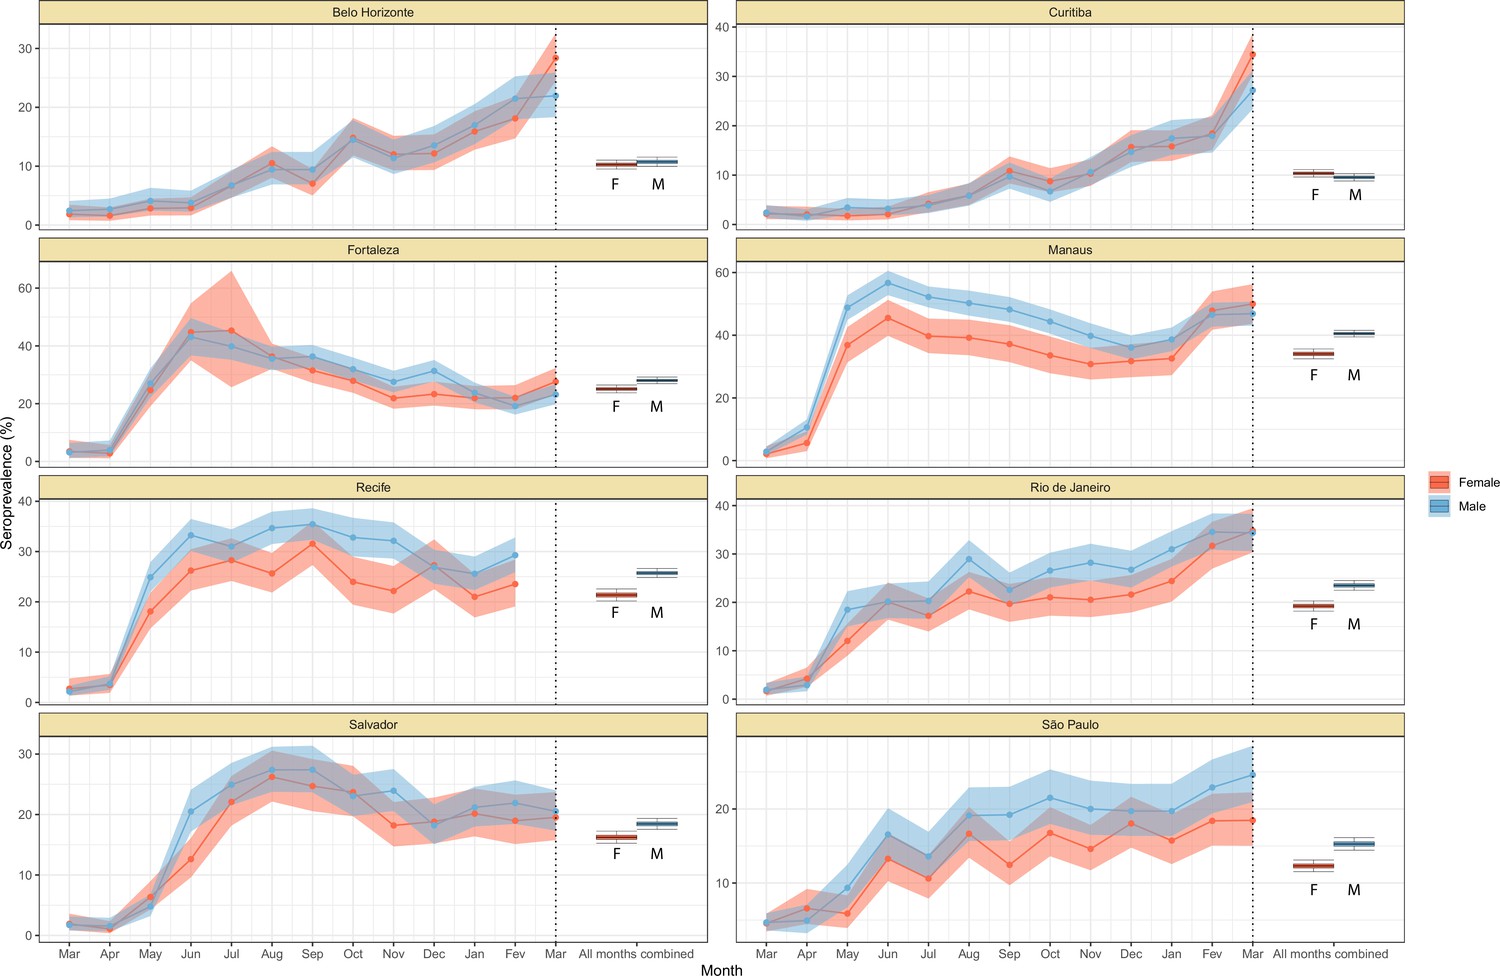
Crude monthly seroprevalence disaggregated by sex.
Boxplots represent the crude seroprevalence obtained by aggregating all months, defined as the proportion of positive tests combining all months.
Appendix 1—figure 18
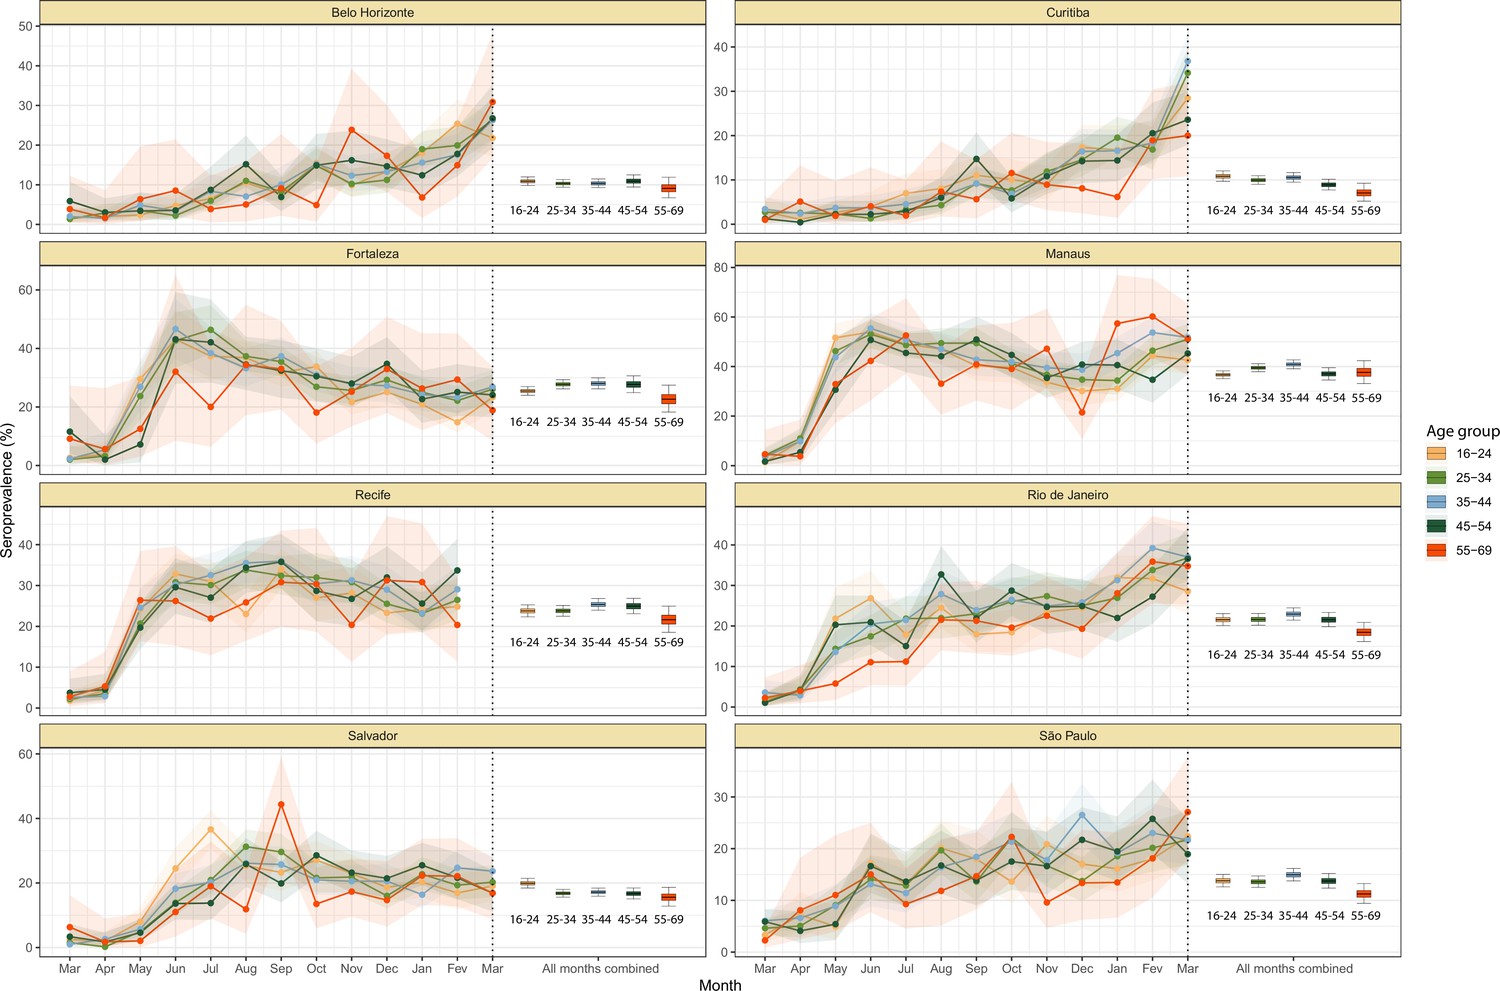
Crude monthly seroprevalence disaggregated by age.
Boxplots represent the crude seroprevalence obtained by aggregating all months, defined as the proportion of positive tests combining all months.
Appendix 1—figure 19
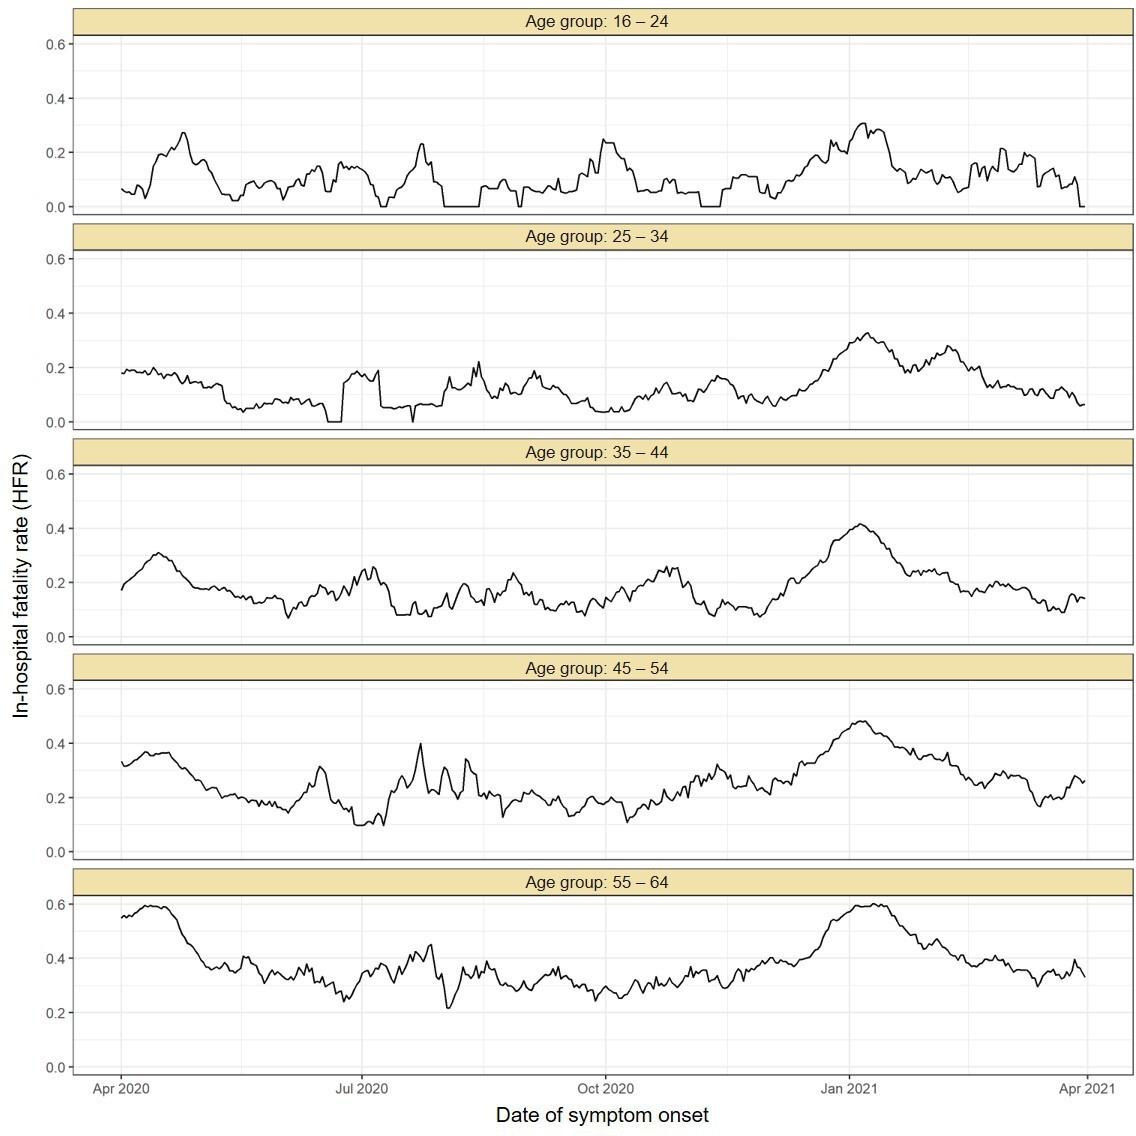
Estimated in-hospital fatality rate (HFR) over time in Manaus.
The HFR was calculated by dividing the number of deaths by the number of hospitalisations using a moving window of 14 days. The HFR had a peak in the Gamma-dominated wave in January 2021 in all age groups.
Appendix 1—figure 20
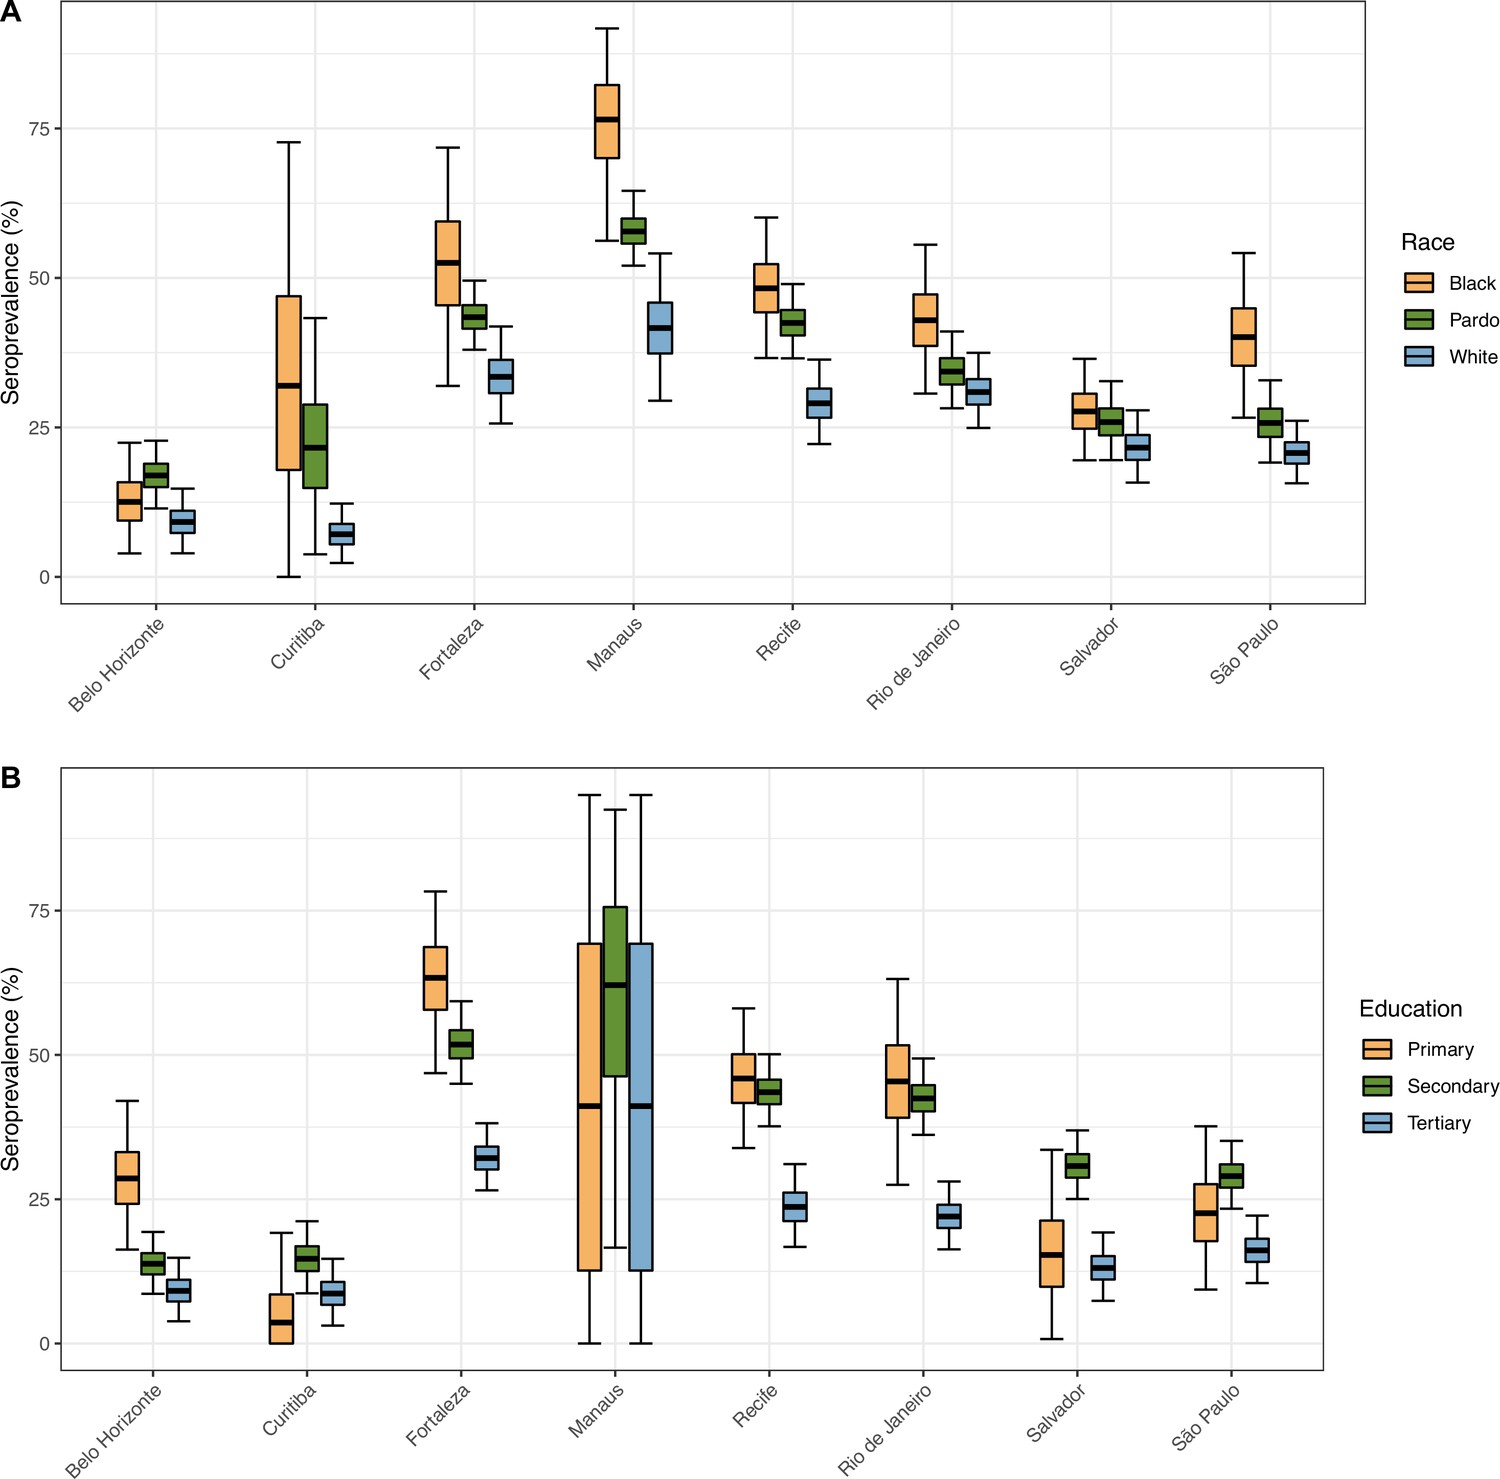
Seroprevalence in December 2020 disaggregated by race and education level.
The seroprevalence was estimated using a threshold of 0.1 signal to cutoff and correcting for sensitivity and specificity, without any explicit correction for seroreversion. To aid visualization, we merged the White and East Asian races and discarded Indigeneous individuals. Information on education level is available for very few donors in Manaus, hence, the large confidence intervals.
Appendix 1—figure 21
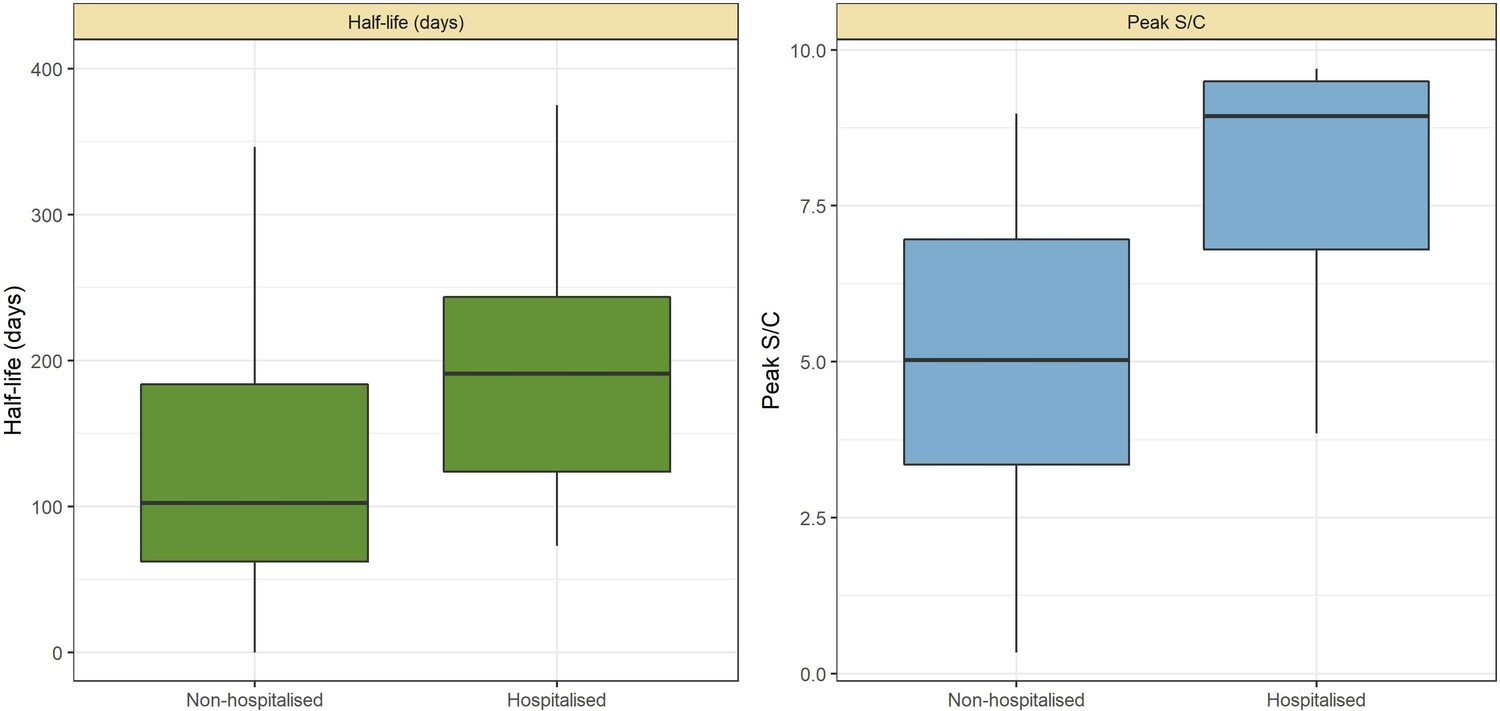
Abbott SARS-CoV-2 anti-nucleocapsid half-life and peak signal to cutoff (S/C) estimated in convalescent plasma by hospitalisation status.
Instead of estimating one half-life for each plasma donor, a different half-life was calculated for each pair of consecutive donations with decaying S/C reading. Box plots show the median (central lines), interquartile range (hinges), and range extending to 1.5 times the interquartile range from each hinge (whiskers).
Appendix 1—figure 22
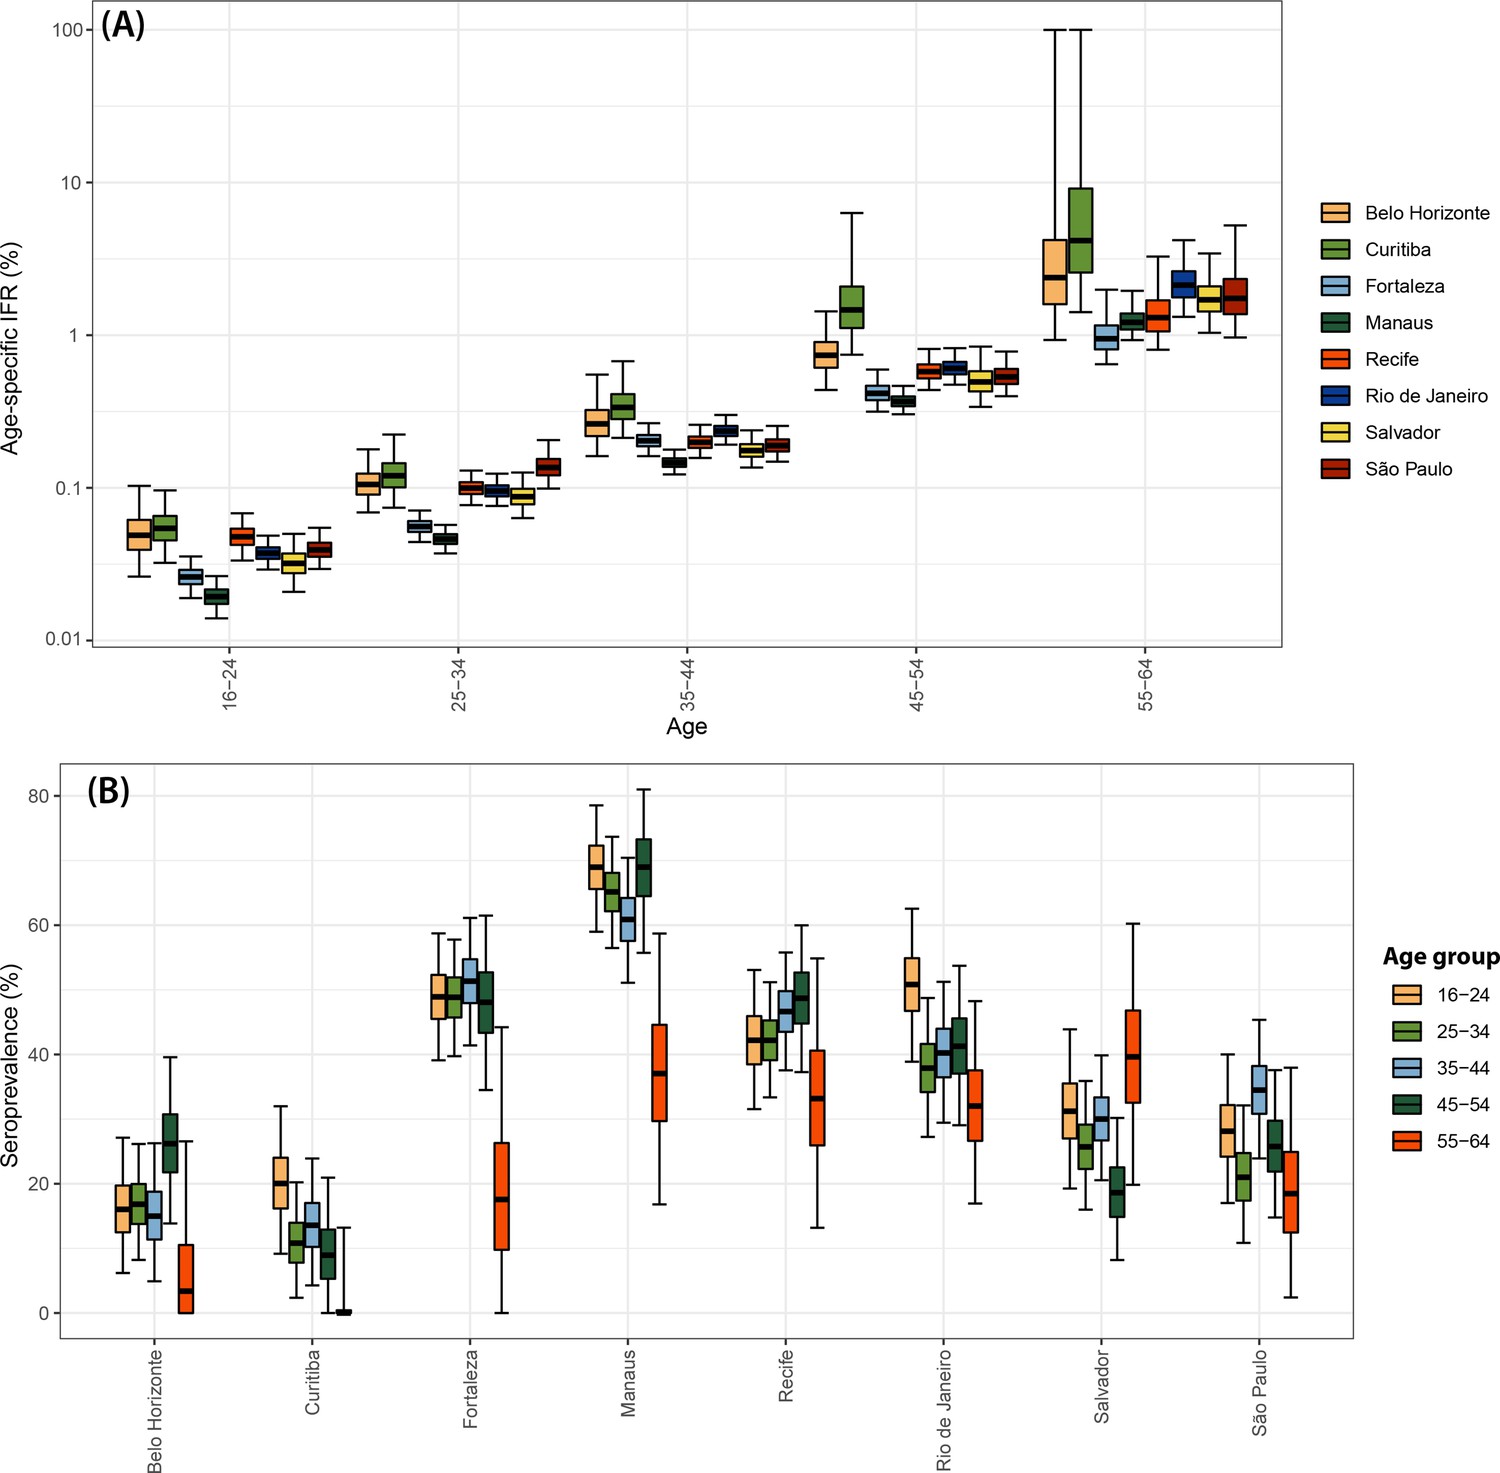
Infection fatality rate (IFR) and seroprevalence measured in December 2020 using 0.1 as threshold and correcting for sensitivity, specificity, and reweighting by age and sex.
No seroreversion correction was performed to estimate the seroprevalence. That the wide confidence intervals for the IFR of Curitiba and Belo Horizonte are due to the small number of infections and deaths in these cities.
Appendix 1—figure 23
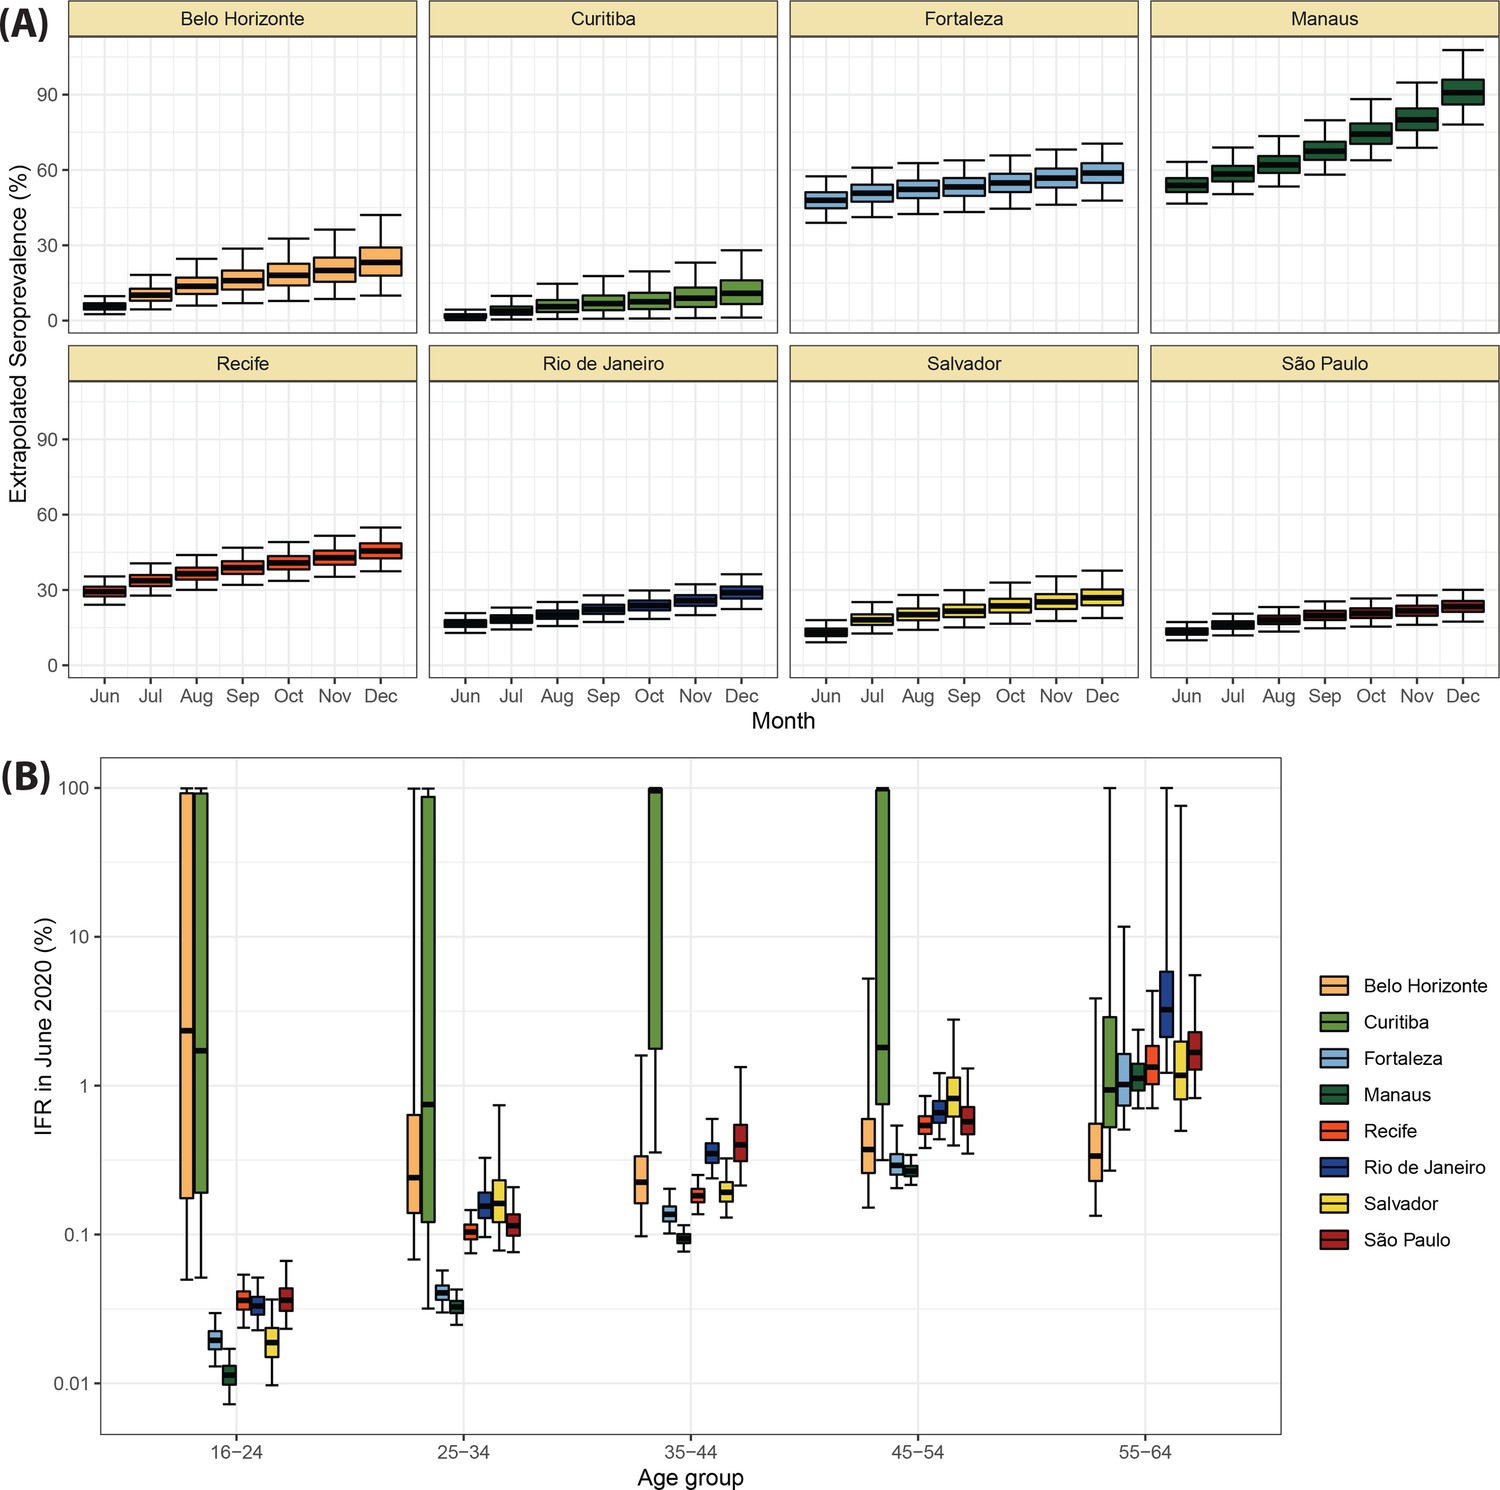
Validation of the seroprevalence estimates using infection fatality rate (IFR) extrapolation.
(A) Seroprevalence obtained by extrapolating the IFR measured in June 2020 to the following months. The seroprevalence was obtained by dividing the cumulative number of deaths in each month by the IFR estimated for June 2020. (B) Age-specific IFR estimated in June 2020. Cities with small attack rate in June 2020 as Belo Horizonte and Curitiba present a large uncertainty in the estimated IFR.
Appendix 1—figure 24
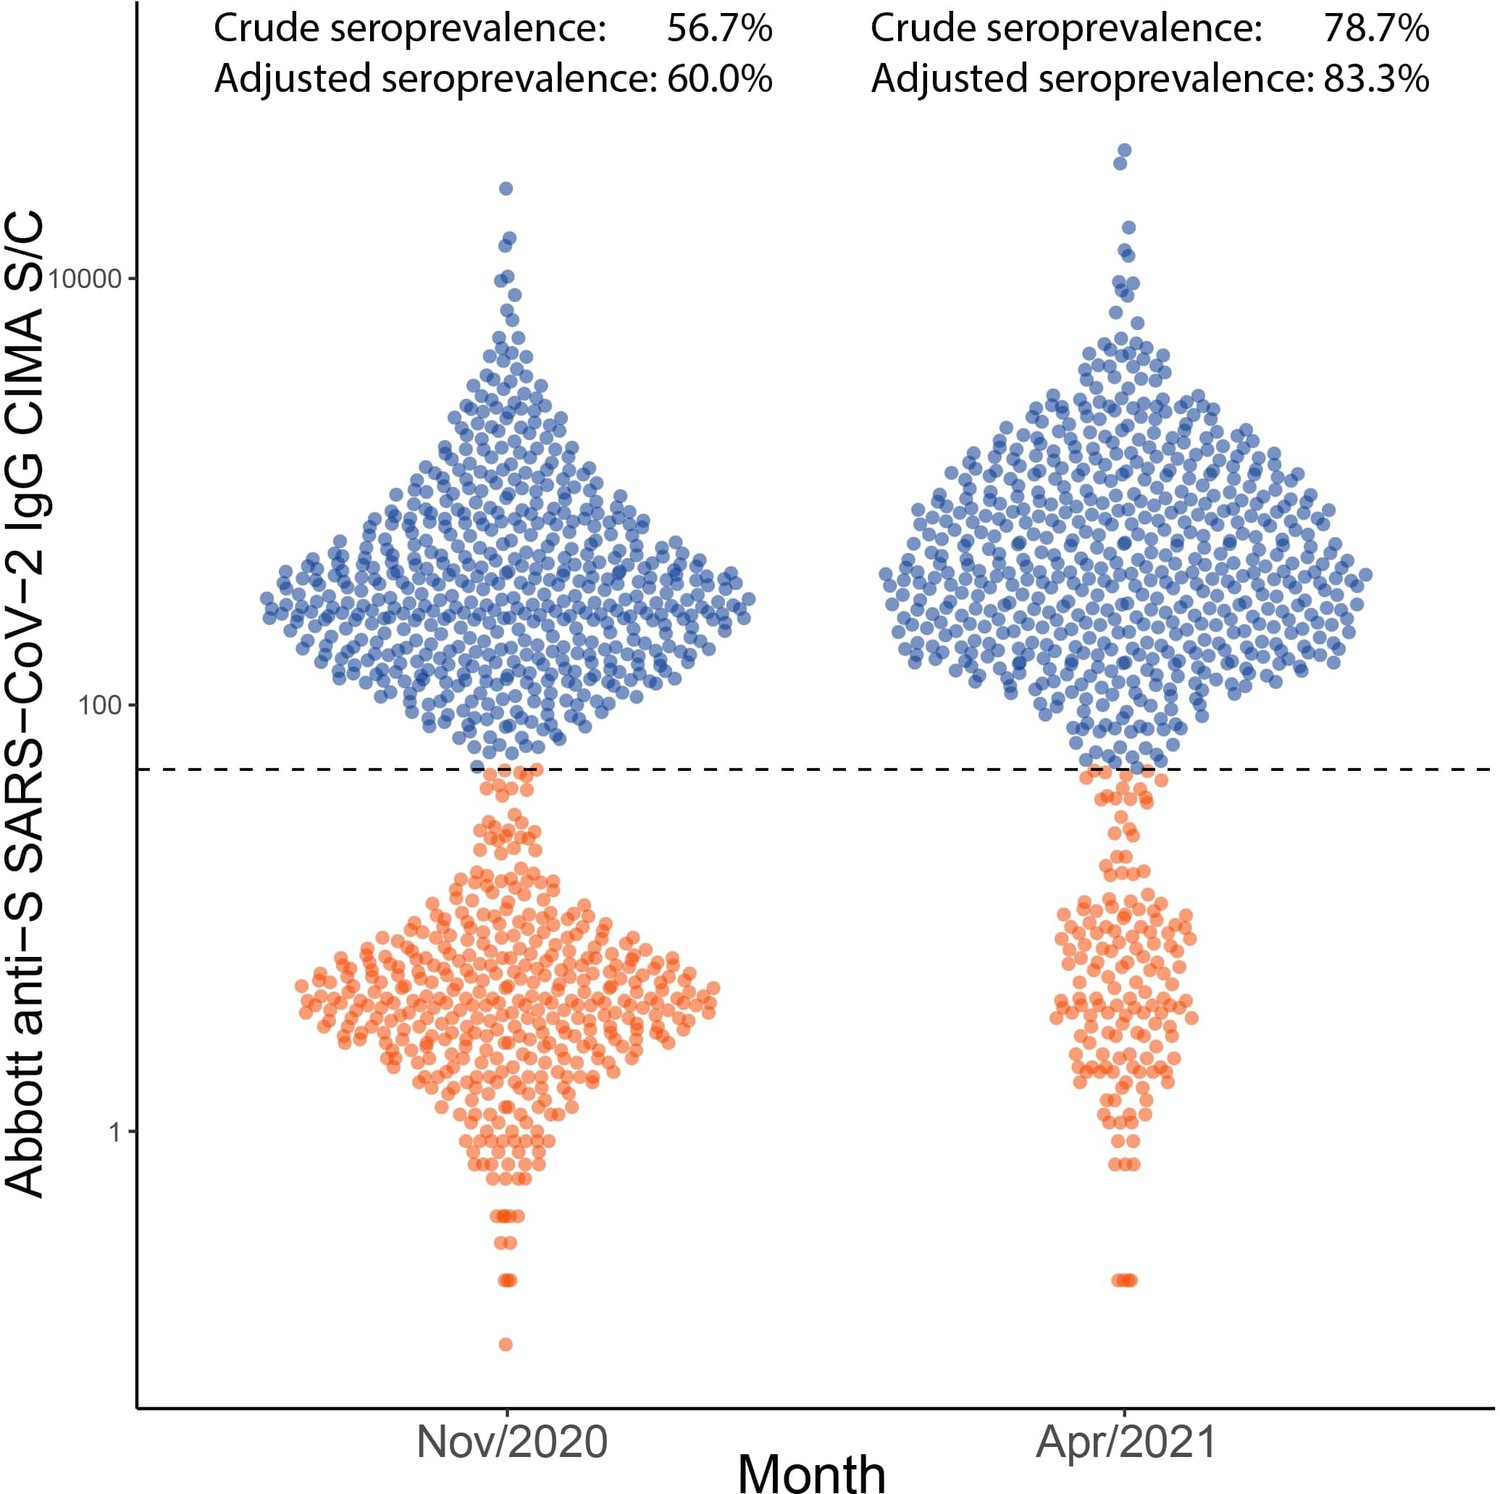
Distribution of signal to cutoff (S/C) in Manaus obtained in November 2020 and April 2021 with the anti-spike assay.
Each point represents the test result for a blood donor. Using a threshold of 50 (dashed line), the crude seroprevalence was 56.7% in November and 78.7% in April. Adjusting for sensitivity, these estimates increase to 60.0 and 83.3%.
Appendix 1—figure 25
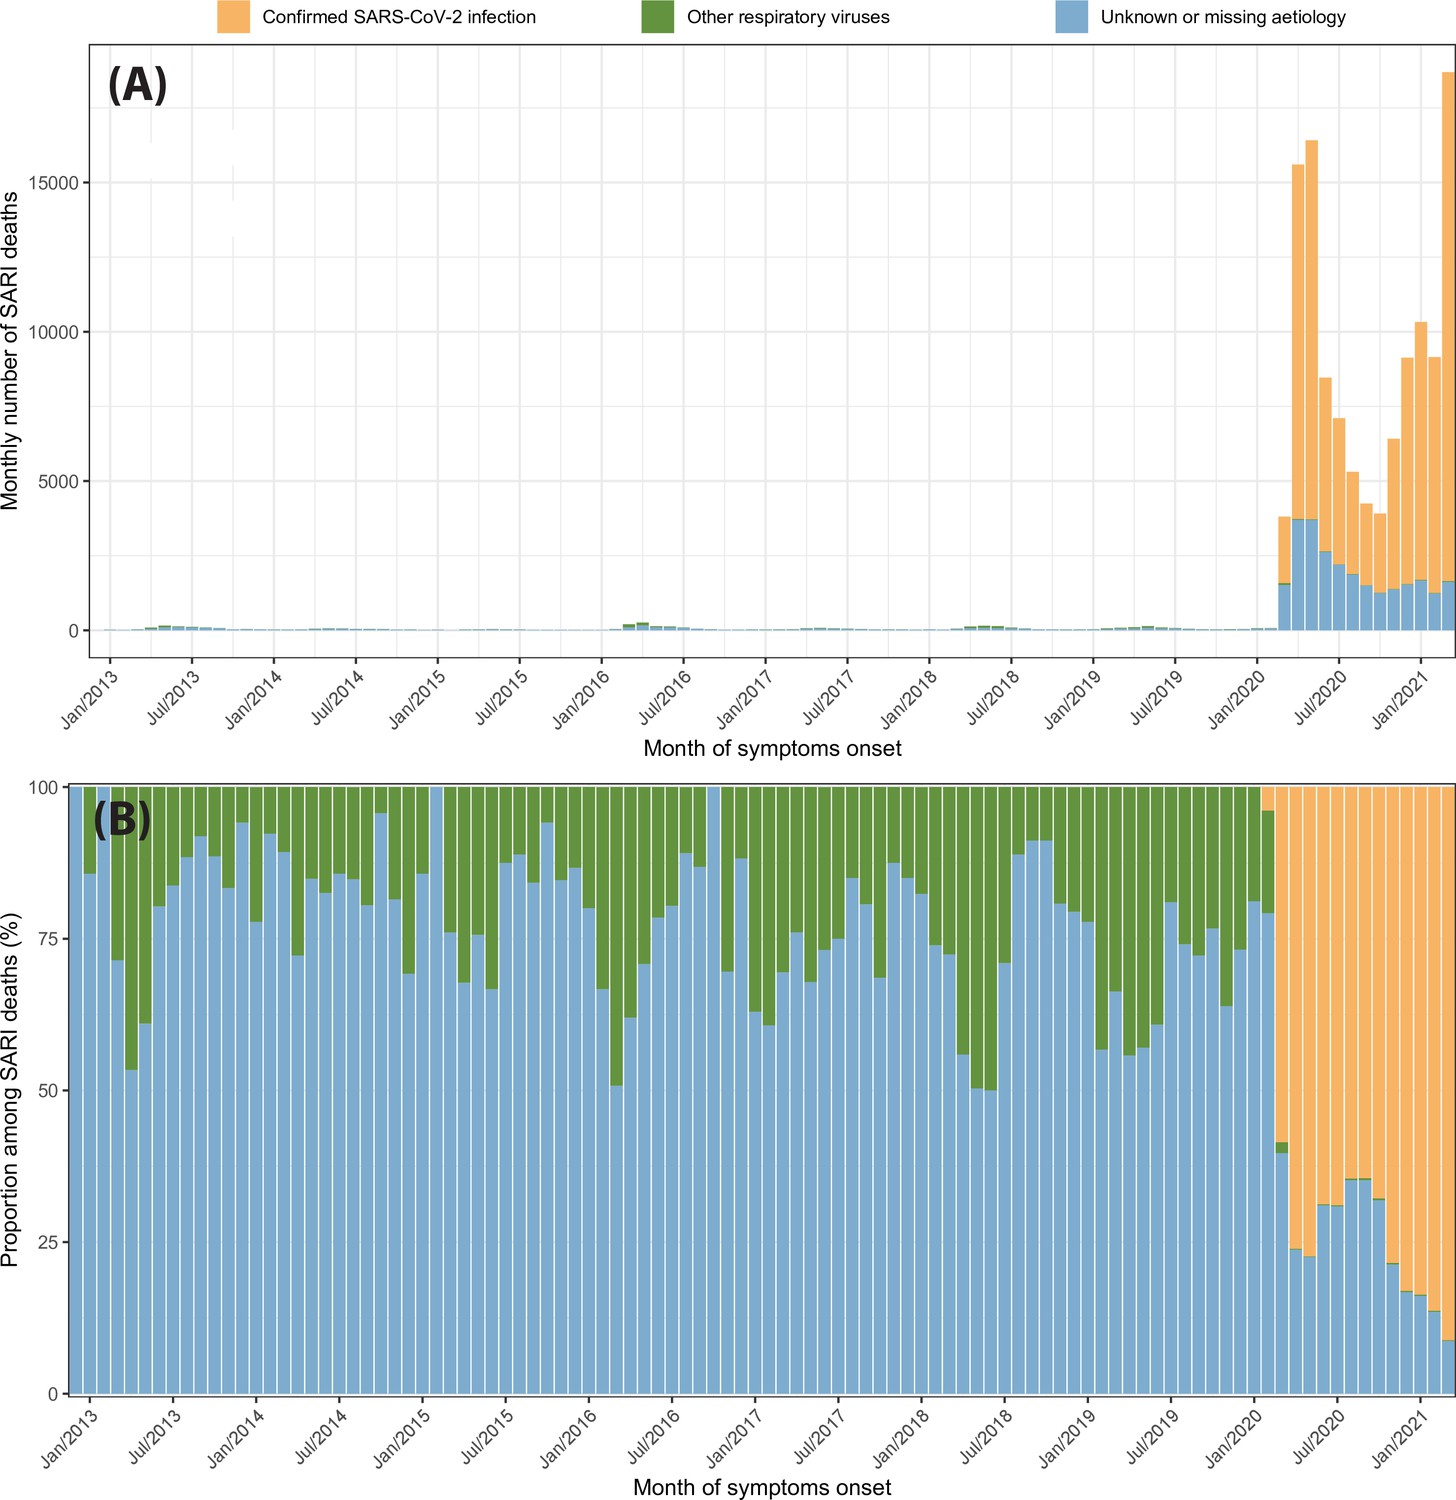
Severe acute respiratory infection (SARI) deaths disaggregated by case classification over time.
(A) Monthly number of SARI deaths in the eight cities for each case classification recorded in the SIVEP-Gripe dataset from 2013 to 2021. (B) Proportion of SARI deaths following each classification among all SARI deaths recorded in that month.
Appendix 1—figure 26
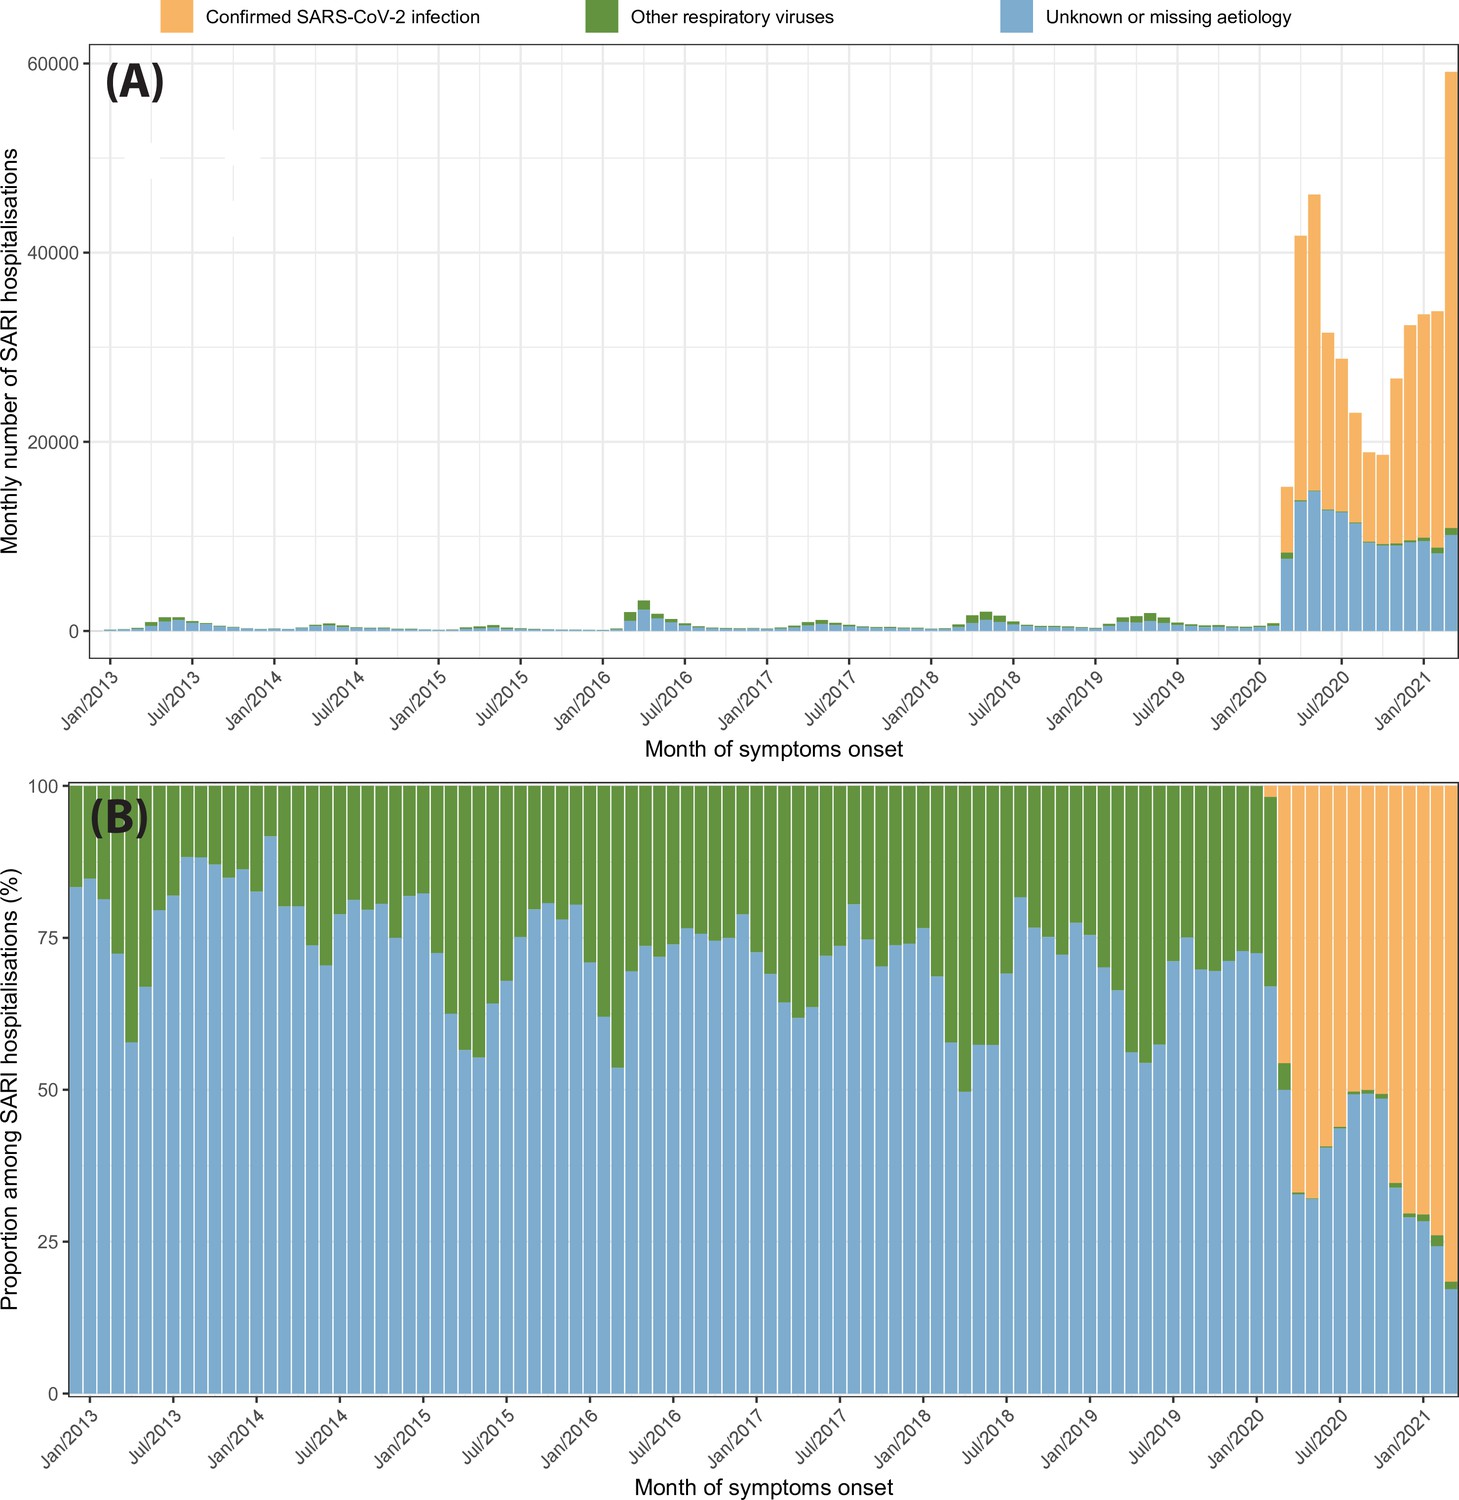
Severe acute respiratory infection (SARI) hospitalisations disaggregated by case classification over time.
(A) Monthly number of SARI hospitalisations in the eight cities for each case classification recorded in the SIVEP-Gripe dataset from 2013 to 2021. (B) Proportion of SARI hospitalisations following each classification among all SARI hospitalisations recorded in that month.
Tables
Table 1
Attack rate estimates for 16 December 2020 (before the Gamma-dominated wave in Manaus) and 24 February 2021.
This table contains the attack rate estimated by our seroreversion correction model along with the crude seroprevalence and the adjusted seroprevalence obtained by correcting the crude seroprevalence by sensitivity, specificity, and reweighted by age and sex, but without any correction for seroreversion. Seroprevalence estimates can surpass 100% due to reinfections. Seroprevalence estimates are only available for all cities simultaneously until 24 February 2021.
| December 2020 | February 2021 | |||||
|---|---|---|---|---|---|---|
| Crude seroprevalence (%) | Adjusted seroprevalence with no correction for seroreversion (%) | Attack rate (%) | Crude seroprevalence (%) | Adjusted seroprevalence with no correction for seroreversion (%) | Attack rate (%) | |
| Belo Horizonte | 12.8 (10.8–15.1) | 13.1 (10.0–16.5) | 20.6 (18.6–22.7) | 25.2 (22.5–28.1) | 27.8 (23.7–32.3) | 27.8 (25.2–30.6) |
| Curitiba | 15.2 (13.0–17.5) | 14.4 (11.5–17.7) | 19.3 (17.5–21.2) | 30.8 (28.0–33.7) | 31.1 (27.4–35.1) | 27.6 (25.2–30.3) |
| Fortaleza | 28.1 (25.4–31.0) | 29.8 (25.6–34.2) | 48.8 (45.4–52.7) | 24.9 (22.2–27.7) | 26.6 (22.6–31.0) | 57.4 (53.3–62.2) |
| Manaus | 34.6 (31.6–37.7) | 36.1 (32.0–40.6) | 75.0 (70.8–80.3) | 47.7 (44.4–51.0) | 52.6 (47.8–57.8) | 95.8 (90.6–102.5) |
| Recife | 27 (24.3–29.8) | 30.7 (25.9–35.8) | 49.4 (46.1–53.1) | 27.4 (24.7–30.2) | 27.1 (23.2–31.5) | 59.9 (55.6–64.6) |
| Rio de Janeiro | 24.4 (21.7–27.2) | 24.8 (21.4–28.4) | 42.2 (39.4–45.4) | 34.5 (31.6–37.5) | 36.8 (32.9–41.0) | 54.7 (51.1–58.9) |
| Salvador | 18.4 (16.0–21.0) | 18.4 (15.3–22.0) | 35.3 (32.8–38.1) | 20.1 (17.6–22.7) | 20.1 (16.8–23.8) | 42.4 (39.5–45.8) |
| São Paulo | 18.8 (16.5–21.4) | 19.0 (15.9–22.4) | 26.6 (24.3–29.1) | 21.7 (19.1–24.4) | 22.3 (19.0–25.9) | 33.3 (30.3–36.5) |
Additional files
-
Supplementary file 1
Number of true positives (TPs), true negatives (TNs), false positives (FPs), and false negatives (FN) used to estimate the sensitivity of the anti-nucleocapsid assay for the thresholds 1.4, 0.49, and 0.1 signal to cutoff (S/C), and for the anti-spike assay for the threshold 50.0.
Sensitivity and specificity were calculated by computing the quantiles of Beta (1+TP, 1+FN) and Beta (1+TN, 1+FP), respectively.
- https://cdn.elifesciences.org/articles/78233/elife-78233-supp1-v3.docx
-
Supplementary file 2
Age-specific infection fatality rates (IFRs) and 95% credible intervals obtained with the seroprevalence estimated with our seroreversion correction model and with a threshold of 0.1 signal to cutoff corrected for sensitivity and specificity.
- https://cdn.elifesciences.org/articles/78233/elife-78233-supp2-v3.docx
-
MDAR checklist
- https://cdn.elifesciences.org/articles/78233/elife-78233-mdarchecklist1-v3.pdf
Download links
A two-part list of links to download the article, or parts of the article, in various formats.
Downloads (link to download the article as PDF)
Open citations (links to open the citations from this article in various online reference manager services)
Cite this article (links to download the citations from this article in formats compatible with various reference manager tools)
SARS-CoV-2 antibody dynamics in blood donors and COVID-19 epidemiology in eight Brazilian state capitals: A serial cross-sectional study
eLife 11:e78233.
https://doi.org/10.7554/eLife.78233


