Multistep loading of a DNA sliding clamp onto DNA by replication factor C
- Structural Biology Program, Memorial Sloan Kettering Cancer Center, United States
- Weill Cornell Medicine Graduate School, Weill Cornell Medicine, United States
- Molecular Biology Program, Memorial Sloan Kettering Cancer Center, United States
Figures
Figure 1 with 3 supplements
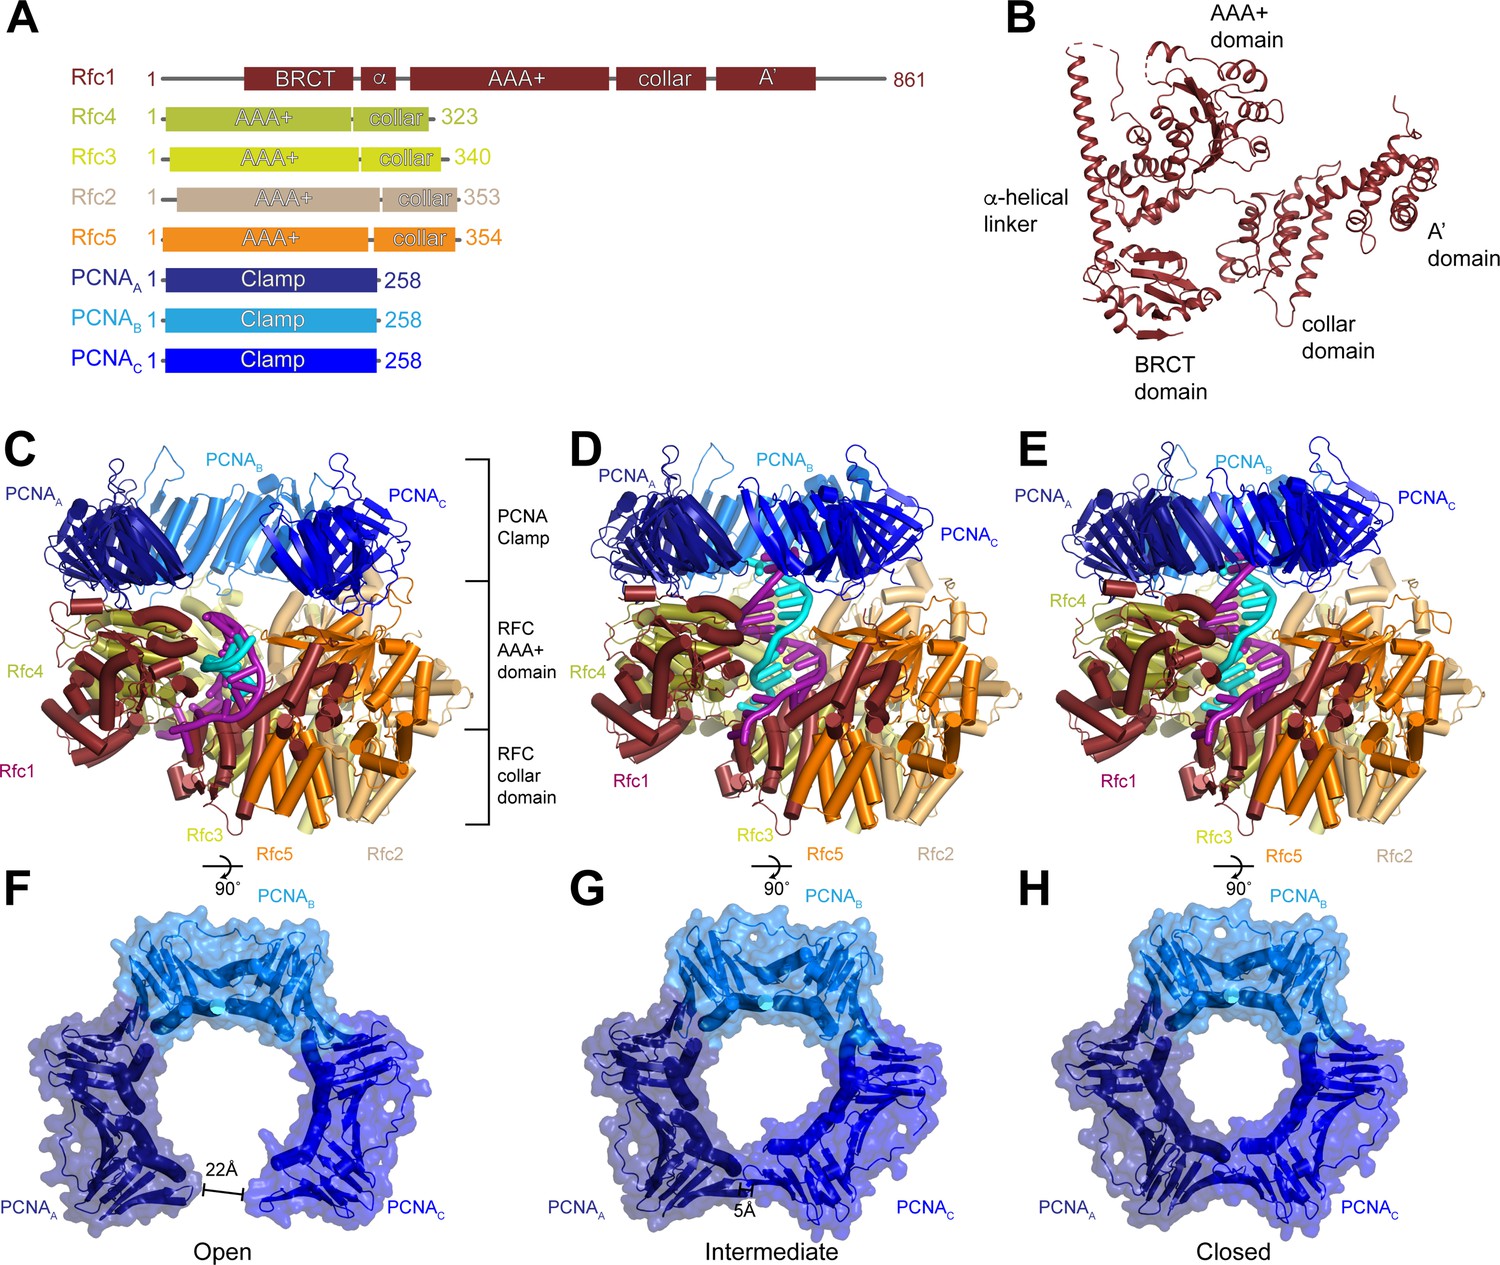
Structures of replication factor C (RFC) in active states in complex with proliferating cell nuclear antigen (PCNA).
(A) Domain arrangement of subunits resolved in RFC-PCNA structures. (B) Structure of yeast Rfc1.( C–E) Structures of RFC:PCNA in open (C), intermediate (D), and closed (E) states, colored by subunit. Rfc1 is maroon, Rfc4 is gold, Rfc3 is yellow, Rfc2 is sand, Rfc5 is orange, and the PCNA protomers are blue. DNA is shown in cyan and magenta. (F–H) Open (F), intermediate (G), and closed (H) conformations of PCNA, colored by subunit.
Figure 1—figure supplement 1

Purification and analysis of RFC:PCNA.
(A) Representative Coomassie-stained SDS-PAGE analysis of purified Saccharomyces cerevisiae RFC, PCNA, and RPA. (B) ATPase activity of RFC in the presence of PCNA and DNA (black circles), RFC in the presence of DNA (teal triangles), RFC in the presence of PCNA (purple triangles), and PCNA and DNA (pink squares). Experiments are shown in duplicate. (C) Schematic for the assembly of RFC:PCNA:DNA in the presence of ATPγS. (D) Representative silver-stained SDS-PAGE analysis of RFC:PCNA fractions following glycerol gradient (10–35%) centrifugation. Fractions pooled for cryo-EM analysis are denoted with *. (E) Representative Coomassie-stained SDS-PAGE analysis of purified S. cerevisiae RFC:PCNA:DNA. RFC, replication factor C; PCNA, proliferating cell nuclear antigen.
-
Figure 1—figure supplement 1—source data 1
Uncropped images of gels presented in Figure 1—figure supplement 1.
- https://cdn.elifesciences.org/articles/78253/elife-78253-fig1-figsupp1-data1-v1.pdf
Figure 1—figure supplement 2
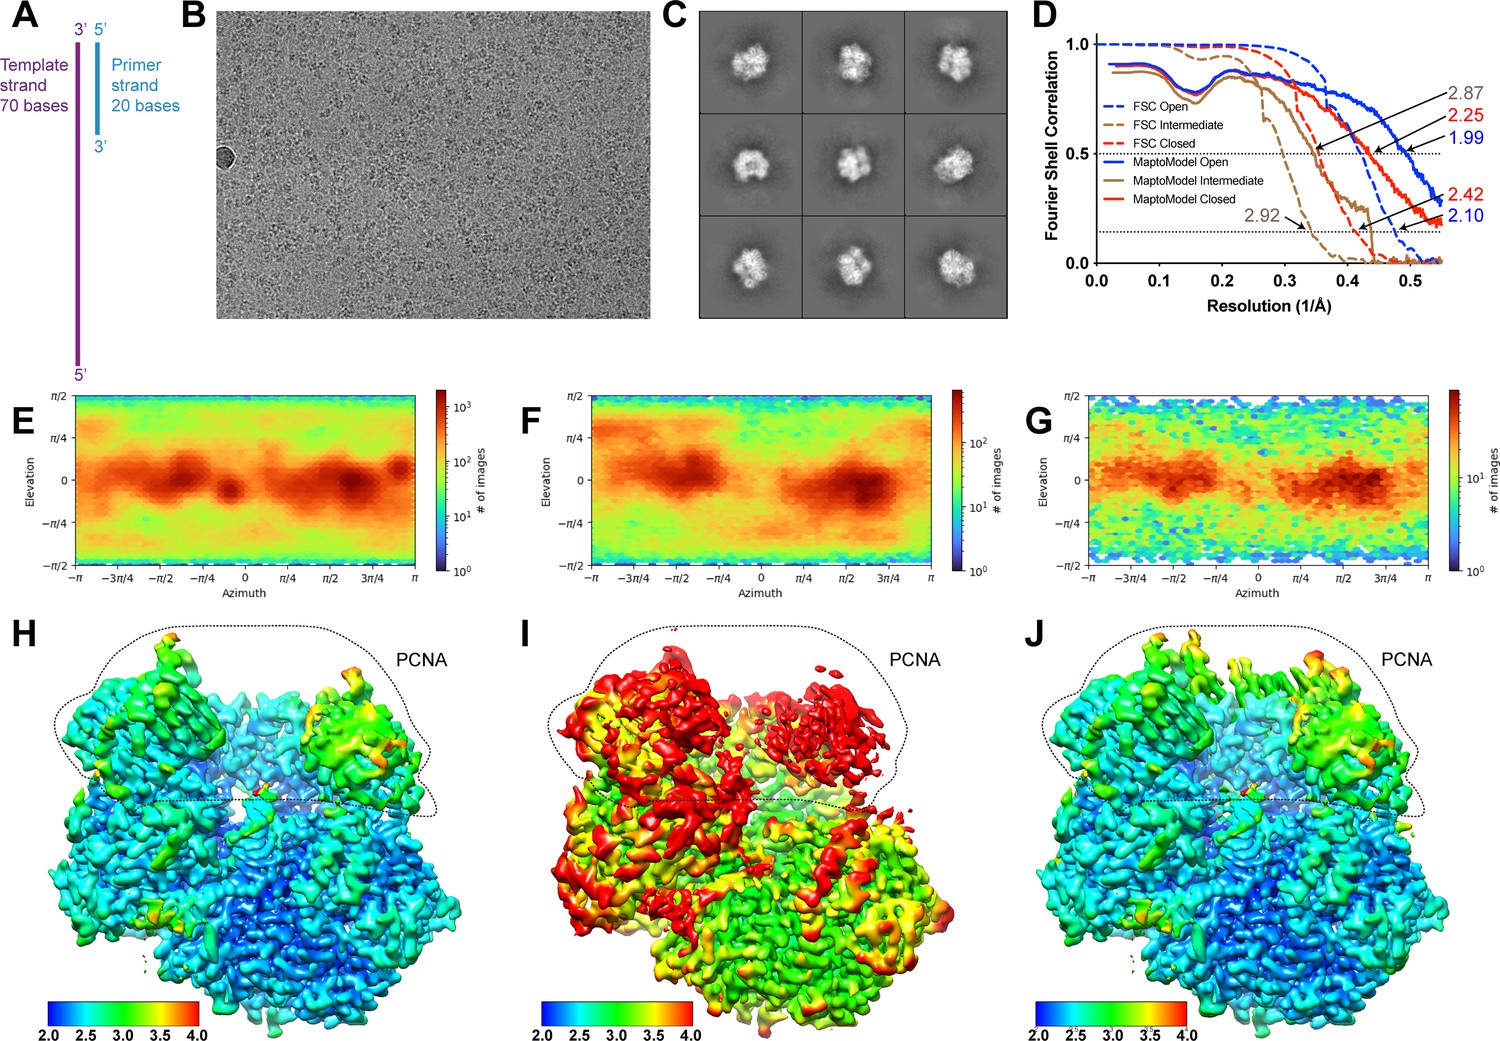
Cryo-EM analysis of RFC:PCNA with DNA substrate 1 (DNA1).
(A) Schematic of DNA1. (B) Representative cryo-EM image of vitrified RFC:PCNA:DNA1. (C) Representative two-dimensional averages of RFC:PCNA:DNA1. (D) Plot of Fourier shell correlations between two independent open state half-maps (dashed blue), two independent intermediate state half-maps (dashed brown), two independent closed state half-maps (dashed red), the open state map and open state atomic model (blue), the intermediate state map and intermediate state atomic model (brown), and the closed state map and closed state atomic model (red). (E–G) Angular distribution plots for open (E), intermediate (F), and closed (G) reconstructions. (H–J) Cryo-EM density maps of open (H), intermediate (I), and closed (J) maps colored by local resolution in Å. Region in dashed area corresponds to PCNA densities. RFC, replication factor C; PCNA, proliferating cell nuclear antigen.
Figure 1—video 1
Morph between open and closed states of RFC:PCNA with DNA substrate 1.
RFC, replication factor C; PCNA, proliferating cell nuclear antigen.
Figure 2 with 5 supplements
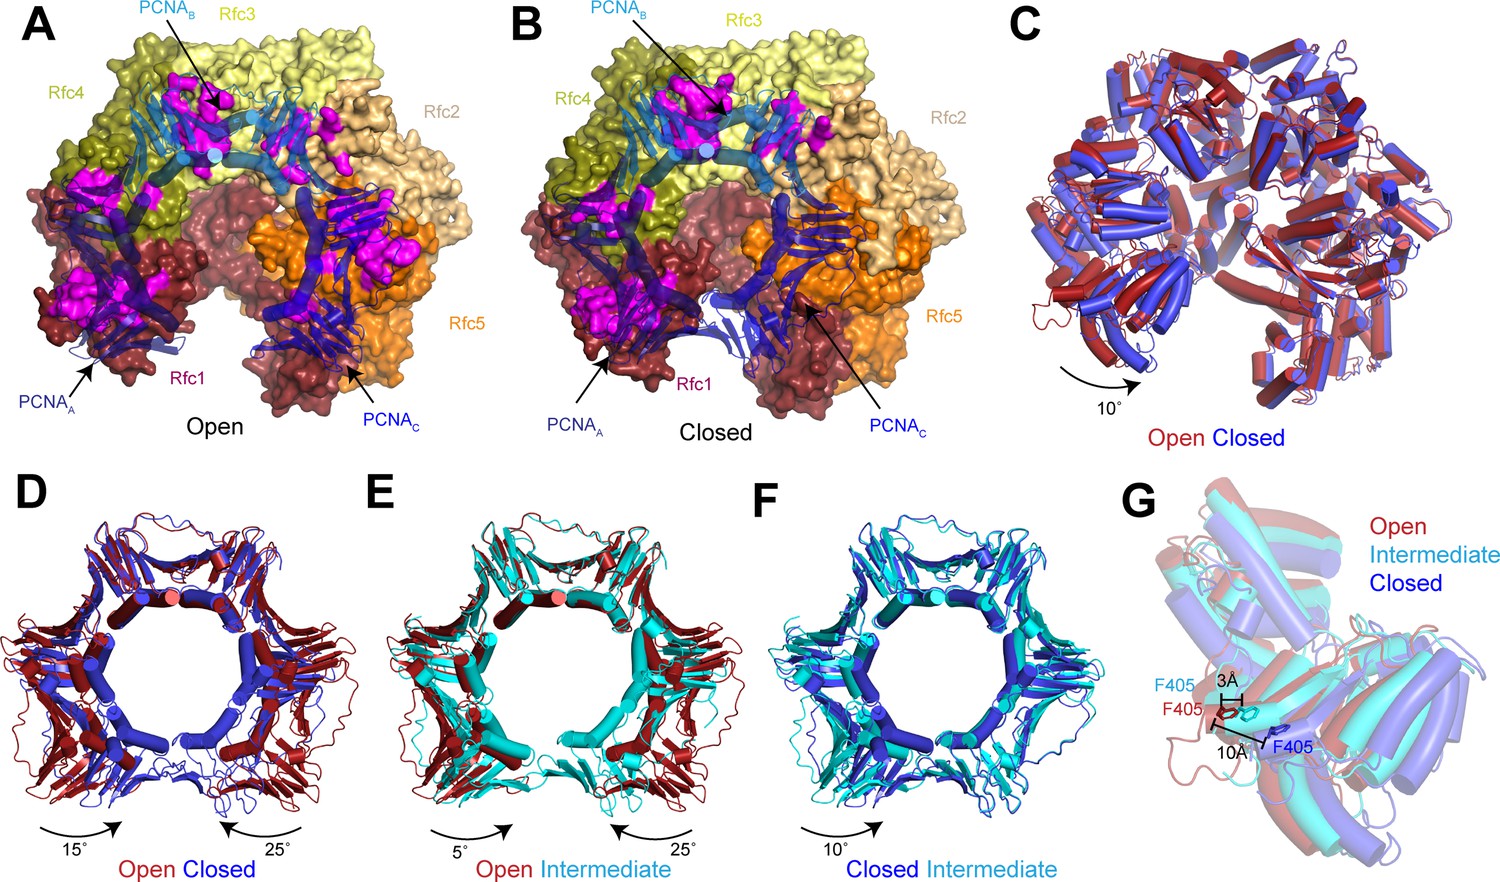
Replication factor C (RFC) stabilizes proliferating cell nuclear antigen (PCNA) in the open conformation.
(A–B) Structures of RFC:PCNA in open (A) and closed (B) states. RFC is shown as a surface and PCNA is shown as a transparent cartoon. RFC and PCNA are colored by subunit with residues on RFC that interact with PCNA highlighted in magenta. DNA is removed for clarity. (C) Superposition of RFC in open (red) and closed (blue) states. Structures are aligned using Rfc3. (D–F) Superpositions of PCNA between open and closed (D), open and intermediate (E), and closed and intermediate states (F). Structures are aligned using PCNAB. Open PCNA is red, intermediate PCNA is cyan, and closed PCNA is blue. (G) Rfc1 in open (red), intermediate (cyan), and closed (blue) states. Phe405 is shown as sticks. Structures are aligned using Rfc3.
Figure 2—figure supplement 1
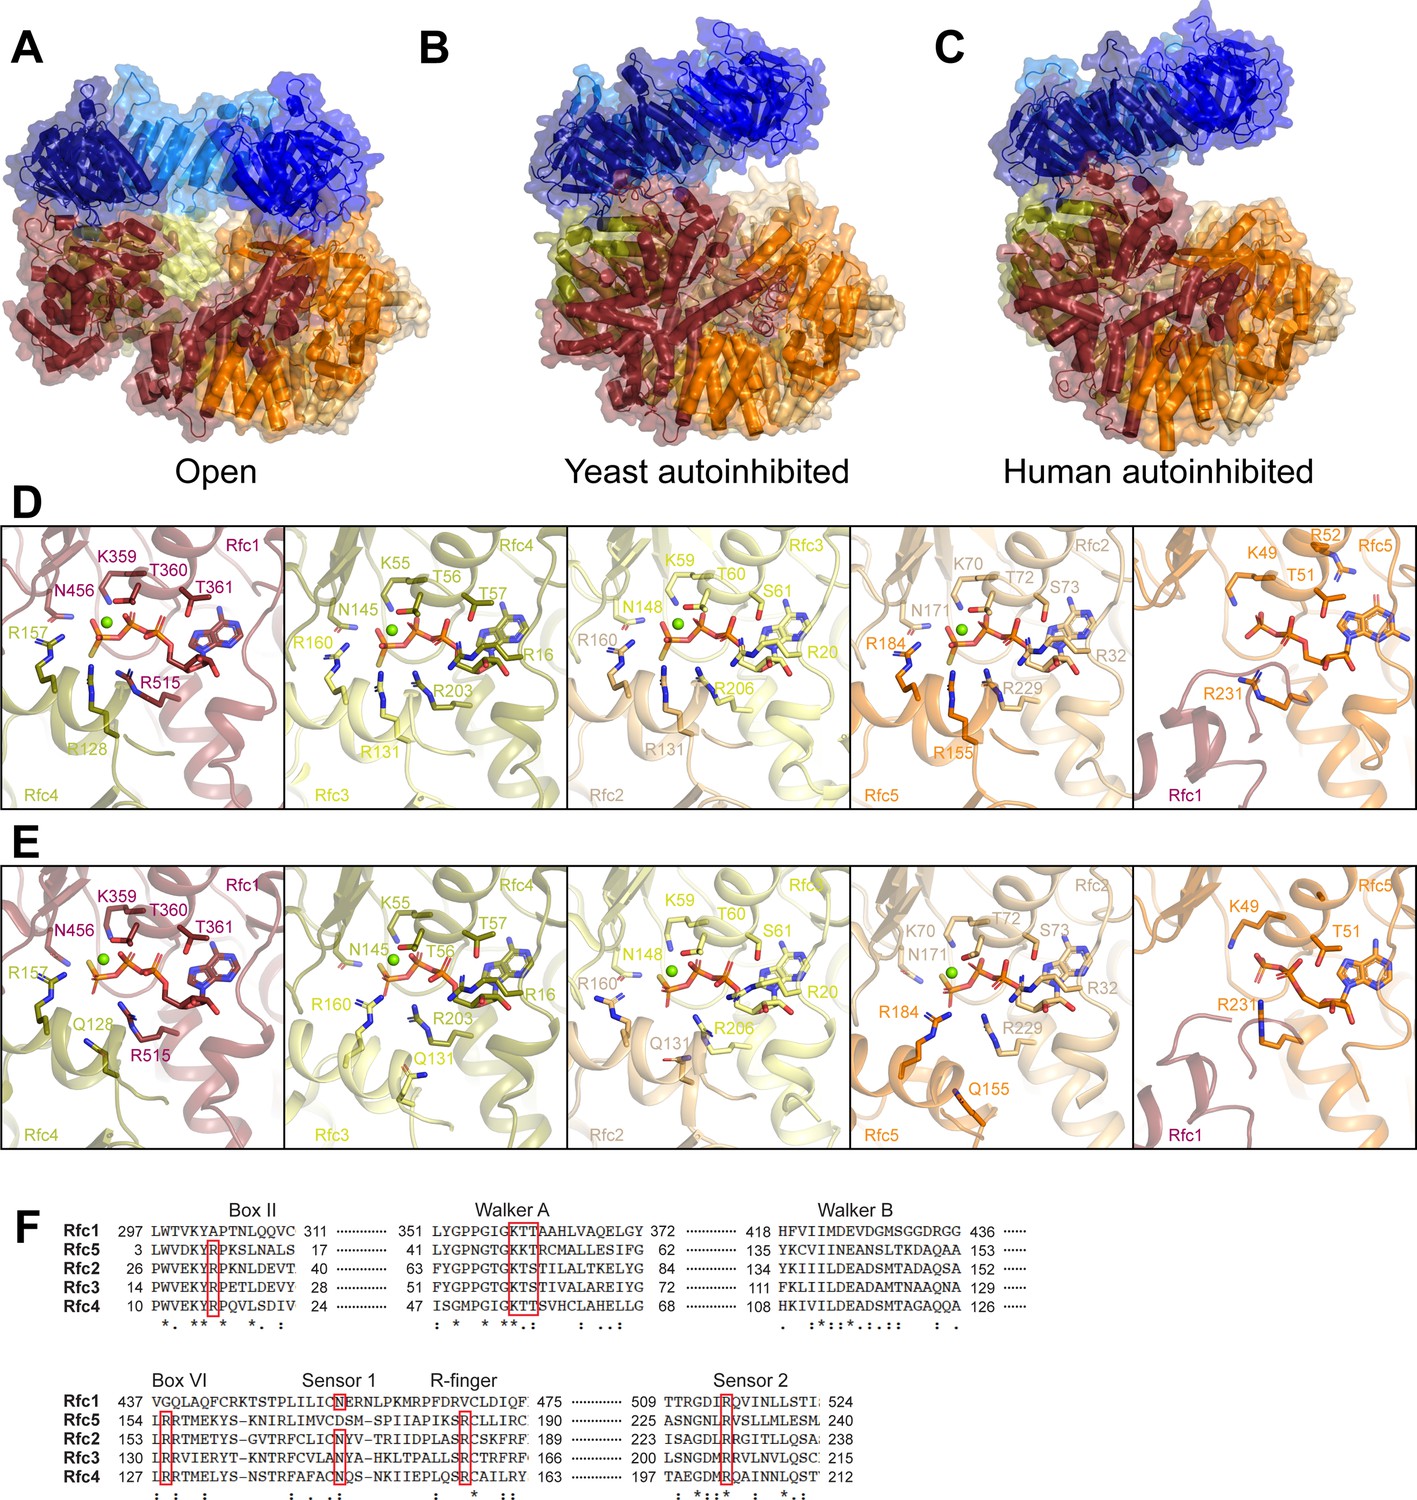
Comparison of RFC:PCNA:DNA1 with structures of yeast and human RFC in autoinhibited states bound to PCNA.
(A–C) Structures of open RFC:PCNA:DNA1 (A), autoinhibited yeast RFC:PCNA (B, PDB: 1SXJ), and autoinhibited human RFC:PCNA (C, PDB: 6VVO). Structures are colored by subunit as in Figure 1. (D–E) Rfc1, Rfc4, Rfc3, Rfc2, and Rfc5 nucleotide-binding sites in RFC:PCNA:DNA1 (D) and autoinhibited yeast RFC:PCNA PDB: 1SXJ (E). (F) Sequence alignment of conserved nucleotide-binding residues in Rfc1, Rfc5, Rfc2, Rfc3, and Rfc4 with conserved motifs highlighted by red boxes. RFC, replication factor C; PCNA, proliferating cell nuclear antigen; DNA1, DNA substrate 1.
Figure 2—figure supplement 2
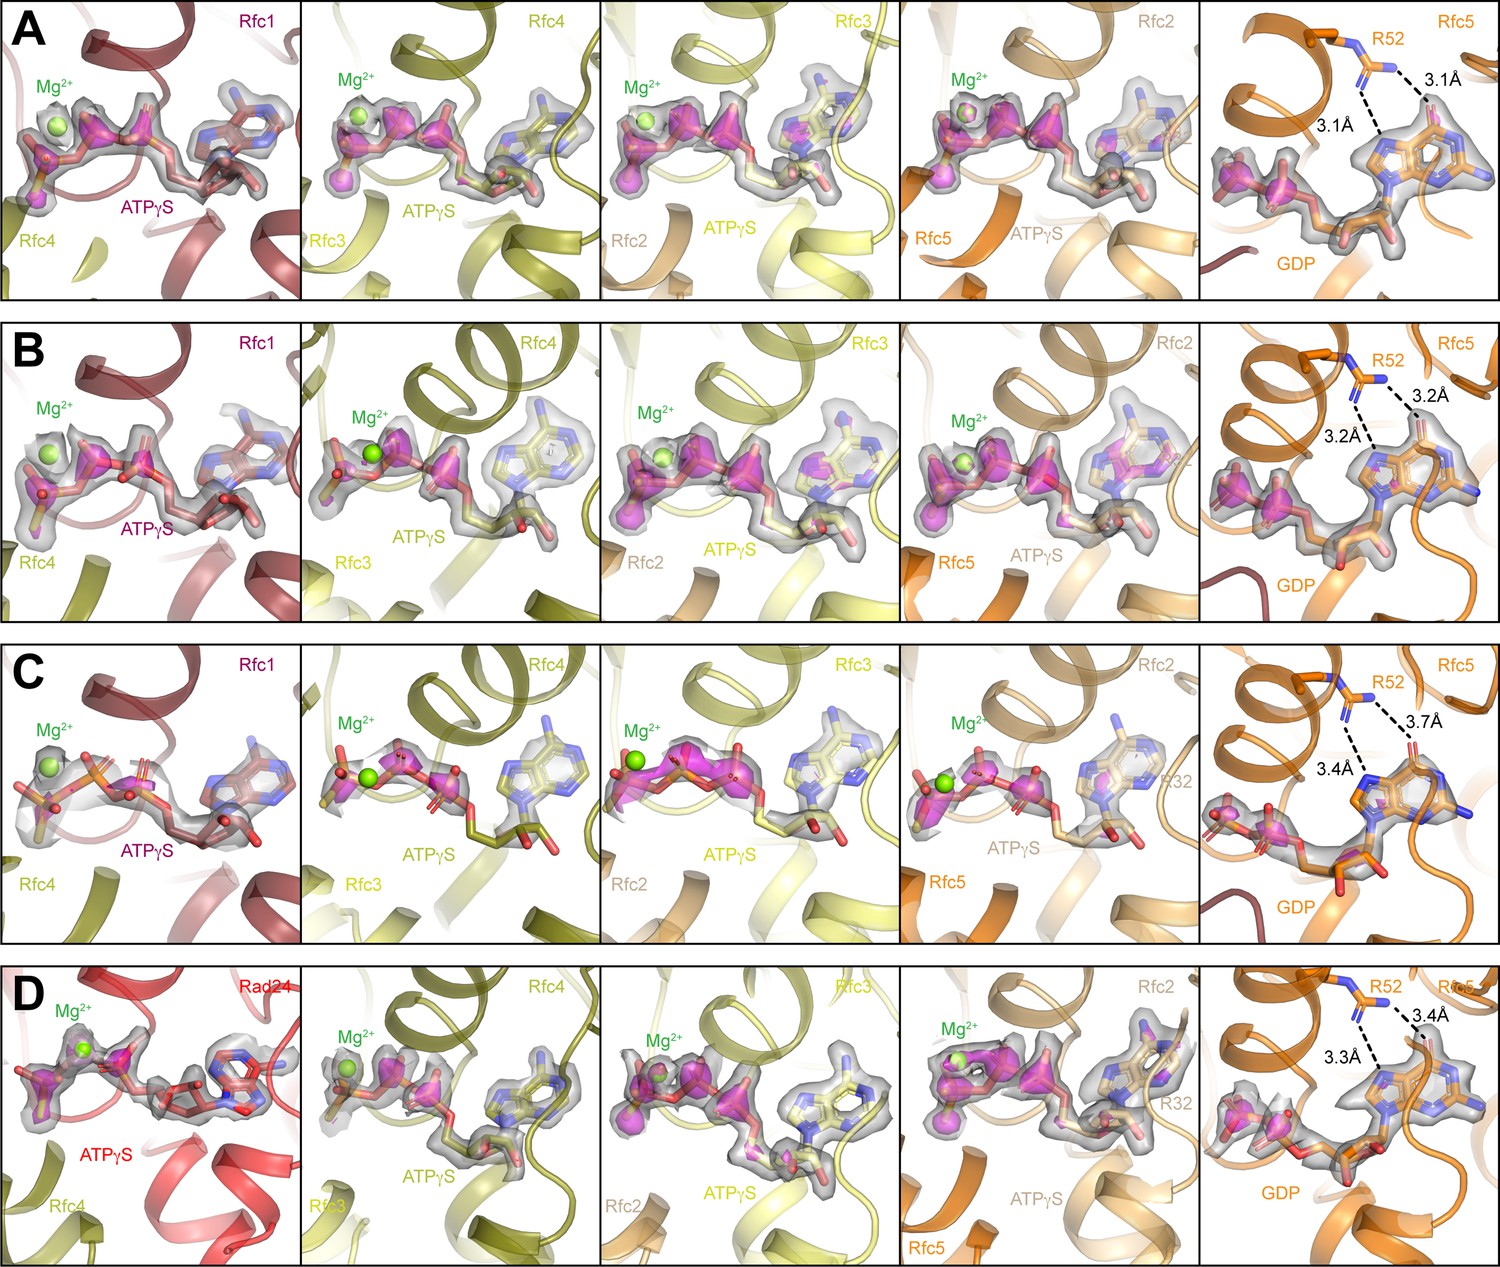
Comparison of nucleotide densities in RFC-PCNA and Rad24-RFC.
(A) Density for nucleotides bound to Rfc1, Rfc4, Rfc3, Rfc2, and Rfc5 in open RFC:PCNA:DNA1 contoured at 15 s in gray surface and 40 s in magenta surface. (B) Density for nucleotides bound to Rfc1, Rfc4, Rfc3, Rfc2, and Rfc5 in closed RFC:PCNA:DNA2 contoured at 14 s in gray surface and 40 s in magenta surface. (C) Density for nucleotides bound to Rfc1, Rfc4, Rfc3, Rfc2, and Rfc5 in intermediate RFC:PCNA:DNA1 contoured at 7 s (4 s for Rfc1) in gray surface and 12 s (10 s for Rfc1) in magenta surface. (D) Density for nucleotides bound to Rad24, Rfc4, Rfc3, Rfc2, and Rfc5 in open Rad24-RFC:PCNA:DNA contoured at 12 s in gray surface and 40 s in magenta surface. RFC, replication factor C; PCNA, proliferating cell nuclear antigen.
Figure 2—figure supplement 3
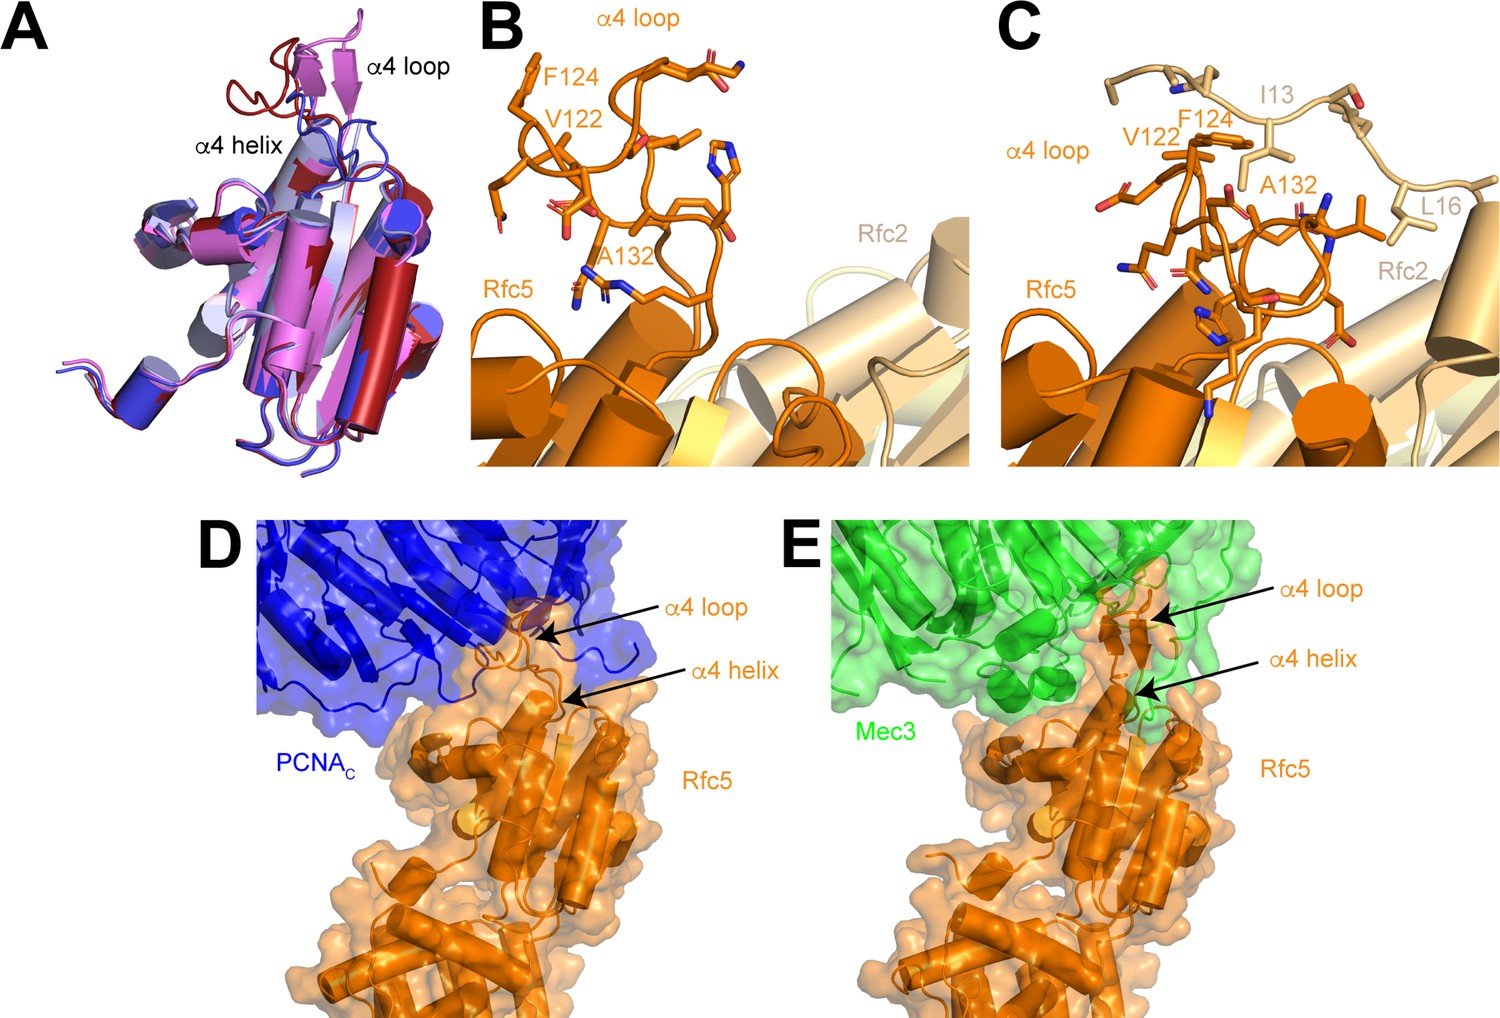
Conformational flexibility of Rfc5 α4 loop.
(A) Superposition of Rfc5 in RFC:PCNA:DNA1 open (red), RFC:PCNA:DNA1 closed (blue) states, Rad24-RFC:9-1-1:DNA in open (violet; PDB 7ST9) and closed states (light blue; PDB 7STB). (B–C) Rfc5 α4 loop in open (B) and closed (C) states. Residues in Rfc5 α4 loop and Rfc N-terminus are shown as sticks. (D) Interface between Rfc5 and PCNAC in open state. (E) Interface between Rfc5 and Mec3 in an open structure of Rad24-RFC in complex with 9-1-1 and DNA (PDB:7ST9). RFC, replication factor C; PCNA, proliferating cell nuclear antigen; DNA1, DNA substrate 1.
Figure 2—figure supplement 4
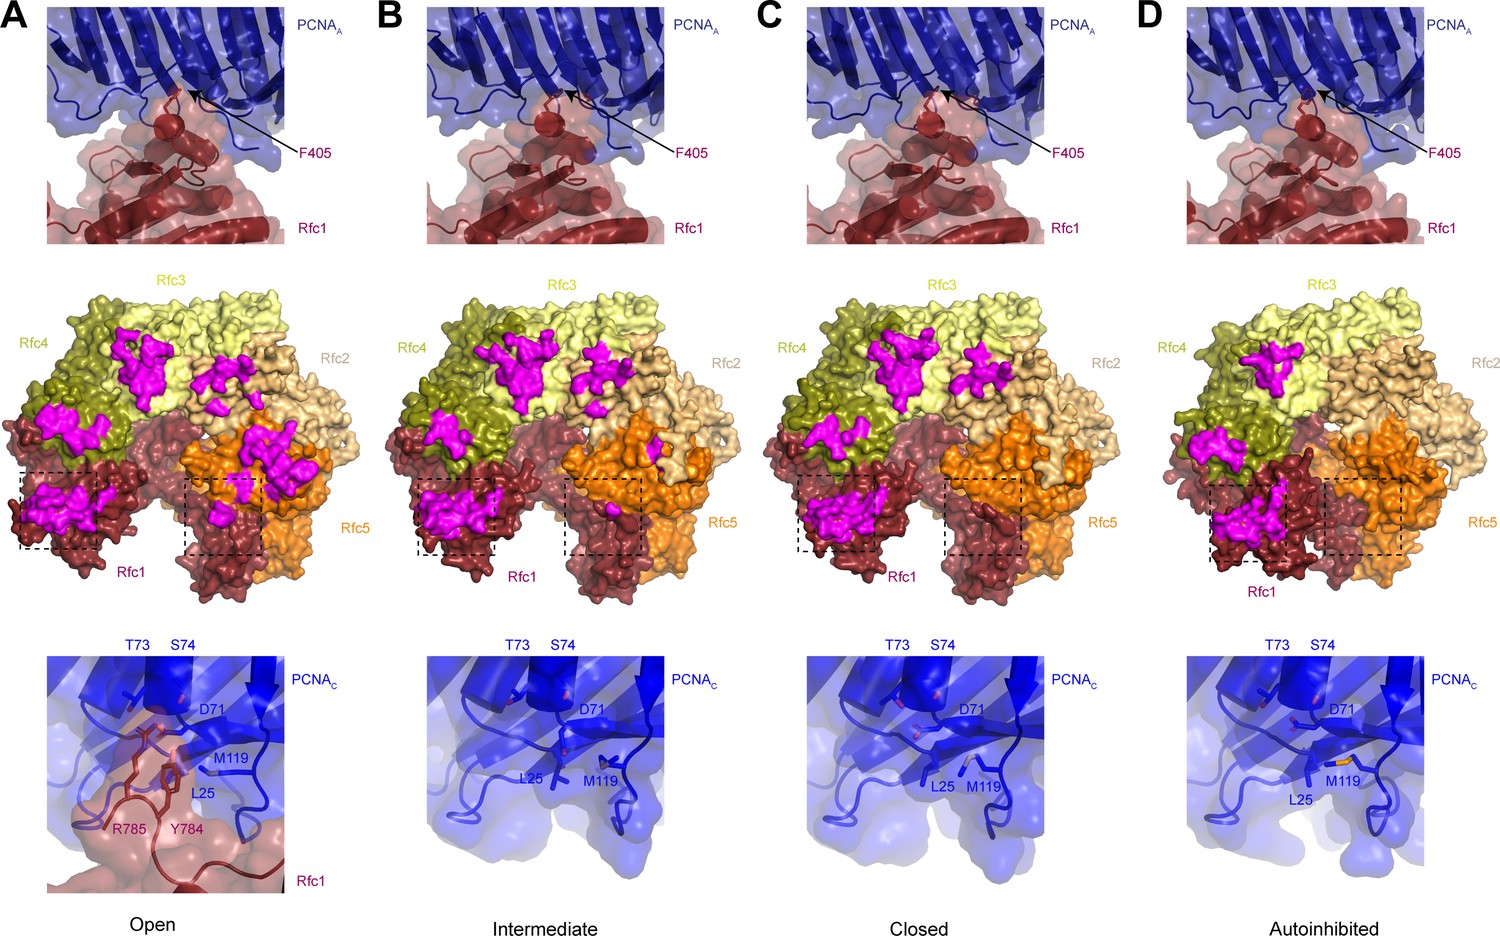
The interface between replication factor C (RFC) and proliferating cell nuclear antigen (PCNA) is distinct in different conformations.
(A–D) Top row shows the Rfc1-PCNAA interface in open (A), closed (B), intermediate (C), and autoinhibited (D) states. Middle row shows structures of RFC in open (A), closed (B), intermediate (C), and autoinhibited (D) states with residues that interact with PCNA highlighted in magenta. Bottom row shows the Rfc1-PCNAC interface in open state (A) and the free PCNAC surface in closed (B), intermediate (C), and autoinhibited (D) states.
Figure 2—video 1
Morph between open and closed states of proliferating cell nuclear antigen (PCNA).
Figure 3 with 6 supplements
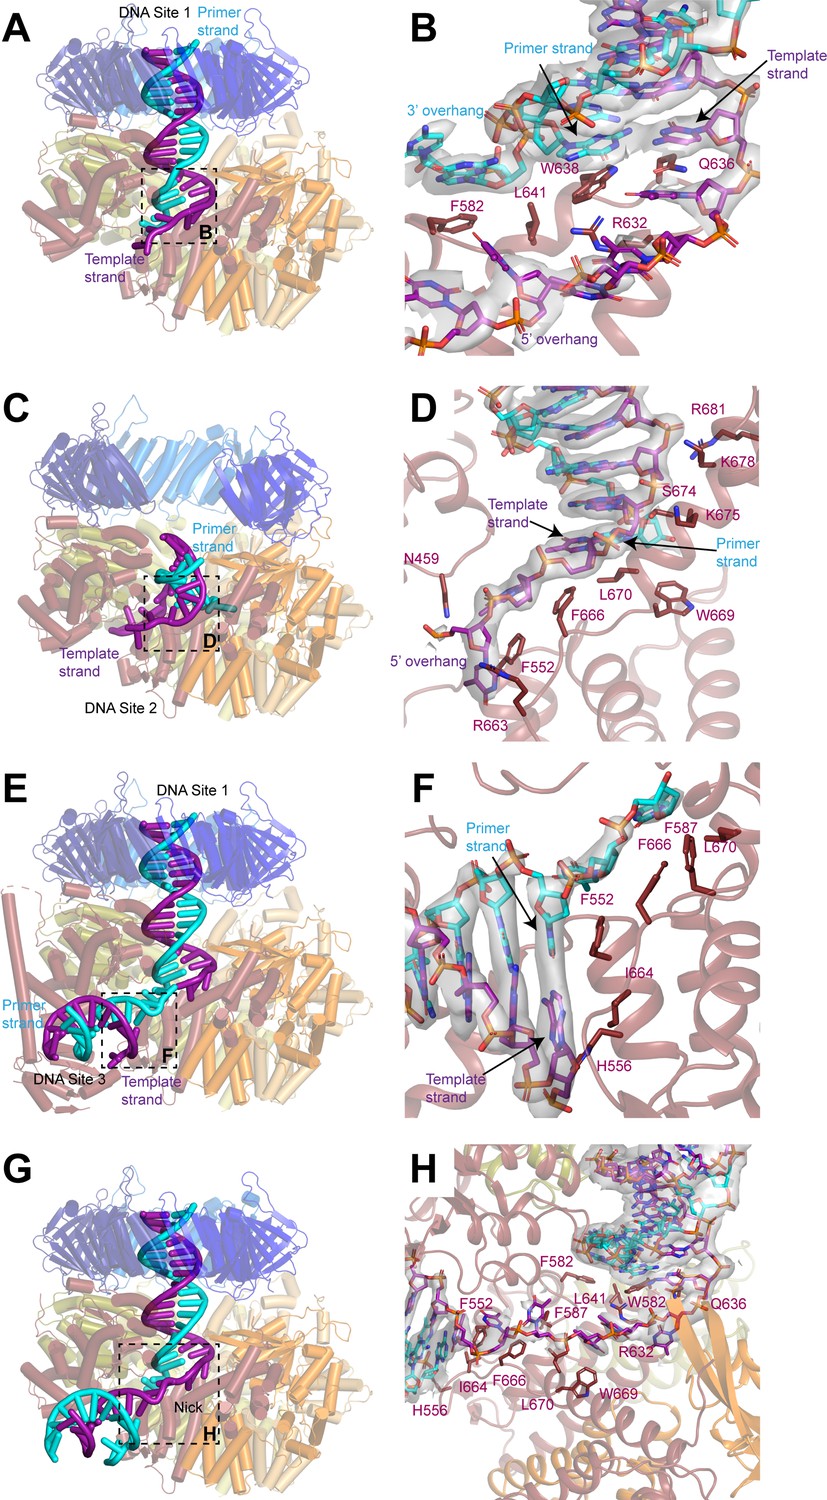
DNA binds to three sites in replication factor C (RFC).
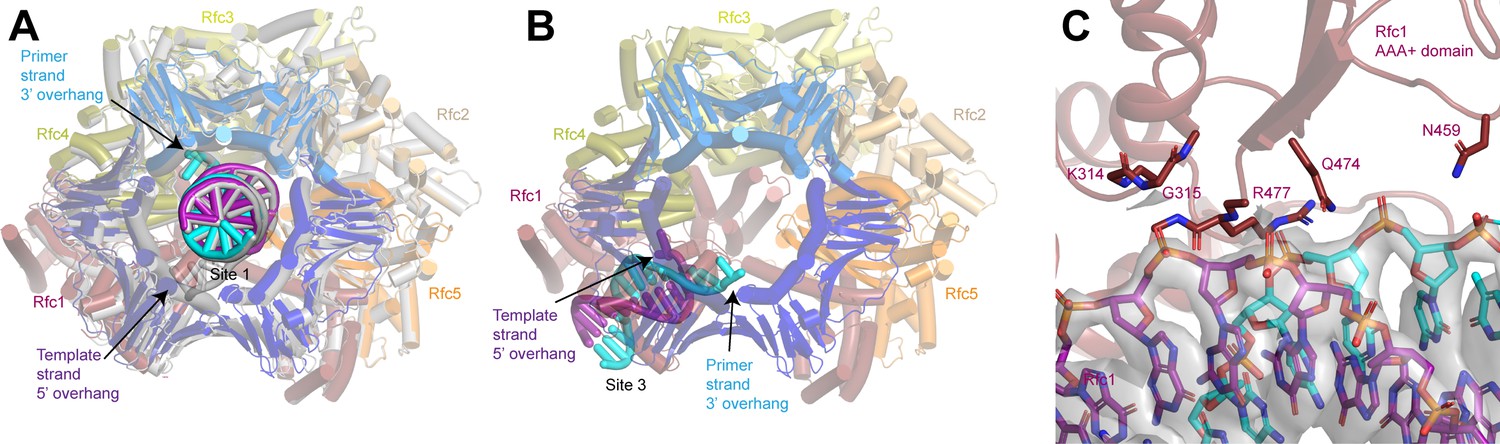
(A, C, E) Structures of RFC:PCNA:DNA in a closed state with a 3’ single-stranded (ss)/double-stranded DNA (dsDNA) junction occupying site 1 (A), in an open state with a 3’ ss/dsDNA junction occupying site 2 (C) and in a closed state with 3’ ss/dsDNA junctions occupying sites 1 and 3 (E). Labels are placed near the 5’ ends of the template and primer strands. Regions in dashed boxes correspond to panels B, D, and F. (B, D, F) Coordination of 3’ ss/dsDNA junctions by RFC at site 1 (B), site 2 (D), and site 3 (F). Arrows point to the last paired bases on the template and primer strands. Density for DNA is shown as gray surface and contoured at 8σ. (G) Structure of RFC in a closed state with a nicked dsDNA. Region in dashed box corresponds to panel H. (H) Coordination of nicked dsDNA by RFC at sites 1 and 3. Density for DNA is shown as gray surface and contoured at 4σ. PCNA, proliferating cell nuclear antigen.
Figure 3—figure supplement 1
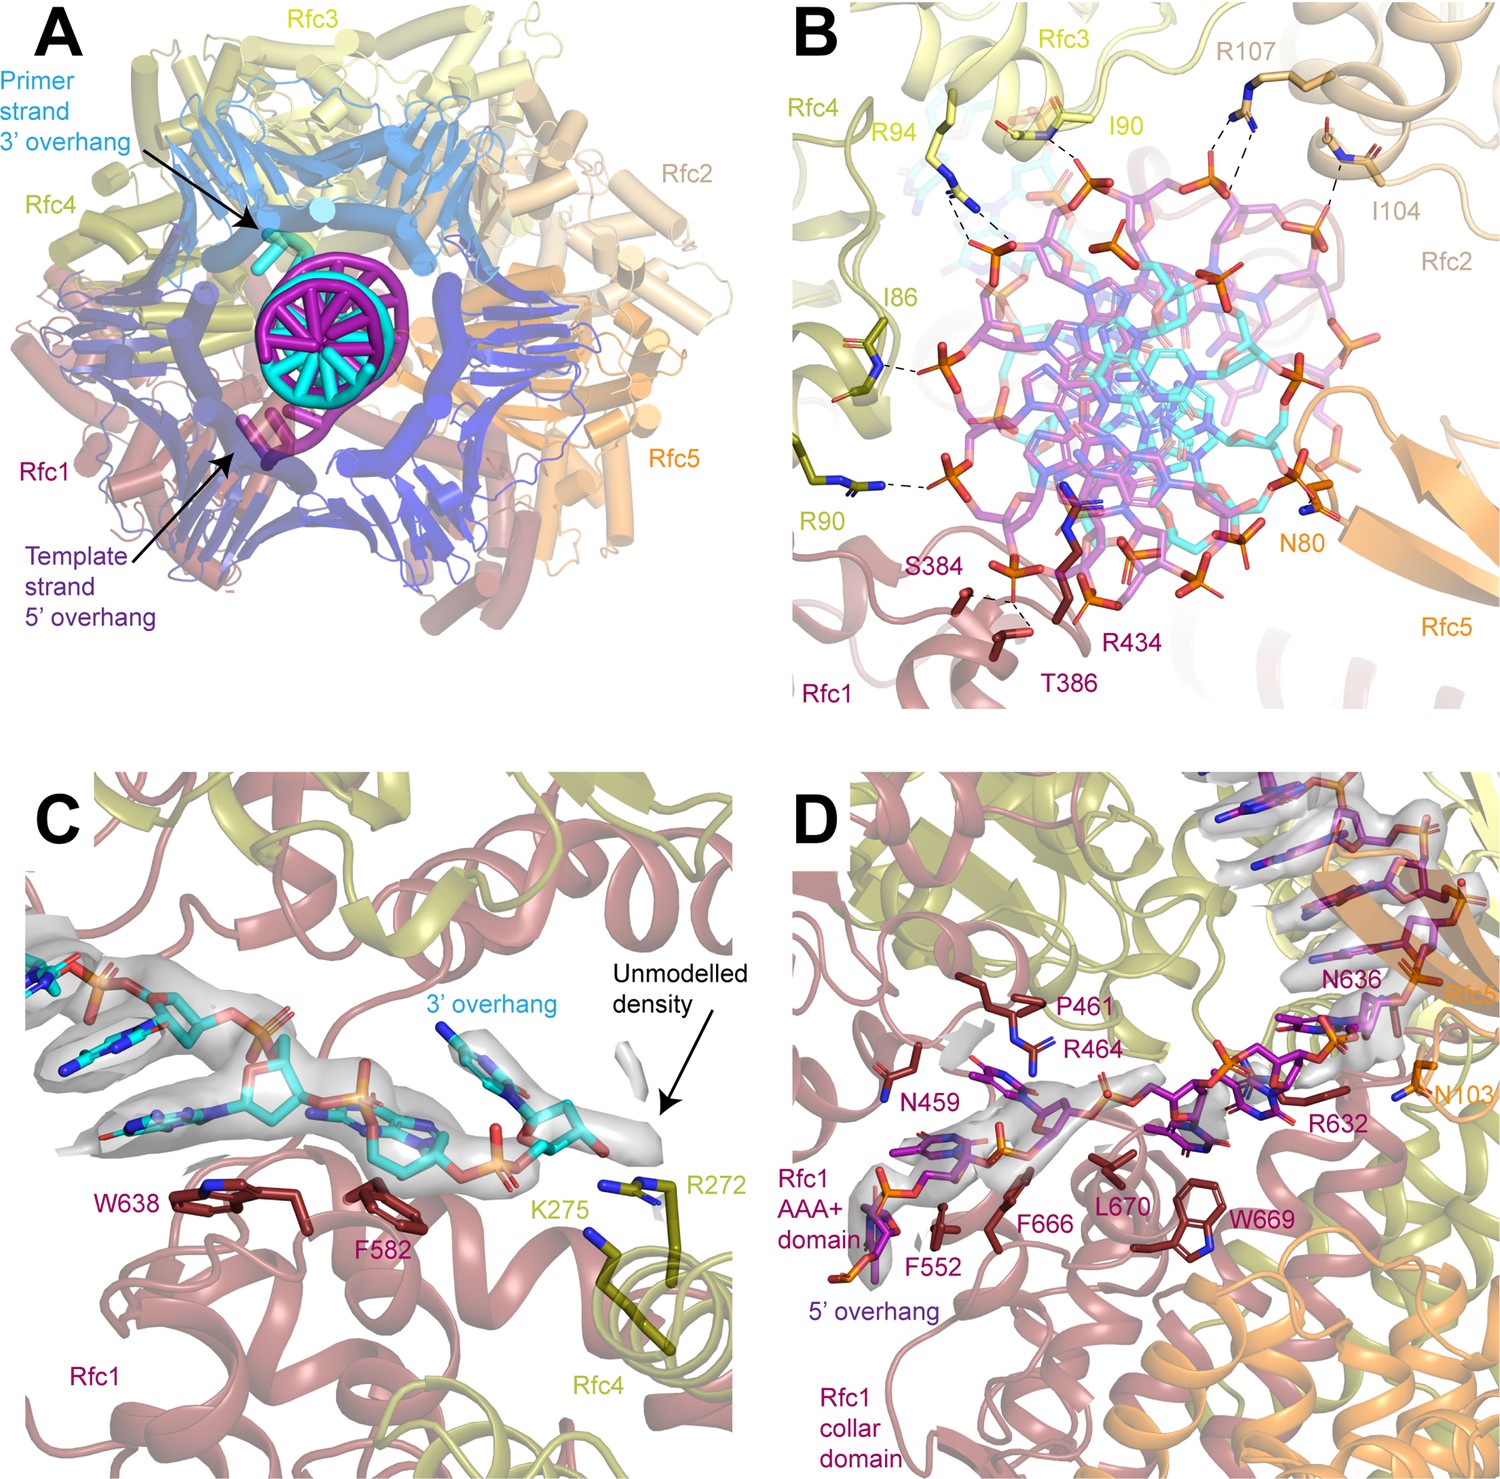
3’ Single-stranded (ss)/double-stranded DNA (dsDNA) junction binding site 1.
(A) Structure of replication factor C (RFC) in a closed state with the 3’ ss/dsDNA junction at binding site 1, viewed down the central axis of RFC:PCNA. (B) Coordination of the double-stranded region of the DNA by RFC. Dashed lines represent polar interactions between RFC and the DNA backbone. (C) Coordination of the 3’ overhang of the primer strand by Rfc1 and Rfc4. Density for the DNA is shown as gray surface at a threshold of 7σ. Arrow points to unmodelled density beyond the last modelled base. (D) Coordination of the 5’ overhang of the template strand by Rfc1. Density for the DNA is shown as gray surface at a threshold of 7σ. PCNA, proliferating cell nuclear antigen.
Figure 3—figure supplement 2
3’ Single-stranded (ss)/double-stranded DNA (dsDNA) junction binding site 2.
Structure of replication factor C (RFC) in an open state with the 3’ ss/dsDNA junction at binding site 2, viewed down the central axis of RFC:PCNA. (B) 5 Å low-pass filtered cryo-EM density map of RFC in an open state colored by subunit. Arrow points to poorly ordered density corresponding to the 5’ overhang of the template strand. (C) Superposition of the terminal region of the 5’ overhang of the template strand in site 2 (magenta) and the 3’ overhang of the primer strand in site 1 (gray) by Rfc1 and Rfc4. (D) Structure of the double-stranded region of the DNA bound to site 2 in the open state. RFC is shown as a surface. Arrows point to bases that do not adopt Watson-Crick base pairing, which are highlighted in E and F. (E,F) Density map and model for bases that do not adopt Watson-Crick base pairing. Density is contoured around the highlighted bases and shown as gray surface at a threshold of 8σ. PCNA, proliferating cell nuclear antigen.
Figure 3—figure supplement 3
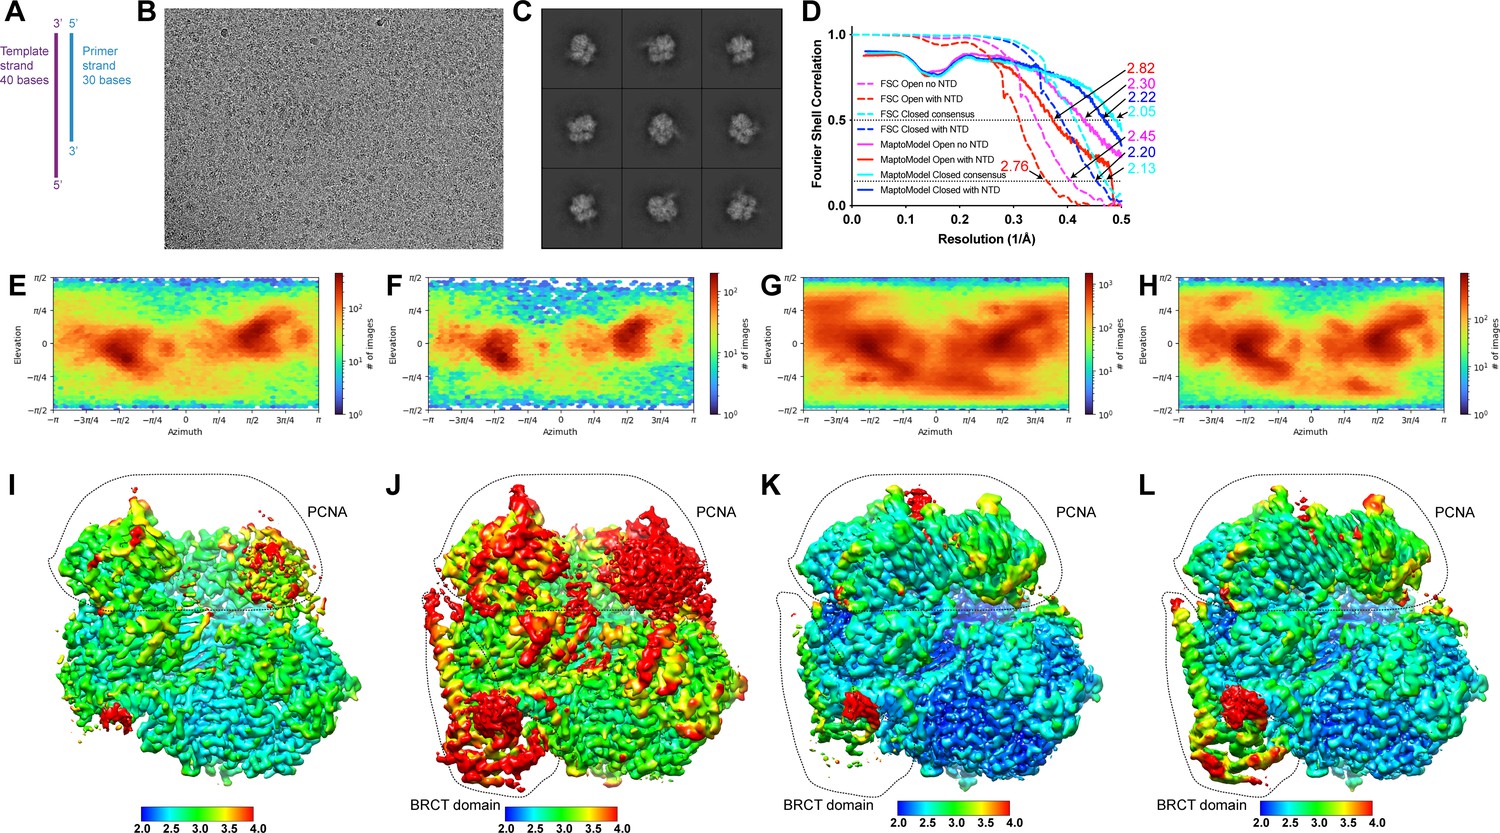
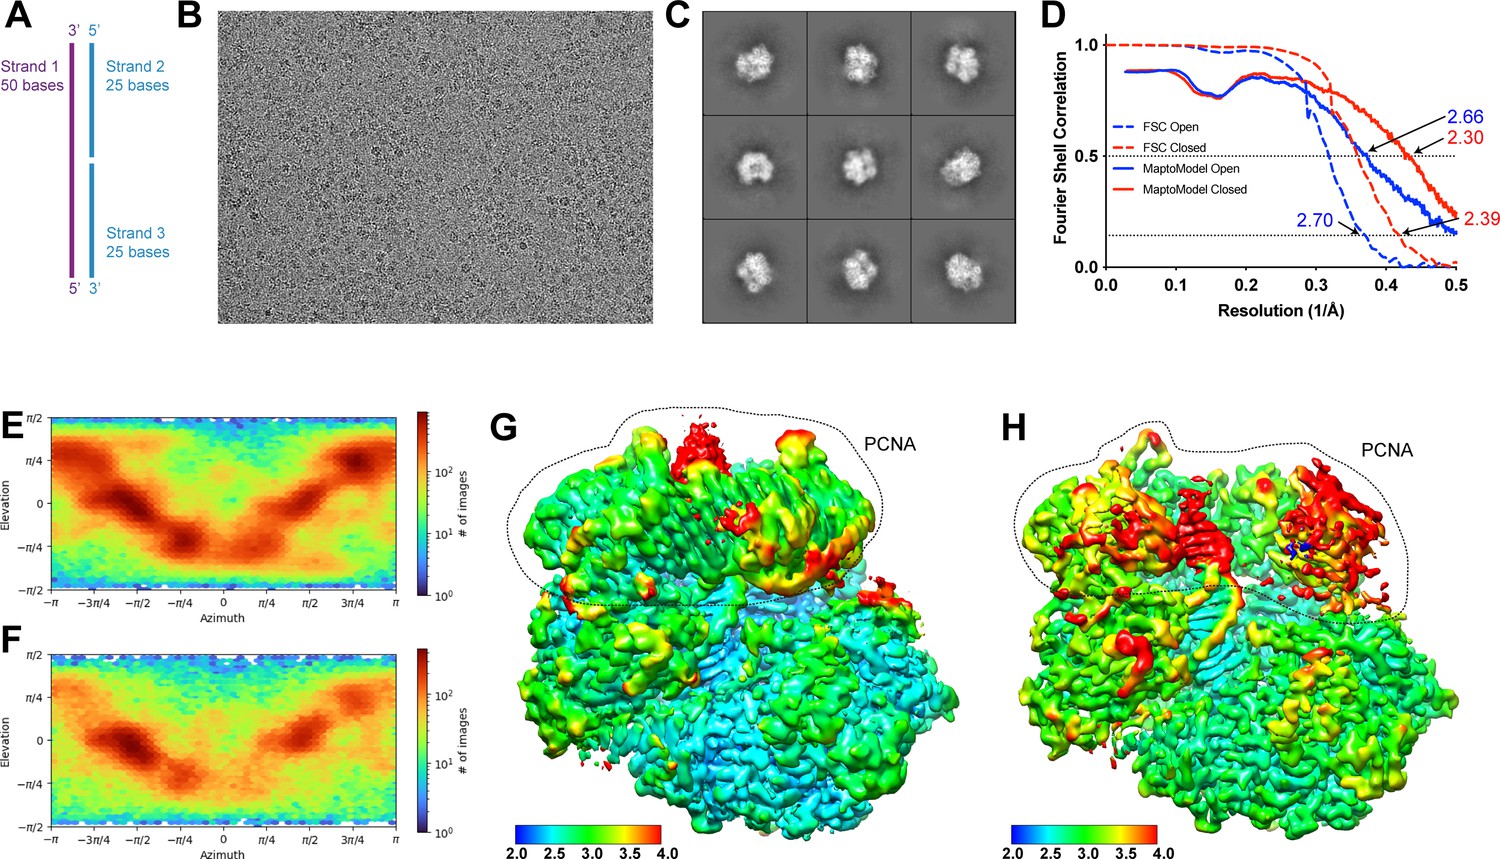
Cryo-EM analysis of RFC:PCNA with DNA substrate 2 (DNA2).
(A) Schematic of DNA2. (B) Representative cryo-EM image of vitrified RFC:PCNA:DNA2. (C) Representative two-dimensional averages of RFC:PCNA:DNA2. (D) Plot of Fourier shell correlations between two independent open state without N-terminal domain (NTD) half-maps (dashed magenta), two independent open state with NTD half-maps (dashed red), two independent consensus closed state half-maps (dashed cyan), two independent closed with NTD state half-maps (dashed blue), the open state without NTD map and open state without NTD atomic model (solid red), the open state with NTD map and open state with NTD atomic model (solid magenta), the consensus closed state map and consensus closed state atomic model (solid cyan), and the closed state with NTD map and closed state with NTD atomic model (solid blue). (E–H) Angular distribution plots for open without NTD (E), open with NTD (F), closed consensus (G), and closed with NTD reconstructions (H).( I–L) Cryo-EM density maps of open without NTD (I), open with NTD (J), closed consensus (K), and closed with NTD (L) maps colored by local resolution in Å. Regions in dashed area correspond to Rfc1-BRCT domain and PCNA densities. RFC, replication factor C; PCNA, proliferating cell nuclear antigen.
Figure 3—figure supplement 4
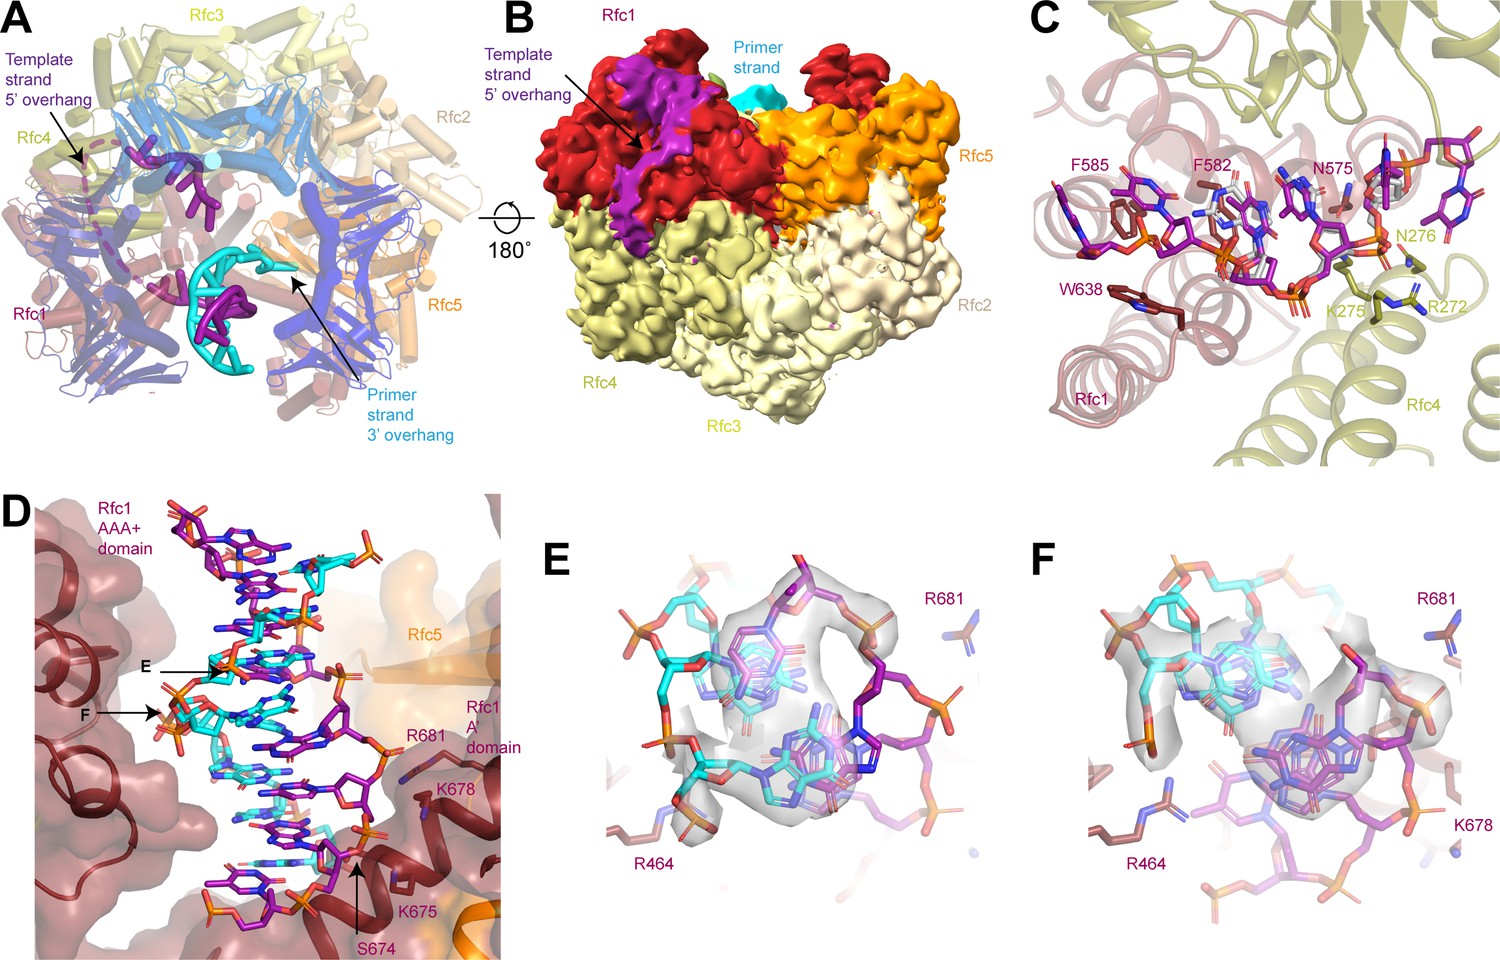
Coordination of two 3’ single-stranded (ss)/double-stranded DNA (dsDNA) junctions by replication factor C (RFC).
(A) Superposition of closed RFC:PCNA with DNA substrate 2 at sites 1 and 3 (color by subunit) and closed RFC:PCNA with DNA substrate 1 at site 1 (gray). (B) Structure of RFC in an closed state with the 3’ ss/dsDNA junction at binding site 3, viewed down the central axis of RFC:PCNA. (C) Coordination of the double-stranded region of 3’ ss/dsDNA junction at binding site 3 by Rfc1. Density is contoured around the DNA and shown as gray surface at a threshold of 7σ. PCNA, proliferating cell nuclear antigen.
Figure 3—figure supplement 5

Analysis of proliferating cell nuclear antigen (PCNA) loading activity of RFC-1ΔN.
(A) ATPase activity of RFC-1ΔN in the presence of PCNA and DNA (black circles), RFC-1ΔN in the presence of DNA (teal triangles), RFC-1ΔN in the presence of PCNA (purple triangles), and PCNA and DNA (pink squares). Experiments are shown in triplicate. (B) Schematic for PCNA loading assay using bead-immobilized nicked plasmid DNA as template. (C) ATP dependence of PCNA loading activity by RFC-WT (lanes 1+2) and RFC-1ΔN (lanes 3+4). (D) Analysis of the dependency of PCNA loading on RFC-WT (lanes 1–4) and RFC-1ΔN (lanes 5–8). RFC or RFC-1ΔN were included in reactions containing DNA beads, ATP and PCNA at the concentrations indicated on the top. All experiments were replicated at least two times. RFC, replication factor C.
-
Figure 3—figure supplement 5—source data 1
Uncropped images of gels presented in Figure 3—figure supplement 5.
- https://cdn.elifesciences.org/articles/78253/elife-78253-fig3-figsupp5-data1-v1.pdf
Figure 3—figure supplement 6
Cryo-EM analysis of RFC:PCNA with a nicked DNA.
(A) Schematic of a nicked DNA substrate (nDNA). (B) Representative cryo-EM image of vitrified RFC:PCNA:nDNA. (C) Representative two-dimensional averages of RFC:PCNA:nDNA. (D) Plot of Fourier shell correlations between two independent open state half-maps (dashed blue), two independent closed state half-maps (dashed red), the open state map and open state atomic model (solid blue), and the closed state map and closed state atomic model (solid red). (E–F) Angular distribution plots for closed (E) and open reconstructions (F) with nicked DNA. (G–H) Cryo-EM density maps of closed (G) and open maps (H) with nicked DNA colored by local resolution in Å. Region in dashed area corresponds to PCNA densities. RFC, replication factor C; PCNA, proliferating cell nuclear antigen.
Figure 4 with 1 supplement
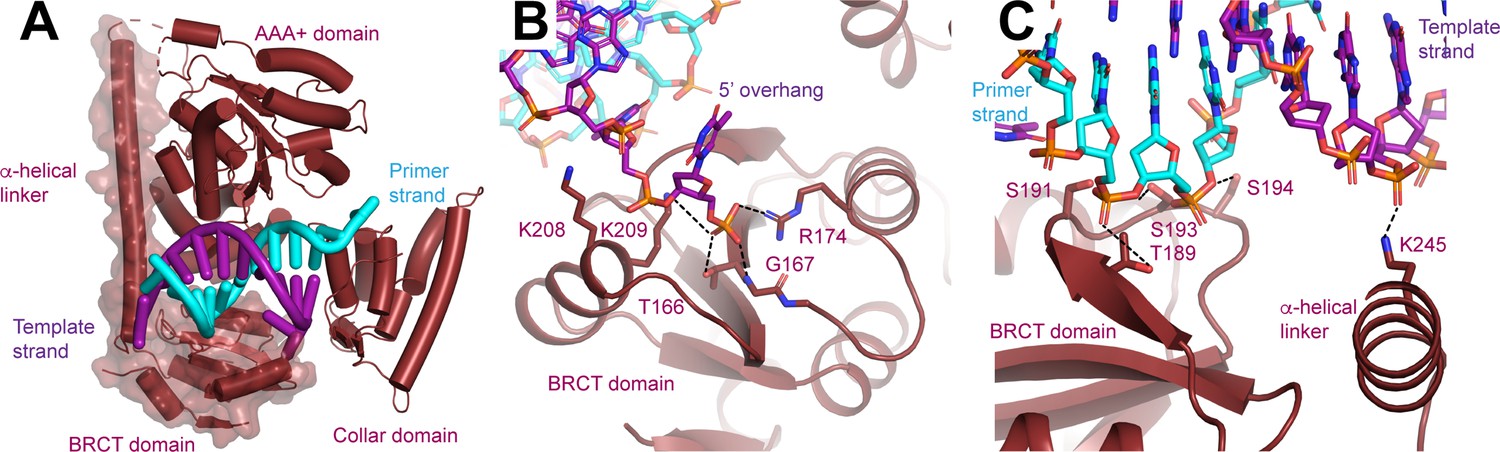
N-terminal domain (NTD) of Rfc1.
(A) Structure of Rfc1 bound to a 3’ single-stranded (ss)/double-stranded DNA (dsDNA) junction in site 3. The NTD is shown as a surface and the A’ domain is removed for clarity. The dashed line represents the disordered residues between the NTD and AAA+ domain of Rfc1. (B) The BRCT domain binds the phosphate of the last ordered base on the 5’ overhang of the template strand. (C) The BRCT domain and the α-helical linker bind to both strands of a DNA in site 3.
Figure 4—figure supplement 1
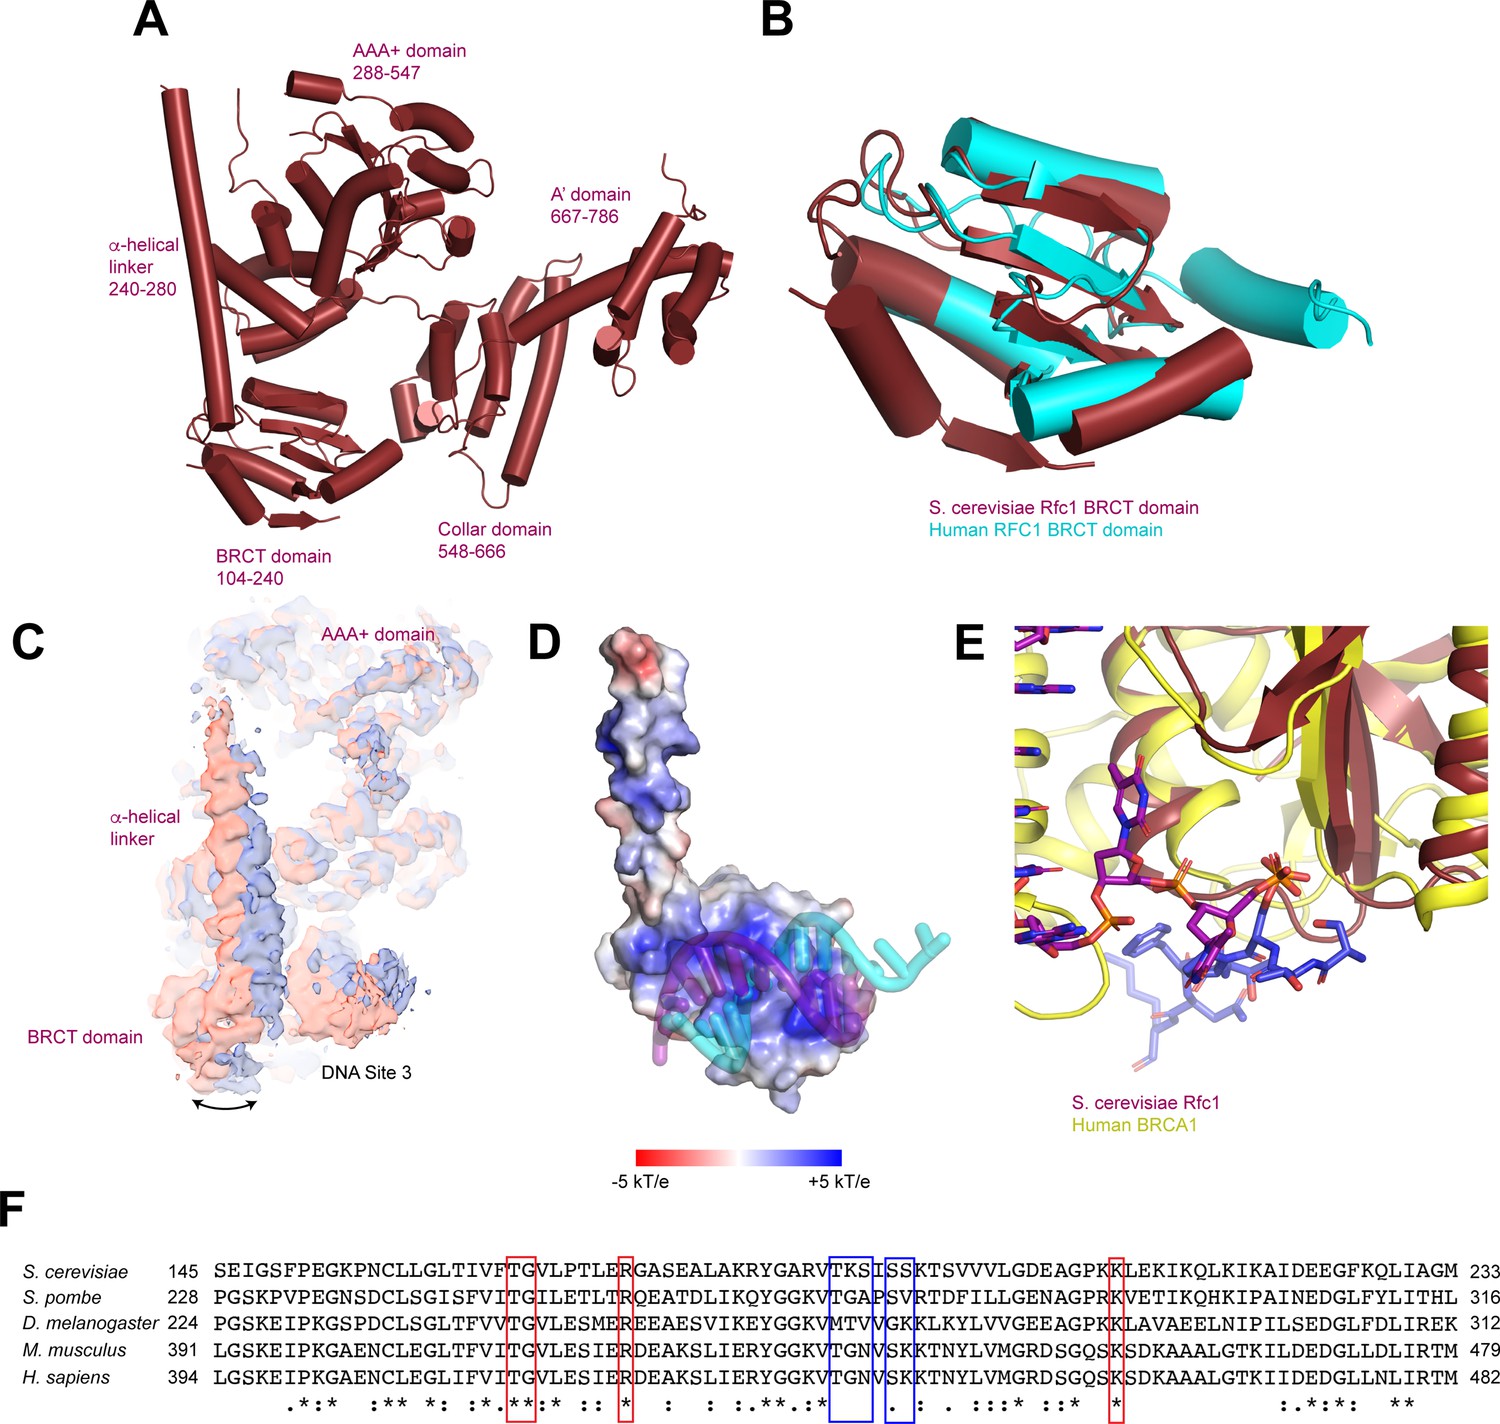
Structure of the Rfc1 N-terminal domain (NTD).
(A) Domain organization of Rfc1. (B) Superposition of the BRCT domain of yeast Rfc1 (maroon) with the BRCT domain of human RFC1 (PDB: 2K6G, cyan). (C) Cryo-EM density maps for 2 subclasses of RFC:PCNA with DNA substrate 2 in a closed state. The maps are aligned by the core of RFC. (D) Rfc1 NTD-DNA interface. Rfc1 NTD is shown as a surface colored by electrostatic surface potential. (E) Superposition of BRCT domain of yeast Rfc1 (maroon) with the BRCT domain of human BRCA1 in complex with a phosphorylated peptide (PDB:1T15, yellow/blue). (F) Sequence alignment of the BRCT domains of Saccharomyces cerevisiae, Schizosaccharomyces pombe, Drosophila melanogaster, Mus musculus, and Homo sapiens Rfc1 orthologs. Residues boxed in red bind to the 5’ overhang and residues boxed in blue bind to the double-stranded region of the DNA. RFC, replication factor C; PCNA, proliferating cell nuclear antigen.
Figure 5
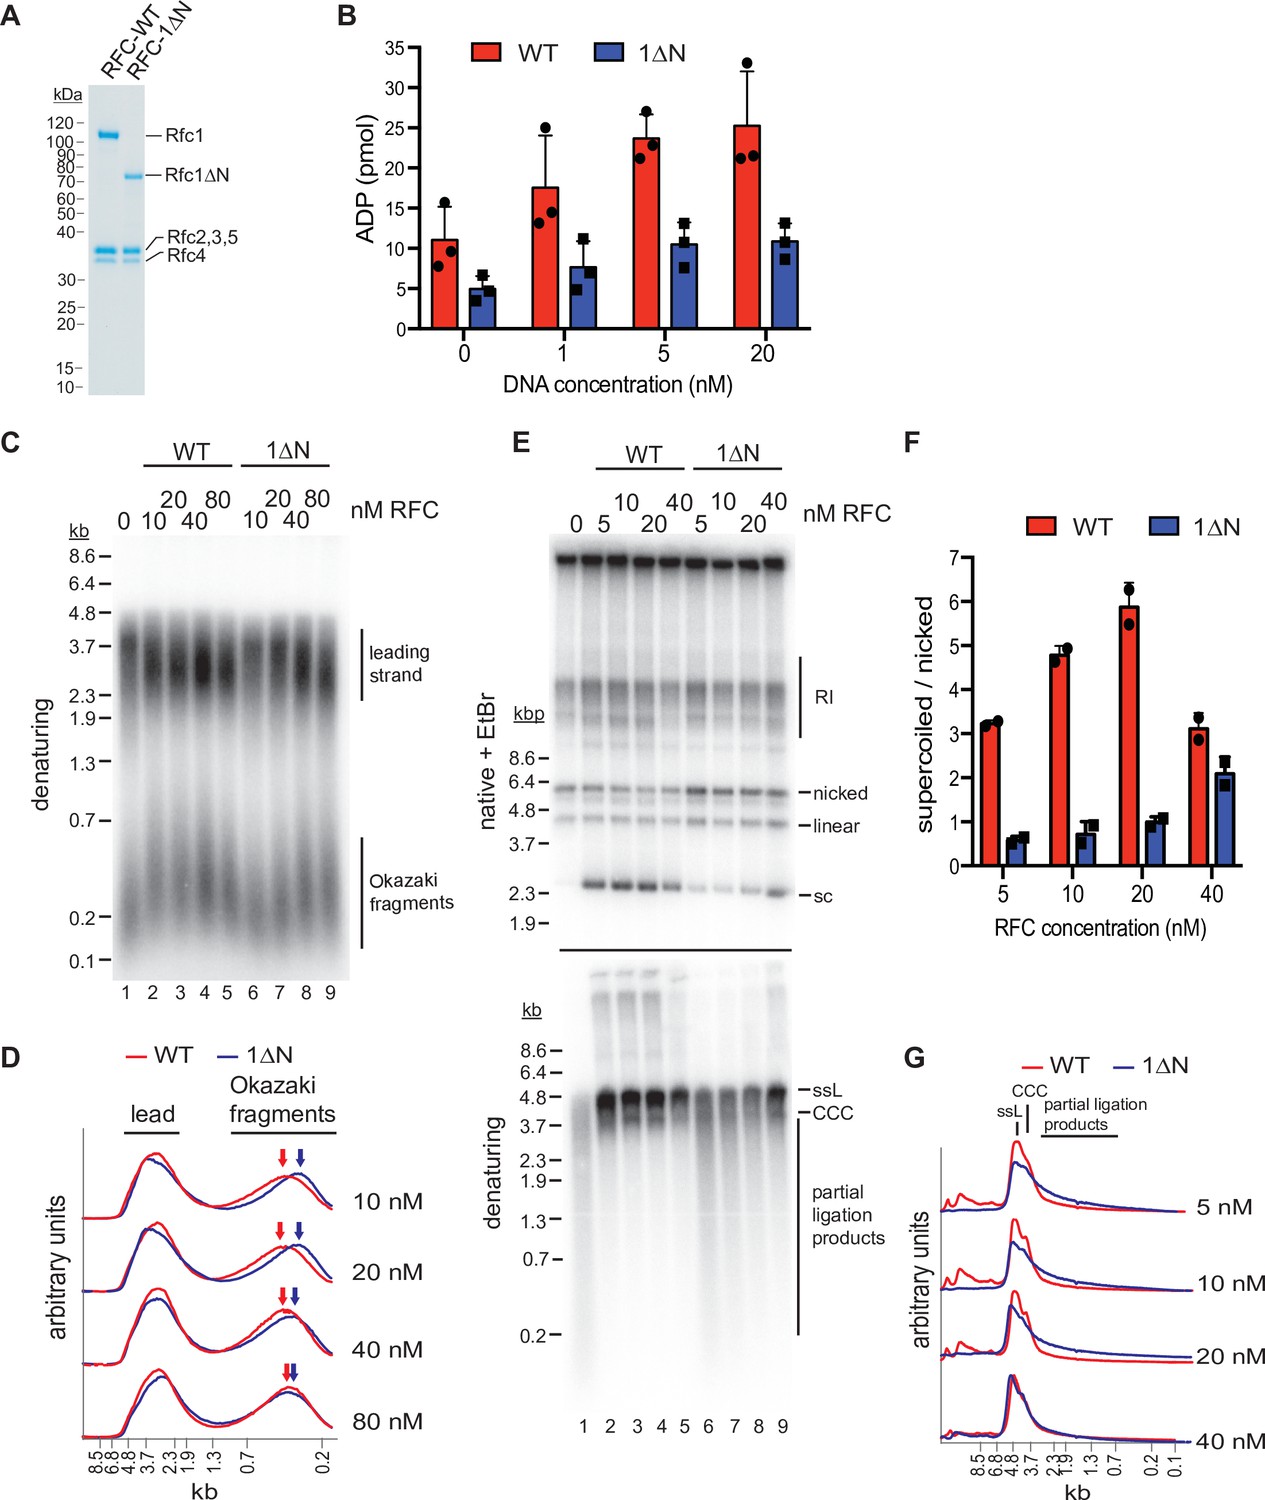
The Rfc1 N-terminal domain is required for efficient proliferating cell nuclear antigen (PCNA) loading.
(A) Representative Coomassie-stained SDS-PAGE analysis of purified RFC-WT and RFC-1ΔN. (B) PCNA-dependent ATPase activity of RFC-WT (red bars) or RFC-1ΔN (blue bars) in the presence of varying DNA concentrations. Data are shown in triplicate. Error bars represent standard deviation. (C) Denaturing gel analysis of replication products obtained in the absence (lane 1) or presence of variable concentrations of RFC-WT (lanes 2–5) or RFC-1ΔN (lanes 6–9). Reactions were performed in the absence of Cdc9 and Fen1. (D) Lane traces of gel in panel C, lanes 2–5 (red, RF-WT) and lanes 6–9 (blue, RFC-1ΔN). (E) Replication products obtained in the presence of Cdc9 and Fen1 were analyzed by native agarose gel electrophoresis in the presence of ethidium-bromide (EtBr, top) or denaturing gel electrophoresis (bottom). RFC-WT (lanes 2–5) or RFC-1ΔN (lanes 6–9) were included at concentrations indicated on top. RI: replication intermediates; sc: supercoiled; ssL: single-stranded linear; CCC: covalently closed circle. (F) Ratio of supercoiled (fully ligated) to nicked (partially ligated) replication products observed by native agarose gel analysis in presence of EtBr as in panel E. Data are shown in duplicate. Error bars represent standard deviation. (G) Lane traces of replication products observed in denaturing gel analysis of panel E. Respective concentrations of RFC-WT (red) and RFC-1ΔN (blue) are indicated on the right. All assays were replicated at least two times. RFC, replication factor C.
-
Figure 5—source data 1
Uncropped images of gels presented in Figure 5.
- https://cdn.elifesciences.org/articles/78253/elife-78253-fig5-data1-v1.pdf
Figure 6
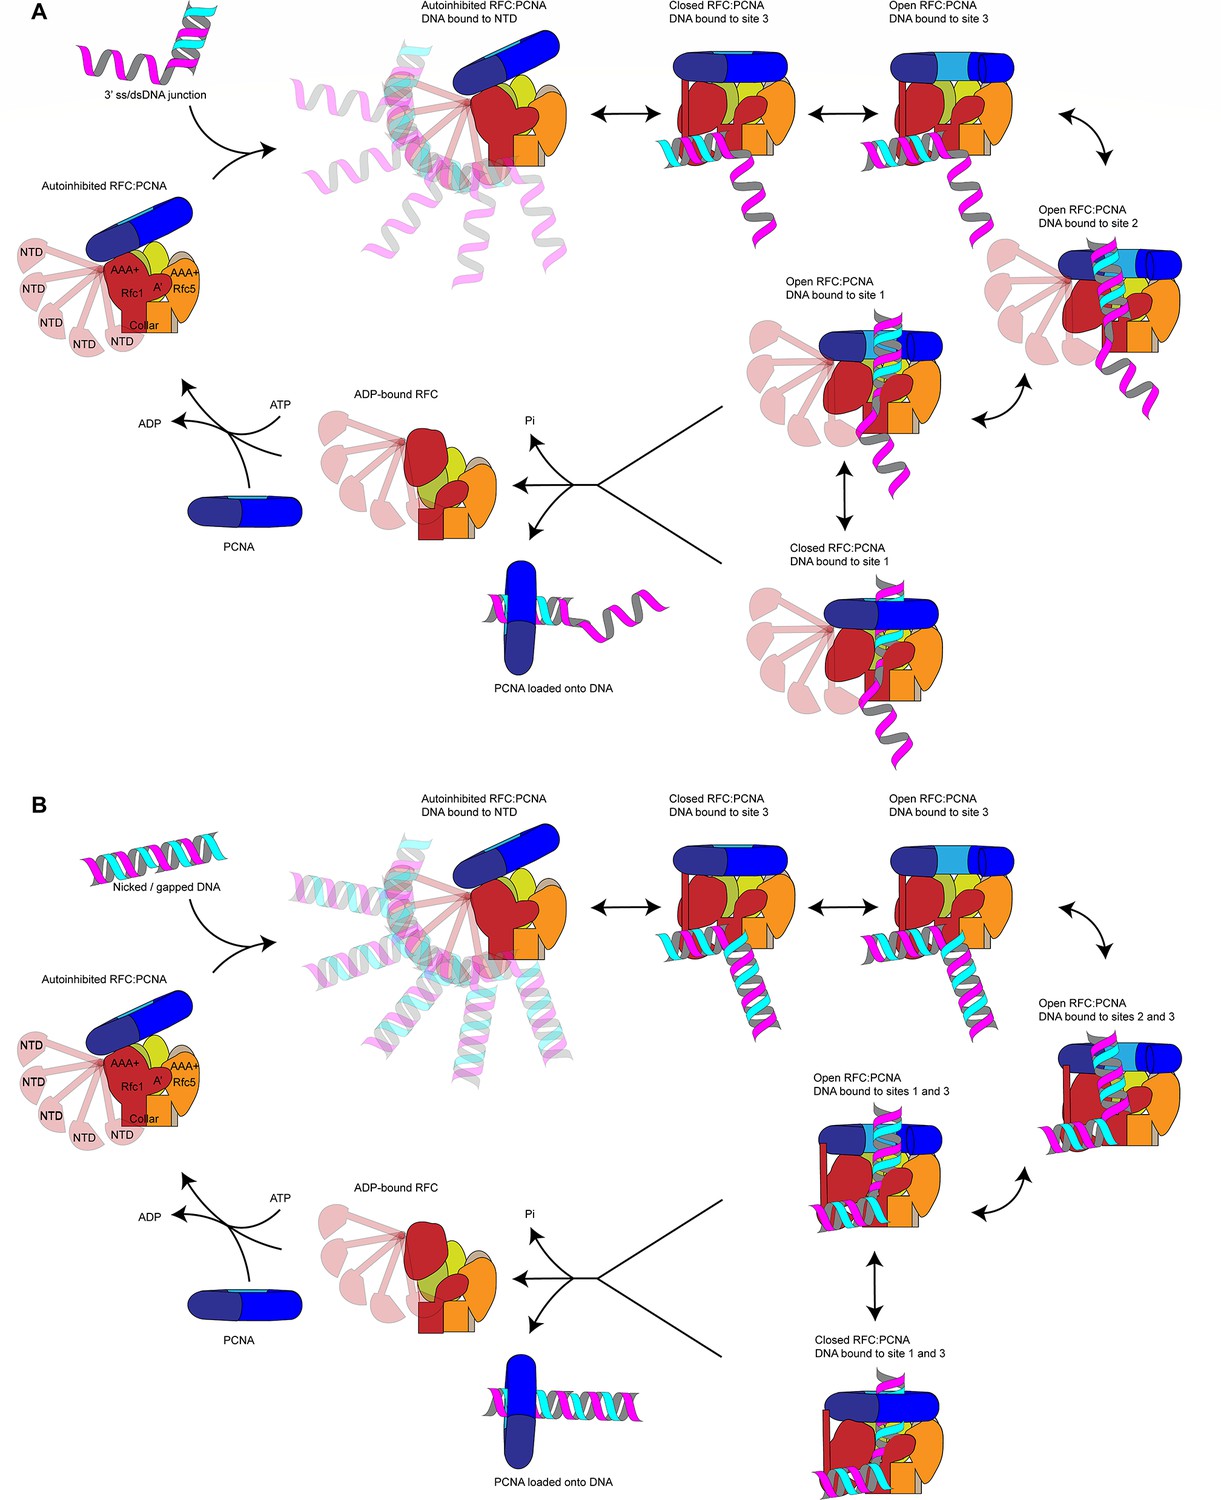
Loading for proliferating cell nuclear antigen (PCNA) onto DNA by replication factor C (RFC).
(A) Model for PCNA loading onto 3’ single-stranded (ss)/double-stranded DNA (dsDNA) junctions. (B) Model for PCNA loading onto nicked or gapped DNA. RFC and PCNA are colored by subunit as in Figure 1.
Tables
Table 1
Cryo-EM data collection, refinement and validation statistics.
| RFC-PCNADNA1open(EMD-27663)(PDB 8DQX) | RFC-PCNADNA1 intermediate(EMD-27666)(PDB 8DQZ) | RFC-PCNADNA1closed(EMD-27667)(PDB 8DR0) | RFC-PCNADNA2 closed consensus(EMD-27668)(PDB 8DR1) | RFC-PCNADNA2 closed with NTD(EMD-27669)(PDB 8DR3) | RFC-PCNADNA2 open no NTD(EMD-27670)(PDB 8DR4) | RFC-PCNADNA2 open with NTD(EMD-27671)(PDB 8DR5) | RFC-PCNAnicked DNA closed(EMDB-27672)(PDB 8DR6) | RFC-PCNAnicked DNA open(EMDB-27673)(PDB 8DR7) | Rad24-RFCOpen(EMD- 27662)(PDB 8DQW) | |
|---|---|---|---|---|---|---|---|---|---|---|
| Data collection and processing | ||||||||||
| Magnification | 29,000 x | 29,000 x | 29,000 x | 29,000 x | 29,000 x | 29,000 x | 29,000 x | 29,000 x | 29,000 x | 29,000 x |
| Voltage (kV) | 300 keV | 300 keV | 300 keV | 300 keV | 300 keV | 300 keV | 300 keV | 300 keV | 300 keV | 300 keV |
| Electron exposure (e–/Å2) | 66 | 66 | 66 | 66 | 66 | 66 | 66 | 66 | 66 | 66 |
| Defocus range (μm) | –0.5 to –2.0 | –0.5 to –2.0 | –0.5 to –2.0 | –0.5 to –2.0 | –0.5 to –2.0 | –0.5 to –2.0 | –0.5 to –2.0 | –0.5 to –2.0 | –0.5 to –2.0 | –0.5 to –2.0 |
| Pixel size (Å) | 0.826 | 0.826 | 0.826 | 0.826 | 0.826 | 0.826 | 0.826 | 0.826 | 0.826 | 0.826 |
| Symmetry imposed | C1 | C1 | C1 | C1 | C1 | C1 | C1 | C1 | C1 | C1 |
| Initial particle images (no.) | 5,688,448 | 5,688,448 | 5,688,448 | 3,356,580 | 3,356,580 | 3,356,580 | 3,356,580 | 2,031,079 | 2,031,079 | 4,117,022 |
| Final particle images (no.) | 616,330 | 41,190 | 252,647 | 872,447 | 356,424 | 104,742 | 61,483 | 359,126 | 142,294 | 938,420 |
| Map resolution (Å) | 2.1 | 2.92 | 2.42 | 2.14 | 2.2 | 2.45 | 2.76 | 2.39 | 2.7 | 2.1 |
| FSC threshold | 0.143 | 0.143 | 0.143 | 0.143 | 0.143 | 0.143 | 0.143 | 0.143 | 0.143 | 0.143 |
| Refinement | ||||||||||
| Initial model used (PDB code) | Closed state | Open state | 1SXJ | Closed state | Closed state | Open state | Open state | Closed state | Open state | 7ST9 |
| Model resolution (Å) | 1.99 | 2.87 | 2.25 | 2.05 | 2.13 | 2.3 | 2.69 | 2.3 | 2.66 | 2.12 |
| FSC threshold | 0.5 | 0.5 | 0.5 | 0.5 | 0.5 | 0.5 | 0.5 | 0.5 | 0.5 | 0.5 |
| Model composition | ||||||||||
| Non-hydrogen atoms | 22,030 | 21,451 | 21,514 | 22,004 | 23,129 | 21,999 | 22,780 | 217,998 | 21,655 | 23,629 |
| Protein residues | 2,598 | 2,599 | 2,608 | 2,609 | 2,758 | 2,608 | 2,749 | 2,608 | 2,600 | 2,802 |
| Nucleotide residues | 26 | 40 | 40 | 63 | 63 | 63 | 49 | 63 | 49 | 35 |
| Ligands | 9 | 9 | 9 | 9 | 9 | 9 | 9 | 9 | 9 | 9 |
| B factors (Å2) | ||||||||||
| Protein (mean) | 10 | 75.3 | 34.7 | 10.8 | 21.5 | 50.6 | 42.5 | 50.6 | 33.9 | 9.8 |
| Nucleotide (mean) | 6.7 | 161.8 | 85 | 25.5 | 52.6 | 97.2 | 83 | 97.2 | 80.7 | 41.9 |
| Ligand (mean) | 3.2 | 56.9 | 25.2 | 5 | 11.3 | 38 | 22.9 | 39.3 | 15.5 | 7.4 |
| R.m.s. deviations | ||||||||||
| Bond lengths (Å) | 0.004 | 0.002 | 0.002 | 0.003 | 0.002 | 0.002 | 0.002 | 0.002 | 0.002 | 0.002 |
| Bond angles (°) | 0.628 | 0.515 | 0.475 | 0.528 | 0.476 | 0.479 | 0.5 | 0.479 | 0.528 | 0.479 |
| Validation | ||||||||||
| MolProbity score | 1.31 | 1.3 | 1.17 | 1.12 | 1.19 | 1.12 | 1.29 | 1.12 | 1.28 | 1.15 |
| Clashscore | 5.05 | 5.53 | 3.68 | 3.25 | 3.22 | 3.25 | 4.82 | 3.25 | 5.17 | 3.61 |
| Poor rotamers (%) | 1.13 | 0.26 | 1.04 | 0.65 | 1.28 | 0 | 0.45 | 0.87 | 0.82 | 0.4 |
| Ramachandran plot | ||||||||||
| Favored (%) | 98.06 | 98.06 | 98.65 | 98.65 | 98.43 | 98.61 | 97.84 | 98.61 | 98.1 | 98.48 |
| Allowed (%) | 1.94 | 1.94 | 1.35 | 1.35 | 1.57 | 1.39 | 2.16 | 1.39 | 1.9 | 1.52 |
| Disallowed (%) | 0.00 | 0.00 | 0.00 | 0.00 | 0.00 | 0.00 | 0.00 | 0.00 | 0.00 | 0.00 |
Additional files
-
MDAR checklist
- https://cdn.elifesciences.org/articles/78253/elife-78253-mdarchecklist1-v1.docx
-
Source data 1
Original protein gels, Western blots and autoradiography images.
- https://cdn.elifesciences.org/articles/78253/elife-78253-data1-v1.zip
Download links
A two-part list of links to download the article, or parts of the article, in various formats.
Downloads (link to download the article as PDF)
Open citations (links to open the citations from this article in various online reference manager services)
Cite this article (links to download the citations from this article in formats compatible with various reference manager tools)
Multistep loading of a DNA sliding clamp onto DNA by replication factor C
eLife 11:e78253.
https://doi.org/10.7554/eLife.78253


