Targeted depletion of uterine glandular Foxa2 induces embryonic diapause in mice
- Division of Reproductive Sciences, Cincinnati Children’s Hospital Medical Center, United States
- College of Medicine, University of Cincinnati, United States
- Department of Biomedical Engineering, Osaka Institute of Technology, Japan
Figures
Figure 1 with 1 supplement
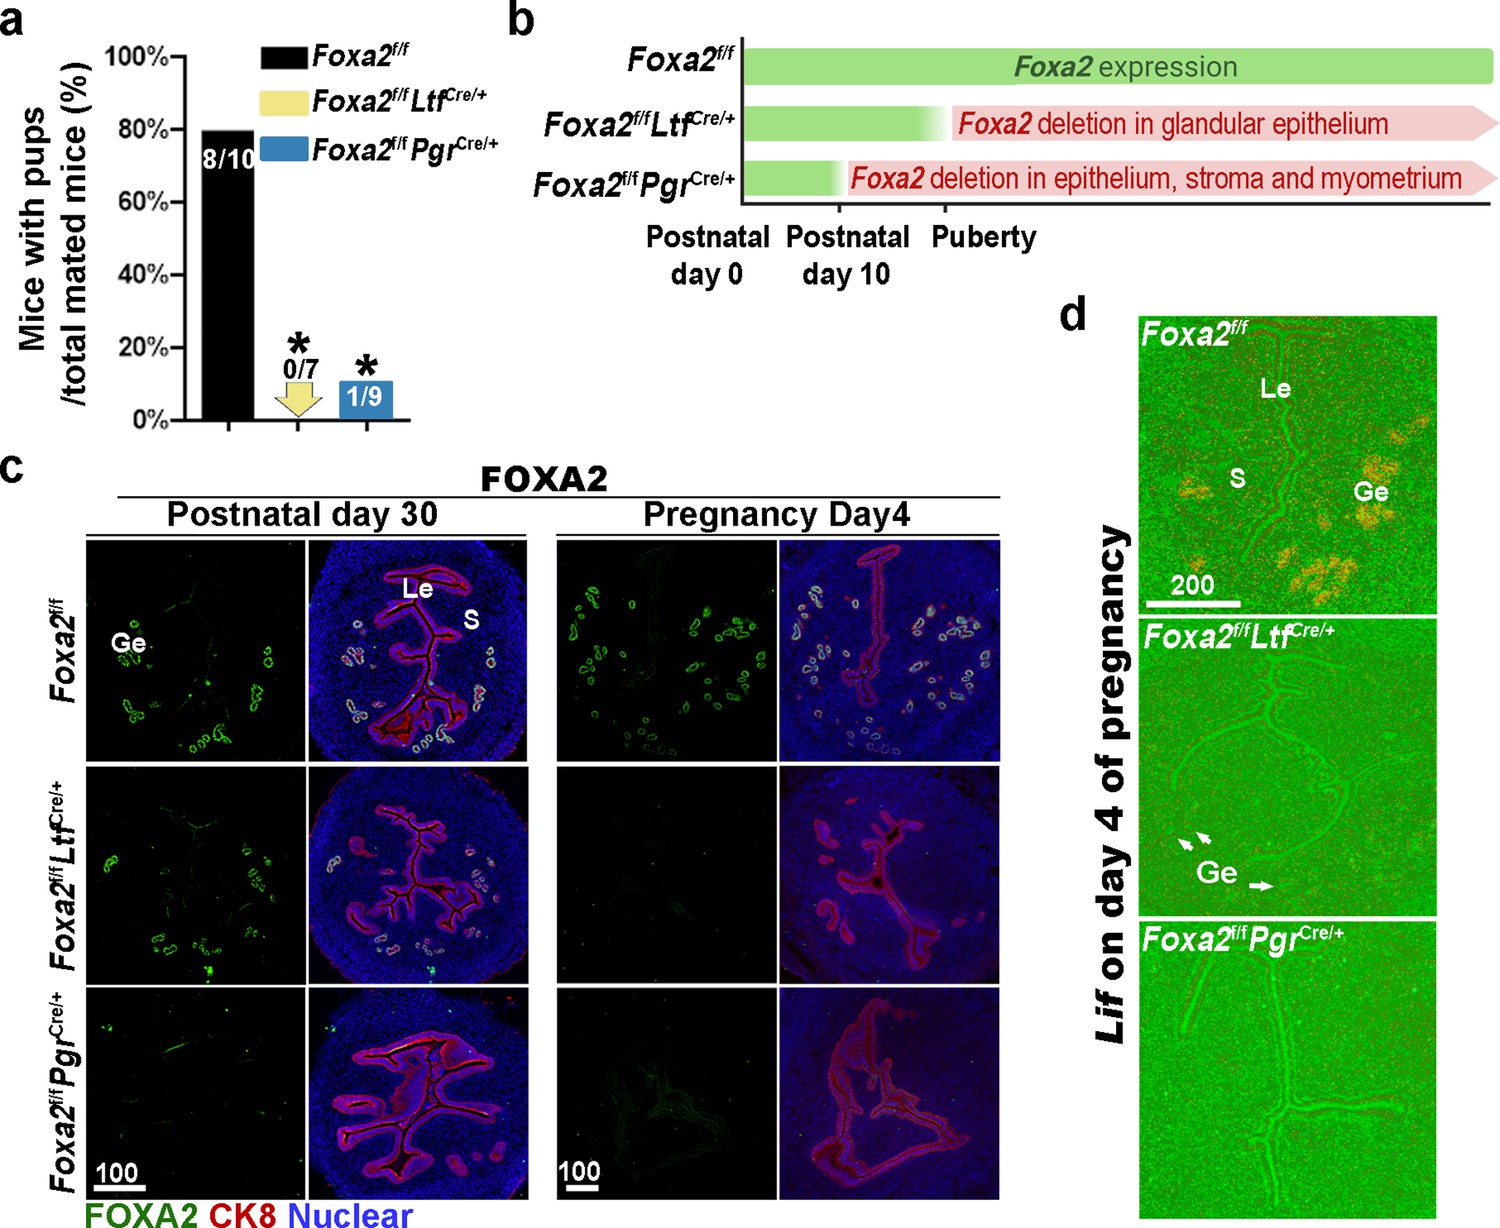
Uterine conditional depletion of Foxa2 causes loss of leukemia inhibitory factor (LIF) secretion and female infertility.
(a) Percentage of mice with pups per total mated mice.Numbers on bars indicate mice with pups over total number of mated mice. *p < 0.05 by Student's t-test. (b) Cre recombinase activity starts differently in Foxa2f/fLtfCre+ and Foxa2f/fPgrCre+ females. (c) Immunostaining of FOXA2 in the uteri on postnatal day 30 and day 4 pregnancy of Foxa2f/f, Foxa2f/fLtfCre+, and Foxa2f/fPgrCre+females. Epithelial cells are outlined by cytokeratin 8 (CK8) staining. Scale bars: 100 μm. (d) In situ hybridization of Lif in day 4 of pregnant uteri from Foxa2f/f, Foxa2f/fLtfCre+, and Foxa2f/fPgrCre+ females. White arrows point to uterine glands. Scale bar: 200 μm. Le, luminal epithelia; Ge, glandular epithelia; S, stroma.
Figure 1—figure supplement 1

Quantitative PCR of Foxa2 in Foxa2f/f, Foxa2f/fLtfCre+, and Foxa2f/fPgrCre+uteri tissues on day 4 of pregnancy.
RNA levels of Foxa2 are normalized against Rpl7. Values are mean ± SEM; *p < 0.05 by Student's t-test.
Figure 2 with 1 supplement
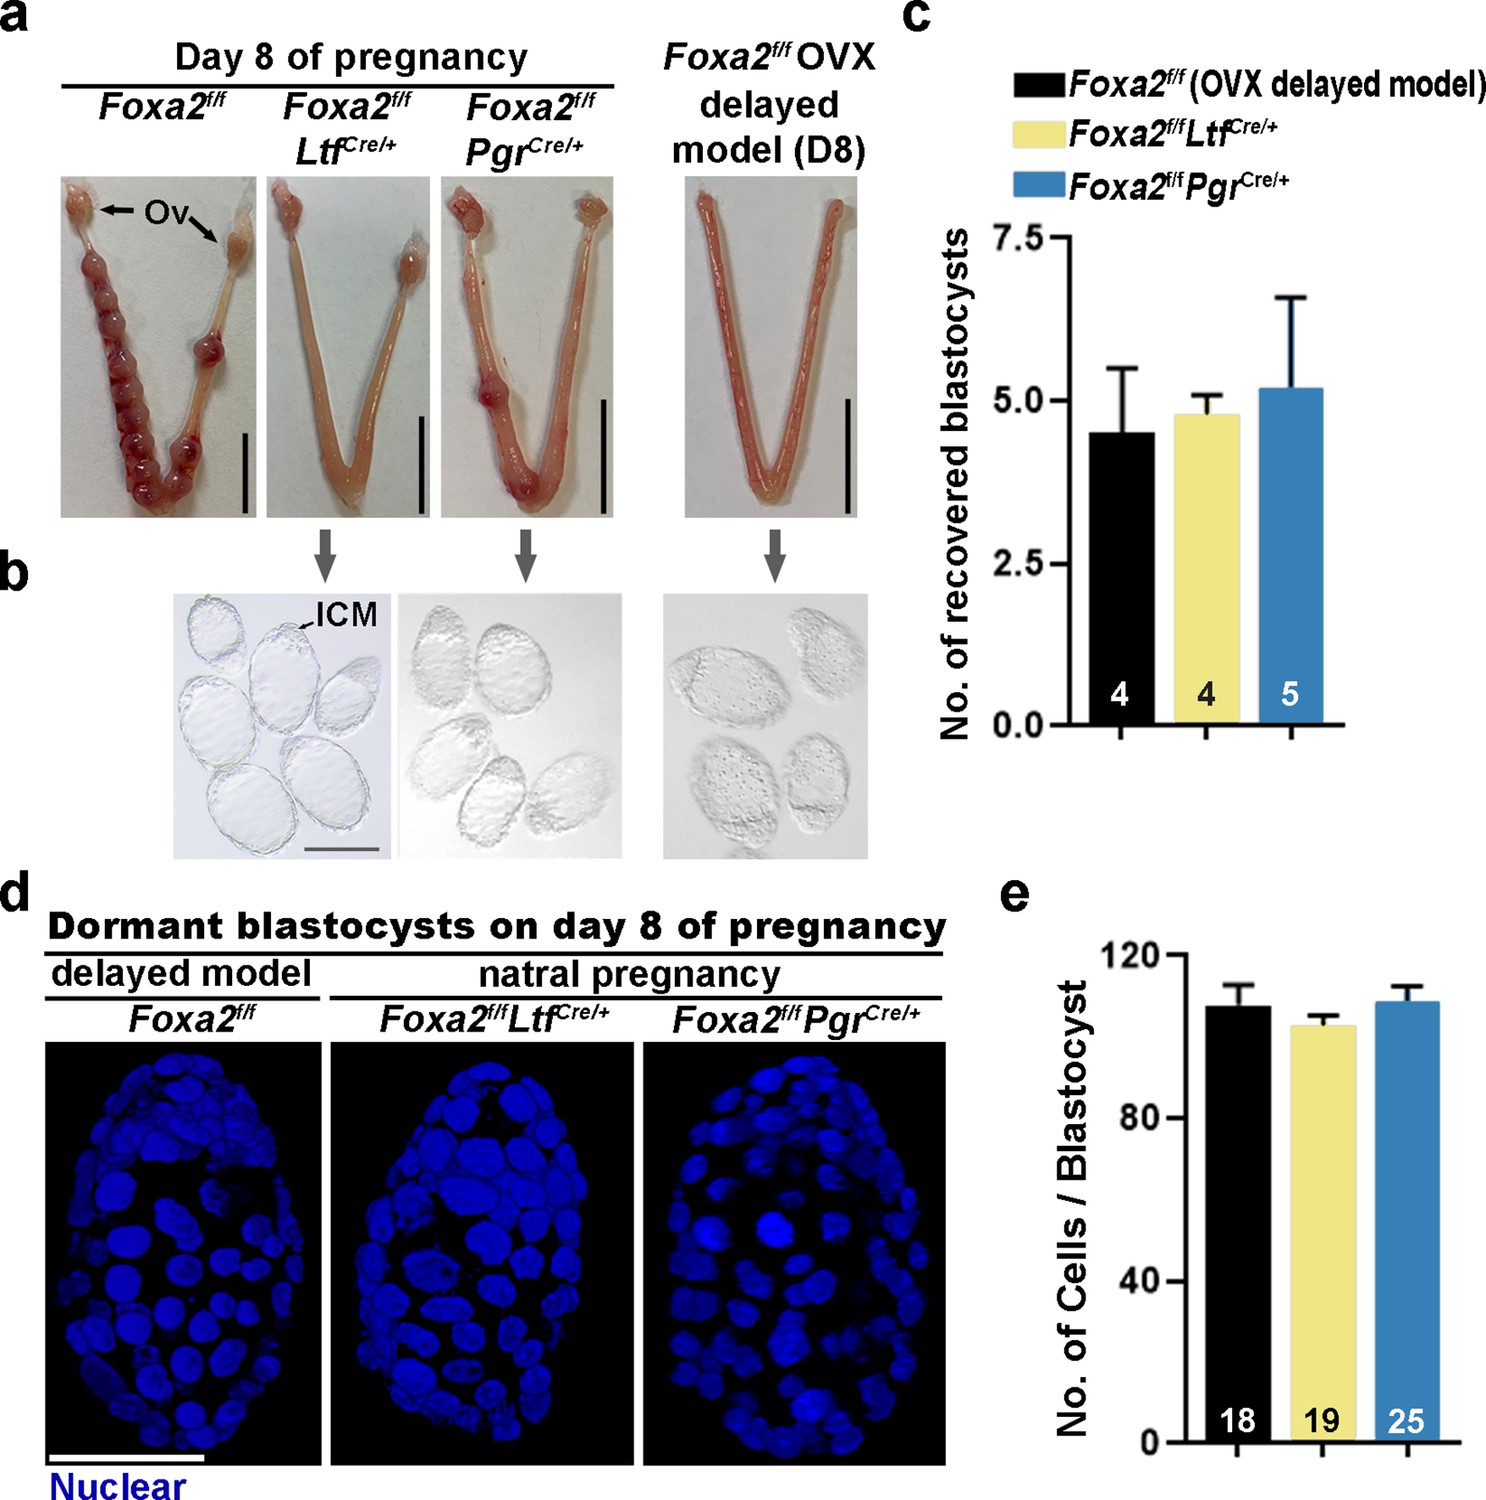
Dormant blastocysts are present in Foxa2f/fLtfCre+ and Foxa2f/fPgrCre+uteri on day 8 pregnancy.
(a) Representative photographs of day 8 pregnant uteri from Foxa2f/f, Foxa2f/fLtfCre+, and Foxa2f/fPgrCre+ females. An ovariectomy-induced delayed model of Foxa2f/f mice served as a prototypical control in maintaining dormant blastocysts. Scale bar: 10 mm. Ov, ovary. (b) Blastocysts recovered from Foxa2f/fLtfCre+ and Foxa2f/fPgrCre+uteri on day 8. Blastocysts retrieved from ovariectomized Foxa2f/f mice in delay served as controls. ICM, inner cell mass. Scale bar: 100 µm. Quantification of blastocyst numbers were shown in panel c. Numbers on bars indicate numbers of animals examined. Values are expressed as mean + SEM. (d) Representative photographs of nuclear staining of dormant blastocysts recovered from mice without implantation sites. Scale bar: 50 µm. (e) Average cell numbers per blastocyst. Numbers of embryos examined are shown on bars. Values are expressed as mean + SEM.
Figure 2—figure supplement 1

A schematic outline of sample collection from ovariectomy-induced delayed model.
P4, progesterone (2 mg) administration.
Figure 3
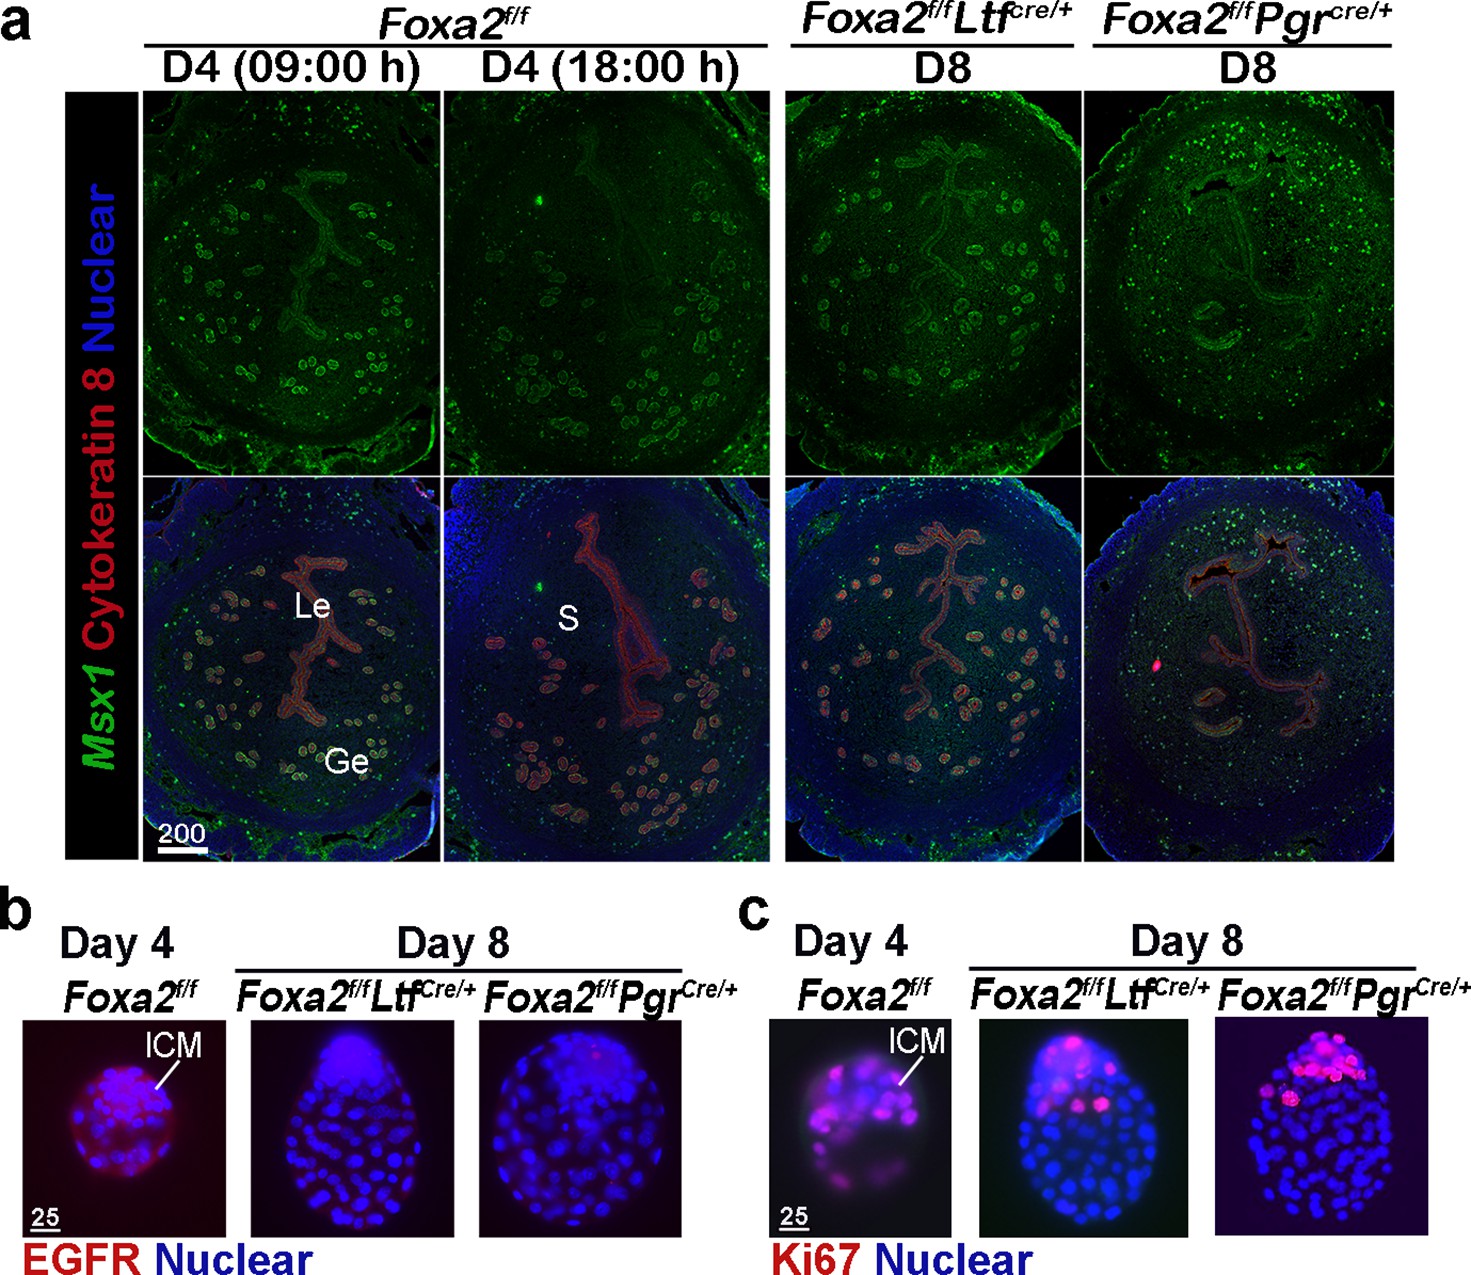
Foxa2f/fLtfCre+ and Foxa2f/fPgrCre+ females maintain uterine quiescence when examined on day 8 of pregnancy.
(a) Fluorescence in situ hybridization of Msx1 in days 4 and 8 pregnant uteri from Foxa2f/f, Foxa2f/fLtfCre+, and Foxa2f/fPgrCre+ females. Scale bar: 200 μm. (b) Epidermal growth factor receptor (EGFR) immunostaining on dormant blastocysts. Positive signals were observed in activated blastocysts recovered from Foxa2f/f uteri on day 4 of pregnancy. Scale bar: 25 μm. (c) Ki67 immunostaining on dormant blastocysts collected from day 8 Foxa2f/fLtfCre+ and Foxa2f/fPgrCre+ females. Scale bar: 25 μm. ICM, inner cell mass.
Figure 4

Pregnancy in Foxa2f/fLtfCre+ and Foxa2f/fPgrCre+ females with leukemia inhibitory factor (LIF) treatment.
(a) Schematic outline of sample collection. LIF, LIF administration (20 μg). (b) Representative photograph of uteri from Foxa2f/fLtfCre+ and Foxa2f/fPgrCre+ females (days 6 and 10) with LIF treatment. Foxa2f/f uteri on day 6 serve as control. Scale bar: 10 mm. Histological pictures of implantation sites in panel b were presented in panel c. Arrowheads point to embryos. Em, embryo. Scale bar: 500 μm. (d) Average number of implantation sites in Foxa2f/fLtfCre+ and Foxa2f/fPgrCre+ mice treated with LIF (20 μg) on day 4 or 8 of pregnancy. Numbers and percentage on bars indicate mice with implantation sites over total number of mated mice. (e) Litter sizes of Foxa2f/fLtfCre+ and Foxa2f/fPgrCre+mice treated with LIF (20 μg) or vehicle on days 4 or 8 of pregnancy. Numbers and percentage on bars indicate mice with pups over total number of mated mice. *p<0.05. (f) 3D visualization of day 6 implantation sites in Foxa2f/f, Foxa2f/fLtfCre+, and Foxa2f/fPgrCre+females. Images of E-cadherin immunostaining, segmented, and 3D rendered images of day 6 implantation sites in each genotype show defects in Foxa2f/fPgrCre+ females with a LIF injection on day 4 of pregnancy. Scale bar: 200 μm.
Figure 5 with 2 supplements
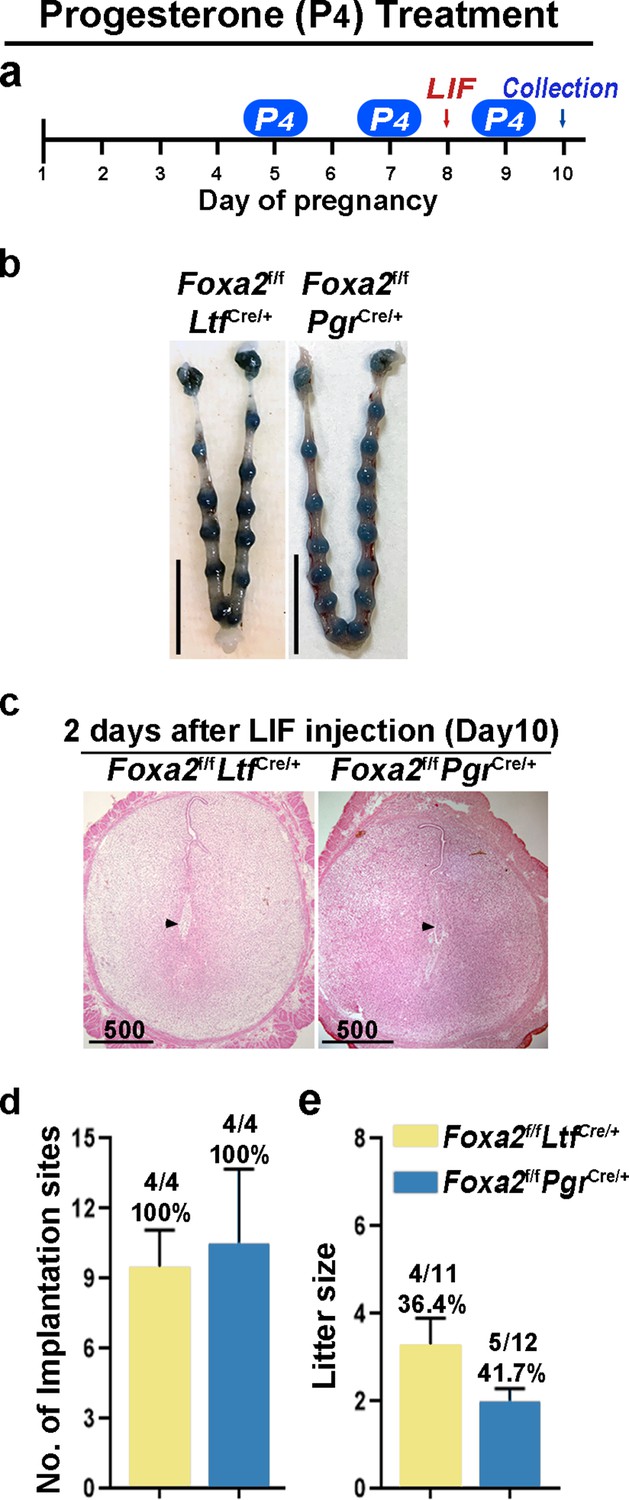
Counterbalance of estrogenic effects by P4 improves maintenance of diapause in Foxa2f/fLtfCre+ and Foxa2f/fPgrCre+ mice.
(a) Scheme of P4 treatment. Foxa2f/fLtfCre+ and Foxa2f/fPgrCre+ mice were treated with leukemia inhibitory factor (LIF) (20 μg) on day 8. Pregnancy was evaluated on day 10, 2 days after LIF administration. (b) Representative photographs of uteri in Foxa2f/fLtfCre+ and Foxa2f/fPgrCre+ mice with P4 supplement 2 days after LIF administration. Scale bar: 10 mm. Histological pictures of implantation sites in panel b were presented in panel c. Scale bar: 500 μm. (d) Average number of implantation sites in Foxa2f/fLtfCre+ and Foxa2f/fPgrCre+ mice with P4 supplement. Numbers and percentage on bars indicate mice with implantation sites over total number of mated mice. (e) Litter sizes of Foxa2f/fLtfCre+ and Foxa2f/fPgrCre+mice with P4 supplement. Numbers and percentage on bars indicate mice with pups over total number of mated mice.
Figure 5—figure supplement 1
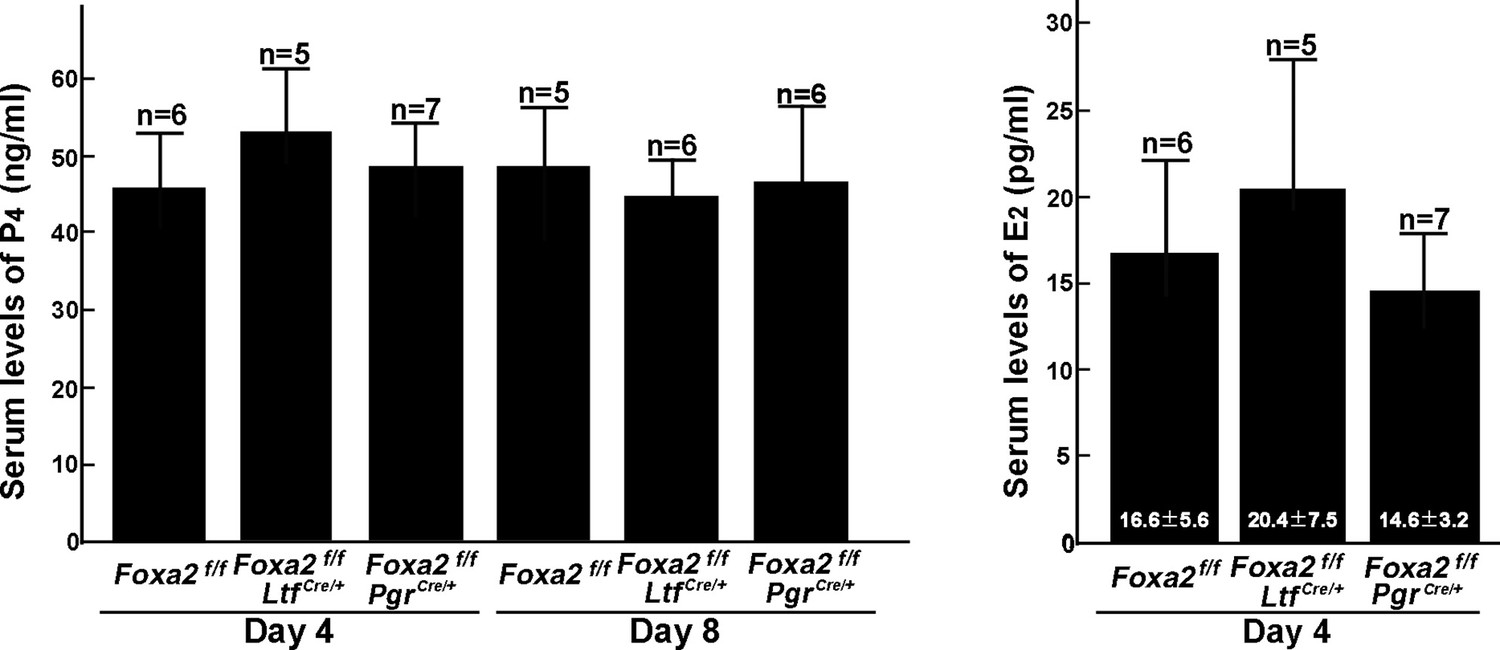
Serums levels of P4 and E2 in Foxa2f/f, Foxa2f/fLtfCre+, and Foxa2f/fPgrCre+females on days 4 and 8 of pregnancy.
Numbers of animals examined are presented on bars.
Figure 5—figure supplement 2

Fluorescence in situ hybridization of Bmp2.
Implantation sites of Foxa2f/f females were collected on day 6 of pregnancy. Implantation sites of Foxa2f/fLtfCre+ females with different treatments were collected 2 days after leukemia inhibitory factor (LIF) injections. Scale bar: 500 μm. Le, luminal epithelia; Ge, glandular epithelia; S, stroma. Asterisks represent the locations of embryos.
Figure 6
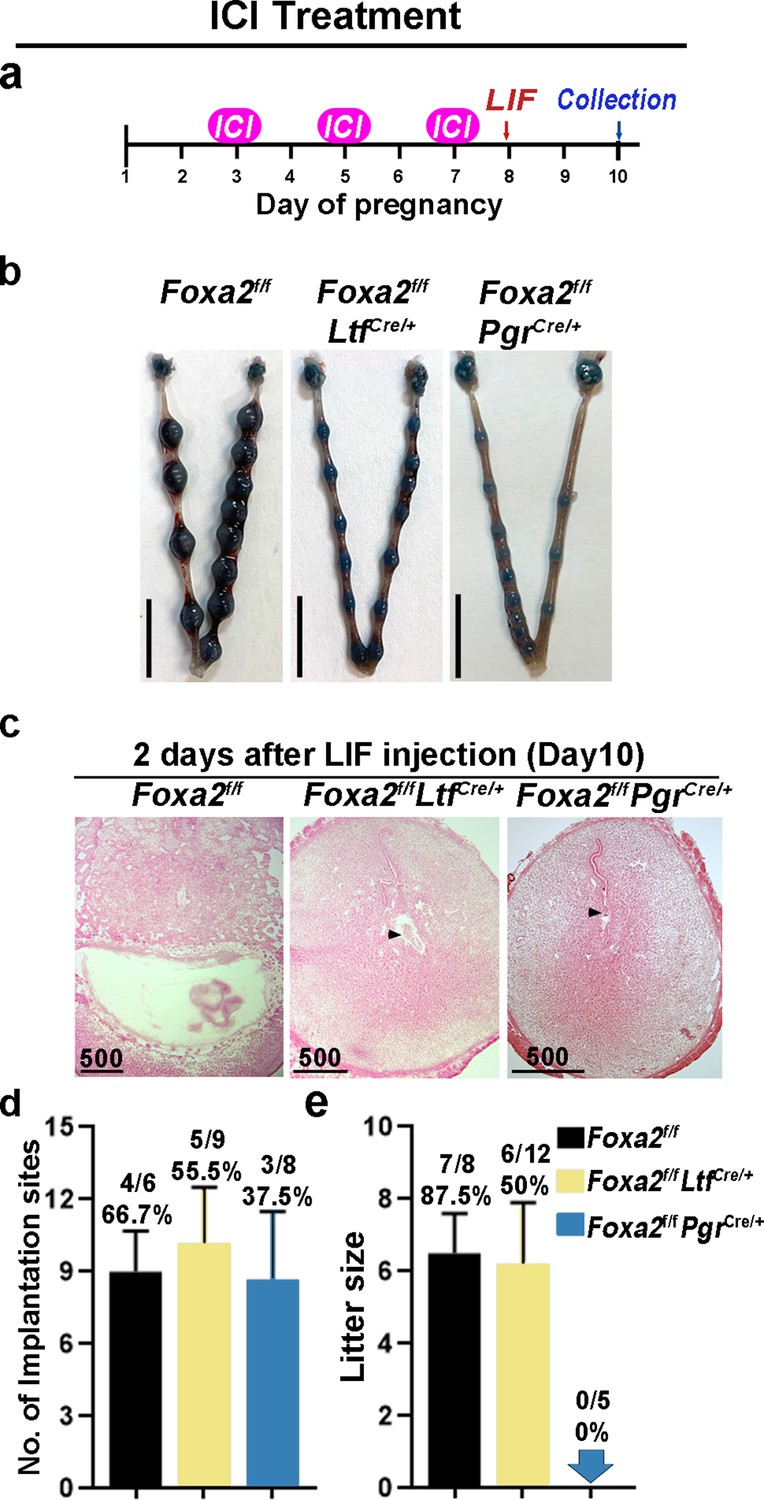
Neutralization of estrogenic effects by ICI improves diapause in Foxa2f/fLtfCre+ and Foxa2f/fPgrCre+ mice.
(a) Scheme of ICI treatment. Foxa2f/fLtfCre+ and Foxa2f/fPgrCre+ mice were treated with leukemia inhibitory factor (LIF) (20 μg) on day 8. Pregnancy was evaluated on day 10, 2 days after LIF administration. (b) Representative photographs of uteri in Foxa2f/fLtfCre+ and Foxa2f/fPgrCre+ mice with ICI treatment 2 days after LIF administration. Foxa2f/f mice have normal day 10 implantation sites, suggesting implantation occurs under 25 μg ICI treatment in Foxa2f/f mice. Scale bar: 10 mm. Histological pictures of implantation sites in panel b were presented in panel c. Scale bar: 500 μm. (d) Average number of implantation sites in Foxa2f/fLtfCre+ and Foxa2f/fPgrCre+ mice with ICI treatment. Numbers and percentage on bars indicate mice with implantation sites over total number of mated mice. (e) Litter sizes of Foxa2f/fLtfCre+ and Foxa2f/fPgrCre+mice with ICI treatment. Numbers and percentage on bars indicate mice with pups over total number of mated mice.
Figure 7
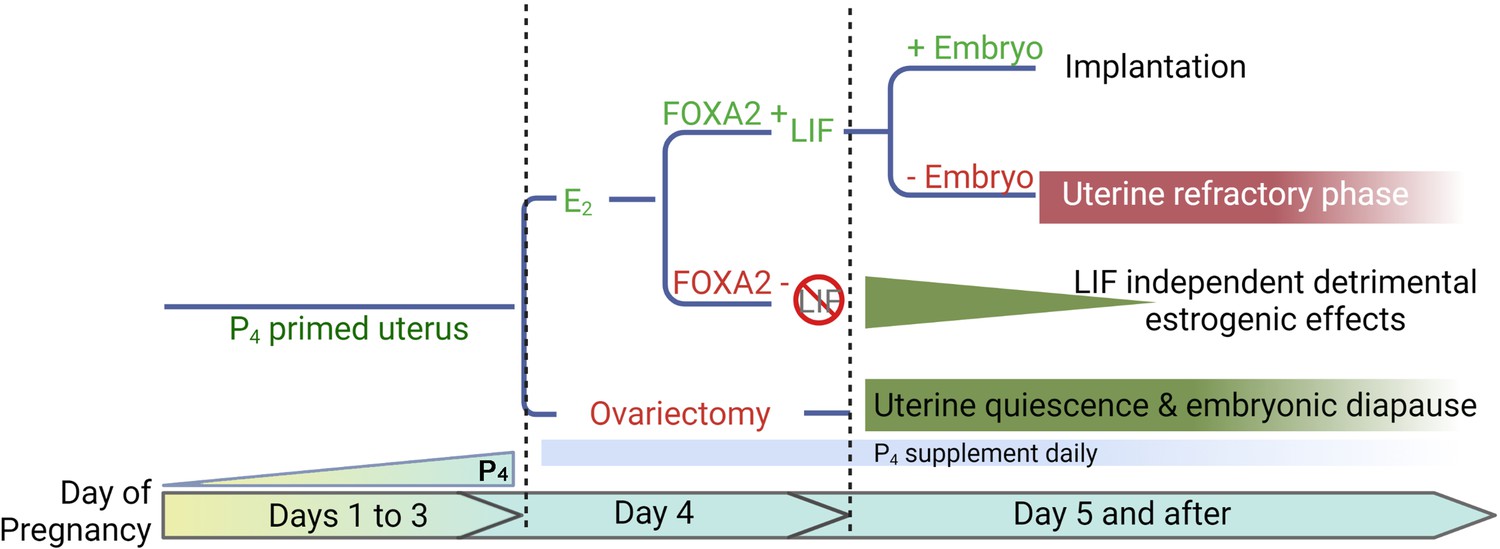
A representative scheme depicting roles of E2, FOXA2 (forkhead box protein A2), and leukemia inhibitory factor (LIF) in mouse diapause.
In natural pregnancy, a uterus enters a prereceptive phase before E2 secretion in the morning of day 4. In the presence of FOXA2, LIF is induced by E2 which renders the uterus into a receptive phase. In the event of implantation failure, the uterus becomes refractory on day 5 of pregnancy. The transition to the receptive phase is stopped if the E2 secretion on day 4 is prevented by ovariectomy. The uterus remains quiescent as long as P4 is supplemented; the embryonic development is arrested. A similar extension of prereceptive phase can be achieved by deleting FOXA2 or LIF. But the uterine quiescence is gradually compromised indicating that a LIF-independent estrogenic effect is detrimental to uterine quiescence.
Additional files
-
Supplementary file 1
Table 1.
Implantation sites in Foxa2f/f, Foxa2f/fLtfCre+, and Foxa2f/fPgrCre+females on day 8 of pregnancy.
- https://cdn.elifesciences.org/articles/78277/elife-78277-supp1-v2.docx
-
Transparent reporting form
- https://cdn.elifesciences.org/articles/78277/elife-78277-transrepform1-v2.docx
Download links
A two-part list of links to download the article, or parts of the article, in various formats.
Downloads (link to download the article as PDF)
Open citations (links to open the citations from this article in various online reference manager services)
Cite this article (links to download the citations from this article in formats compatible with various reference manager tools)
Targeted depletion of uterine glandular Foxa2 induces embryonic diapause in mice
eLife 11:e78277.
https://doi.org/10.7554/eLife.78277


