A neutrophil–B-cell axis impacts tissue damage control in a mouse model of intraabdominal bacterial infection via Cxcr4
- Department of Medicine I, Laboratory of Infection Biology, Medical University Vienna, Austria
- Ce-M-M-, Research Center for Molecular Medicine of the Austrian Academy of Sciences, Austria
- Department of Laboratory Medicine, Medical University of Vienna, Austria
- Department of Medicine II, Division of Cardiology, Medical University of Vienna, Austria
- Department of Pathology, Medical University Vienna, Austria
- Newcastle Fibrosis Research Group, Biosciences Institute, Newcastle University, United Kingdom
- Polypharma Biologics, Netherlands
Figures
Figure 1 with 1 supplement
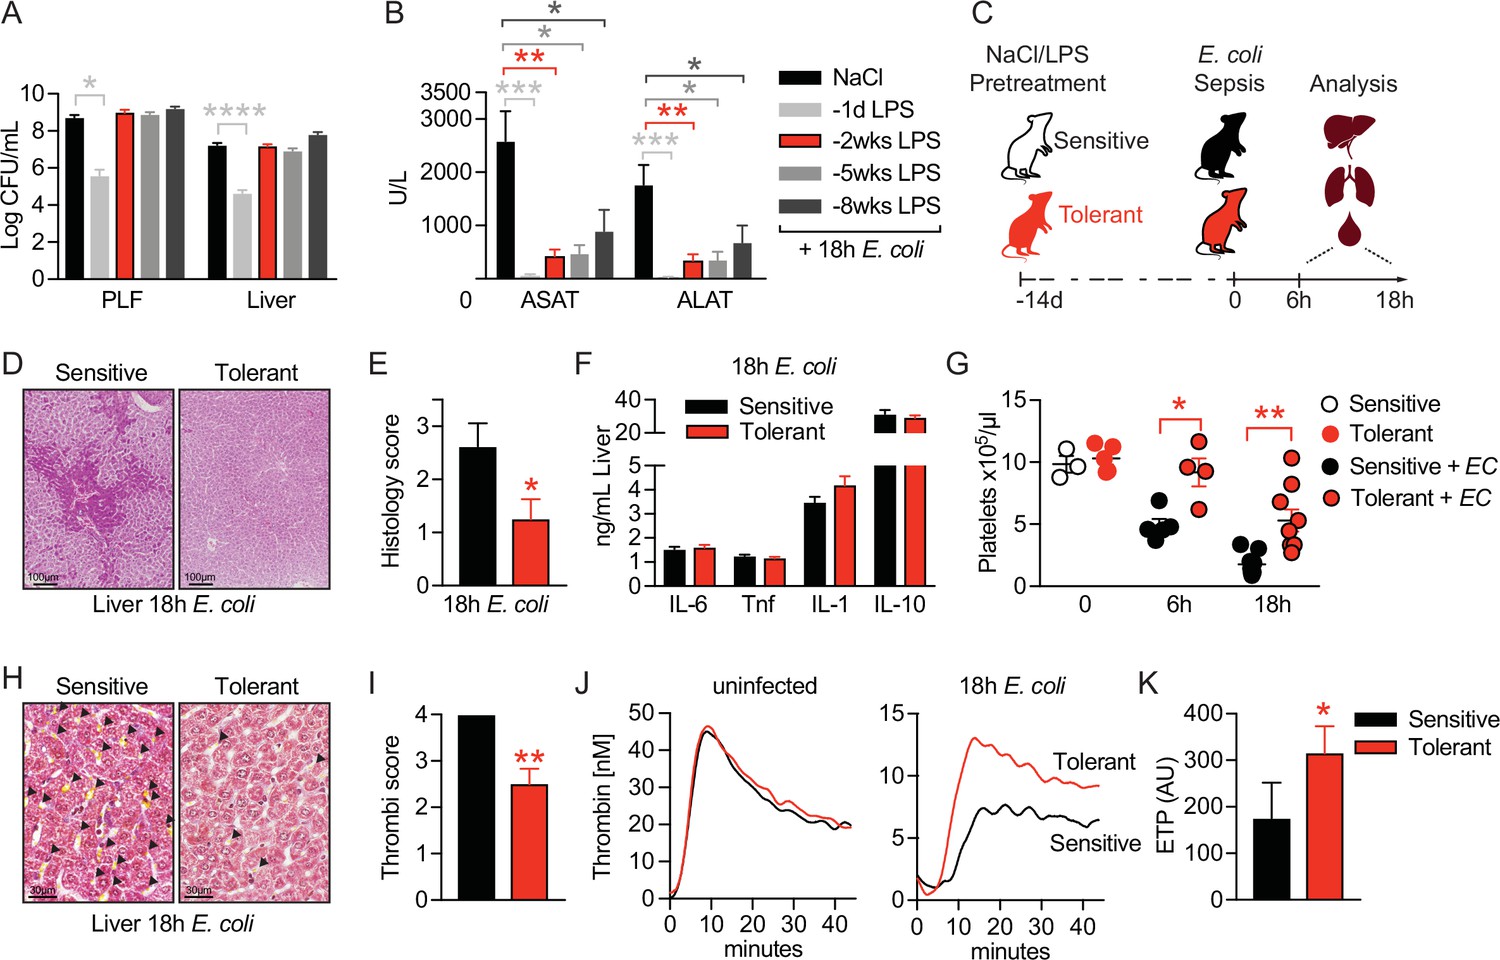
LPS pre-exposure induces long-term disease tolerance during Gram-negative sepsis.
(A) E. coli colony forming units (CFU) 18 hr post-infection (p.i.) in peritoneal lavage fluid (PLF) and liver of mice, which were pretreated with lipopolysaccharide (LPS) or saline (NaCl) at depicted time points before infection. (B) Aspartate aminotransferase (ASAT) and alanine aminotransferase (ALAT) plasma levels at 18 hr p.i. of mice, pretreated with LPS or NaCl at indicated time points. (C) Schematic depiction of the treatment procedure and endpoints. (D–E) H&E staining and pathology scores of liver sections from mice pretreated with LPS or NaCl 2 weeks earlier, and infected with E. coli for 18 hr. (F) Liver cytokine levels at 18 hr p.i. (G) Blood platelet counts at 2 weeks post LPS/NaCl pretreatment, and 6 hr or 18 hr p.i. (H–I) Martius, scarlet and blue (MSB) fibrin staining of liver sections and scoring of liver microthrombi at 18 hr p.i. (J) In vitro thrombin generation capacity of plasma from LPS/NaCl pretreated uninfected and infected mice. (K) Endogenous thrombin potential (ETP) of plasma samples 18 hr p.i. Data in (A) and (B) are pooled from 2 to 3 independent experiments (n=6–7/experimental group). Data in (G) are pooled from two independent experiments (n=1–3/experimental group for uninfected and 4–5 for infected mice). All other data are representative for two or more independent experiments (n=8/experimental group). All data are and presented as mean +/-SEM. * p≤0.05, ** p≤0.01, *** p≤0.001 and **** p≤0.0001.
Figure 1—figure supplement 1
LPS pre-exposure induces long-term disease tolerance during Gram-negative sepsis.
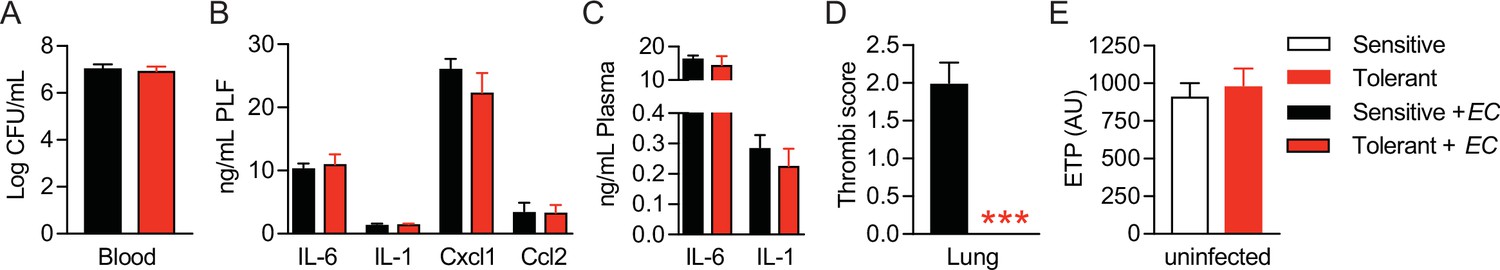
(A) Blood E. coli CFUs 18 hr p.i. with E. coli of mice, pretreated with lipopolysaccharide (LPS) or NaCl 2 weeks before infection. (B–C) Peritoneal lavage fluid (PLF) and plasma cytokine and chemokine levels 18 hr. p.i. with E. coli. (D) Histopathological scoring of lung microthrombi 18 hr p.i. with E. coli. (E) Endogenous thrombin potential (ETP) of plasma samples from uninfected mice 2 weeks after LPS or NaCl pretreatment. Data depicted in (D) represent a single experiment (n=8/group). All other data are representative for two or more independent experiments (n=5–8/experimental group) and are and presented as mean +/-SEM. *** p≤0.001.
Figure 2 with 1 supplement
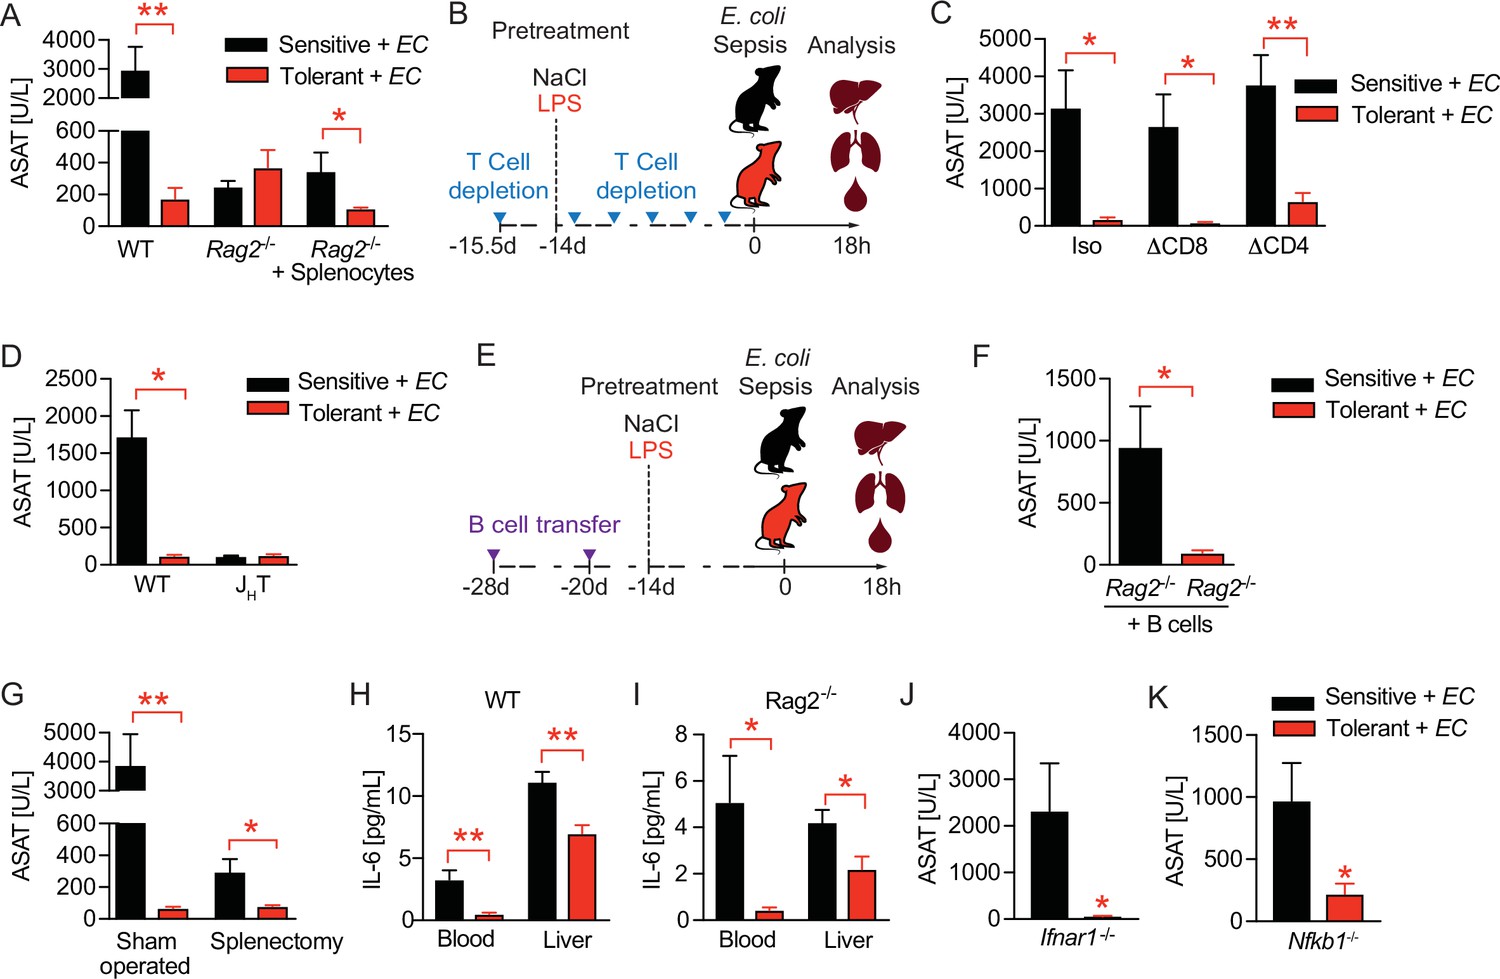
B cells regulate disease tolerance during sepsis independent of early inflammatory responses.
(A) Aspartate aminotransferase (ASAT) plasma levels at 18 hr p.i. with E. coli, of lipopolysaccharide (LPS) or NaCl pretreated wildtype or lymphocyte deficient mice (Rag2-/-), which have received either phosphate-buffered saline (PBS) or splenocytes i.v. 3 weeks prior infection. (B) Schematic depiction of the treatment procedure for T cell depletion experiments. (C) ASAT plasma levels 18 hr p.i. with E. coli of mice, which were depleted from CD4+ or CD8+ T cells prior to LPS or NaCl pretreatment. (D) ASAT plasma levels of LPS or NaCl pretreated wildtype or B cell deficient (JHT) mice at 18 hr p.i. with E. coli. (E) Schematic depiction of the treatment procedure for splenocyte and B cell transfer experiments. (F) ASAT plasma levels of LPS or NaCl pretreated Rag2-/- mice at 18 hr p.i. with E. coli, which have been reconstituted with bone marrow derived B cells 3 weeks before infection. (G) ASAT plasma levels at 18 hr p.i. with E. coli of LPS or NaCl pretreated mice, which were splenectomized or sham operated 1 week before LPS or NaCl pre-exposure (i.e. 3 weeks before infection). (H–I) IL-6 levels in plasma and liver of NaCl or LPS pretreated wildtype or Rag2-/- mice at 6 hr p.i. with E. coli. (J) ASAT plasma levels of NaCl or LPS pretreated Ifnar1-/- mice at 18 hr p.i. with E. coli. (K) ASAT plasma levels of NaCl or LPS pretreated Nfkb1-/- mice at 18 hr p.i. with E. coli. Data in (A) and (G–J) are representative out of 2–3 experiments (n=3–8/experimental group). Data in (D) and (K) are pooled from 2 independent experiments (n=2–7/experimental group). Data in (C) and (F) are from a single experiment (n=6–8/group). Data are and presented as mean +/-SEM. * p≤0.05 and ** p≤0.01.
Figure 2—figure supplement 1
B cells regulate disease tolerance during sepsis independent of early inflammatory responses.
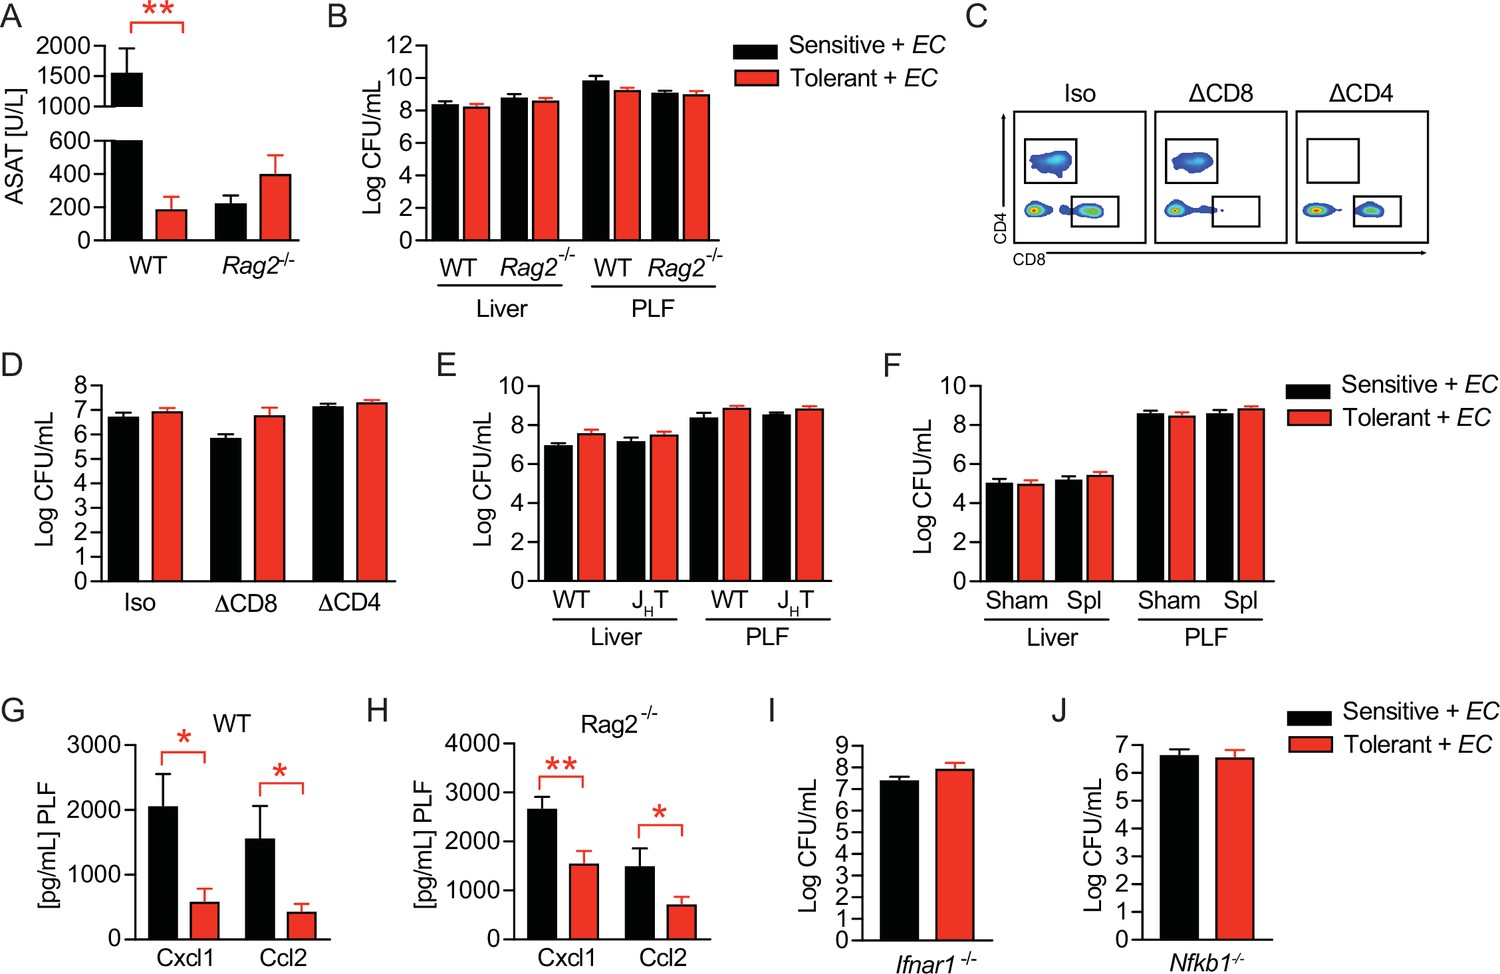
(A) Aspartate aminotransferase (ASAT) plasma levels 18 hr p.i. with E. coli of NaCl or lipopolysaccharide (LPS) pretreated wild type (WT) and Rag2-/- mice. (B) E. coli CFUs in livers and peritoneal lavage fluid (PLF) of NaCl or LPS pretreated WT and Rag2-/- mice 18 hr p.i. with E. coli. (C) Flow-cytometric analysis of CD4+ and CD8+ T cells in blood of mice after administration of anti-CD8, or anti-CD4, respectively, cell depletion antibodies. (D) E. coli CFUs in livers 18 hr p.i. with E. coli of mice, which received CD4+ or CD8+ T cell depleting antibodies before LPS or NaCl pretreatment. (E) E. coli CFUs in livers and PLF of NaCl or LPS pretreated WT and JHT mice at 18 hr p.i. with E. coli. (F) E. coli CFUs in livers and PLF 18 hr p.i. of mice, which were splenectomized or sham operated 1 week before LPS or NaCl pre-exposure (i.e. 3 weeks before bacterial infection). (G–H) CXCL1 and CCL2 levels in PLF of NaCl or LPS pretreated wildtype (I) or Rag2-/- (J) mice 6 hr p.i. with E. coli. (I) E. coli CFUs in livers of NaCl or LPS pretreated Ifnar1-/- mice 18 hr p.i. with E. coli. (J) E. coli CFUs in livers of NaCl or LPS pretreated Nfkb1-/- mice 18 hr p.i. with E. coli. Data in (A–B) and (E–I) are representative out of 2–3 experiments (n=4–8/experimental group). Data depicted in (C–D) are from a single experiment (n=6–8/group). Data in (J) are pooled from 2 experiments (n=2–6/experimental group) and all data are presented as mean +/-SEM. * p≤0.05 and ** p≤0.01.
Figure 3 with 1 supplement
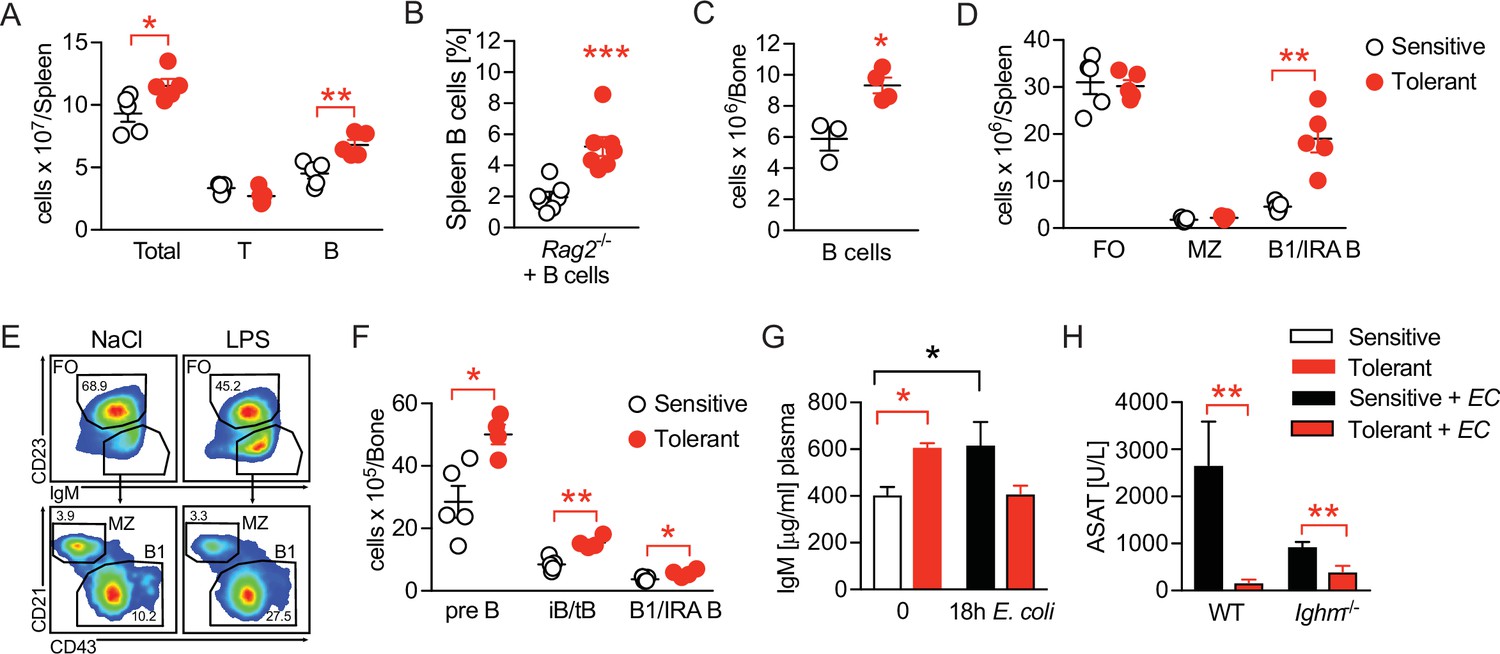
Disease tolerance is associated with rearranged B cell compartments.
(A) Flow-cytometric analysis of B and T cells in the spleen of mice treated with lipopolysaccharide (LPS) or NaCl 2 weeks earlier. (B) Flow-cytometric analysis of B cells in spleens of Rag2-/- mice treated with LPS or NaCl 2 weeks earlier, and reconstituted with GFP+ B cells before LPS/NaCl. (C) CD19+ B cells per femur of mice treated with NaCl or LPS 2 weeks earlier. (D) Flow-cytometric analysis of FO, MZ and B1/IRA B cells in spleens of mice treated with LPS or NaCl 2 weeks earlier. (E) Gating strategy for splenic B cell subsets. (F) Flow-cytometric analysis of Pre-B, iB/tB and B1/IRA B cells in the bone marrow of mice treated with LPS or NaCl 2 weeks earlier. (G) IgM plasma levels in NaCl or LPS pretreated uninfected mice and 18 hr p.i. with E. coli. (H) Aspartate aminotransferase (ASAT) plasma levels of NaCl or LPS pretreated WT and Ighm-/- mice 18 hr p.i. with E. coli. Data in (A) and (C–F) and are representative out of 2–3 experiments (n=3–8/experimental group). Data in (G–H) are pooled from two independent experiments (n=3–7/experimental group). Data in (B) are from a single experiment (n=7/group) and all data are and presented as mean +/-SEM. * p≤0.05 and ** p≤0.01.
Figure 3—figure supplement 1
Disease tolerance is associated with rearranged B cell compartments.
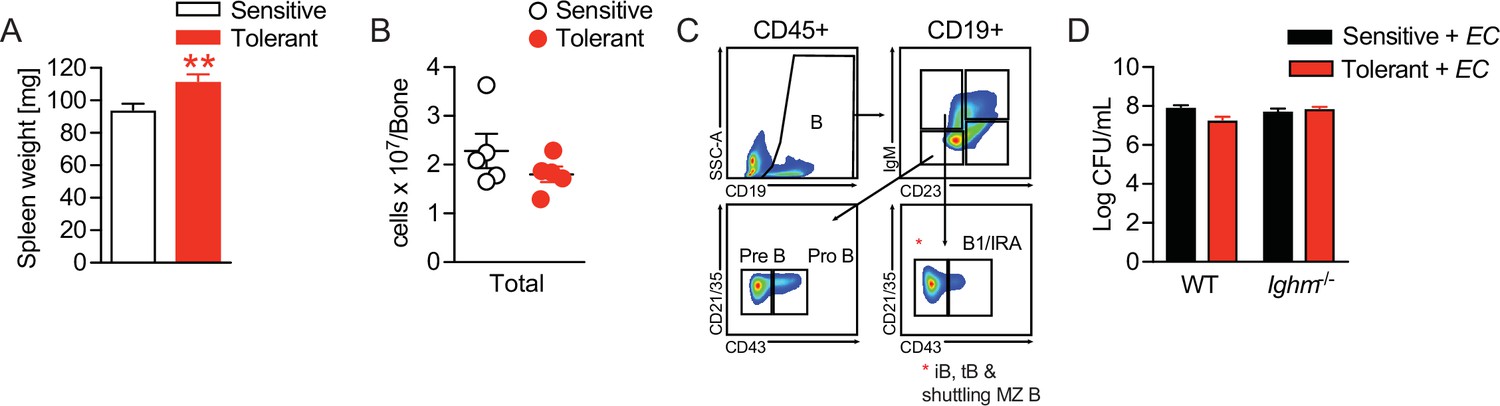
(A) Spleen weight of mice, which were treated with NaCl or lipopolysaccharide (LPS) 2 weeks earlier. (B) Nucleated cells per femur of mice treated with NaCl or LPS 2 weeks earlier. (C) Gating strategy for bone marrow B cell subsets. (D) E. coli CFUs in livers of NaCl or LPS pretreated WT and Ighm-/- mice 18 hr p.i. with E. coli. Data in (B) and (D) are representative out of 2–3 experiments (n=4–8/experimental group). Data in (A) are pooled from three experiments (n=2–6/experimental group) and all data are presented as mean +/-SEM. ** p≤0.01.
Figure 4 with 1 supplement
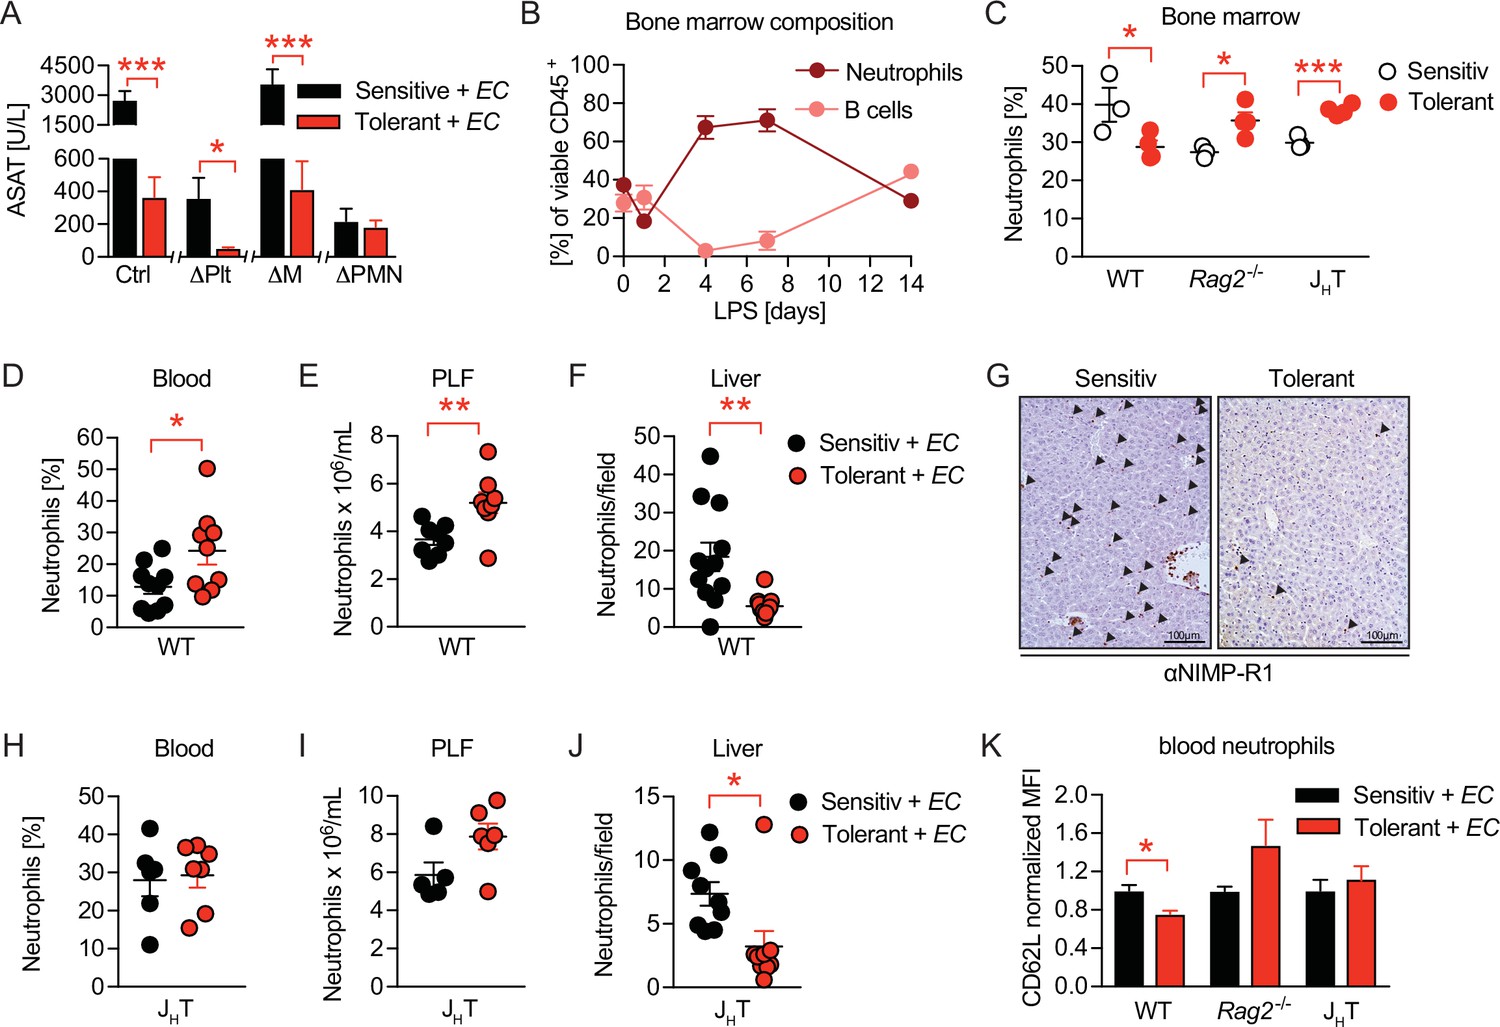
B cells impact neutrophils, the key effectors driving sepsis-induced tissue damage.
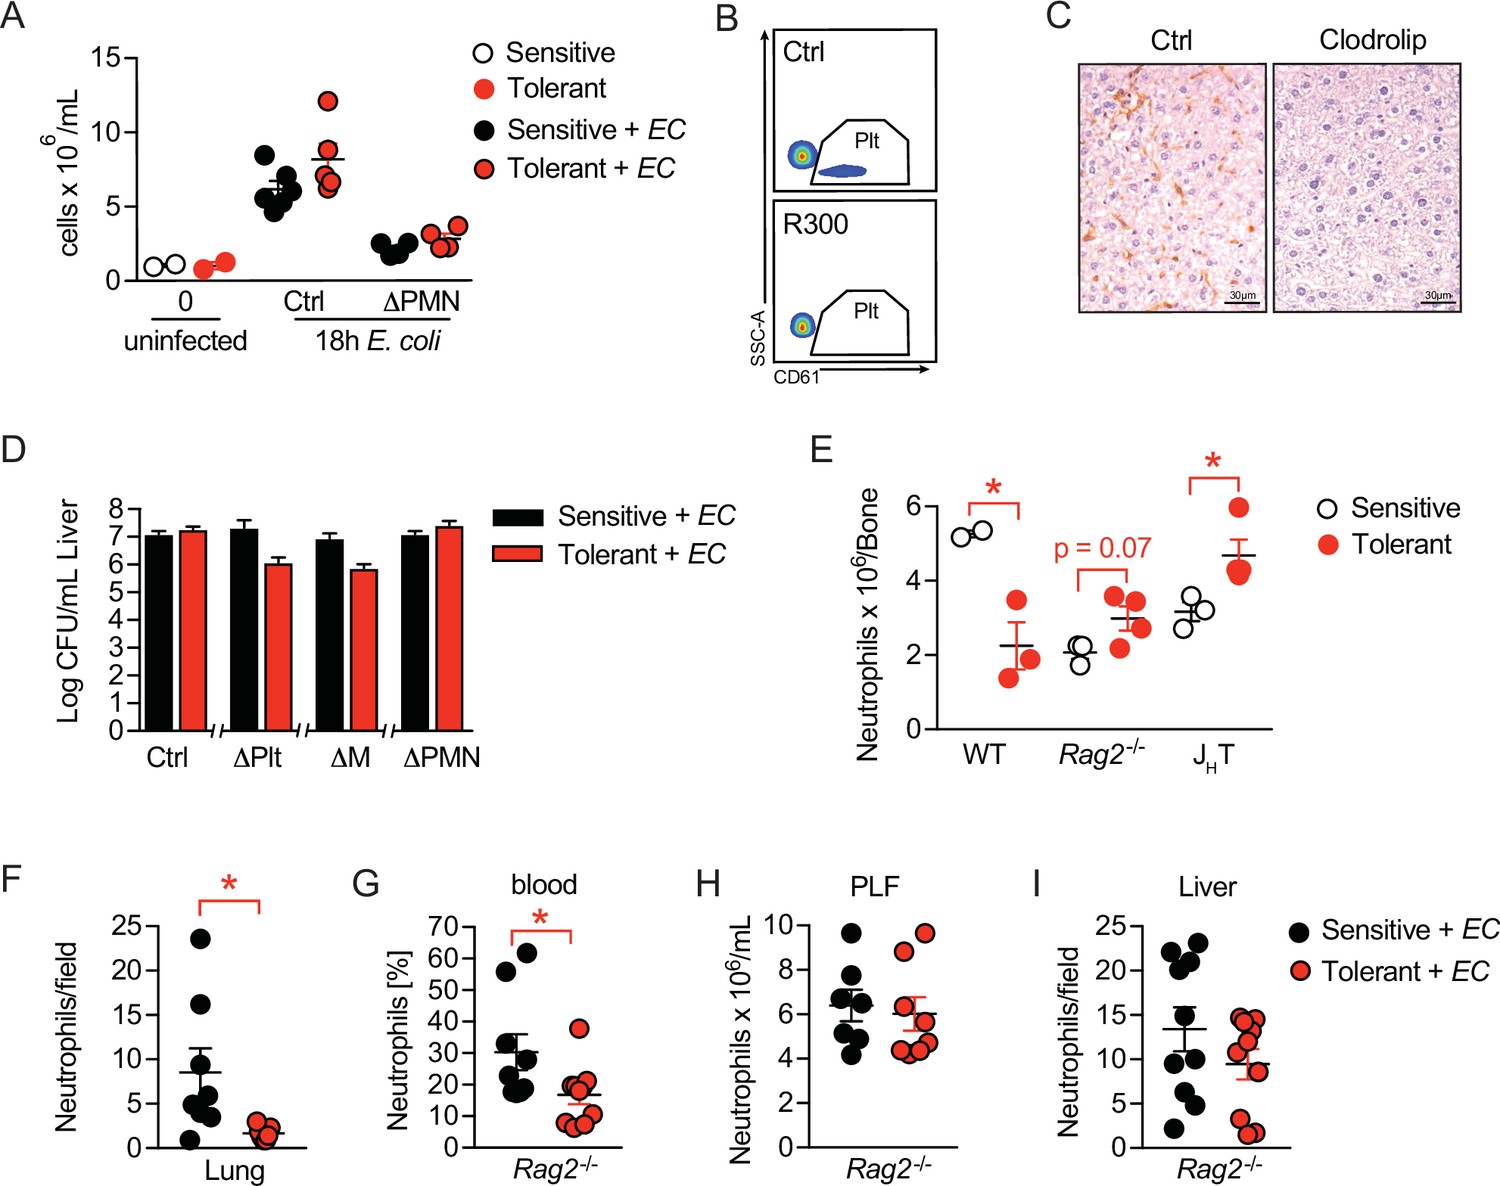
(A) Aspartate aminotransferase (ASAT) plasma levels 18 hr p.i. with E. coli in lipopolysaccharide (LPS) or NaCl pretreated mice, in which platelets, monocytes/macrophages, or neutrophils, respectively, were depleted before infection. (B) Flow-cytometric analysis of bone marrow neutrophils and B cells after i.v. administration of LPS at time = 0 hr. (C) Flow-cytometric analysis of neutrophils in the bone marrow of wildtype, Rag2-/- and JHT mice 2 weeks after LPS or NaCl treatment. (D–E) Flow-cytometric analysis of neutrophils of wildtype mice pre-treated with NaCl or LPS, respectively, and infected for 18 hr with E. coli, in blood (D) and peritoneal lavage fluid (PLF) (E). (F–G) Quantification of (F) immunohistological staining for NIMP-R1+ cells on liver sections (G) of mice pretreated with NaCl or LPS, respectively, and infected with E. coli for 18 hr. (H–J) Flow-cytometric analysis of neutrophils 18 hr p.i. with E. coli in blood (H), PLF (I), and liver (J) of JHT mice. (K) Flow-cytometric analysis of blood neutrophil CD62L expression of WT, Rag2-/- and JHT mice at 18 hr p.i. with E. coli. Data in (A) shown for the control group and neutrophil depletion are pooled from two independent experiments (n=4–6/experimental group), platelet and monocyte/ macrophage depletion represent a single experiment (n=8/group). Data in (B), (D–E), (F), and (J) are pooled from two independent experiments (n=4–8/experimental group). Data in (H–I) are representative of two experiments (n=5–8/group). Data in (K) are from a single experiment (n=4–8/group). All data are presented as mean +/-SEM. * p≤0.05, ** p≤0.01 and *** p≤0.001.
Figure 4—figure supplement 1
B cells impact neutrophils, the key effectors driving sepsis-induced tissue damage.
(A) Peritoneal lavage fluid (PLF) cell numbers of uninfected mice and mice 18 hr p.i. with E. coli, which received an anti-Ly-6G depletion antibody i.v. 24 hr before infection. (B) Flow-cytometric analysis of blood platelets (SSCAlow, CD61+) in mice that received an anti-GPIbα (R300) depletion antibody 24 hr earlier. (C) Immunohistological staining for F4/80+ cells on liver sections of mice which received either clodronate-loaded liposomes (clodrolip) or empty control liposomes i.v. 24 hr earlier. (D) E. coli CFUs 18 hr p.i. with E. coli in livers of NaCl or lipopolysaccharide (LPS) pretreated mice, which received depletion antibodies for platelets or neutrophils, or clodronate liposomes before infection. (E) Flow-cytometric analysis of bone marrow neutrophil abundance 2 weeks after treatment with LPS or NaCl. (F) Quantification of NIMP-R1+ cells in immunohistological staining of lung sections from NaCl or LPS pretreated mice 18 hr p.i. with E. coli. (G–H) Flow-cytometric analysis of neutrophils in blood and PLF of NaCl or LPS pretreated Rag2-/- mice 18 hr p.i. with E. coli. (I) Quantification of NIMP-R1+ cells after immunohistological staining of liver sections from NaCl or LPS pretreated Rag2-/- mice 18 hr p.i. with E. coli. Data shown in (A), (E) and (H) are representative out of two independent experiments (n=2–6 per experimental group for A and E and n=7–8 per experimental group for H). Data in (B–C) are from a single experiment, which was set up to test the depletion efficiency in uninfected animals (n=3 per experimental group). In (D) CFU data shown for the control group and neutrophil depletion are pooled from two independent experiments (n=4–6 per experimental group) and data showing the platelet and monocyte/macrophage depletion are from a single experiment (n=8 per group). Data depicted in (G) and (I) are pooled from two independent experiments (n=4–6 per experimental group) and data in (F) are from a single experiment (n=8 per group). All data are presented as mean +/-SEM. * p≤0.05.
Figure 5 with 1 supplement
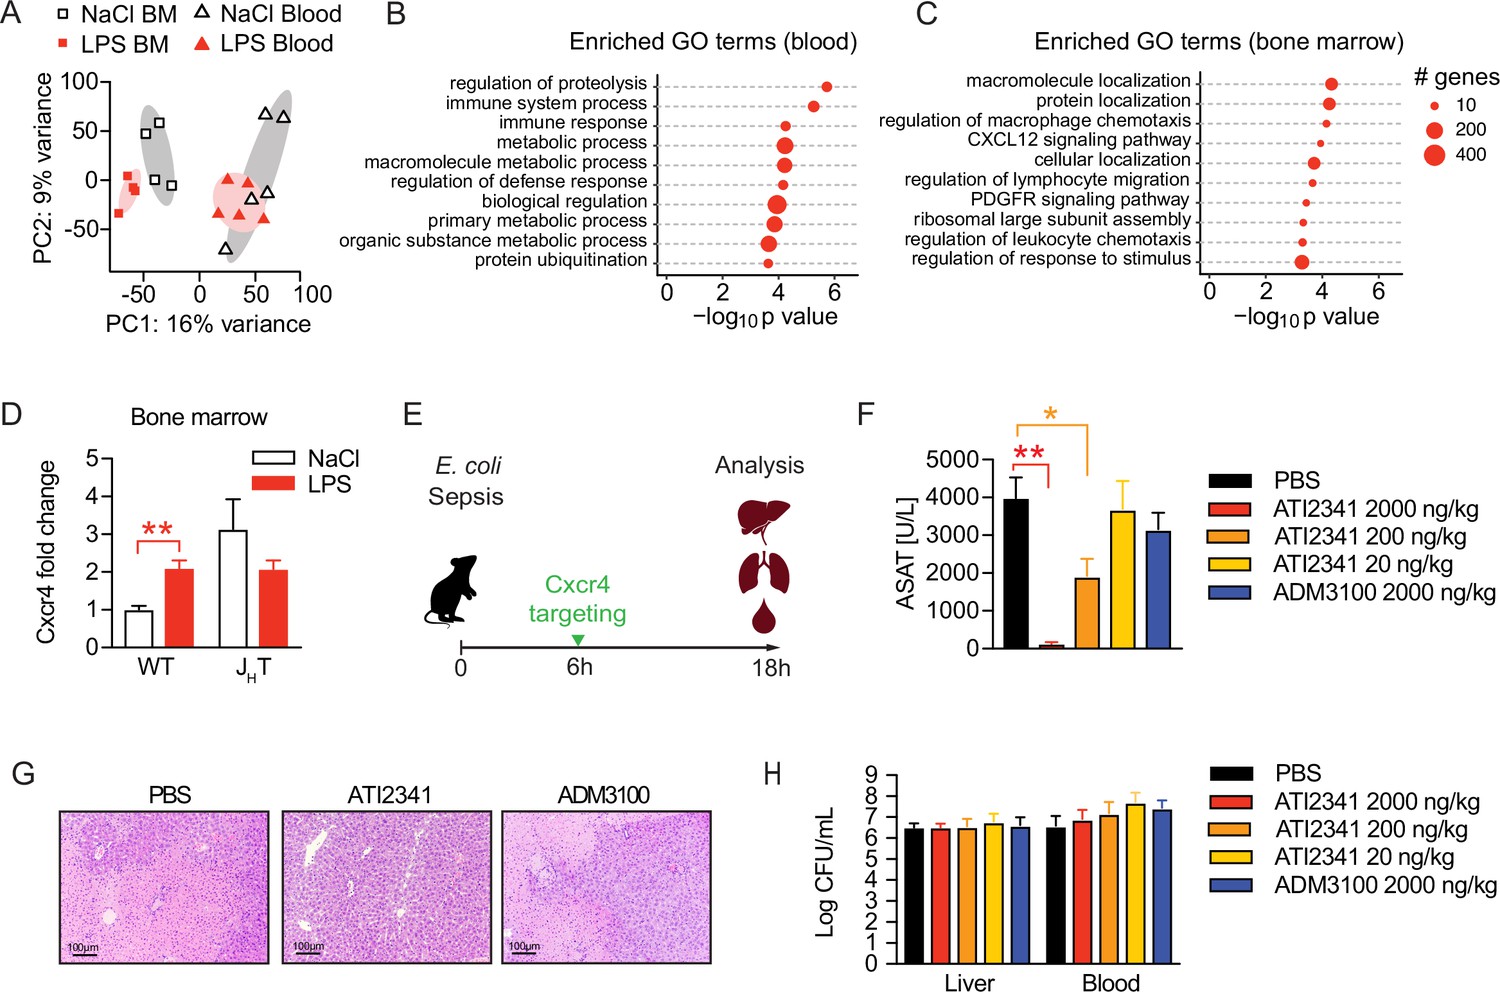
Neutrophil tissue damaging properties are modulated by bone marrow B cells via Cxcr4.
(A) Principle componen analysis (PCA) of the top 1000 most variable genes expressed by neutrophils isolated from blood or bone marrow, of mice pretreated with lipopolysaccharide (LPS) or NaCl 2 weeks earlier. (B–C) Gene ontology (GO) enrichment analysis of blood and bone marrow neutrophil differentially expressed genes (DEGs). (D) Cxcr4 mRNA expression in sorted bone marrow neutrophils from WT and JHT mice, pretreated with NaCl or LPS 2 weeks earlier. (E) Schematic depiction of the treatment procedure for the therapeutic application of a Cxcr4 agonist (ATI2341) and a Cxcr4 antagonist (ADM3100) at indicated doses. (F) Aspartate aminotransferase (ASAT) plasma levels of mice 18 hr p.i. with E. coli, which were treated with depicted doses of Cxcr4 ligands (agonist ATI2341 or antagonist ADM3100, respectively) 6 hr p.i. (G) Representative liver histology (H&E stain) of mice 18 hr p.i. with E. coli, treated with PBS or the indicated Cxcr4 ligands (agonist ATI2341, antagonist ADM3100, at 2000 ng/kg) 6 hr p.i. (H) Liver and blood CFUs of mice 18 hr p.i. with E. coli of mice, which were i.v. treated with depicted doses of Cxcr4 ligands (agonist ATI2341 and antagonist ADM3100, respectively) at 6 hr p.i. Data in (A–C) are from a single experiment (n=4–5/group). Data in (D) are from an independent experiment (n=3–4), versus data shown in (A–C). Data in (F–H) are representative of two independent experiments (n=3–8/experimental group). All data are and presented as mean +/-SEM. * p≤0.05 and ** p≤0.01.
Figure 5—figure supplement 1
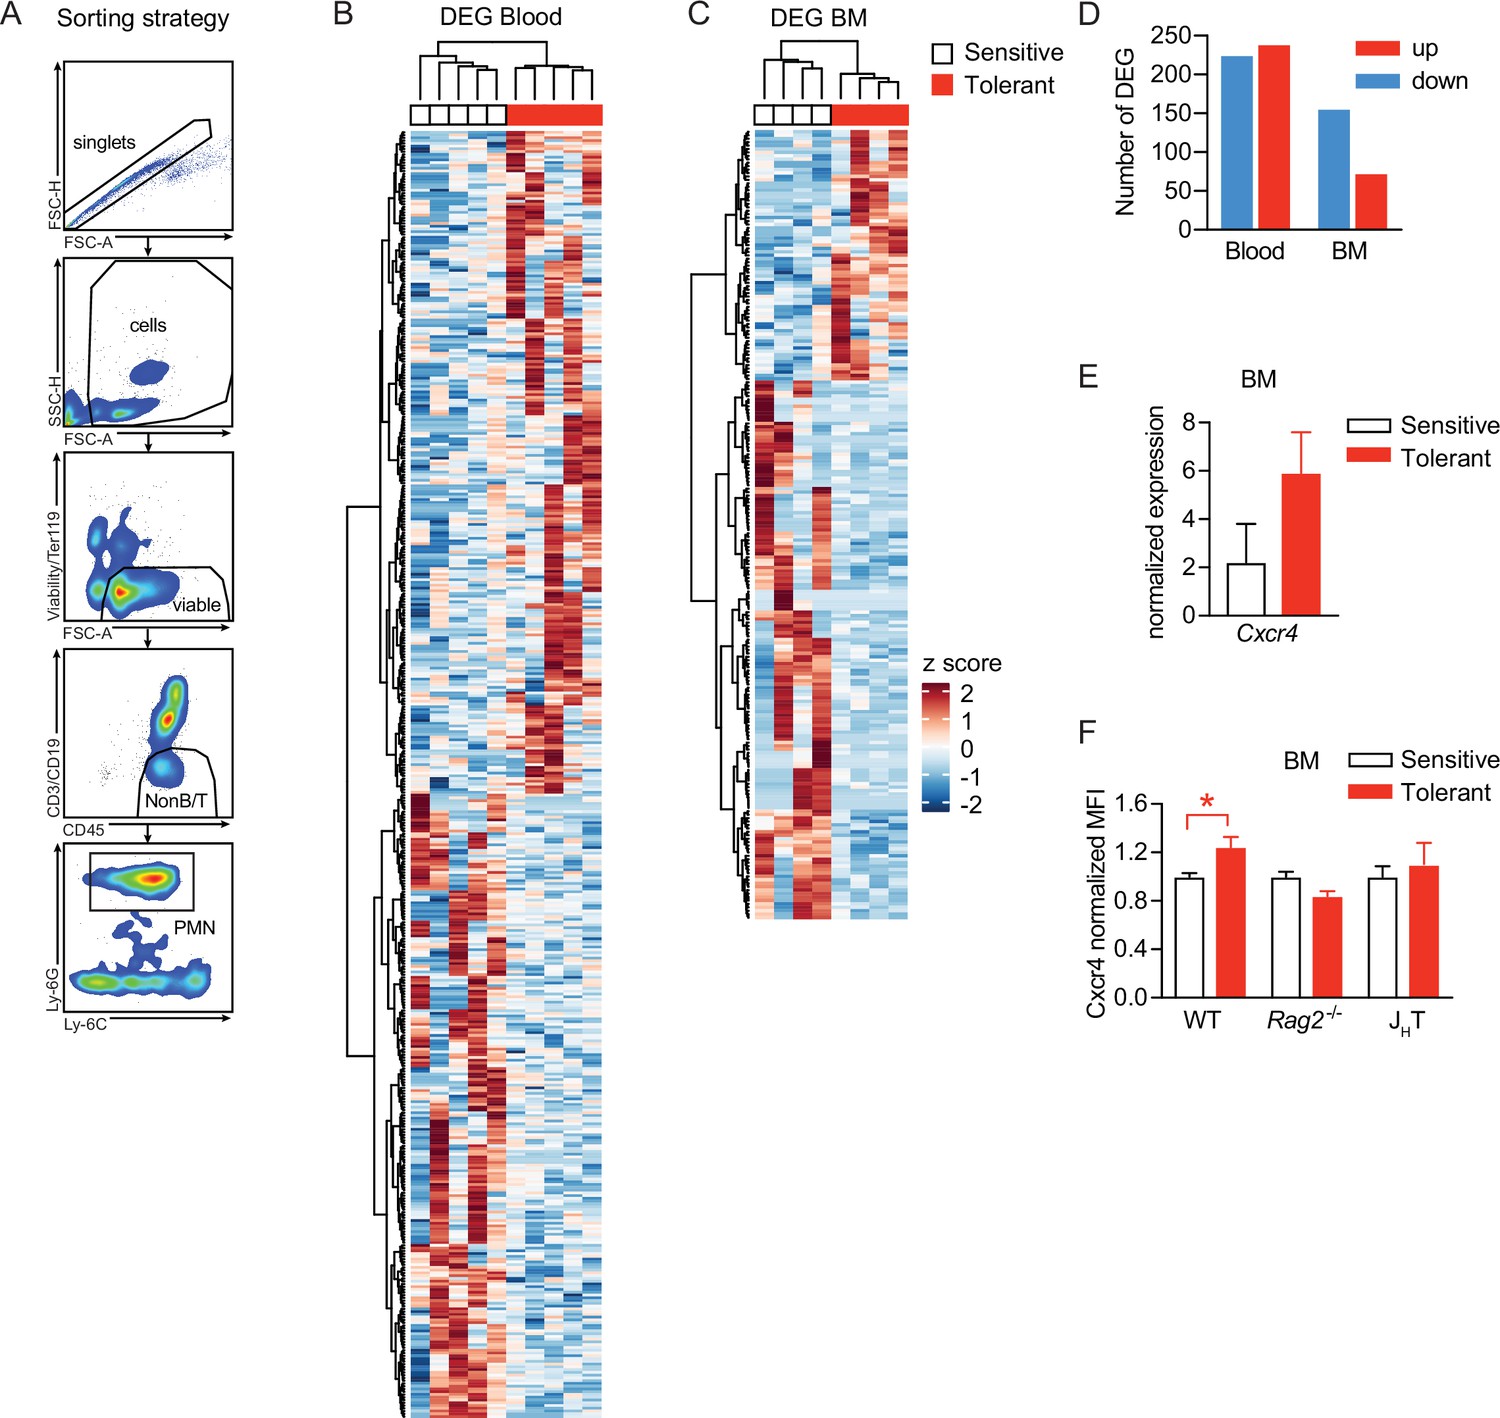
Neutrophil tissue damaging properties are modulated by bone marrow B cells via Cxcr4.
(A) Gating strategy applied for neutrophil sorting from blood and bone marrow. (B–C) Hierarchical clustering of differentially expressed gene (DEG) of blood and bone marrow neutrophils from mice that were pretreated with lipopolysaccharide (LPS) versus NaCl 2 weeks earlier. (D) Number of up- and downregulated DEG in blood and bone marrow neutrophils from mice pretreated with LPS 2 weeks earlier, as compared to NaCl treated controls. (E) Normalized gene expression of Cxcr4 in sorted bone marrow neutrophils. (F) Normalized MFI of Cxcr4 on bone marrow neutrophils assessed by flow cytometry in indicated mouse strains. Data in (A–E) are from a single experiment (n=4–5/group) and data in (F) are from a different single experiment (n=3–4/group). All data are presented as mean +/-SEM. * p≤0.05.
Tables
Appendix 1—key resources table
| Reagent type (species) or resource | Designation | Source or reference | Identifiers | Additional information |
|---|---|---|---|---|
| Strain, strain background (Mus musculus, female) | C57BL/6 J | Own colony, Jackson Labs | JAX #000664 | |
| Strain, strain background (Mus musculus, female) | B6;129P-Nfkb1tm1Bal/J (Nfkb1-/-) | Provided by Derek Mann (Newcastle University, UK), Jackson Labs | JAX #002849, (Sha et al., 1995) | |
| Strain, strain background (Mus musculus, female) | B6.Cg-Rag2tm1.1Cgn/J (Rag2-/-) | Own colony, Jackson Labs | JAX #008449, (Hao and Rajewsky, 2001) | |
| Strain, strain background (Mus musculus, female) | B6.129P2-Igh-Jtm1Cgn/J (JHT) | Own colony, Jackson Labs | JAX #002438, (Gu et al., 1993) | |
| Strain, strain background (Mus musculus, female) | B6;129S4-Ighmtm1Che/J (Ighm-/-) | Own colony, Jackson Labs | JAX #003751, (Boes et al., 1998) | |
| Strain, strain background (Mus musculus, female) | B6.129S2-Ifnar1tm1Agt/Mmjax (Ifnar1-/-) | Own colony, Jackson Labs | MMRRC Strain #032045-JAX, (Müller et al., 1994) | |
| Strain, strain background (Mus musculus, female) | C57BL/6-Tg(UBC-GFP)30Scha/J (UBI-GFP) | Own colony, Jackson Labs | JAX #004353, (Schaefer et al., 2001) | |
| Strain, strain background (E. coli) | E. coli, O18:K1 | Clinical isolate | n.a. | |
| Antibody | Ultra-LEAF anti-mouse Ly-6G (rat monoclonal) | BioLegend | Cat# 127650; RRID:AB_2572002 | ‘1 mg/mouse’ i.v. |
| Antibody | anti-mouse GPIbα (CD42b) (rat monoclonal) | Emfret | Cat# R300; RRID:AB_2721041 | ‘40 μg/mouse’ i.v. |
| Antibody | anti-mouse CD4 (rat monoclonal) | Generated in house, clone GK1.5 | n.a. | ‘200 μg/mouse’ i.v. |
| Antibody | anti-mouse CD8 (rat monoclonal) | Generated in house, clone YTS169 | n.a. | ‘400 μg/mouse’ i.v. |
| Antibody | PE anti-mouse CD61 (armenian hamster monoclonal) | BioLegend | Cat# 104307; RRID:AB_313084 | FC ‘(1:200)’ |
| Antibody | BV510 anti-mouse CD45 (rat monoclonal) | BioLegend | Cat# 103138; RRID:AB_2563061 | FC ‘(1:200)’ |
| Antibody | APC/Cy7 anti-mouse TER-119 (rat monoclonal) | BioLegend | Cat# 116223; RRID:AB_2137788 | FC ‘(1:200)’ |
| Antibody | FITC anti-mouse CD3 (rat monoclonal) | BioLegend | Cat# 100204; RRID:AB_312661 | FC ‘(1:200)’ |
| Antibody | PerCP/Cy5.5 anti-mouse CD4 (rat monoclonal) | BioLegend | Cat# 100433; RRID:AB_893330 | FC ‘(1:100)’ |
| Antibody | Pacific Blue anti-mouse CD8a (rat monoclonal) | BioLegend | Cat# 100728; RRID:AB_493426 | FC ‘(1:200)’ |
| Antibody | FITC anti-mouse CD19 (rat monoclonal) | BioLegend | Cat# 115506; RRID:AB_313641 | FC ‘(1:200)’ |
| Antibody | BV605 anti-mouse CD19 (rat monoclonal) | BioLegend | Cat# 115540; RRID:AB_2563067 | FC ‘(1:200)’ |
| Antibody | PE anti-mouse CD19 (rat monoclonal) | BioLegend | Cat# 115507; RRID:AB_313642 | FC ‘(1:200)’ |
| Antibody | PE anti-mouse IgD (rat monoclonal) | BioLegend | Cat# 405706; RRID:AB_315028 | FC ‘(1:200)’ |
| Antibody | eFluor450 anti-mouse IgM (rat monoclonal) | eBioscience, Thermo Fisher | Cat# 48-5890-80; RRID:AB_10671342 | FC ‘(1:200)’ |
| Antibody | FITC anti-mouse CD23 (rat monoclonal) | BioLegend | Cat# 101606; RRID:AB 312831 | FC ‘(1:100)’ |
| Antibody | PerCP/Cy5.5 anti-mouse CD21/CD35 (CR2/CR1) (rat monoclonal) | BioLegend | Cat# 123416; RRID:AB_1595490 | FC ‘(1:100)’ |
| Antibody | APC anti-mouse CD43 (rat monoclonal) | BioLegend | Cat# 143208; RRID:AB_1114965 | FC ‘(1:200)’ |
| Antibody | PE/Cy7 anti-mouse Ly-6G (rat monoclonal) | BioLegend | Cat# 127617; RRID:AB_1877262 | FC ‘(1:200)’ |
| Antibody | PE anti-mouse Ly6G (rat monoclonal) | BioLegend | Cat# 127608; RRID:AB_1186099 | FC ‘(1:200)’ |
| Antibody | Brilliant Violet 605 anti-mouse Ly-6C (rat monoclonal) | BioLegend | Cat# 128036; RRID:AB_2562353 | FC ‘(1:200)’ |
| Antibody | Alexa Fluor 700 anti-mouse CD11b (rat monoclonal) | BioLegend | Cat# 101222; RRID:AB_493705 | FC ‘(1:200)’ |
| Antibody | PE anti-mouse CD62L (rat monoclonal) | BD Biosciences | Cat# 553151; RRID:AB_394666 | FC ‘(1:200)’ |
| Antibody | APC anti-mouse Cxcr4 (rat monoclonal) | BioLegend | Cat# 146507; RRID:AB_2562784 | FC ‘(1:200)’ |
| Antibody | anti-mouse NIMP-R14 (rat monoclonal) | Abcam | Cat# ab2557-50; RRID:AB_303154 | IHC ‘(1:50)’ |
| Antibody | Biotin anti-rat IgG (goat polyclonal) | BioRad | Cat# STAR131B; RRID:AB_11152774 | IHC ‘(1:200)’ |
| Antibody | anti-mouse F4/80 (rat monoclonal) | AbD Serotec | Cat# MCA497G; RRID:AB_872005 | IHC ‘(1:200)’ |
| Antibody | Biotin anti-rat IgG (goat polyclonal) | Vector Laboratories | Cat# BA-4001; RRID:AB_10015300 | IHC ‘(1:200)’ |
| Antibody | anti-mouse IgM (goat polyclonal) | Sigma-Aldrich | Cat# M8644; RRID:AB_260700 | ELISA ‘(2 μg/mL)’ |
| Antibody | anti-mouse IgM, κ isotype control antibody (mouse monoclonal) | BioLegend | Cat# 401602 | ELISA ‘(0,781–50 ng/mL)’ |
| Antibody | Alkaline phosphatase anti-mouse IgM, (goat polyclonal) | Sigma-Aldrich | Cat# A9688; RRID:AB_258472 | ELISA ‘(1:20000)’ |
| Antibody | anti-mouse CD16/32 (rat monoclonal) | BioLegend | Cat# 101320; RRID:AB_1574975 | FC ‘(1:50)’ |
| Sequence-based reagent | mouse Cxcr4 fwd | This study | PCR primers, Microsynth | TGCAGCAGGTAGCAGTGAAA |
| Sequence-based reagent | mouse Cxcr4 rev | This study | PCR primers, Microsynth | TGTATATACTCACACTGATCGGTCC |
| Sequence-based reagent | mouse Gapdh fwd | This study | PCR primers, Microsynth | GGTCGTATTGGGCGCCTGGTCACC |
| Sequence-based reagent | mouse Gapdh rev | This study | PCR primers, Microsynth | CACACCCATGACGAACATGGGGGC |
| Peptide, recombinant protein | Bovine serum albumin | Sigma-Aldrich | Cat# A8806 | |
| Peptide, recombinant protein | Protease Type XIV | Sigma-Aldrich | Cat# P5147 | |
| Commercial assay or kit | Mouse IL-6 ELISA | BioLegend | Cat# 431301 | |
| Commercial assay or kit | Mouse Cxcl1/KC DuoSet ELISA | R&D Systems | Cat# DY453 | |
| Commercial assay or kit | Mouse IL-1β ELISA | BioLegend | Cat# 432601 | |
| Commercial assay or kit | Mouse Ccl2/MCP-1 DuoSet ELISA | R&D Systems | Cat# DY479 | |
| Commercial assay or kit | Avidin/Biotin blocking kit | Vector Labs | Cat# SP-2001 | |
| Commercial assay or kit | Vectastain ABC kit | Vector Labs | Cat# PK-6100 | |
| Commercial assay or kit | DAB Subtrate kit | Vector Labs | Cat# SK-4100 | |
| Commercial assay or kit | RNeasy Plus micro kit | Gibco | Cat# 74034 | |
| Commercial assay or kit | iScript cDNA Synthesis kit | BioRad | Cat#170–8891 | |
| Commercial assay or kit | iTaq Universal SYBR Green Supermix | BioRad | Cat#172–5124 | |
| Commercial assay or kit | TECHNOTHROMBIN TGA Assay | Technoclone | Cat#5006010 | |
| Chemical compound, drug | Lipopolysaccharide purified from E. coli O55:B5 | Sigma-Aldrich | cat# L2880 | |
| Chemical compound, drug | Endotoxin-free PBS, pH 7.4 | Gibco | Cat# 11503387 | |
| Chemical compound, drug | Fixable Viability Dye eFluor 780 | ThermoFisher, eBioscience | Cat# 65-0865-14 | FC ‘(1:3000)’ |
| Chemical compound, drug | NaCl | Carl Roth | Cat# 0601.1 | |
| Chemical compound, drug | EDTA | Sigma-Aldrich | Cat# E5134 | |
| Chemical compound, drug | TRIS | VWR Chemicals | Cat# 28808.294 | |
| Chemical compound, drug | MgCl2 | Sigma Aldrich | cat# M8266 | |
| Chemical compound, drug | CaCl2 | Sigma Aldrich | cat# C3306 | |
| Chemical compound, drug | Triton X-100 | Sigma-Aldrich | cat# T9284 | |
| Chemical compound, drug | NH4Cl | Sigma-Aldrich | cat# 09718 | |
| Chemical compound, drug | KHCO3 | Carl Roth | cat# P748.1 | |
| Chemical compound, drug | Na2EDTA | Sigma-Aldrich | cat# 324503 | |
| Chemical compound, drug | RLT Plus Buffer | Qiagen | cat# 1053393 | |
| Chemical compound, drug | β-mercaptoethanol | Sigma-Aldrich | cat# M3148 | |
| Chemical compound, drug | Formalin 7.5% | SAV LP GmbH | cat# FN-60180-75-1 | |
| Chemical compound, drug | Citrate based antigen unmasking solution | Vector laboratories | cat# H3300 | |
| Chemical compound, drug | Eosin Y Solution | Sigma-Aldrich | cat# 318906 | |
| Chemical compound, drug | Hematoxylin solution (Mayer´s) | Sigma-Aldrich | Cat# MHS16 | |
| Chemical compound, drug | Mayer´s Hemalum solution | Merck | cat# 654833 | |
| Chemical compound, drug | Clodronate loaded liposomes | http://www.clodronateliposomes.org | cat# C-010 | |
| Chemical compound, drug | Protease inhibitor cocktail | Sigma-Aldrich | cat# P8340 | |
| Chemical compound, drug | RNase Inhibitor | Takara/Clonentech | cat# 2313 A | |
| Chemical compound, drug | Eukitt | Sigma-Aldrich | cat# 03989 | |
| Chemical compound, drug | Lumi Phos plus | Lumigen, Beckmann Coulter | cat# P-701 | |
| Chemical compound, drug | Antigen Unmasking Solution | Vector Labs | Cat# H3300-250 | |
| Software, algorithm | GraphPad Prism 9.1 | Graphpad Software, Inc. | https://www.graphpad.com | |
| Software, algorithm | FlowJo | Becton, Dickinson and Company | https://www.flowjo.com/ | |
| Software, algorithm | Bioconductor R package Genomic alignments | Lawrence et al., 2013 | ||
| Software, algorithm | DSeq2 | Love et al., 2014 | ||
| Software, algorithm | GOrilla | Eden et al., 2009 | ||
| Software, algorithm | ihw R package | Ignatiadis et al., 2016 | ||
| Software, algorithm | STAR aligner | Dobin et al., 2013 | ||
| Software, algorithm | Trimmomatic | Bolger et al., 2014 | ||
| Other | Columbia agar plates +5% sheep blood | Biomerieux | http://www.biomerieux-culturemedia.com/ | E. coli CFU counts |
| Other | Fetal Bovine Serum | Sigma | Cat# F9665 | Blocking and flow cytometry |
| Other | Goat Serum | Novus Biologicals | Cat# NBP2-23475 | Blocking |
Additional files
-
Supplementary file 1
DEG of blood neutrophils isolated from mice 2 weeks post NaCl or LPS treatment.
- https://cdn.elifesciences.org/articles/78291/elife-78291-supp1-v1.xlsx
-
Supplementary file 2
DEG of bone marrow neutrophils isolated from mice 2 weeks post NaCl or LPS treatment.
- https://cdn.elifesciences.org/articles/78291/elife-78291-supp2-v1.xlsx
-
MDAR checklist
- https://cdn.elifesciences.org/articles/78291/elife-78291-mdarchecklist1-v1.pdf
Download links
A two-part list of links to download the article, or parts of the article, in various formats.
Downloads (link to download the article as PDF)
Open citations (links to open the citations from this article in various online reference manager services)
Cite this article (links to download the citations from this article in formats compatible with various reference manager tools)
A neutrophil–B-cell axis impacts tissue damage control in a mouse model of intraabdominal bacterial infection via Cxcr4
eLife 11:e78291.
https://doi.org/10.7554/eLife.78291


