An amphipathic helix in Brl1 is required for nuclear pore complex biogenesis in S. cerevisiae
- Institute of Biochemistry, Department of Biology, ETH Zurich, Switzerland
- Department of Biochemistry, University of Zurich, Switzerland
- Department of Plant and Environmental Sciences, Weizmann Institute of Science, Israel
- Institute of Biochemistry and Molecular Cell Biology, Medical School, RWTH Aachen University, Germany
- Department of Biological Sciences, University of Bergen, Norway
Figures
Figure 1 with 1 supplement
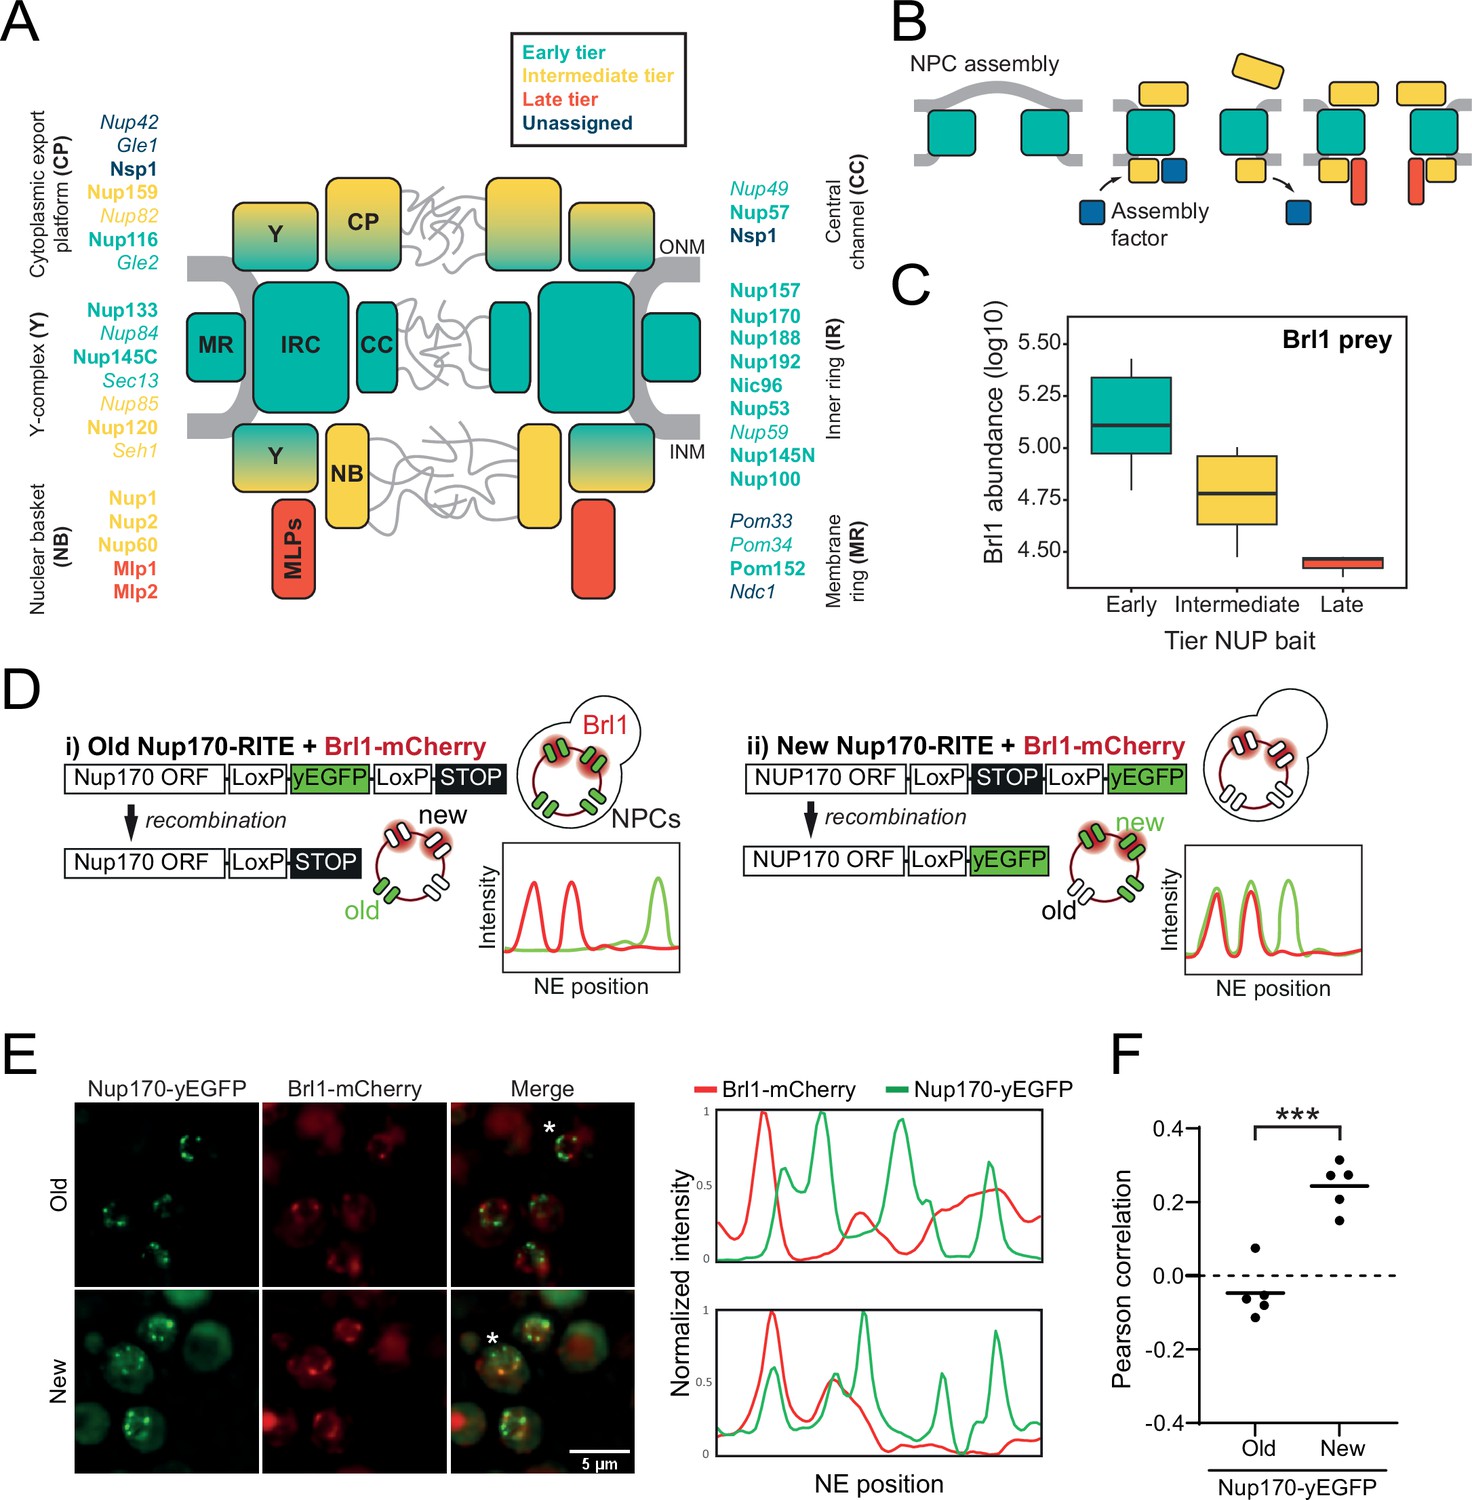
Brl1 preferentially binds young nuclear pore complexes (NPCs).
(A) Scheme of the NPC architecture. The colors indicate the assembly order as found in Onischenko et al., 2020. Nucleoporins (NUPs) that were reproducibly identified in Brl1 affinity purifications are shown in bold. (B) Schematic illustrating the transient binding of an NPC assembly factor during NPC assembly. (C) Enrichment of Brl1 in affinity pulldowns from Onischenko et al., 2020 using baits from the different assembly tiers. Early and intermediate tiers contain four different baits each; the late tier is represented by Mlp1 with three biological replicates for each bait. (D) Schematic representation of the recombination-induced tag exchange (RITE) strategy to visualize Brl1-mCherry co-localization with old or new NPCs marked by Nup170-yEGFP and the expected NE fluorescence intensity profiles. (E) Representative co-localization images of Brl1-mCherry with old or new Nup170-yEGFP marked NPCs using the RITE strategy described in (D). Cells were imaged ~30 min or ~5 hr after recombination induction, respectively. Fluorescence intensity profiles along the NE are displayed for cells denoted with an asterisk. (F) Pearson’s correlation between Nup170-yEGFP and Brl1-mCherry fluorescence intensity profiles along the NE in (E). Individual points reflect the average of a biological replicate with a minimum of 28 analyzed NE contours per condition. Two-tailed Student’s t-test (n = 5, p-value=0.00015).
-
Figure 1—source data 1
Label-free Brl1 intensities with 10 nucleoporin (NUP) baits from Onischenko et al., 2020; related to Figure 1C.
- https://cdn.elifesciences.org/articles/78385/elife-78385-fig1-data1-v2.xlsx
-
Figure 1—source data 2
Pearson’s correlation coefficients for Brl1-mCherry and new or old Nup170-yeGFP.
- https://cdn.elifesciences.org/articles/78385/elife-78385-fig1-data2-v2.xlsx
Figure 1—figure supplement 1
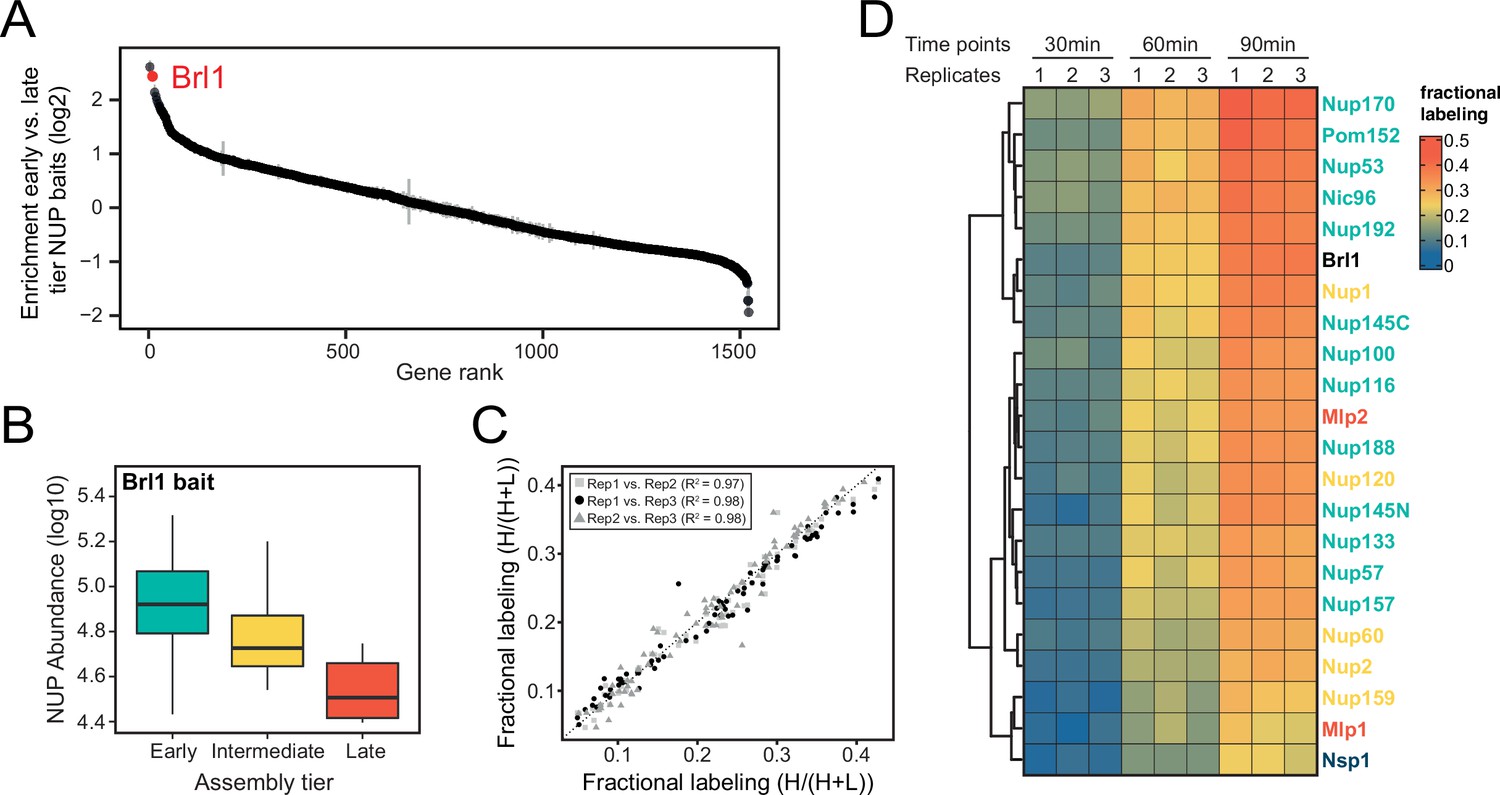
Proteomic characterization of Brl1 nuclear pore complex (NPC) interactions.
(A) All 1500 proteins co-purified in affinity pulldowns with 10 different nucleoporin (NUP) baits (Onischenko et al., 2020) were ranked by their fold enrichment difference between early and late tier baits. Mean ± SEM of three biological replicates. (B) Log10 abundance of NUPs belonging to the different assembly tiers in Brl1 affinity pulldowns (APs). Values for three biological replicates. (C) Reproducibility of the fractional labeling in KARMA (Kinetic Analysis of Incorporation Rates in Macromolecular Assemblies) assays with Brl1. Individual points correspond to the fractional labeling of a protein. (D) Heatmap showing the fractional labeling of NUPs in KARMA assays with Brl1 bait.
-
Figure 1—figure supplement 1—source data 1
Label-free nucleoporin/nuclear transport receptor (NUP/NTR) intensities with Brl1 bait (related to Figure 1—figure supplement 1B).
- https://cdn.elifesciences.org/articles/78385/elife-78385-fig1-figsupp1-data1-v2.xlsx
Figure 2
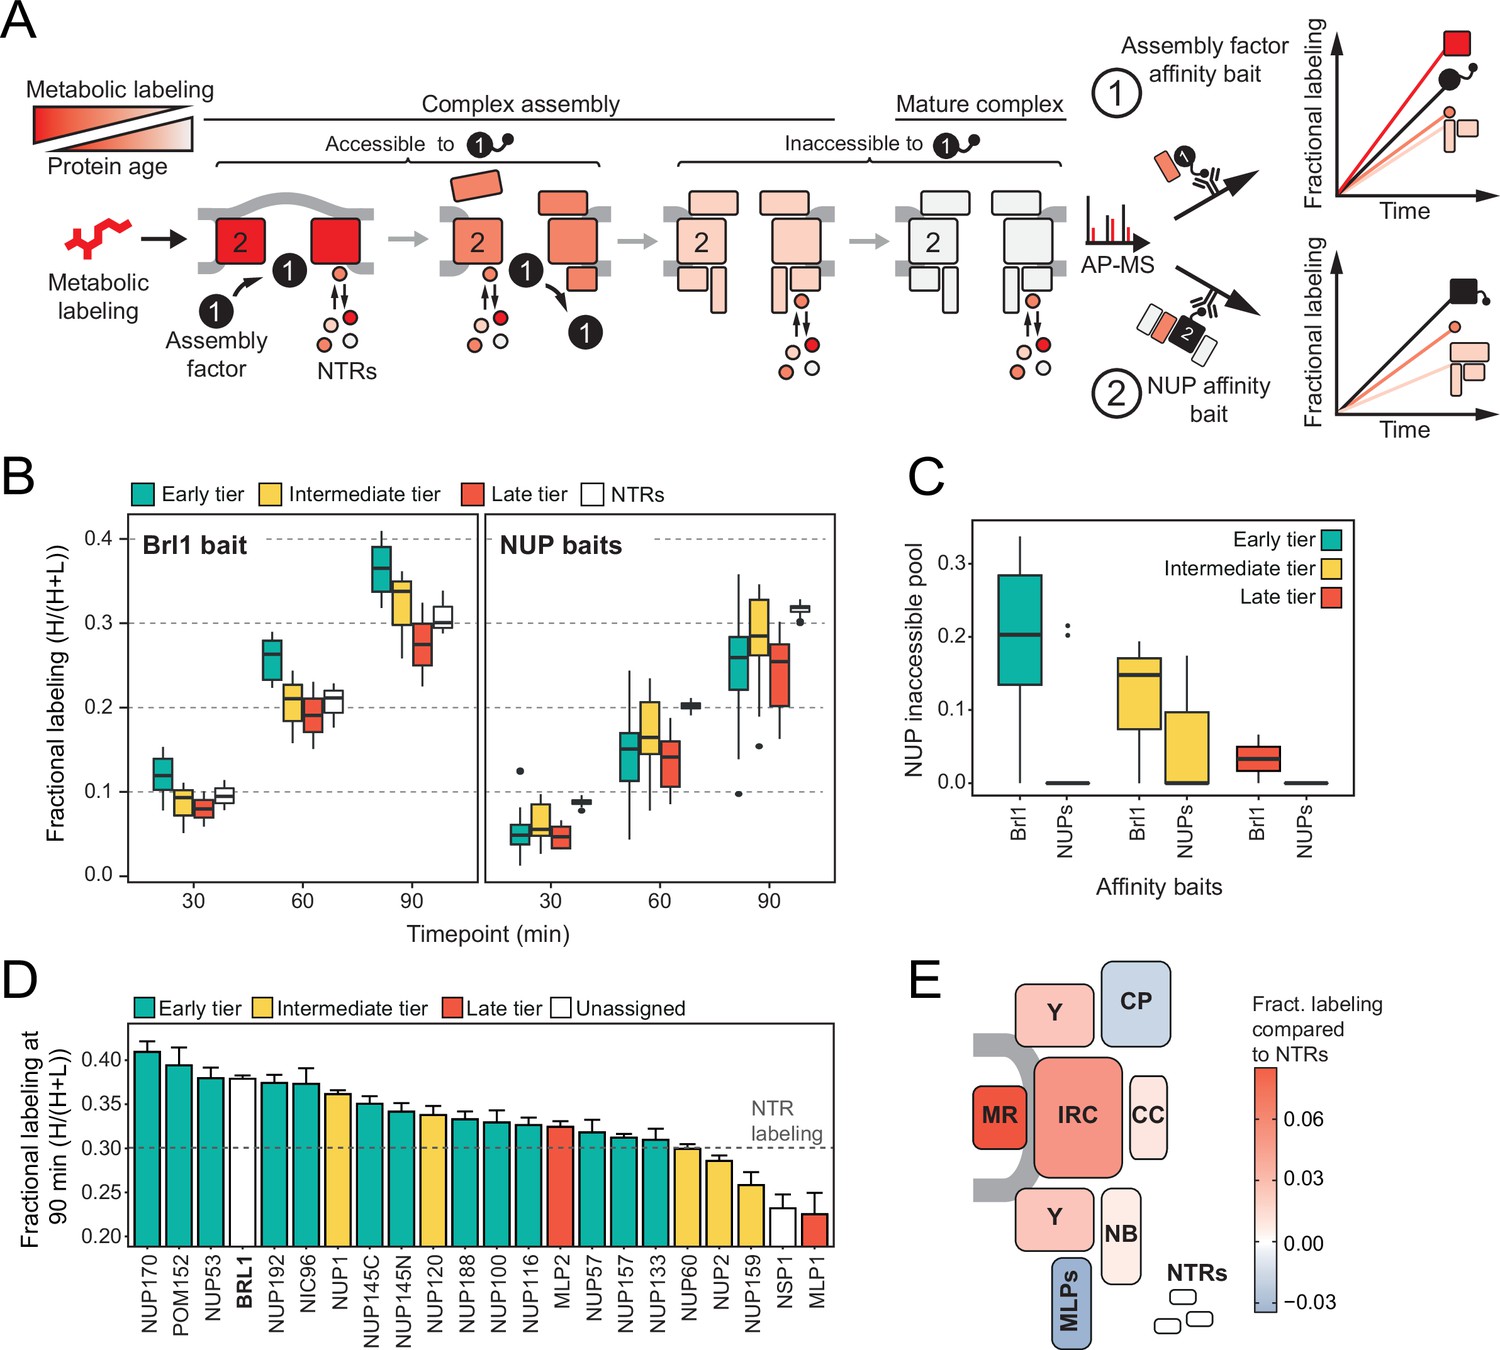
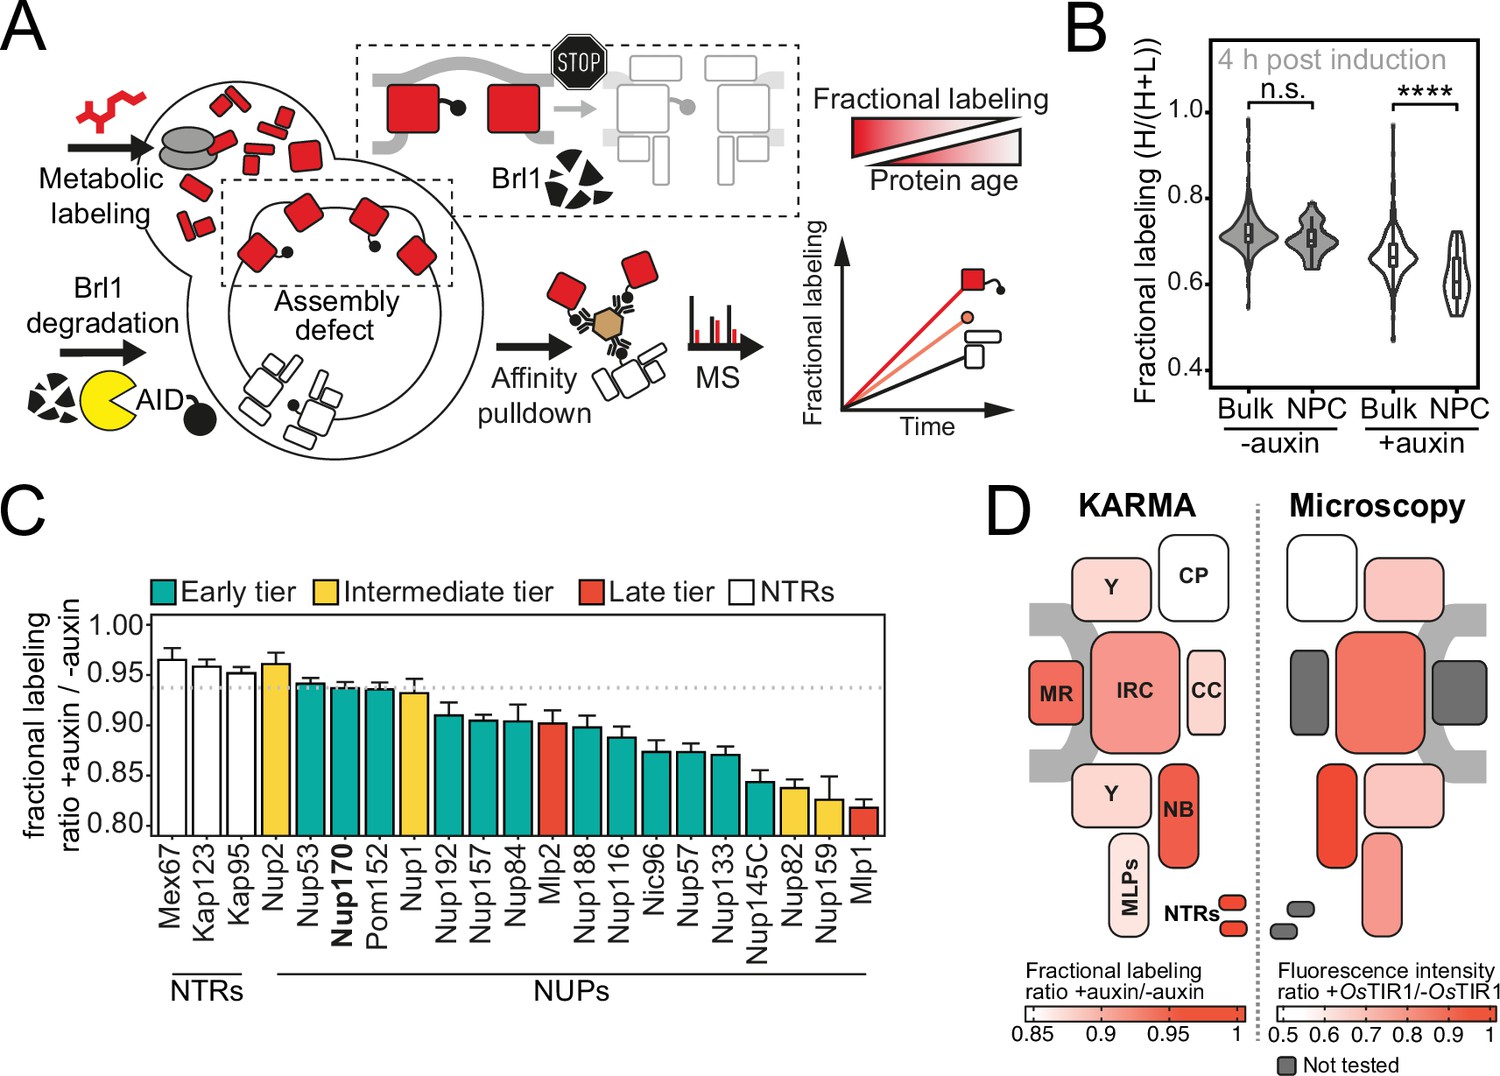
Mapping Brl1 association with nuclear pore complex (NPC) assembly intermediates using KARMA (Kinetic Analysis of Incorporation Rates in Macromolecular Assemblies).
(A) Principles of KARMA: newly synthesized proteins are pulse-labeled followed by the affinity purification of the nucleoporin (NUP) complexes through a tagged NPC-binding protein. The extent of metabolic labeling is then quantified by mass spectrometry and corresponds to the average protein age in the affinity-purified fraction. An assembly factor selectively binds young NPCs, thus leading to high metabolic labeling rates for NUPs present in the intermediates (1). This is not the case for proteins that join after the assembly factor completely or partially dissociates or when the process is probed with an NUP bait (2). (B) Comparison of the labeling rates for NUPs and nuclear transport receptors (NTRs) in KARMA assays with Brl1 bait (left, this study) and with 10 different NUP baits (right, Onischenko et al., 2020). Median of three biological replicates. (C) Inaccessible pool of NUPs in KARMA assays with Brl1 compared to NUP baits (Onischenko et al., 2020), evaluated using a three-state kinetic state model (KSM) (Onischenko et al., 2020). (D) Barplot depicting the extent of metabolic labeling for different NUPs in KARMA assays with Brl1 bait after 90 min. The dotted line indicates the median NTR labeling. Median ± SD of three biological replicates. (E) Fractional labeling values from 2D averaged for NPC subcomplexes and offset by NTR labeling projected onto the NPC scheme.
-
Figure 2—source data 1
Fractional labeling of nucleoporins/nuclear transport receptors (NUPs/NTRs) in Brl1 KARMA (Kinetic Analysis of Incorporation Rates in Macromolecular Assemblies) assays (related to Figure 2 and Figure 1—figure supplement 1).
- https://cdn.elifesciences.org/articles/78385/elife-78385-fig2-data1-v2.xlsx
-
Figure 2—source data 2
Inaccessible pools as estimated by the three-step kinetic state model (KSM) (Onischenko et al., 2020) for Brl1 and NUP baits (related to Figure 2C).
- https://cdn.elifesciences.org/articles/78385/elife-78385-fig2-data2-v2.xlsx
Figure 3 with 5 supplements
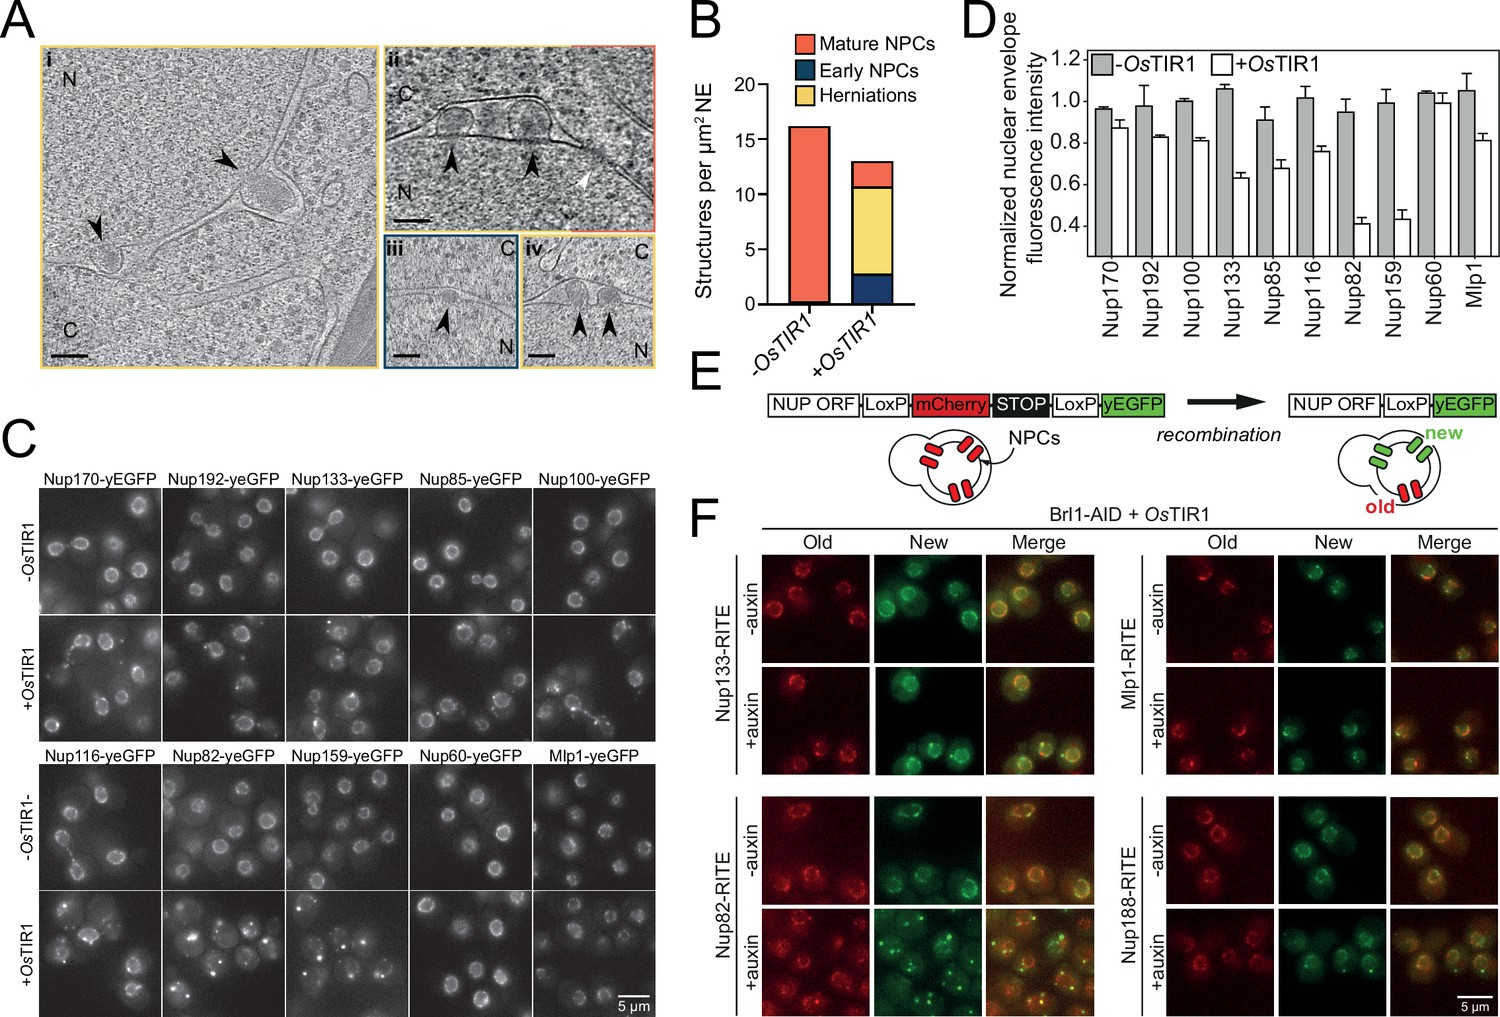
Brl1 degradation interferes with nuclear pore complex (NPC) assembly.
(A) Tomographic slices of focused ion beam (FIB)-milled, 4–4.5 hr auxin-treated Brl1-AID cells showing the structures quantified in (B). Image frames colored according to the color code used in (B). Scale bar 100 nm; black arrows: herniations; white arrow: NPC; N: nucleus; C: cytoplasm; slice thickness i and iii: 1.4 nm; ii and iv: 2.8 nm. Panels i and ii were cropped from tomographic slices from the tomograms in Figure 3—videos 1 and 2. (B) Quantification of 27 tomograms (8.5 µm2 NE) and 51 (16.7 µm2 NE) for -OsTIR1 and +OsTIR1, respectively. (C) Example fluorescent micrographs of yEGFP-tagged nucleoporins (NUPs) in 4–4.5 hr auxin-treated Brl1-AID ± OsTIR1 cells. (D) Normalized fluorescence intensity signal in the nuclear envelope in ±OsTIR1 Brl1-AID cells treated with 500 µM auxin for 4–4.5 hr. Mean ± SEM of a minimum of two biological replicates. (E) Recombination-induced tag exchange (RITE) method is combined with a CRE-EBD recombinase to conditionally switch fluorescence tags upon β-estradiol addition. (F) NUP RITE fusion protein localization in the Brl1-AID background 3 hr after treating cells with auxin (+auxin) or ethanol (-auxin). Recombination was induced 30 min prior to auxin addition.
Figure 3—figure supplement 1
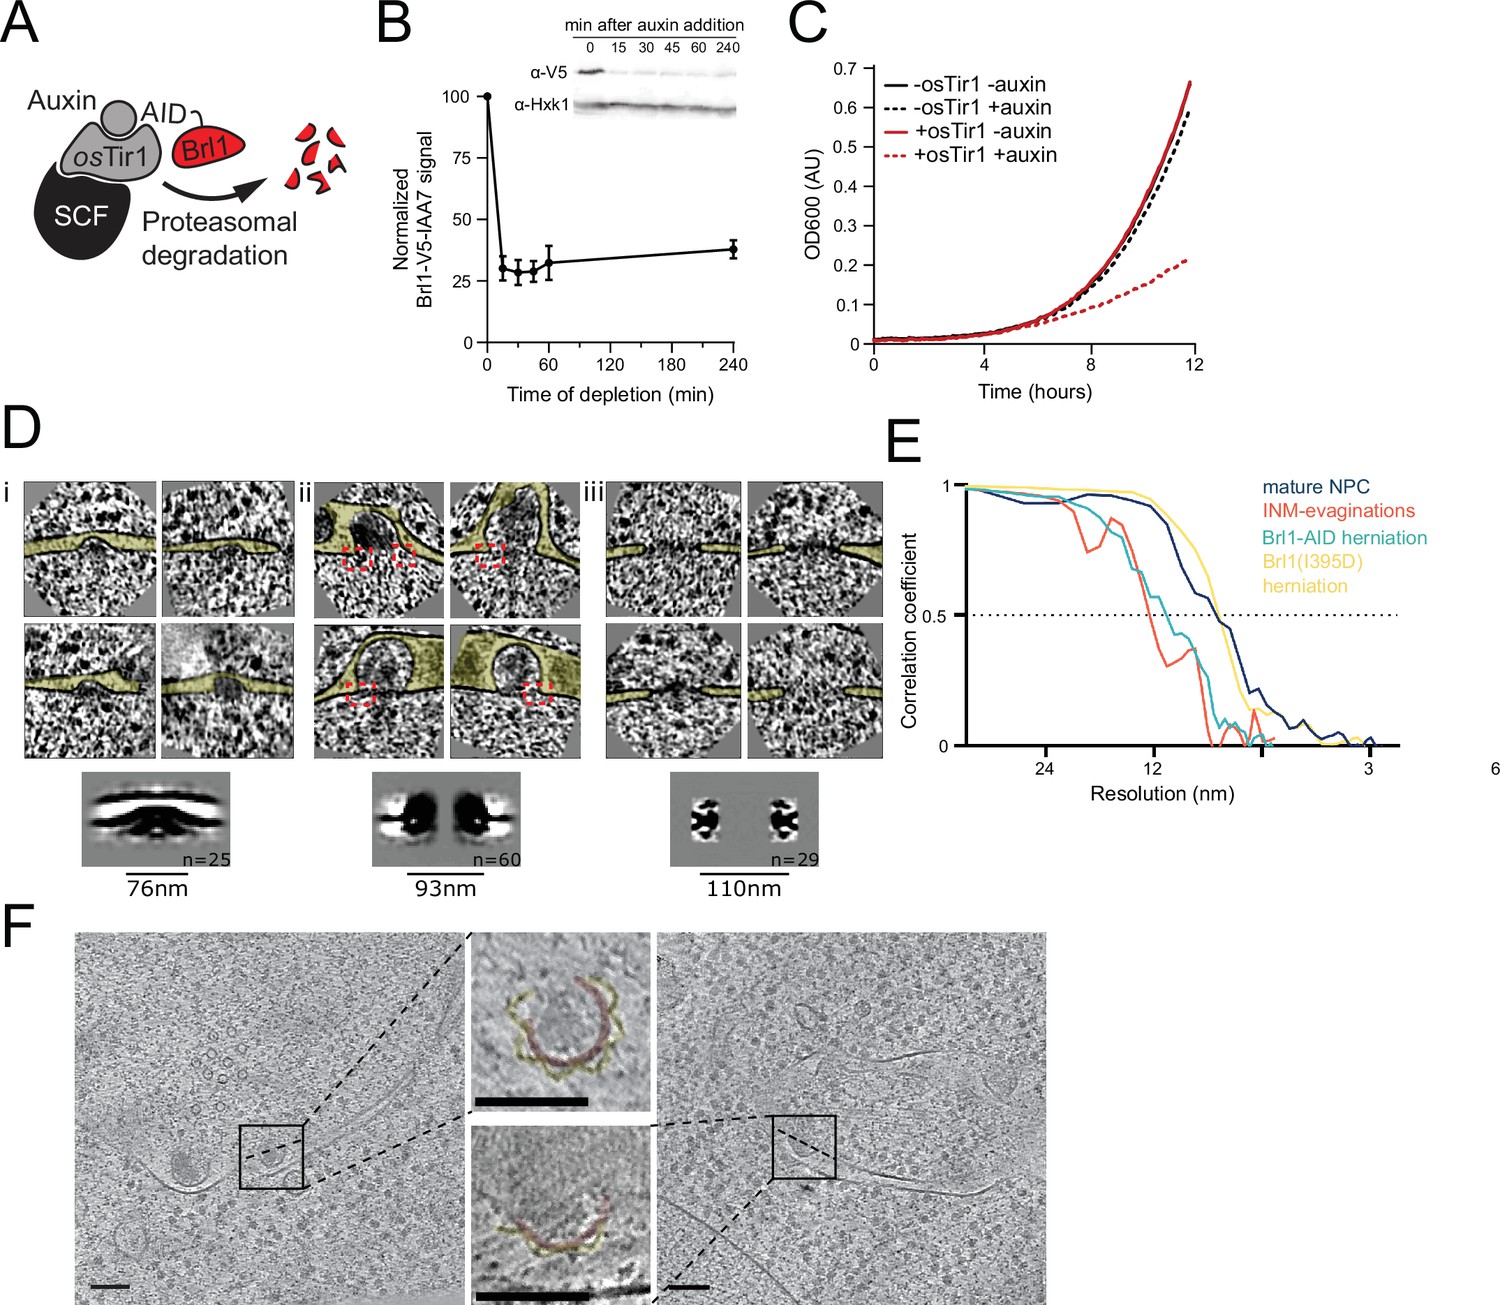
Characterization and subtomogram analysis of Brl1 depletion.
(A) Auxin-inducible degradation of Brl1 (Nishimura et al., 2009). Interaction between degron-tagged Brl1 and the E3 ubiquitin ligase SCF is mediated by the auxin-binding receptor OsTir1. (B) Depletion of Brl1-AID monitored by Western blotting. Brl1-V5-IAA7 was detected with an anti-V5 antibody, anti-hexokinase served as loading control. Mean ± SEM of three biological replicates. (C) Growth rate of Brl1-AID±OsTir1 cells incubated with 500 µM auxin or an equivalent amount of ethanol (-auxin). (D) Subtomograms and subtomogram averages of nuclear pore complexes (NPCs) and NPC-like structures in Brl1-depleted conditions; (i) inner nuclear membrane (INM) evaginations, (ii) nuclear envelope (NE) herniations, and (iii) mature NPCs. Diameter and number of particles are indicated. Cytoplasm is pointing up in all images. Box size of single herniations/NPCs is 270 nm. Red boxes indicate NPC-like densities at the neck of herniations. (E) Fourier shell correlation (FSC) curves for the subtomogram averages in D and Figure 7. FSC0.5 indicated as dotted line. (F) Tomographic slices of focused ion beam (FIB)-milled 4–4.5 hr auxin-treated Brl1-AID cells; slices through herniations show a luminal ring around the herniation, highlighted in yellow, NPC membrane in red; the rotation axis is indicated by a dashed line; scale bars: 100 nm; slice thickness: 1.4 nm.
-
Figure 3—figure supplement 1—source data 1
Uncropped Western blots (related to Figure 3—figure supplement 1B, Figure 5E and F).
- https://cdn.elifesciences.org/articles/78385/elife-78385-fig3-figsupp1-data1-v2.pdf
Figure 3—video 1
Sequential sections of a cryo-tomogram from Brl1-depleted cells.
The tomogram is 6× binned; pixel size: 2.1 nm; scale bar: 100 nm.
Figure 3—video 2
Sequential sections of a cryo-tomogram from Brl1- depleted cells.
The tomogram is 6x binned; pixelsize: 2.1nm; scalebar: 100nm.
Figure 3—video 3
Sequential sections of a cryo-tomogram from non-depleted Brl1 control cells.
The tomogram is 6× binned; pixel size: 2.1 nm; scale bar: 100 nm.
Figure 3—video 4
Sequential sections of a cryo-tomogram from non-depleted Brl1 control cells.
The tomogram is 6x binned; pixelsize: 2.1nm; scalebar: 100nm.
Figure 4 with 1 supplement
Proteomic characterization of nuclear pore complex (NPC) assembly intermediates induced by Brl1 depletion.
(A) Depiction of the metabolic labeling assays to examine NPC assembly effects that occur upon Brl1 degradation. Newly synthesized proteins are pulse-labeled simultaneously with the auxin-induced depletion of Brl1. Mature NPCs and assembly intermediates are purified via affinity-tagged Nup170. Newly made nucleoporins (NUPs) that depend on Brl1 for their incorporation cannot be purified with Nup170, thus diminishing the extent of their metabolic labeling in Nup170 affinity pulldown (AP) after Brl1 depletion. (B) Fractional labeling of bulk proteins compared to NUPs in KARMA (Kinetic Analysis of Incorporation Rates in Macromolecular Assemblies) assays with affinity-tagged Nup170 in Brl1-AID cells treated with auxin (+auxin) or ethanol (-auxin) for 4 hr. Data points correspond to the median values in three biological replicates. Two-tailed Student’s t-test (p-value: n.s. >0.05 and ****<0.0001). (C) Fractional labeling ratio of NUPs (bars) and bulk proteins (dotted line) in Nup170 APs from Brl1-AID cells treated with auxin (+auxin) or ethanol (-auxin). Mean ± SEM of three biological replicates and three time points (4, 4.5, and 5 hr post treatment, n = 9). Mlp1 and Mlp2 are missing in one replicate of the 4.5 time point (n = 8). (D) Left: fractional labeling ratios from (C) averaged per subcomplex and projected onto the NPC schematic. Right: nuclear envelope fluorescence intensity signal ratio from Figure 3D averaged for NPC subcomplexes and projected onto the NPC schematic.
-
Figure 4—source data 1
Fractional labeling in Brl1-AID Nup170 affinity pulldowns (APs) with and without auxin treatment (related to Figure 4).
- https://cdn.elifesciences.org/articles/78385/elife-78385-fig4-data1-v2.xlsx
Figure 4—figure supplement 1
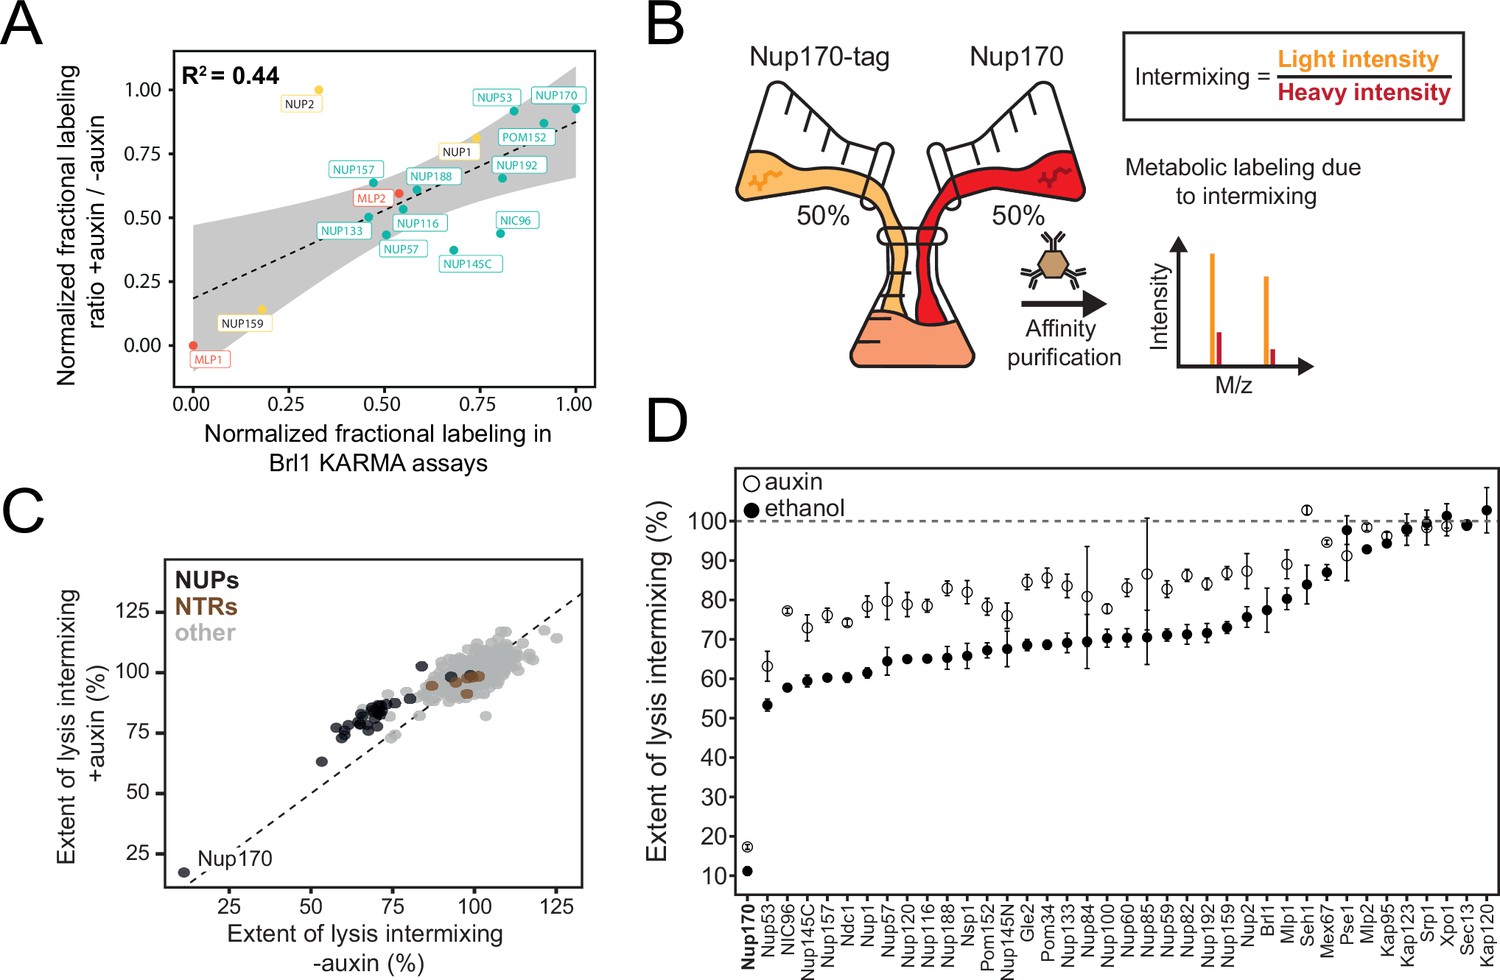
Exchange rates of nuclear pore complex (NPC) assembly intermediates in Brl1-depleted cells.
(A) Correlation between normalized nucleoporin (NUP) fractional labeling observed in Brl1 KARMA (Kinetic Analysis of Incorporation Rates in Macromolecular Assemblies) assays with the normalized fractional labeling ratios in Nup170 affinity pulldown (AP) from Brl1-AID cells with auxin or ethanol treatment. (B) Lysate intermixing assay to test the extent of dynamic exchange during the AP procedure. Brl1-AID cells are either treated with auxin or ethanol for 5 hr, then equal fractions of cell culture expressing tagged Nup170, grown in light lysine medium and wildtype culture grown in metabolic labeled medium were subjected to the AP procedure. (C) Intermixing of NUPs (black) and nuclear transport receptors (NTRs) (brown) along with other co-purified proteins (gray) with auxin (+auxin) or ethanol (-auxin) treatment. Values are normalized to the mean intermixing of all co-purified non-NUP proteins in a sample (=100%). Median of three biological replicates. (D) Intermixing extent for NUPs and NTRs in Nup170 APs in Brl1-AID cells treated with auxin (white) or ethanol (black). Normalized as in Figure 3C. Median ± SD of three biological replicates.
-
Figure 4—figure supplement 1—source data 1
Fractional labeling in the lysis intermixing tests for Nup170 bait (related to Figure 4—figure supplement 1).
- https://cdn.elifesciences.org/articles/78385/elife-78385-fig4-figsupp1-data1-v2.xlsx
Figure 5 with 2 supplements
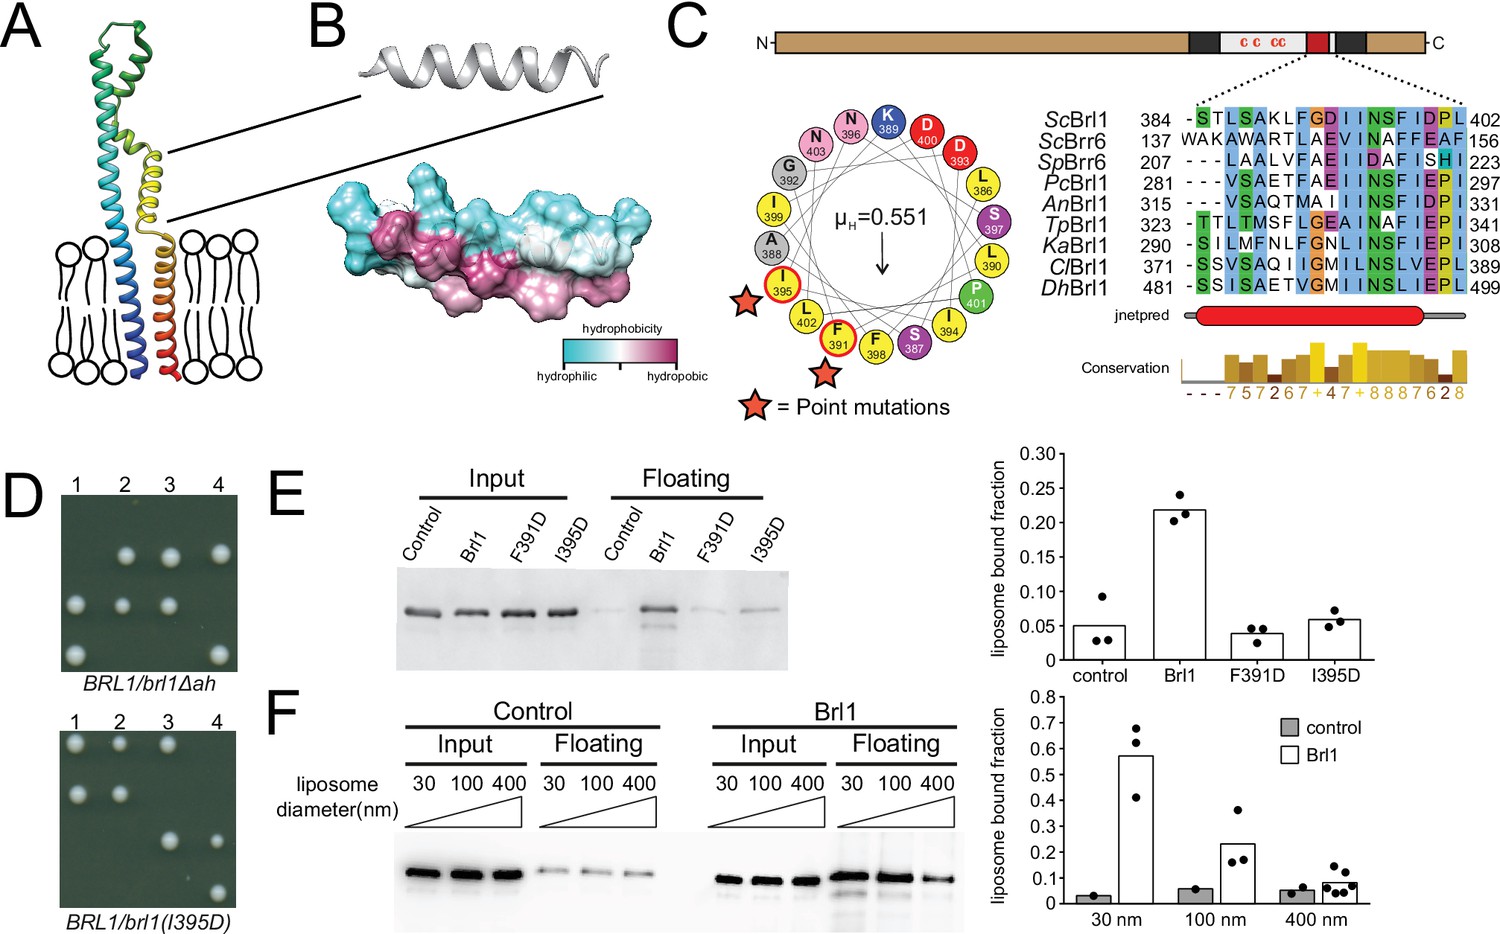
A conserved luminal amphipathic helix binds to membranes and is essential for Brl1 function.
(A) AlphaFold prediction for Brl1 (Jumper et al., 2021). Unstructured termini are not shown; blue: N-terminus; red: C-terminus. Transmembrane domain highlighted by the lipid bilayer. (B) Predicted amphipathic helix in ribbon and surface representation, colored based on hydrophobicity. (C) Upper panel: domain architecture of Brl1: extraluminal N- and C-terminus in brown, transmembrane domains in dark gray, amphipathic helix in red; left panel: helical wheel representation of the amphipathic helix of Brl1 and the hydrophobic moment determined with HeliQuest (Gautier et al., 2008). Point mutants are indicated by stars. Right panel: conservation and secondary structure prediction of the amphipathic helix in different fungi (full alignment in Figure 5—figure supplement 2A and B). Hydrophobic: blue; negative: magenta; polar: green; glycine: orange; proline: yellow; unconserved: white. Jnetpred4 secondary structure prediction (Drozdetskiy et al., 2015): helices are marked as red tubes. Sc: Saccharomyces cerevisiae; Sp: Schizosaccharomyces pombe; Pc: Pneumocystis carinii; An: Aspergillus nidulans; Tp: Tetrapisispora phaffii; Ka: Kazachstania africana; Cl: Clavispora lusitaniae; Dh: Debaryomyces hansenii. (D) Vertically oriented tetrad offspring of heterozygous Brl1 mutants carrying one allele lacking the amphipathic helix (brl1Δah) or a single-point mutation in the hydrophobic side of the helix (brl1(I395D)). (E) Membrane flotation assay with purified MBP-ahBrl1(377-406)-yEGFP fusion proteins and liposomes made of E. coli polar lipids extract. Control: MBP-yeGFP. Mean of three biological replicates, individual data points are indicated. (F) Membrane flotation assay with purified MBP-ahBrl1(377-406)-yEGFP fusion using liposomes of different sizes. Control: MBP-yeGFP. Mean of three or six biological replicates for MBP-ahBrl1(377-406)-yEGFP, individual data points are indicated.
Figure 5—figure supplement 1
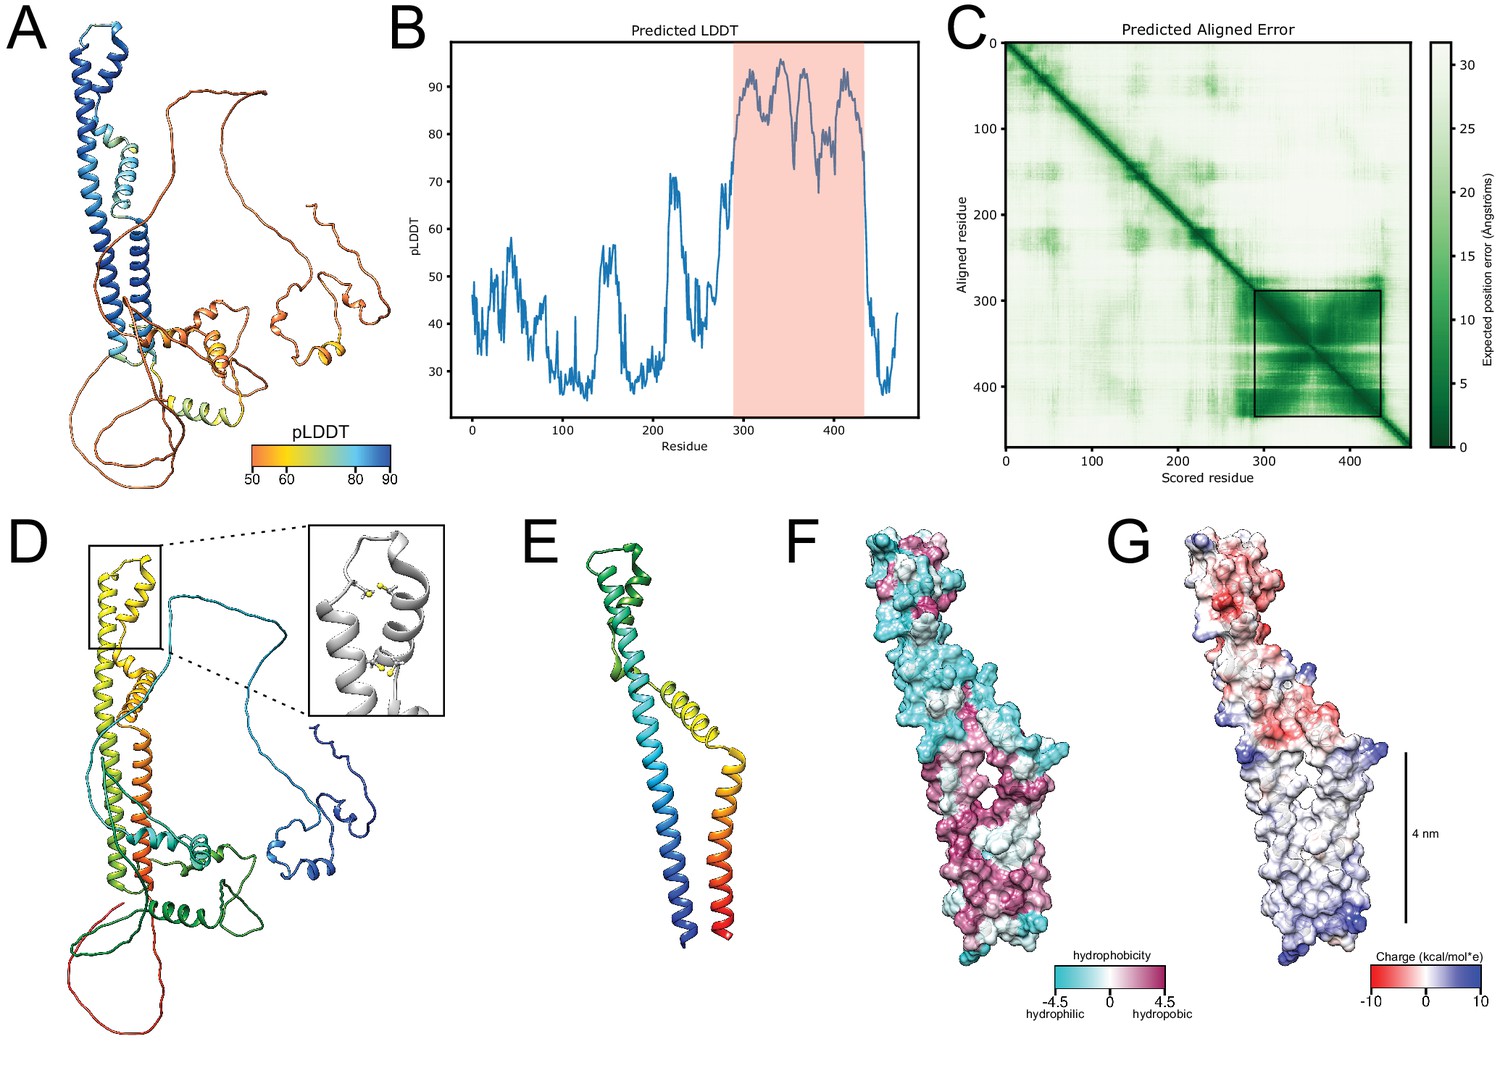
AlphaFold structure prediction for Brl1.
(A) Predicted structure for full-length Brl1 using AlphaFold2, colored based on the predicted local distance difference test score (pLDDT). (B) pLDDT score for Brl1. High-confidence region shown in (E-G) and Figure 5 indicated by the red area. (C) Predicted aligned error for Brl1, dark green area indicates high inter-domain accuracy. High-accuracy region shown in (E-G) and Figure 5 is highlighted by the black frame. (D) Predicted structure for Brl1, colored in rainbow (red: C-terminus; blue: N-terminus); inset shows the position of the four cysteines in the luminal domain of Brl1. (E) Predicted structure for high-confidence region Brl1(289-434) in rainbow coloring (red: C-terminus; blue: N-terminus). (F, G) Surface representation of Brl1(289-434), colored by hydrophobicity (Kyte–Doolittle scale) (F) and charge (G).
Figure 5—figure supplement 2
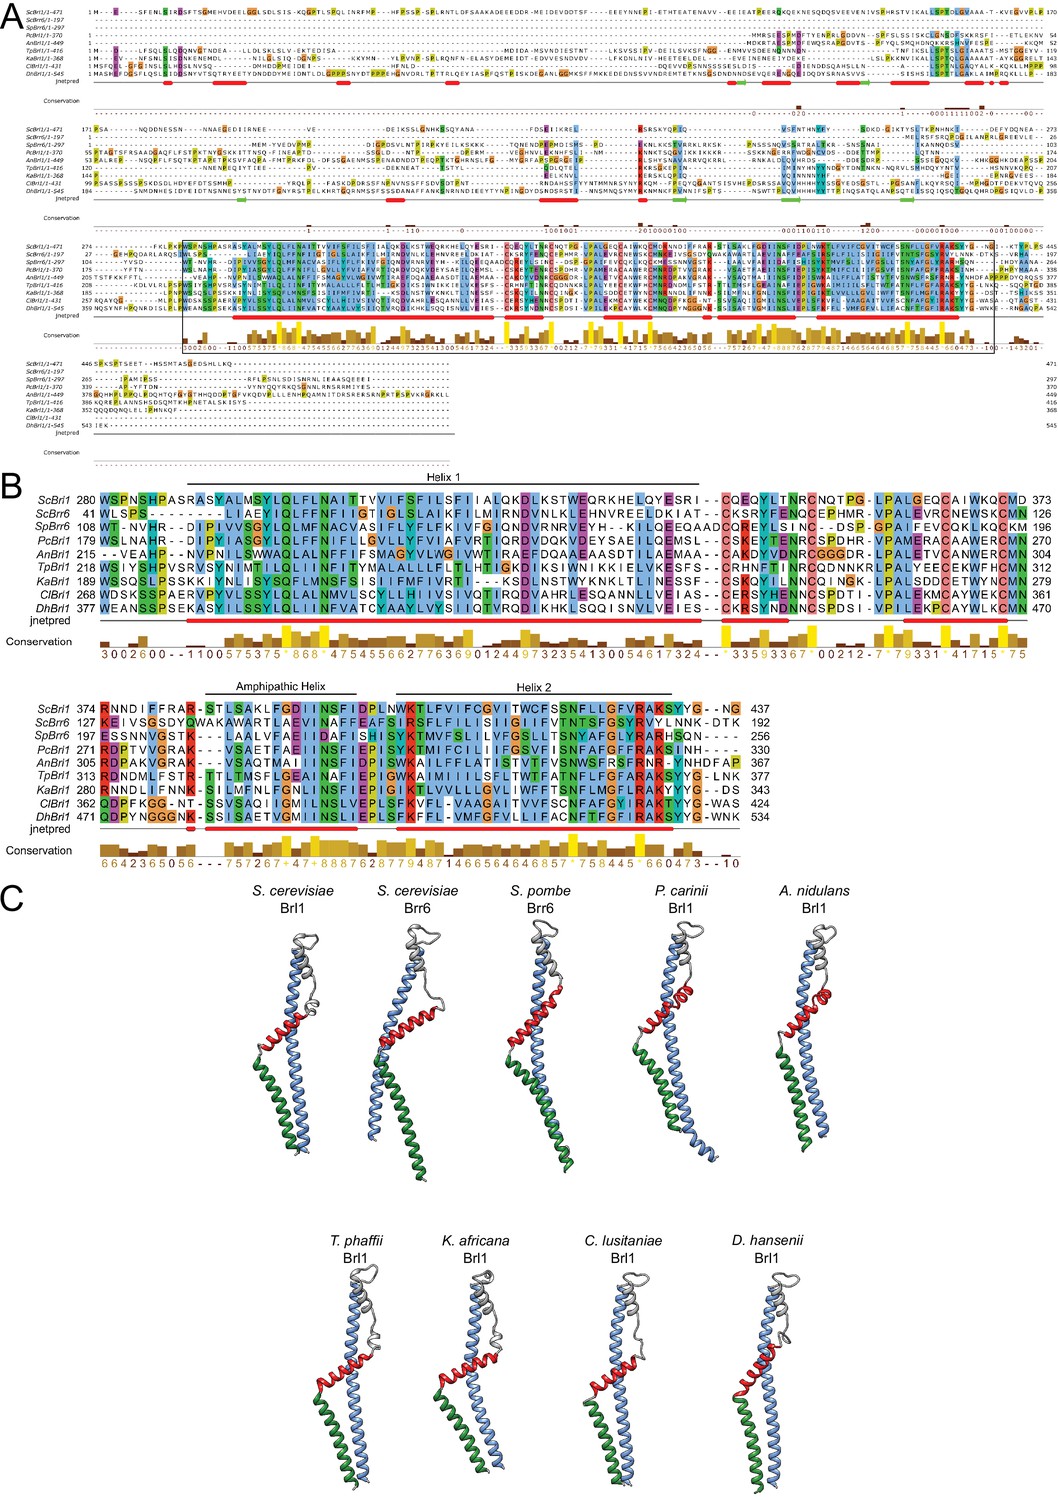
Conservation and structure prediction of Brl1 homologues in different fungi.
(A) Sequence alignment of full-length Brl1 homologues, black box indicates the zoom-in in panel. (B) Hydrophobic: blue, negative: magenta, red: positive polar: green, glycine: orange, proline: yellow, unconserved: white. Jnetpred4 secondary structure prediction (Drozdetskiy et al., 2015): helices are marked as red tubes. Sc: Saccharomyces cerevisiae; Sp: Schizosaccharomyces pombe; Pc: Pneumocystis carinii; An: Aspergillus nidulans; Tp: Tetrapisispora phaffii; Ka: Kazachstania africana; Cl: Clavispora lusitaniae; Dh: Debaryomyces hansenii. (C) AlphaFold structure prediction for Brl1 homologues. The mostly unstructured N- and C-termini were removed for clarity. Blue: helix 1; red: amphipathic helix; green: helix 2 (regions also indicated in panel B).
Figure 6 with 1 supplement

Overexpression of Brl1(I395D) with an impaired amphipathic helix interferes with nuclear pore complex (NPC) assembly.
(A) Spotting assay of wildtype cells expressing Brl1, Brl1Δah, or Brl1(I395D) from the GAL1 promoter in glucose or galactose-containing medium. (B) Localization of yEGFP-tagged Brl1, Brl1Δah, or Brl1(I395D) from the GAL1 promoter in SD 2% galactose. Brightness contrast settings of nuclei in insets are adjusted differently. (C) Fluorescence recovery after photobleaching of Sec61-yEGFP, Brl1-mCherry and Brl1(I395D)-mCherry. Left panels: representative images of recovery; right: corresponding averaged recovery curves (n > 4). One representative experiment of three biological replicates is shown. Images are shown in pseudocolor. (D) Co-localization of mCherry-tagged Brl1 or Brl1(I395D) and yEGFP-tagged NUPs: mCherry channel is scaled differently between images. Maximum intensity plots of nucleoporins (NUPs) (green lines) relative to maximum Brl1(I395D)-mCherry signal in nuclear envelope (NE) foci (red line) from cytoplasm (bottom) to nucleoplasm (top). The arrows in the inset and the x-axis indicate the direction of measurement. Average and standard deviation of more than 38 line plots with n > 31 values averaged for each point. A representative image used for the analysis is shown for each condition in the inset.
-
Figure 6—source code 1
Fluorescence recovery after photobleaching (FRAP) analysis.
- https://cdn.elifesciences.org/articles/78385/elife-78385-fig6-code1-v2.zip
-
Figure 6—source data 1
Line plots.
- https://cdn.elifesciences.org/articles/78385/elife-78385-fig6-data1-v2.xlsx
Figure 6—figure supplement 1
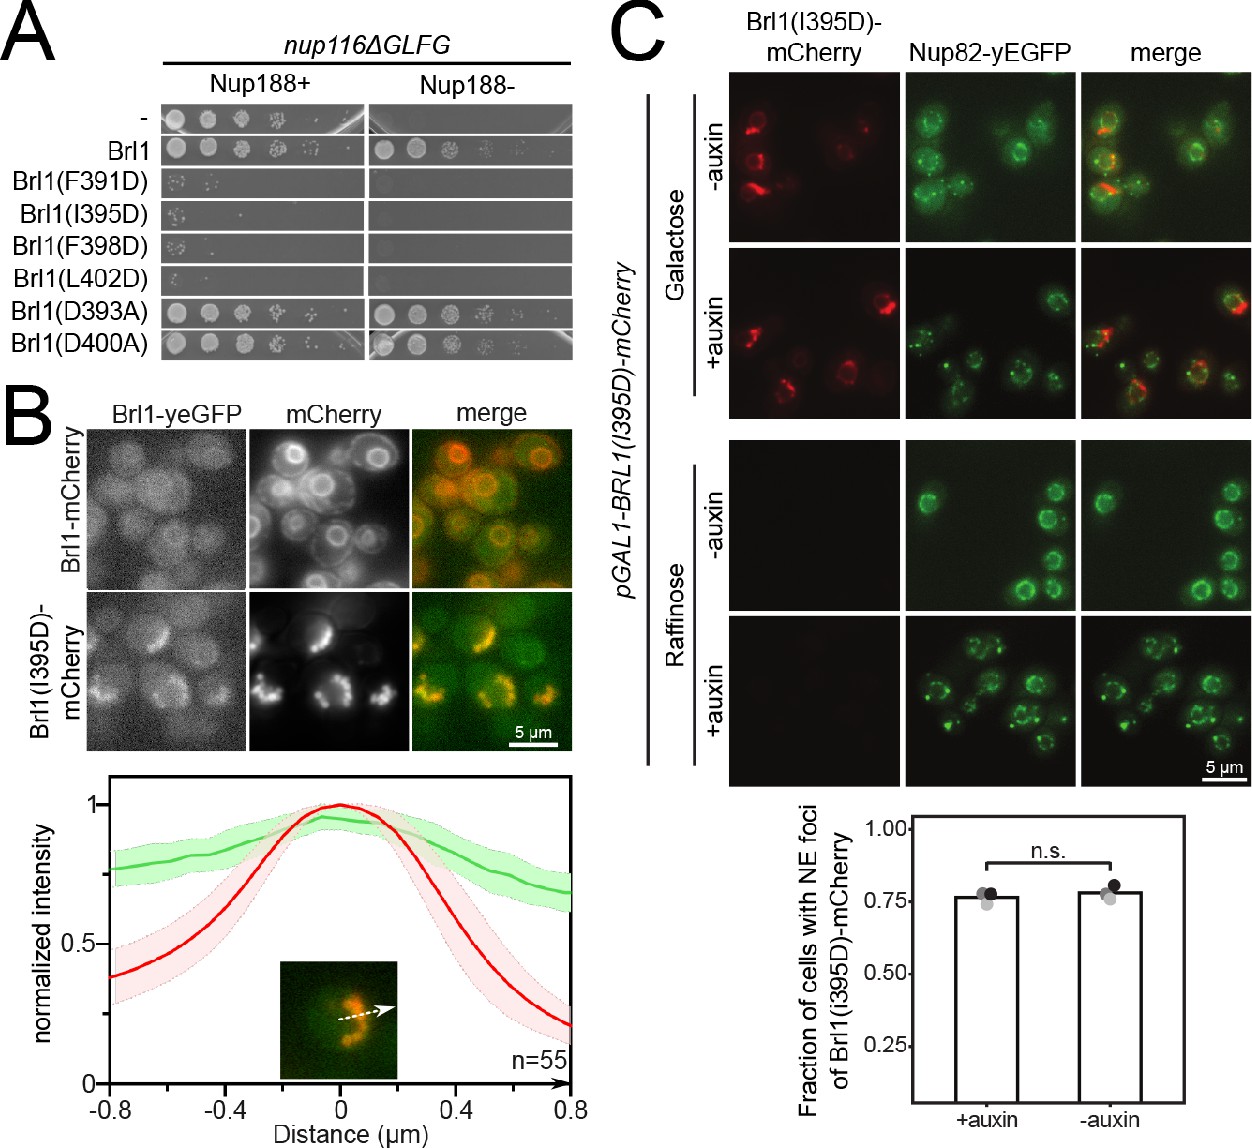
Luminal amphipathic helix (AH) of Brl1 is involved in nuclear pore complex (NPC) biogenesis.
(A) Spotting assay of fivefold serial dilutions of nup116ΔGLFG PMET3-NUP188 cells expressing various ahBrl1 domain mutants from the GAL1 promoter. (B) Co-localization of mCherry-tagged Brl1 or Brl1(I395D) expressed from a galactose-inducible promoter with endogenously tagged Brl1-yEGFP. Lower panel: maximum intensity plots of Brl1 (green line) relative to maximum Brl1(I395D)-mCherry signal in nuclear envelope (NE) foci (red line) from nucleoplasm (left) to cytoplasm (right). Average and standard deviation for 55 line plots, every point is an average of n > 30 values. A representative image used for analysis is shown in the inset. The arrows in the inset and the x-axis indicate the direction of measurement. (C) Brl1(I395D)-mCherry under the control of a galactose promoter was overexpressed by switching cells to a medium containing 2% galactose simultaneously with the auxin-induced degradation of endogenous Brl1 (+auxin) or the treatment with ethanol (-auxin). Cells were imaged 6 hr after induction. Lower panel: quantification of the fraction of cells with at least one NE focus of Brl1(I395D) in cells overexpressing Brl1(I395D)-mCherry. Three biological replicates (points) with a minimum of 637 cells per replicate and their mean (bar) are shown. Two-tailed Student’s t-test (n = 3, p-value = n.s.).
Figure 7 with 4 supplements
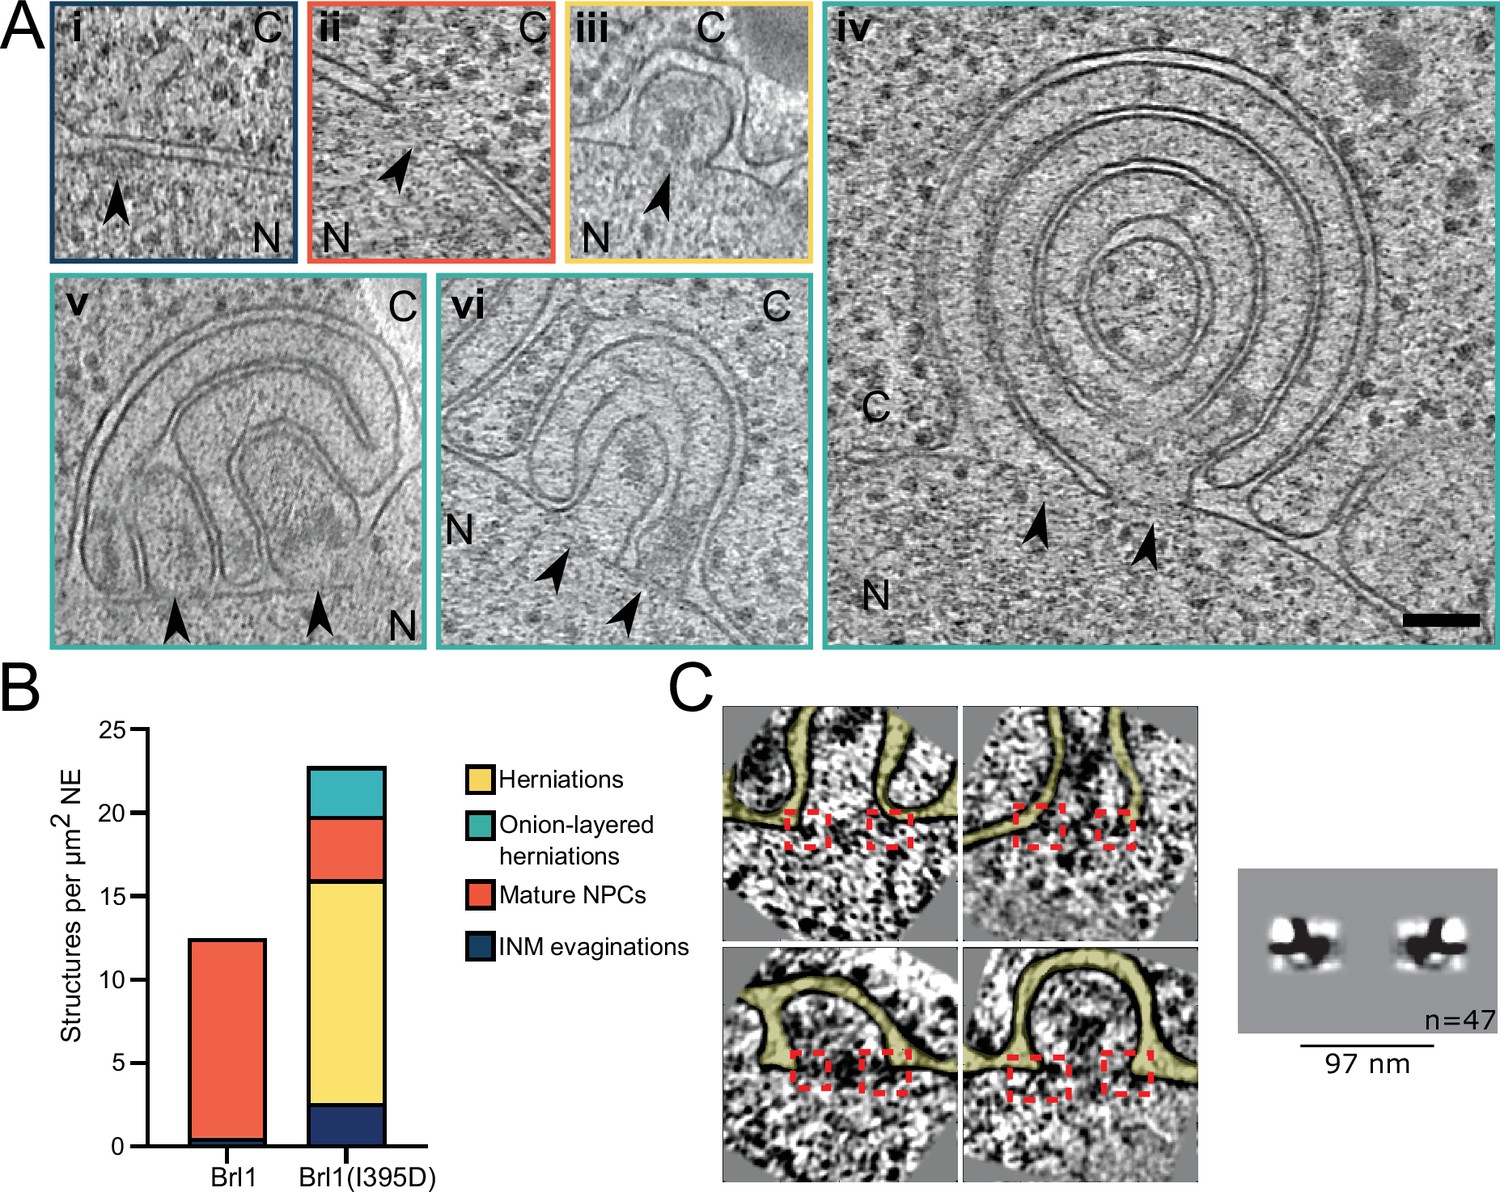
Brl1(I395D) overexpression leads to the formation of multilayered nuclear envelope (NE) herniations.
(A) Tomographic slices of the nuclear pore complex (NPC)-like structures quantified in (B), observed in focused ion beam (FIB)-milled cells overexpressing Brl1(I395D), scale bar: 100 nm. N: nucleus, C: cytoplasm, slice thickness: 2.1 nm, arrows indicate NPC-like structures. Image frames colored according to the color code used in (B). Panels iv and vi are tomographic slices from the tomogram in Figure 7—video 1. (B) Quantification of observed structures in Brl1(I395D) cells and control condition; 17 (5.1 µm2 NE) and 50 (9.8 µm2 NE) tomograms were quantified for cells overexpressing Brl1 or Brl1(I395D), respectively. (C) Single subtomograms and the subtomogram average of 47 herniations in Brl1(I395D) overexpressing cells; box size of subtomograms is 270 nm; cytoplasm is at the top in each image. Red boxes indicate NPC-like densities at the neck of herniations.
Figure 7—video 1
Sequential sections of a cryo-tomogram from Brl1(I395D)-overexpressing cells.
The tomogram is 6× binned; pixel size: 2.1 nm; scale bar: 100 nm.
Figure 7—video 2
Sequential sections of a cryo-tomogram from Brl1(I395D)-overexpressing cells.
The tomogram is 6x binned; pixelsize: 2.1nm; scalebar: 100nm.
Figure 7—video 3
Sequential sections of a cryo-tomogram from Brl1-overexpressing cells.
The tomogram is 6× binned; pixel size: 2.1 nm; scale bar: 100 nm.
Figure 7—video 4
Sequential sections of a cryo-tomogram from Brl1-overexpressing cells.
The tomogram is 6x binned; pixelsize: 2.1nm; scalebar: 100nm.
Figure 8
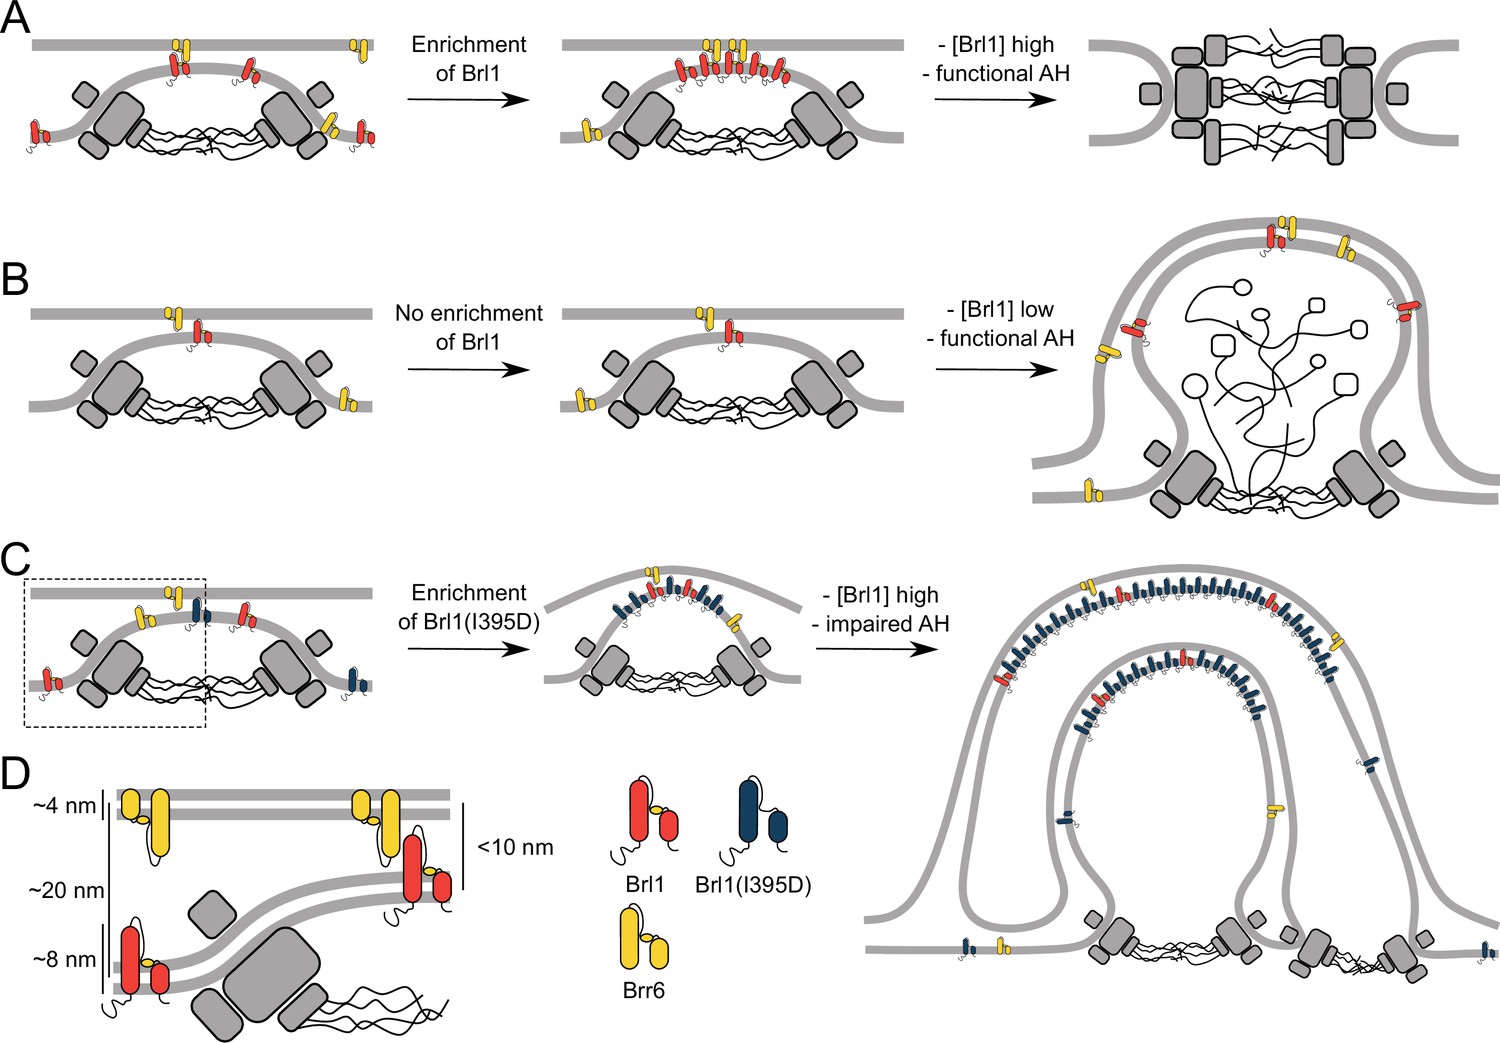
The role of Brl1 during nuclear pore complex (NPC) assembly.
(A) Brl1 (red) enriches on the inside of NPC maturation intermediates and promotes inner nuclear membrane–outer nuclear membrane (INM-ONM) fusion through the membrane-binding amphipathic helix (AH) motif and likely in cooperation with Brr6 (yellow). (B) If Brl1 cannot reach the critical concentration required to promote membrane fusion, unresolved nuclear envelope (NE) herniations, filled with electron-dense material, appear. (C) Overexpressed Brl1(I395D) with a perturbed AH (blue) concentrates at the NPC assembly site. It remodels the NE membranes and leads to expanded multilayered herniations but ultimately fails to induce membrane fusion. (D) Brl1 at the INM can only physically interact with Brr6 or Brl1 at the ONM when the NE leaflets approach as it is the case at NPC assembly sites. Dimensions based on our cryo-electron tomography (cryo-ET) data (Figure 3—figure supplement 1D), structure prediction (Figure 5—figure supplement 1), and measurements of the NE (Appendix 1—figure 2B).
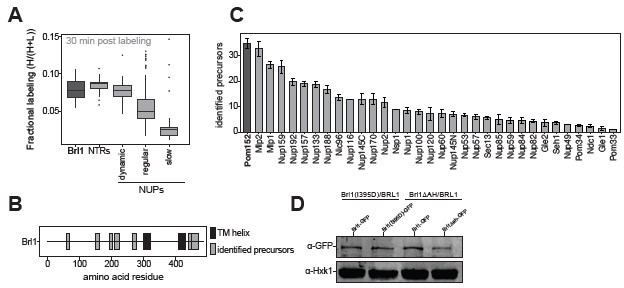
Appendix 1—figure 1
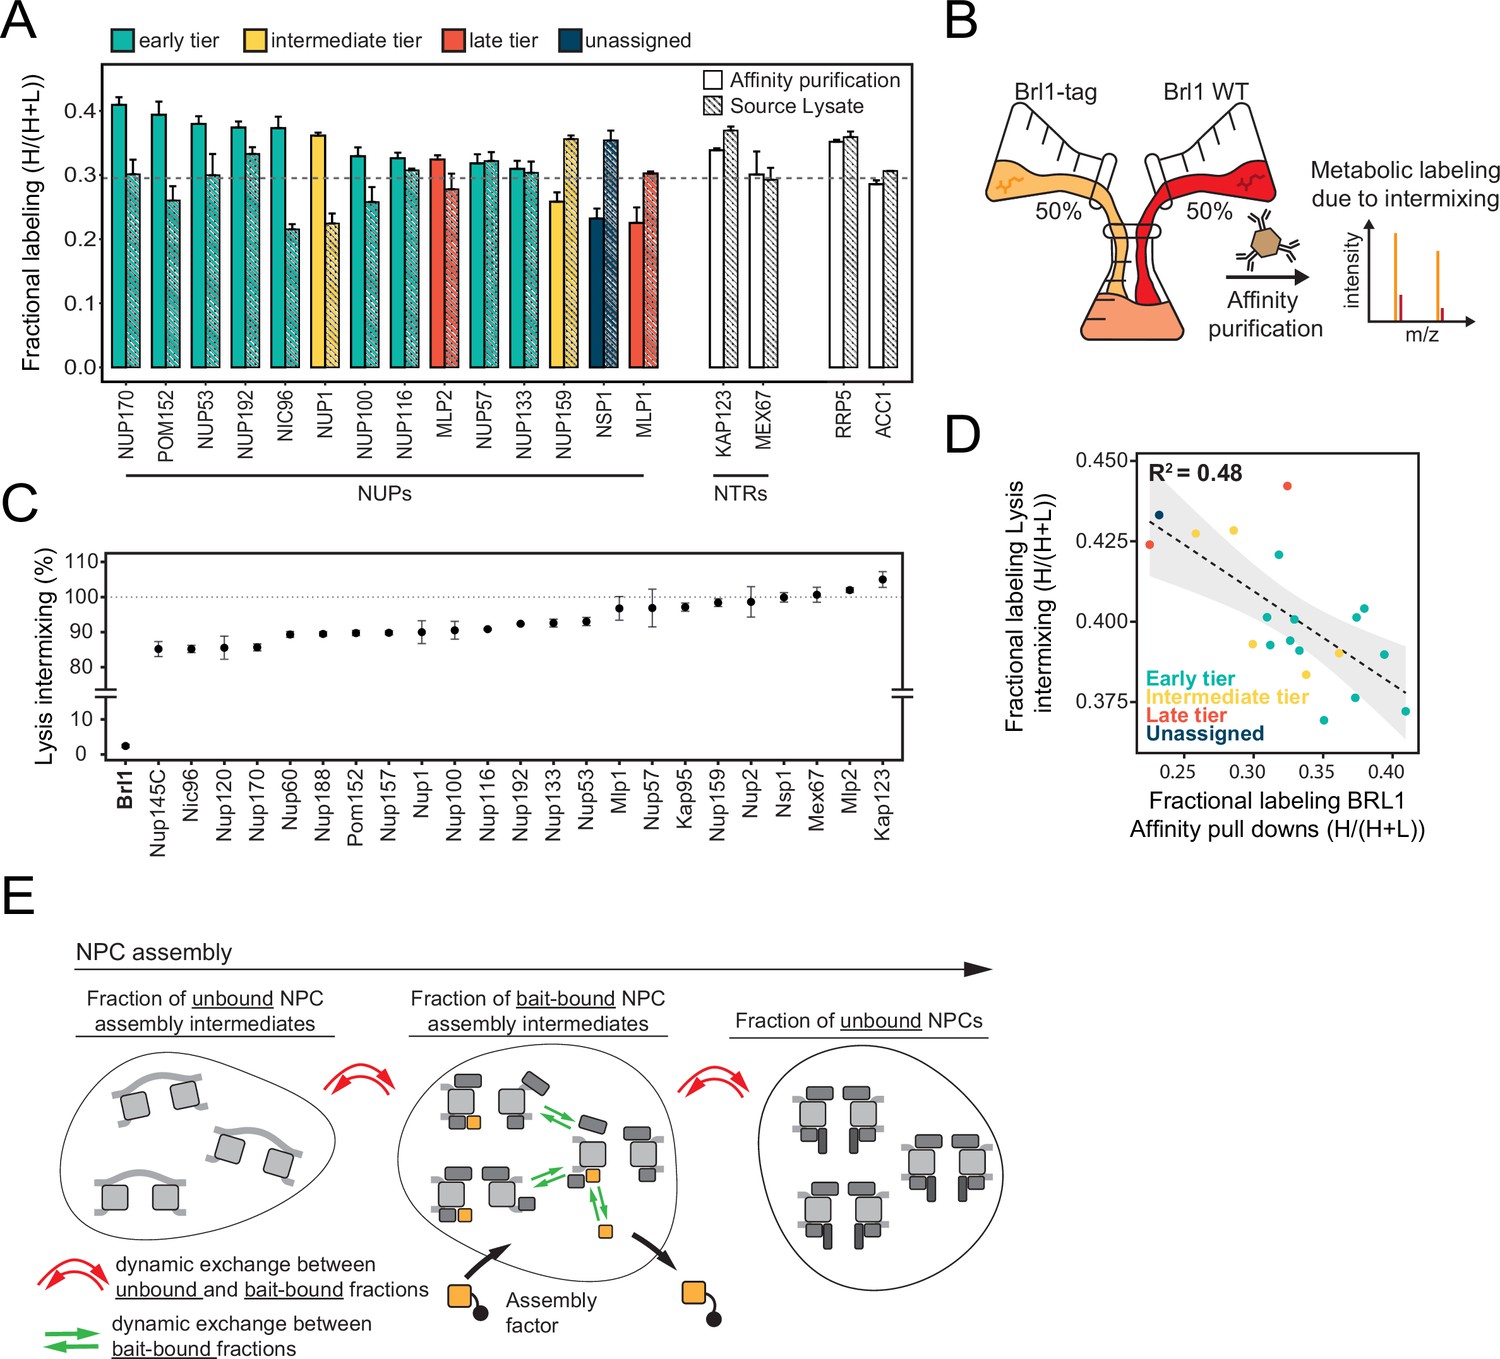
Control of protein labeling in KARMA (Kinetic Analysis of Incorporation Rates in Macromolecular Assemblies) assays.
(A) Fractional labeling of nucleoporins (NUPs) and nuclear transport receptors (NTRs) in KARMA assays with Brl1 bait and the respective source lysate, 90 min after labeling onset. Median ± SD of three biological replicates. (B) Experiment to test the intermixing dynamics. Equal fractions of an unlabeled Brl1 affinity-tagged strain and a wildtype culture grown in metabolically labeled medium were subjected to the affinity purification procedure. (C) Percentage of intermixing for NUPs and NTRs normalized to the mean of all co-purified proteins with Brl1 bait. Median ± SD of three biological replicates. (D) Correlation of NUPs between fractional labeling in the intermixing experiment and in KARMA assay with Brl1 bait. Coloring according to the assembly tier. Median of three biological replicates each. (E) During complex assembly, proteins can dynamically exchange within the bait-bound fraction (green arrows) or between the bait-bound and unbound fractions (red arrows). The metabolic labeling in KARMA assays is only sensitive to dynamic exchange between bait-bound fractions and unbound fractions, whereas in the lysate intermixing assays both forms of exchange contribute to the observed labeling.
-
Appendix 1—figure 1—source data 1
Fractional labeling in the source lysate (parallel reaction monitoring [PRM] assay, related to Appendix 1—figure 1A).
- https://cdn.elifesciences.org/articles/78385/elife-78385-app1-fig1-data1-v2.xlsx
-
Appendix 1—figure 1—source data 2
Fractional labeling in the lysis intermixing tests with Brl1 bait (related to Appendix 1—figure 1B–D).
- https://cdn.elifesciences.org/articles/78385/elife-78385-app1-fig1-data2-v2.xlsx
Appendix 1—figure 2
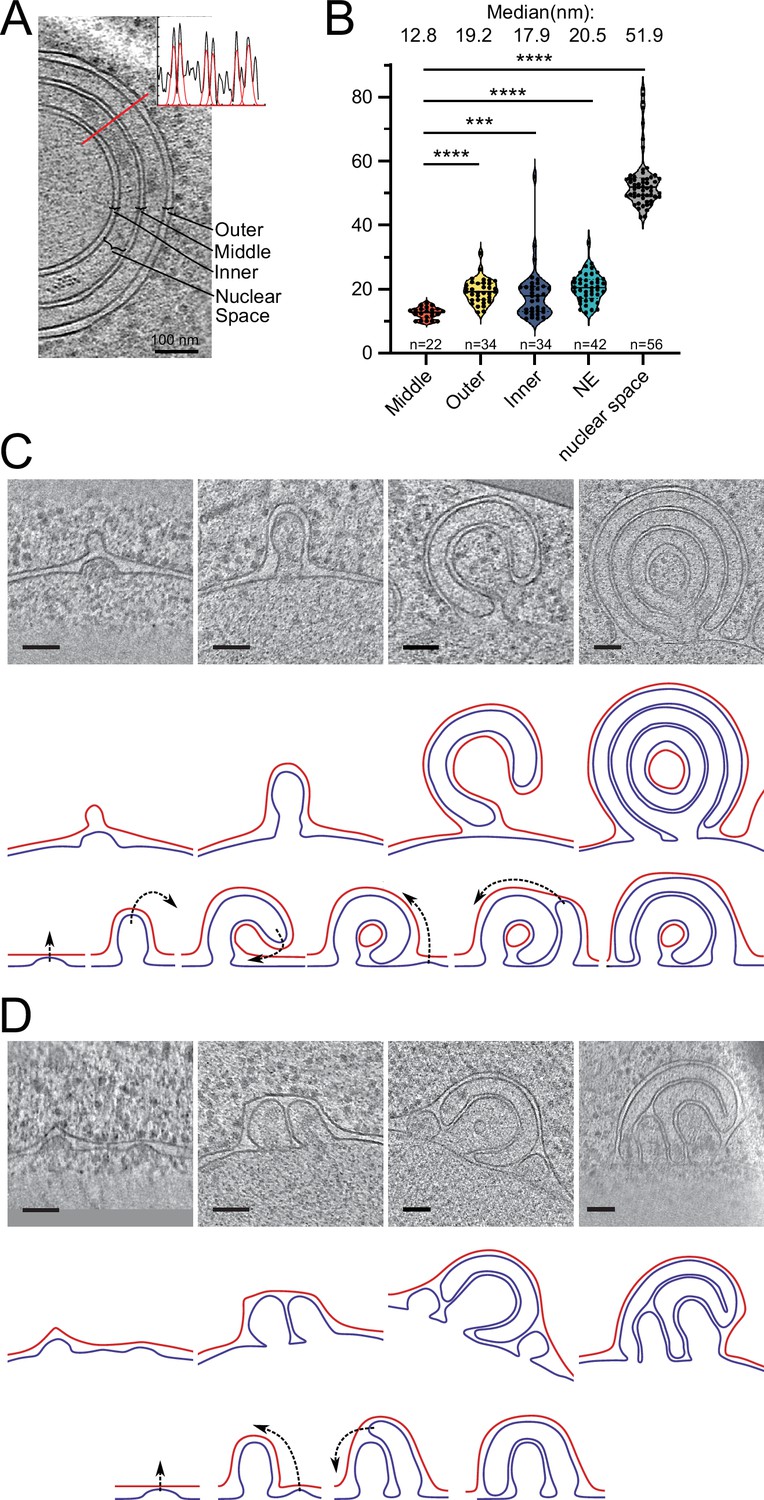
Potential maturation processes of onion-like herniations.
(A) Tomographic slice of an onion-like herniation and an example line plot with fitted Gaussians measured at the indicated red line. Brackets indicate how the distances were classified for the plot in B. (B) Violin plot with individual points of membrane–membrane distances. Mann–Whitney test, ****p-value<0.0001; ***p-value=0.0001. (C) Mode 1 for maturation of onion-like herniations. Top panel: tomographic slices of several stages of herniations in Brl1(I395D) overexpressing cells (nucleus always in the bottom); middle panel: membrane segmentation of the herniations of the upper panel. Inner nuclear membrane (INM): blue; outer nuclear membrane (ONM): red; ONM in the center of the very right panel was classified as ONM based on the presence of ribosomes and wider membrane spacing. Lower panel: schematic of how the onion-like herniations mature. (D) Same as (C) but for mode 2 of the maturation process of onion-like herniations. Scale bar: 100 nm. Slice thickness: 1.4 nm.
-
Appendix 1—figure 2—source data 1
Distance measurements.
- https://cdn.elifesciences.org/articles/78385/elife-78385-app1-fig2-data1-v2.xlsx
Author response image 1
Tables
Key resources table
| Reagent type (species) or resource | Designation | Source or reference | Identifiers | Additional information |
|---|---|---|---|---|
| Chemical compound, drug | IP6 | Sigma-Aldrich | P5681 | AID experiments |
| Chemical compound, drug | Auxin | Sigma-Aldrich | I2886 | AID experiments |
| Chemical compound, drug | β-Estradiol | Sigma-Aldrich | E8875 | RITE experiments |
| Chemical compound, drug | Hygromycin B | Roche | 10843555001 | RITE experiments |
| Chemical compound, drug | Concanavalin A (ConA) | Sigma-Aldrich | C2010 | Fluorescence microscopy |
| Chemical compound, drug | IPTG | AppliChem | A10080025 | Protein expression |
| Chemical compound, drug | Protease inhibitor cocktail | Sigma-Aldrich | P8215 | MS assays |
| Chemical compound, drug | Purified IgG protein from rabbit serum | Sigma-Aldrich | I5006 | MS assays |
| Chemical compound, drug | Coomassie Brilliant Blue R-250 | Bio-Rad | 161-0400 | MS assays |
| Chemical compound, drug | Sequencing grade porcine trypsin | Promega | V5113 | MS assays |
| Chemical compound, drug | L-Lysine:2HCL (13C6, 99%; 15N2, 99%) | Cambridge Isotope Laboratories | CNLM-291-H-0.25 | MS assays |
| Chemical compound, drug | Iodoacetamide | Sigma-Aldrich | I1149 | MS assays |
| Chemical compound, drug | Ammonium bicarbonate | Sigma-Aldrich | 09832 | MS assays |
| Chemical compound, drug | Formic acid 99–100% | VWR Chemicals | 20318.297 | MS assays |
| Chemical compound, drug | iRT Kit | Biognosis | Ki-3002-1 | MS assays |
| Chemical compound, drug | BioPureSPN MINI Columns Silica C18 | The Nest Group, Inc | HUM S18V | MS assays |
| Chemical compound, drug | BioPureSPN MACRO Columns Silica C18 | The Nest Group, Inc | HMM S18V | MS assays |
| Peptide, recombinant protein | DNase I | Roche | 10104159001 | Protein purification |
| Chemical compound, drug | cOmplete Protease Inhibitor Cocktail | Roche | 05053489001 | Protein purification |
| Other | Ni-NTA Agarose | QIAGEN | 30210 | Protein purification |
| Antibody | α-V5 (mouse monoclonal) | Invitrogen | R960-25 | Western blotting, 1:2000 |
| Antibody | α-Hexokinase (rabbit monoclonal) | US Biologicals | H2035-01 | Western blotting, 1:3000 |
| Antibody | α-Mouse IgG Alexa Fluor 680 (goat polyclonal) | Thermo Fisher Scientific | A-21057 | Western blotting, 1:10,000 |
| Antibody | α-Rabbit IgG IRDye800CW (goat polyclonal) | Li-COR Biosciences | 926-32211 | Western blotting, 1:10,000 |
| Antibody | α-EGFP (mouse monoclonal) | Roche | 11814460001 | Liposome experiments, 1:2000 |
| Antibody | α-Mouse IgG peroxidase conjugate (goat polyclonal) | Calbiochem | 401215 | Liposome experiments, 1:5000 |
| Other | Zymolyase 100T | ICN | 320932 | Tetrad dissection |
| Other | E. coli polar lipids | Avanti Polar Lipids | 100600C | Liposome experiments |
| Other | 18:1 Liss Rhodamine PE | Avanti Polar Lipids | 810150C | Liposome experiments |
| Software, algorithm | NuRim | Rajoo et al., 2018; Vallotton et al., 2019 | Data analysis | |
| Software, algorithm | ImageJ/Fiji | Schindelin et al., 2012 | Data acquisition | |
| Software, algorithm | NIS Elements | Nikon | Data acquisition | |
| Software, algorithm | MATLAB | MathWorks | Data analysis | |
| Software, algorithm | IMOD | https://bio3d.colorado.edu/imod/ | Data analysis | |
| Software, algorithm | SerialEM | Mastronarde, 2003 | Data acquisition | |
| Software, algorithm | UCSF Chimera | Pettersen et al., 2004 | Data visualization | |
| Software, algorithm | SBGrid | Morin et al., 2013 | Data processing | |
| Software, algorithm | TOM toolbox | Nickell et al., 2005; Förster et al., 2005, https://www.biochem.mpg.de/6348566/tom_e | Data processing | |
| Software, algorithm | AlphaFold2.1.1 | Jumper et al., 2021 | Data analysis | |
| Software, algorithm | AlphaFold visualization | https://colab.research.google.com/drive/1CizC7zmYvFkav5qfBbWxhgUHrOxwym2w | Data analysis | |
| Software, algorithm | COBALT | https://www.ncbi.nlm.nih.gov/tools/cobalt/re_cobalt.cgi | Sequence alignment | |
| Software, algorithm | Jalview | Waterhouse et al., 2009 | Sequence alignment | |
| Software, algorithm | Excel | Microsoft | Data analysis | |
| Software, algorithm | R v. 4.1.2 | R Project | Data analysis | |
| Software, algorithm | Prism 7 Prism 9 | GraphPad | Visualization | |
| Software, algorithm | Inkscape 1.1 | https://inkscape.org/ | Visualization | |
| Software, algorithm | Illustrator v. 26.0.3 | Adobe | Visualization |
Table 1
Plasmids used in this study.
| ID | Description | Details | Source |
|---|---|---|---|
| pKW4689 | pRS306-pGAL1-yEGFP | Integration in ura3 locus, expression of yEGFP | This study |
| pKW4558 | pRS306-pGAL1-ahBrl1-yEGFP | Integration in ura3 locus, expression of ahBrl1-yEGFP | This study |
| pKW4578 | pRS306-pGAL1-MRATSK | Integration in ura3 locus, overexpression of small peptide MRATSK | This study |
| pKW4568 | pRS306-pGAL1-BRL1 | Integration in ura3 locus, overexpression of Brl1 | This study |
| pKW4649 | pRS306-pGAL1-BRL1-yEGFP | Integration in ura3 locus, overexpression of Brl1-yEGFP | This study |
| pKW4651 | pRS306-pGAL1-BRL1Δah-yEGFP | Integration in ura3 locus, overexpression of BRL1Δah-yEGFP | This study |
| pKW4712 | pRS306-pGAL1-BRL1(I395D)-yEGFP | Integration in ura3 locus, overexpression of Brl1(I395D)-yEGFP | This study |
| pKW589 | pRS305 | Integration in leu2 locus | Sikorski and Hieter, 1989 |
| pKW4915 | pRS305-pGAL1-BRL1-mCherry | Integration in leu2 locus, overexpression of Brl1-mCherry | This study |
| pKW4919 | pRS305-pGAL1-BRL1(I395D)-mCherry | Integration in leu2 locus, overexpression of Brl1(I395D)-mCherry | This study |
| pKW1358 | Ylplac204-pTPI1-dsRED-HDEL | Integration in trp1 locus, ER marker | Bevis and Glick, 2002 |
| pKW1964 | pFA6A-link-yEGFP-CaURA3 | PCR template for endogenous tagging with yEGFP | Sheff and Thorn, 2004 |
| pKW3359 | pFA6a-NH605-3V5-IAA7-KanMX6 | PCR template for endogenous tagging with V5-IAA7 | Derrer et al., 2019 |
| pKW2874 | pNH603-pGPD1-osTIR1-HIS3MX | Integration in his3 locus, OsTIR1 expression | Derrer et al., 2019 |
| pKW2830 | pNH603-pGPD1-osTIR1-LEU2 | Integration in leu2 locus, OsTIR1 expression | Chan et al., 2018 |
| pKW354 | pRS426 | 2µ–URA3 plasmid | Christianson et al., 1992 |
| pKW4468 | pRS426-BRL1 | 2µ–URA3 plasmid containing BRL1 locus | This study |
| pKW4659 | pSV272-6xHis-MBP-TEV-yEGFP | Bacterial expression of 6xHis-MBP-TEV-yEGFP | This study |
| pKW4660 | pSV272-6xHis-MBP-TEV-ahBrl1-yEGFP | Bacterial expression of 6xHis-MBP-TEV-ahBrl1-yEGFP | This study |
| pKW4683 | pSV272-6xHis-MBP-TEV-ahBrl1(F391D)-yEGFP | Bacterial expression of 6xHis-MBP-TEV-ahBrl1(F391D)-yEGFP | This study |
| pKW4684 | pSV272-6xHis-MBP-TEV-ahBrl1(I395D)-yEGFP | Bacterial expression of 6xHis-MBP-TEV-ahBrl1(I395D)-yEGFP | This study |
| pKW4612 | pRS306-pGAL1-BRL1(F391D) | Integration in ura3 locus, overexpression of Brl1(F391D) | This study |
| pKW4613 | pRS306-pGAL1-BRL1(I395D) | Integration in ura3 locus, overexpression of Brl1(I395D) | This study |
| pKW4614 | pRS306-pGAL1-BRL1(F398D) | Integration in ura3 locus, overexpression of Brl1(F398D) | This study |
| pKW4615 | pRS306-pGAL1-BRL1(L402D) | Integration in ura3 locus, overexpression of Brl1(L402D) | This study |
| pKW4616 | pRS306-pGAL1-BRL1(D393A) | Integration in ura3 locus, overexpression of Brl1(D393A) | This study |
| pKW4617 | pRS306-pGAL1-BRL1(D400A) | Integration in ura3 locus, overexpression of Brl1(D400A) | This study |
| pKW3061 | pRS303-GPD-CRE-EBD78 | Integration in his3 locus CRE-EBD78 expression | Terweij et al., 2013 |
| pKW804 | pFA6-S-TEV-ZZ-KanMX | PCR template for endogenous tagging with S-TEV-ZZ | Onischenko et al., 2020 |
| pKW953 | pFA6-S-TEV-ZZ-URA3 | PCR template for endogenous tagging with S-TEV-ZZ | This study |
| pKW4746 | pFa6a-loxP-HA-mCherry-HygMX-loxP-GFP | PCR template for endogenous tagging with loxP-HA-mCherry-HygMX-loxP-GFP | Colombi et al., 2013 |
| pKW2407 | pFA6a-mCherry-NAT | PCR template for endogenous tagging with mCherry | Onischenko et al., 2020 |
| pKW4945 | pFA6a-loxP-yEGFP_URA3-loxP | PCR template for endogenous tagging with loxP-yEGFP_URA3-loxP | This study |
| pKW4946 | pFA6a-loxP-URA3-loxP_yEGFP | PCR template for endogenous tagging with loxP-URA3-loxP_yEGFP | This study |
Table 2
Yeast strains used in this study.
| ID | Genotype | Source |
|---|---|---|
| KWY165 | haploid, MATa leu2-3,112 trp1-1 can1-100 ura3-1 ade2-1 his3-11,15 [phi+] | W303 haploid |
| KWY166 | diploid, leu2-3,112 trp1-1 can1-100 ura3-1 ade2-1 his3-11,15 [phi+] | W303 diploid |
| KWY1602 | MAT(alpha) his3-1 leu2-0 lys2-0 ura3-0 | BY4742 |
| KWY9200 | KWY165, BRL1::BRL1-V5-IAA7-KanMX trp1::pADH1-dsRED-HDEL-TRP1 | This study |
| KWY9204 | KWY165, BRL1::BRL1-V5-IAA7-KanMX his3::pGPD1-OsTIR1 trp1::pADH1-dsRED-HDEL-TRP1 | This study |
| KWY9268 | KWY165, BRL1::BRL1-V5-IAA7-KanMX trp1::pADH1-dsRED-HDEL-TRP1 NUP82::NUP82-yEGFP-URA3 | This study |
| KWY9269 | BRL1::BRL1-V5-IAA7-KanMX his3::pGPD1-OsTIR1 trp1::pADH1-dsRED-HDEL-TRP1 NUP82::NUP82-yEGFP-URA3 | This study |
| KWY9270 | KWY165, BRL1::BRL1-V5-IAA7-KanMX trp1::pADH1-dsRED-HDEL-TRP1 NUP116::NUP116-yEGFP-URA3 | This study |
| KWY9271 | KWY165, BRL1::BRL1-V5-IAA7-KanMX his3::pGPD1-OsTIR1 trp1::pADH1-dsRED-HDEL-TRP1 NUP116::NUP116-yEGFP-URA3 | This study |
| KWY9272 | KWY165, BRL1::BRL1-V5-IAA7-KanMX trp1::pADH1-dsRED-HDEL-TRP1 NUP100::NUP100-yEGFP-URA3 | This study |
| KWY9273 | KWY165, BRL1::BRL1-V5-IAA7-KanMX his3::pGPD1-OsTIR1 trp1::pADH1-dsRED-HDEL-TRP1 NUP100::NUP100-yEGFP-URA3 | This study |
| KWY9274 | KWY165, BRL1::BRL1-V5-IAA7-KanMX trp1::pADH1-dsRED-HDEL-TRP1 NUP133::NUP133-yEGFP-URA3 | This study |
| KWY9275 | KWY165, BRL1::BRL1-V5-IAA7-KanMX his3::pGPD1-OsTIR1 trp1::pADH1-dsRED-HDEL-TRP1 NUP133::NUP133-yEGFP-URA3 | This study |
| KWY9276 | KWY165, BRL1::BRL1-V5-IAA7-KanMX trp1::pADH1-dsRED-HDEL-TRP1 NUP170::NUP170-yEGFP-URA3 | This study |
| KWY9277 | KWY165, BRL1::BRL1-V5-IAA7-KanMX his3::pGPD1-OsTIR1 trp1::pADH1-dsRED-HDEL-TRP1 NUP170::NUP170-yEGFP-URA3 | This study |
| KWY9908 | KWY165, BRL1::BRL1-V5-IAA7 KanMX trp1::ADH1-dsRED-HDEL-TRP1 NUP60::NUP60-yEGFP-URA3 | This study |
| KWY10108 | KWY165, BRL1::BRL1-V5-IAA7 KanMX his3::pGPD1-OsTIR1 trp1::pADH1-dsRED-HDEL-TRP1 NUP60::NUP60-yEGFP-URA3 | This study |
| KWY9909 | KWY165, BRL1::BRL1-V5-IAA7 KanMX trp1::pADH1-dsRED-HDEL-TRP1 NUP159::NUP159-yEGFP-URA3 | This study |
| KWY10109 | KWY165, BRL1::BRL1-V5-IAA7 KanMX his3::pGPD1-OsTIR1 trp1::pADH1-dsRED-HDEL-TRP1 NUP159::NUP159-yEGFP-URA3 | This study |
| KWY9911 | KWY165, BRL1::BRL1-V5-IAA7 KanMX trp1::pADH1-dsRED-HDEL-TRP1 MLP1::MLP1-yEGFP-URA3 | This study |
| KWY10110 | KWY165, BRL1::BRL1-V5-IAA7 KanMX his3::pGPD1-OsTIR1 trp1::pADH1-dsRED-HDEL-TRP1 MLP1::MLP1-yEGFP-URA3 | This study |
| KWY9939 | KWY165, BRL1::BRL1-V5-IAA7 KanMX trp1::pADH1-dsRED-HDEL-TRP1 NUP85::NUP85-yEGFP-URA3 | This study |
| KWY10107 | KWY165, BRL1::BRL1-V5-IAA7 KanMX his3::pGPD1-OsTIR1 trp1::pADH1-dsRED-HDEL-TRP1 NUP85::NUP85-yEGFP-URA3 | This study |
| KWY10029 | KWY165, BRL1::BRL1-V5-IAA7 KanMX trp1::pADH1-dsRED-HDEL-TRP1 NUP192::NUP192-yEGFP-URA3 | This study |
| KWY10111 | KWY165, BRL1::BRL1-V5-IAA7 KanMX his3::pGPD1-OsTIR1 trp1::pADH1-dsRED-HDEL-TRP1 NUP192::NUP192-yEGFP-URA3 | This study |
| KWY5540 | KWY165, nup116ΔGLFG NUP188::HIS3MX-pMet3-3xHA-Nup188 | Onischenko et al., 2017 |
| KWY8891 | KWY165, ura3::pGAL1-BRL1-yeGFP-CaURA3 | This study |
| KWY8893 | KWY165, ura3::pGAL1-BRL1Δah-yeGFP-CaURA3 | This study |
| KWY9070 | KWY165, ura3::pGAL1-BRL1(I395D)-yeGFP-CaURA3 | This study |
| KWY8894 | KWY165, ura3::pGAL1-MRATSK-CaURA3 | This study |
| KWY8895 | KWY165, ura3::pGAL1-BRL1-CaURA3 | This study |
| KWY8896 | KWY165, ura3::pGAL1-BRL1Δah-CaURA3 | This study |
| KWY8898 | KWY165, ura3::pGAL1-BRL1(I395D)-CaURA3 | This study |
| KWY10154 | KWY165, NUP82::NUP82-yeGFP-CaURA3 leu2::pRS305-LEU2 | This study |
| KWY10155 | KWY165, NUP82::NUP82-yeGFP-CaURA3 leu2::pGAL1-BRL1-mCherry-LEU2 | This study |
| KWY10159 | KWY165, NUP82::NUP82-yeGFP-CaURA3 leu2::pGAL1-BRL1(I395D)-mCherry-LEU2 | This study |
| KWY10161 | KWY165, NUP116::NUP116-yeGFP-CaURA3 leu2::pRS305-LEU2 | This study |
| KWY10162 | KWY165, NUP116::NUP116-yeGFP-CaURA3 leu2::pGAL1-BRL1-mCherry-LEU2 | This study |
| KWY10166 | KWY165, NUP116::NUP116-yeGFP-CaURA3 leu2::pGAL1-BRL1(I395D)-mCherry-LEU2 | This study |
| KWY10168 | KWY165, NUP133::NUP133-yeGFP-CaURA3 leu2::pRS305-LEU2 | This study |
| KWY10169 | KWY165, NUP133::NUP133-yeGFP-CaURA3 leu2::pGAL1-BRL1-mCherry-LEU2 | This study |
| KWY10173 | KWY165, NUP133::NUP133-yeGFP-CaURA3 leu2::pGAL1-BRL1(I395D)-mCherry-LEU2 | This study |
| KWY10175 | KWY165, NUP170::NUP170-yeGFP-CaURA3 leu2::pRS305-LEU2 | This study |
| KWY10176 | KWY165, NUP170::NUP170-yeGFP-CaURA3 leu2::pGAL1-BRL1-mCherry-LEU2 | This study |
| KWY10180 | KWY165, NUP170::NUP170-yeGFP-CaURA3 leu2::pGAL1-BRL1(I395D)-mCherry-LEU2 | This study |
| KWY10260 | KWY165, SEC61::SEC61-yEGFP-CaURA3 leu2-3::pRS305-LEU2 | This study |
| KWY10261 | KWY165, SEC61::SEC61-yEGFP-CaURA3 leu2-3::BRL1-mCherry-LEU2 | This study |
| KWY10262 | KWY165, SEC61::SEC61-yEGFP-CaURA3 leu2-3::BRL1(I395D)-mCherry-LEU2 | This study |
| KWY8876 | KWY165, nup116ΔGLFG NUP188::HIS3MX-pMet3-3xHA-Nup188 ura3::pGAL1-BRL1Δah-URA3 | This study |
| KWY8874 | KWY165, nup116ΔGLFG NUP188::HIS3MX-pMet3-3xHA-Nup188 ura3::pGAL1-BRL1-URA3 | This study |
| KWY8877 | KWY165, nup116ΔGLFG NUP188::HIS3MX-pMet3-3xHA-Nup188 ura3::pGAL1-MRATSK-URA3 | This study |
| KWY8882 | KWY165, nup116ΔGLFG NUP188::HIS3MX-pMet3-3xHA-Nup188 ura3::pGAL1-BRL1(F391D)-URA3 | This study |
| KWY8883 | KWY165, nup116ΔGLFG NUP188::HIS3MX-pMet3-3xHA-Nup188 ura3::pGAL1-BRL1(I395D)-URA3 | This study |
| KWY8884 | KWY165, nup116ΔGLFG NUP188::HIS3MX-pMet3-3xHA-Nup188 ura3::pGAL1-BRL1(F398D)-URA3 | This study |
| KWY8885 | KWY165, nup116ΔGLFG NUP188::HIS3MX-pMet3-3xHA-Nup188 ura3::pGAL1-BRL1(L402D)-URA3 | This study |
| KWY8886 | KWY165, nup116ΔGLFG NUP188::HIS3MX-pMet3-3xHA-Nup188 ura3::pGAL1-BRL1(D393A)-URA3 | This study |
| KWY8887 | KWY165, nup116ΔGLFG NUP188::HIS3MX-pMet3-3xHA-Nup188 ura3::pGAL1-BRL1(D400A)-URA3 | This study |
| KWY9079 | KWY165, trp1::dsRed-HDEL-TRP1 ura3::pGAL1-ahBRL1-yEGFP-CaURA3 | This study |
| KWY9075 | KWY165, trp1::dsRed-HDEL-TRP1 ura3::pGAL1-yEGFP-CaURA3 | This study |
| KWY10418 | KWY165, Brl1-mCherry::Nat his3::CRE-EBD78 NUP170::NUP170-loxP-GFP_URA3-loxP_STOP | This study |
| KWY10419 | KWY165, Brl1-mCherry::Nat his3::CRE-EBD78 NUP170::NUP170-loxP-STOP_URA3-loxP_GFP | This study |
| KWY9964 | KWY1602, BRL1::BRL1-S-TEV-ZZ-KanMX | This study |
| KWY10453 | KWY1602, BRL1::BRL1-V5-IAA7-KanMX his3::pGPD1-OsTIR1 NUP170::NUP170-S-TEV-ZZ-URA3 | This study |
| KWY10241 | KWY1602, BRL1::BRL1-V5-IAA7-KanMX his3::pGPD1-OsTIR1 | This study |
| KWY10697 | KWY1602, BRL1::BRL1-V5-IAA7-KanMX his3::pGPD1-OsTIR1 ura3::Nup82-yEGFP leu2-3::BRL1(I395D)-mCherry-LEU2 | This study |
| KWY10445 | KWY1602, BRL1::BRL1-V5-IAA7-KanMX leu2::pGPD1-OsTIR1 MLP1::MLP1-V5-loxP-mCherry_HygMX-loxP_GFP his3::CRE-EBD78 | This study |
| KWY10450 | KWY1602, BRL1::BRL1-V5-IAA7-KanMX leu2::pGPD1-OsTIR1 NUP82::NUP82-V5-loxP-mCherry_HygMX-loxP_GFP his3::CRE-EBD78 | This study |
| KWY10451 | KWY1602, BRL1::BRL1-V5-IAA7-KanMX leu2::pGPD1-OsTIR1 NUP188::NUP188-V5-loxP-mCherry_HygMX-loxP_GFP his3::CRE-EBD78 | This study |
| KWY10452 | KWY1602, BRL1::BRL1-V5-IAA7-KanMX leu2::pGPD1-OsTIR1 NUP133::NUP133-V5-loxP-mCherry_HygMX-loxP_GFP his3::CRE-EBD78 | This study |
| KWY9485 | KWY166, BRL1/brl1Δah | This study |
| KWY9489 | KWY166, BRL1/brl1(I395D) | This study |
Additional files
-
MDAR checklist
- https://cdn.elifesciences.org/articles/78385/elife-78385-mdarchecklist1-v2.pdf
-
Transparent reporting form
- https://cdn.elifesciences.org/articles/78385/elife-78385-transrepform1-v2.pdf
-
Appendix 1—figure 1—source data 1
Fractional labeling in the source lysate (parallel reaction monitoring [PRM] assay, related to Appendix 1—figure 1A).
- https://cdn.elifesciences.org/articles/78385/elife-78385-app1-fig1-data1-v2.xlsx
-
Appendix 1—figure 1—source data 2
Fractional labeling in the lysis intermixing tests with Brl1 bait (related to Appendix 1—figure 1B–D).
- https://cdn.elifesciences.org/articles/78385/elife-78385-app1-fig1-data2-v2.xlsx
-
Appendix 1—figure 2—source data 1
Distance measurements.
- https://cdn.elifesciences.org/articles/78385/elife-78385-app1-fig2-data1-v2.xlsx
Download links
A two-part list of links to download the article, or parts of the article, in various formats.
Downloads (link to download the article as PDF)
Open citations (links to open the citations from this article in various online reference manager services)
Cite this article (links to download the citations from this article in formats compatible with various reference manager tools)
An amphipathic helix in Brl1 is required for nuclear pore complex biogenesis in S. cerevisiae
eLife 11:e78385.
https://doi.org/10.7554/eLife.78385


