Infant brain regional cerebral blood flow increases supporting emergence of the default-mode network
- Department of Radiology, Children’s Hospital of Philadelphia, United States
- Department of Radiology, Perelman School of Medicine, University of Pennsylvania, United States
- Department of Neurology, Perelman School of Medicine, University of Pennsylvania, United States
- Department of Radiology, Beijing Children’s Hospital, Capital Medical University, China
- Department of Biomedical Engineering, Tsinghua University, China
- School of Psychological and Cognitive Sciences, Peking University, China
Figures
Figure 1 with 2 supplements
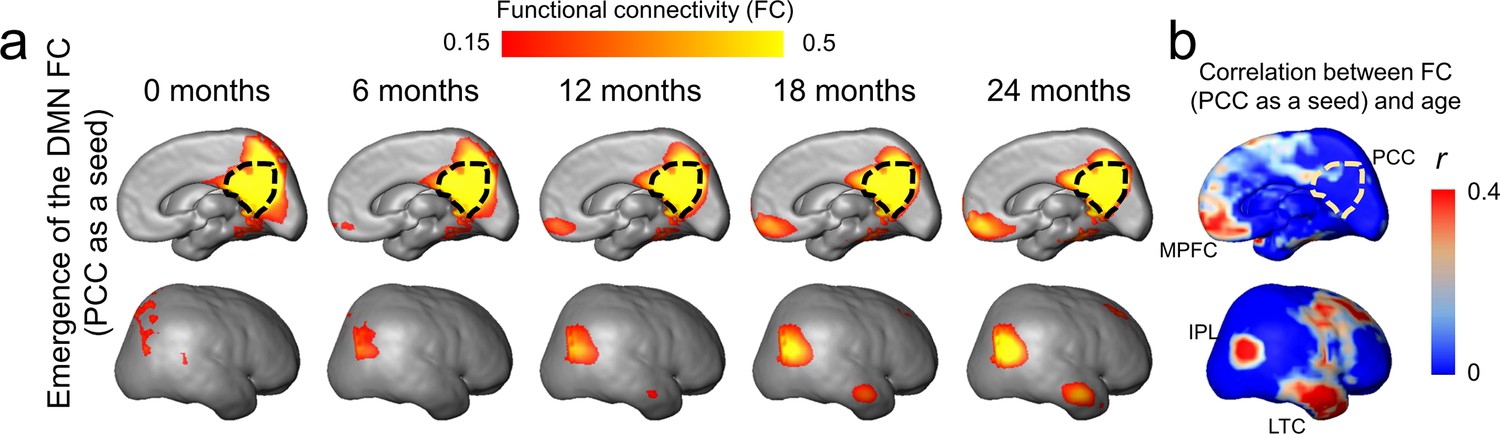
Emergence of functional connectivity (FC) within the default-mode network (DMN) during infancy.
The maps of the DMN FC (PCC as a seed) at representative ages from 0 to 24 months are demonstrated in (a), and the map of correlation coefficient of FC (PCC as a seed) and age is demonstrated in (b). In (a), gradually emerging FC of other DMN regions (including MPFC, IPL, and LTC) to the PCC from 0 to 24 months can be appreciated. The PCC is delineated by the black dashed contour. In (b), stronger correlation between FC (PCC as a seed) and age is localized in DMN subregions IPL, ITL, and MPFC. Abbreviations of DMN subregions: IPL: inferior posterior lobule; LTC: lateral temporal cortex; MPFC: medial prefrontal cortex; PCC: posterior cingulate cortex.
Figure 1—figure supplement 1

Identification of functional network regions of interest with resting-state fMRI of infants aged 12–24 months.
(a) Functional connectivity obtained from correlation between blood oxygenation level-dependent (BOLD) fMRI time courses of two voxels. (b) Brain regions of the visual (Vis), sensorimotor (SM), and default-mode network (DMN) identified by z statistic maps from group independent component analysis. DMN subregions posterior cingulate cortex (PCC), medial prefrontal cortex (MPFC), inferior posterior lobule (IPL), and lateral temporal cortex (LTC) can be clearly appreciated.
Figure 1—figure supplement 2
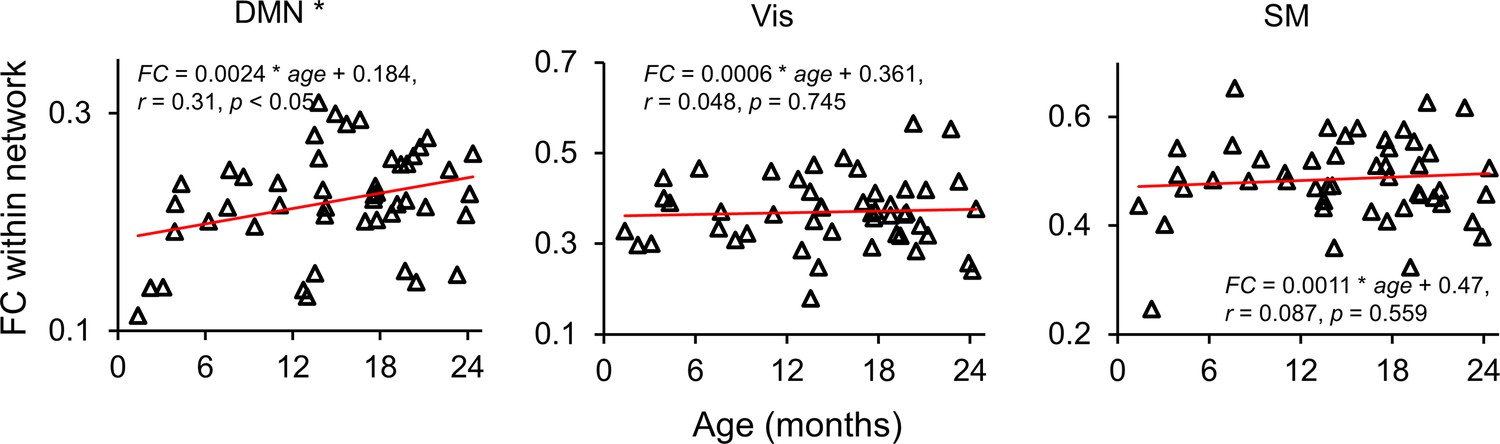
Age-dependent changes of functional connectivity (FC) within the default-mode network (DMN), visual (Vis), and sensorimotor (SM) network regions during infancy.
Significant age-dependent increase of within-network FC was found only in the DMN (r = 0.31, p<0.05, indicated with an asterisk) regions, but not in the Vis (r = 0.048, p=0.745) and SM (r = 0.087, p=0.559) regions.
Figure 2 with 2 supplements
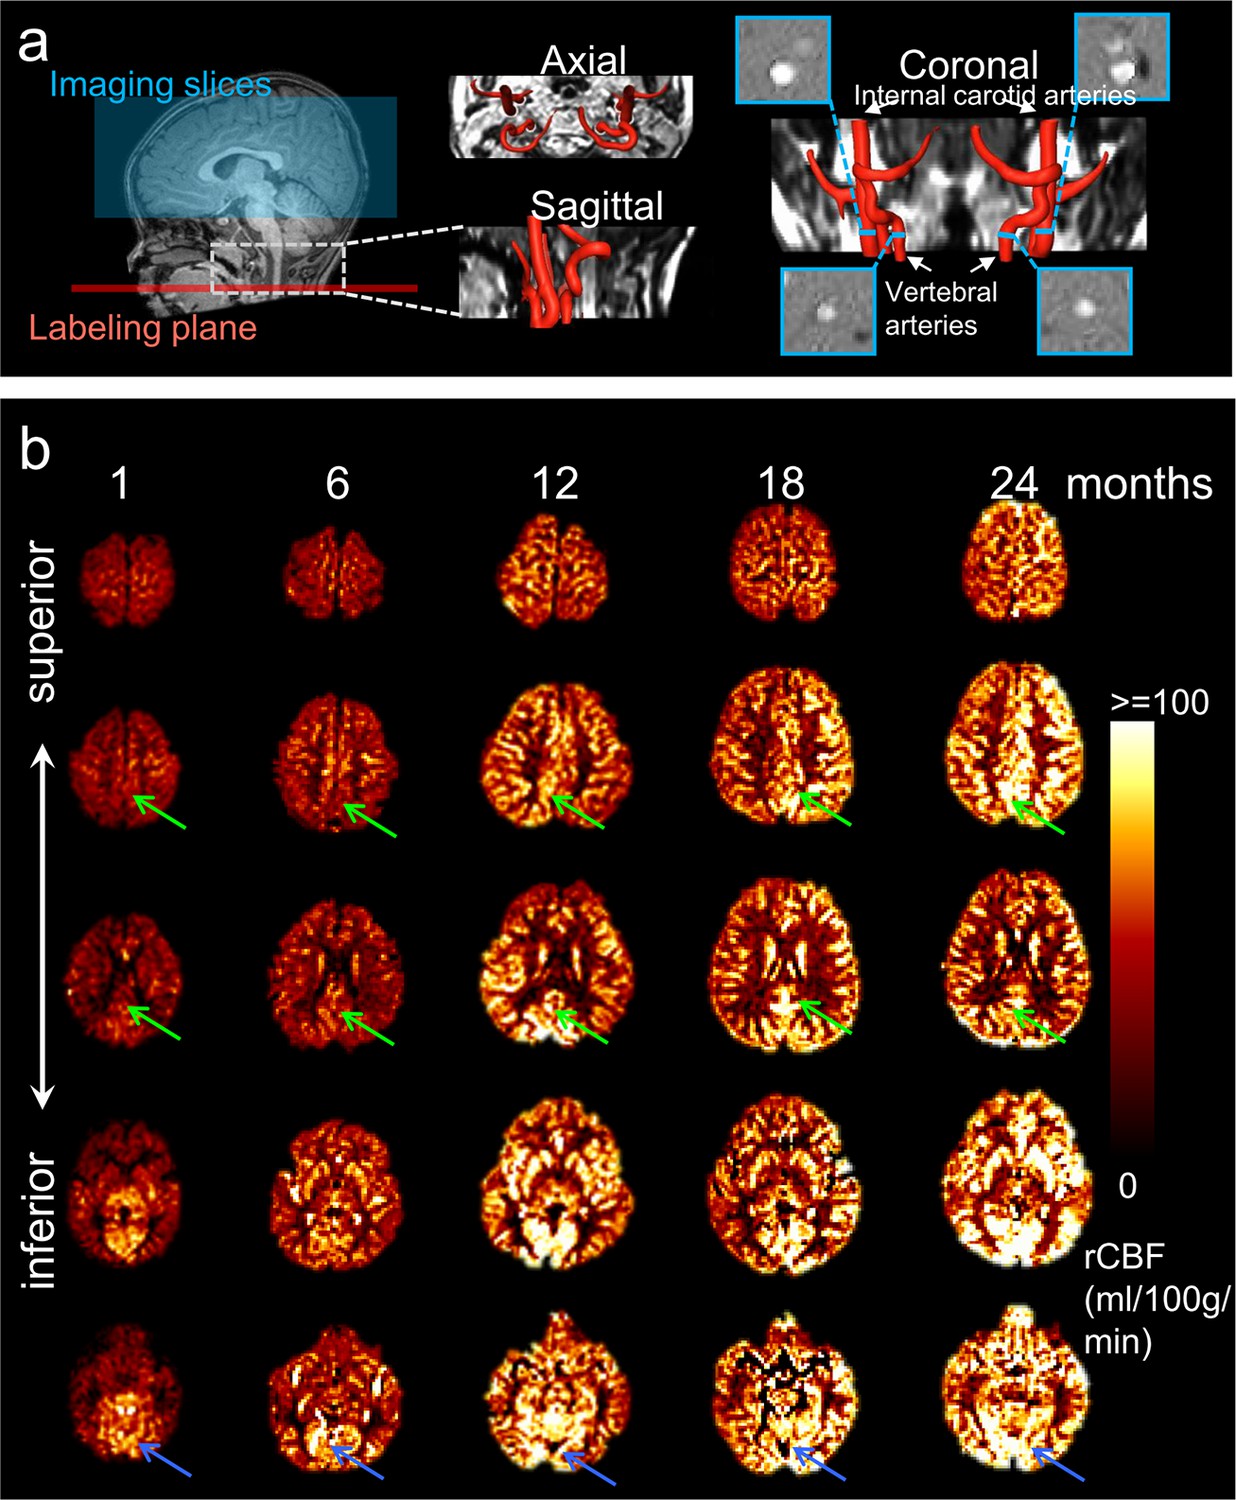
Acquisition of high-quality infant pseudo-continuous arterial-spin-labeled (pCASL) perfusion and phase contrast (PC) MRI and resultant axial regional cerebral blood flow (rCBF) maps at different infant ages.
(a) Labeling plane (red line) and imaging volume (blue box) of pCASL perfusion MRI are shown on the mid-sagittal slice of T1-weighted image of a representative infant on the left panels. Axial and sagittal view of MR angiography with reconstructed internal carotid and vertebral arteries are shown in the middle of panel (a). On the right of panel (a), the coronal view of the reconstructed arteries is placed in the middle with four slices (shown as blue bars) of the PC MR scans positioned perpendicular to the respective feeding arteries. The PC MR images are shown on the four panels surrounding the coronal view of the angiography. These PC MR images measure the global cerebral blood flow of internal carotid and vertebral arteries and are used to calibrate rCBF. (b) rCBF maps of representative typically developing (TD) infant brains at 1, 6, 12, 18, and 24 months from left to right. Axial slices of rCBF maps from inferior to superior are shown from bottom to top of the panel b for each TD infant brain. Green arrows point to the posterior cingulate cortex (a hub of the DMN network) characterized by relatively lower rCBF at early infancy and prominent rCBF increases from 1 to 24 months. Blue arrows point to the visual cortex characterized by relatively higher rCBF at early infancy and relatively mild rCBF increase from 1 to 24 months.
Figure 2—figure supplement 1
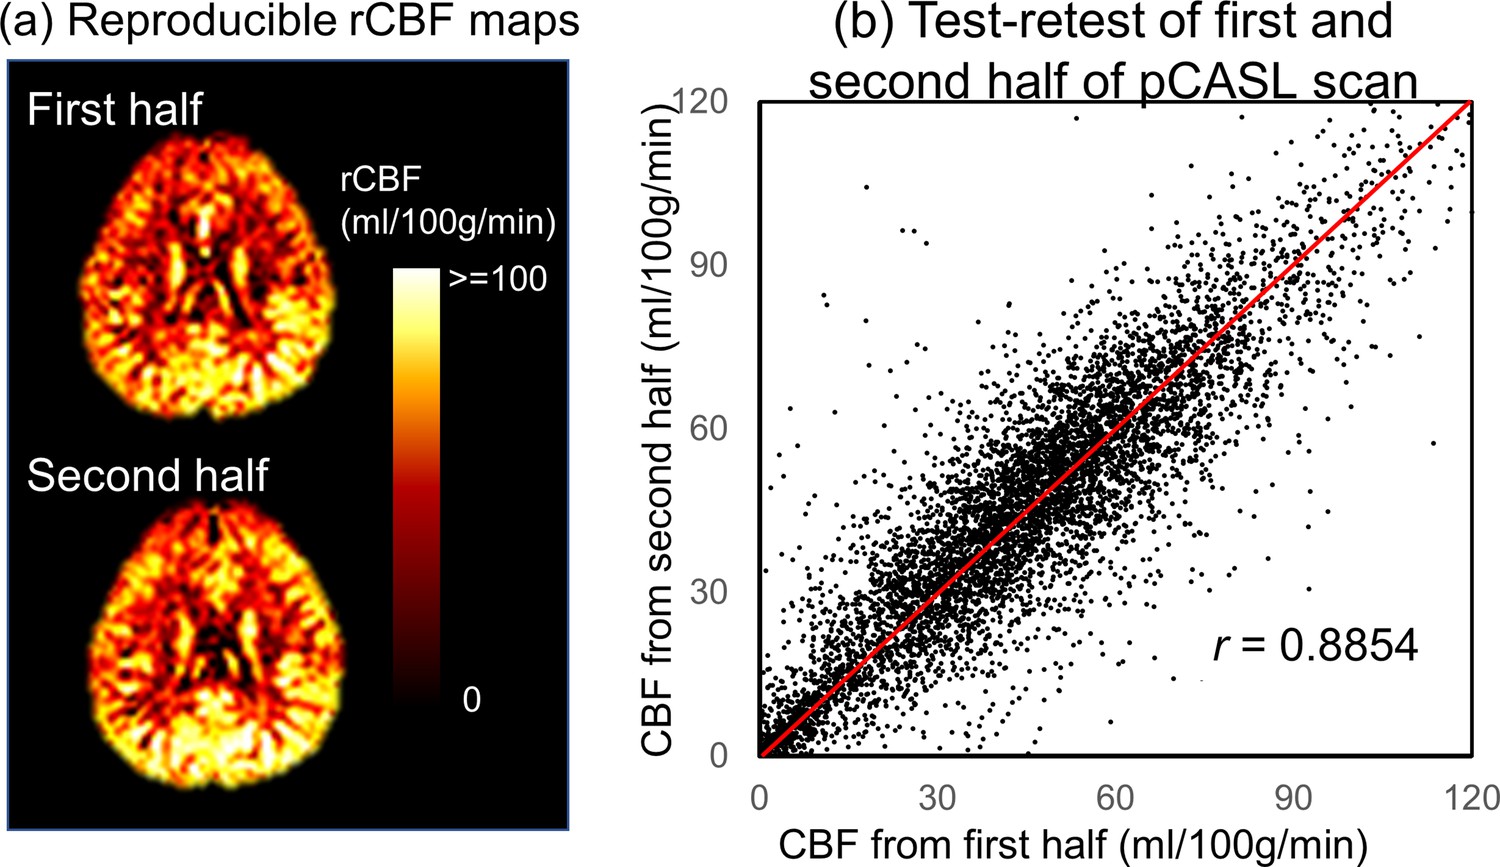
Highly reproducible pseudo-continuous arterial-spin-labeled (pCASL) protocol adopted in this study for measuring regional cerebral blood flow (rCBF).
Panel (a) shows reproducible rCBF maps measured from first and second half of the control/label volumes, and panel (b) shows the intraclass correlation coefficient (ICC) 0.8854 with the 95% confident intervals of [0.88, 0.8906] calculated from entire brain rCBF maps measured from first and second half control/label volumes. Both panels (a) and (b) are generated based on pCASL scans of a randomly selected infant subject aged 17.6 months.
Figure 2—figure supplement 2

Heterogeneity of regional cerebral blood flow (rCBF) measurements across functional network regions.
Significant differences (p<0.05 with false discovery rate [FDR] correction) of rCBF measurements between regions were indicated by asterisks. Sample size is 48. Error bars indicate standardard deviation of rCBF measurement within each region of interests (ROI). To test significant difference of the rCBF values among different functional network ROIs, a one-way ANOVA (Analysis of Variance) with repeated measures was conducted. Paired t-tests were also conducted to test the difference of rCBF measurements between regions. FDR of each test was corrected to control the type I error. Significant interaction between regions and age was tested with an ANCOVA (Analysis of Covariance) test where age was used as a covariate.
Figure 3
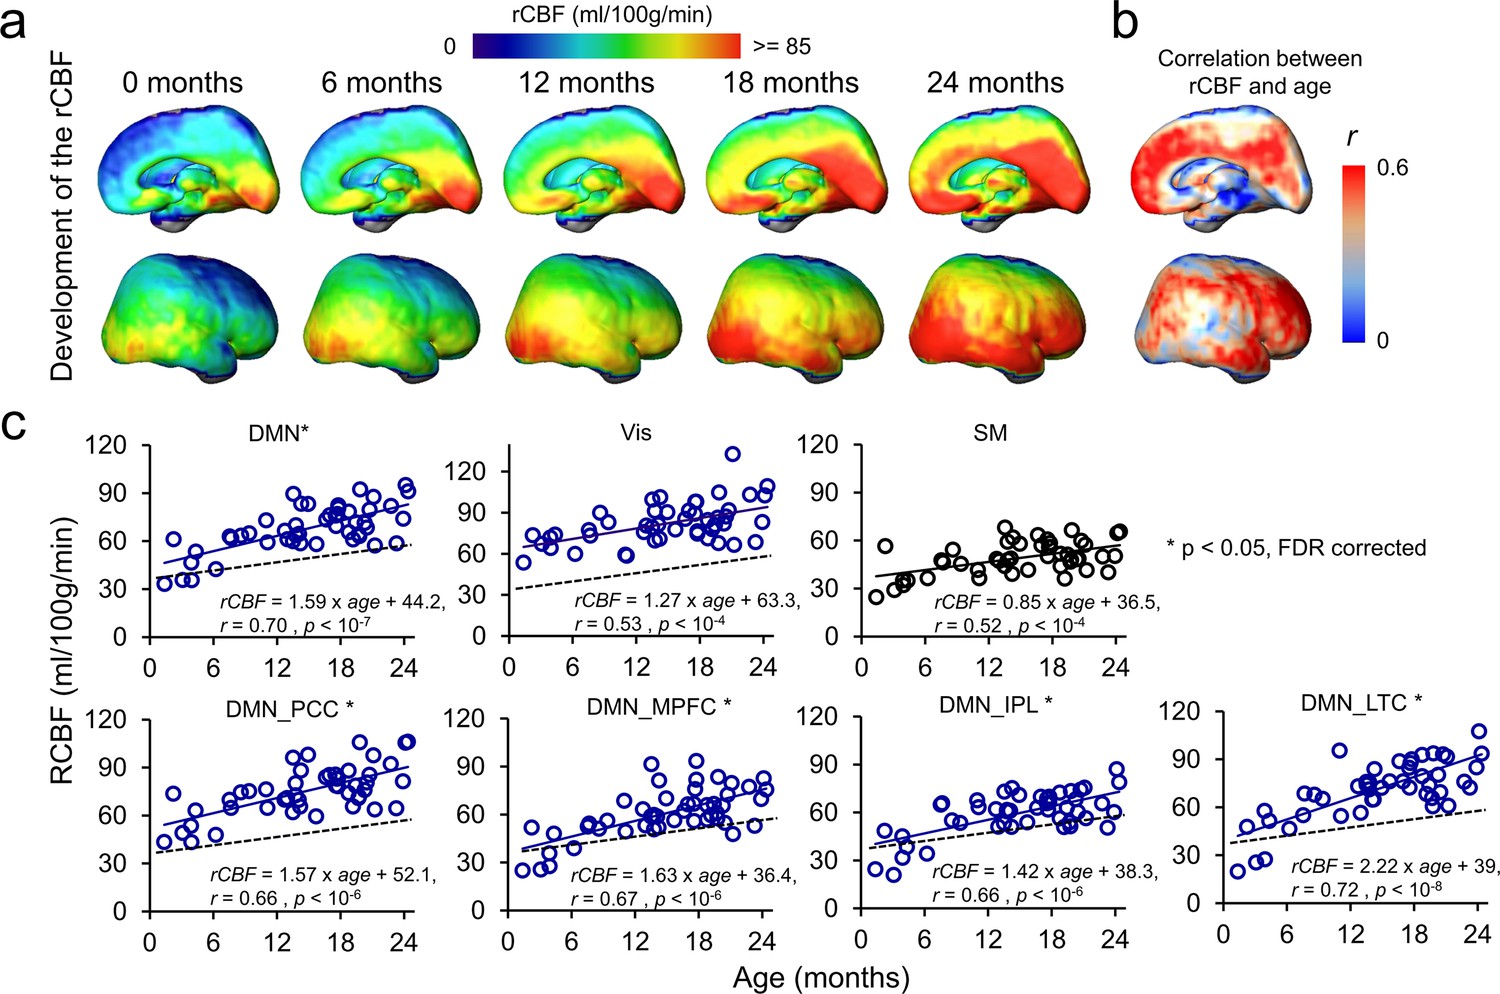
4D spatiotemporal regional cerebral blood flow (rCBF) dynamics and faster rCBF increases in the default-mode network (DMN) hub regions during infancy.
(a) Medial (top row) and lateral (bottom row) views of fitted rCBF profiles of the infant brain at 0, 6, 12, 18, and 24 months in the custom-made infant template space demonstrate heterogeneous rCBF increase across the brain regions. (b) Medial (top) and lateral (bottom) views of rCBF–age correlation coefficient (r) map are demonstrated. (c) The scatterplots of rCBF measurements in the primary sensorimotor (SM) network (black circle and black line), visual (Vis) network (blue circle and blue line), and total and individual DMN hub regions (DMN_MPFC, DMN_PCC, DMN_IPL, and DMN_LTC) (blue circle and blue line) of all studied infants demonstrate differential rCBF increase rates. * next to network name in each plot indicates significant (false discovery rate [FDR]-corrected p<0.05) differences of rCBF trajectory slopes from that of SM used as a reference and shown in a black dashed line. See legend of Figure 1 for abbreviations of the DMN subregions.
Figure 4
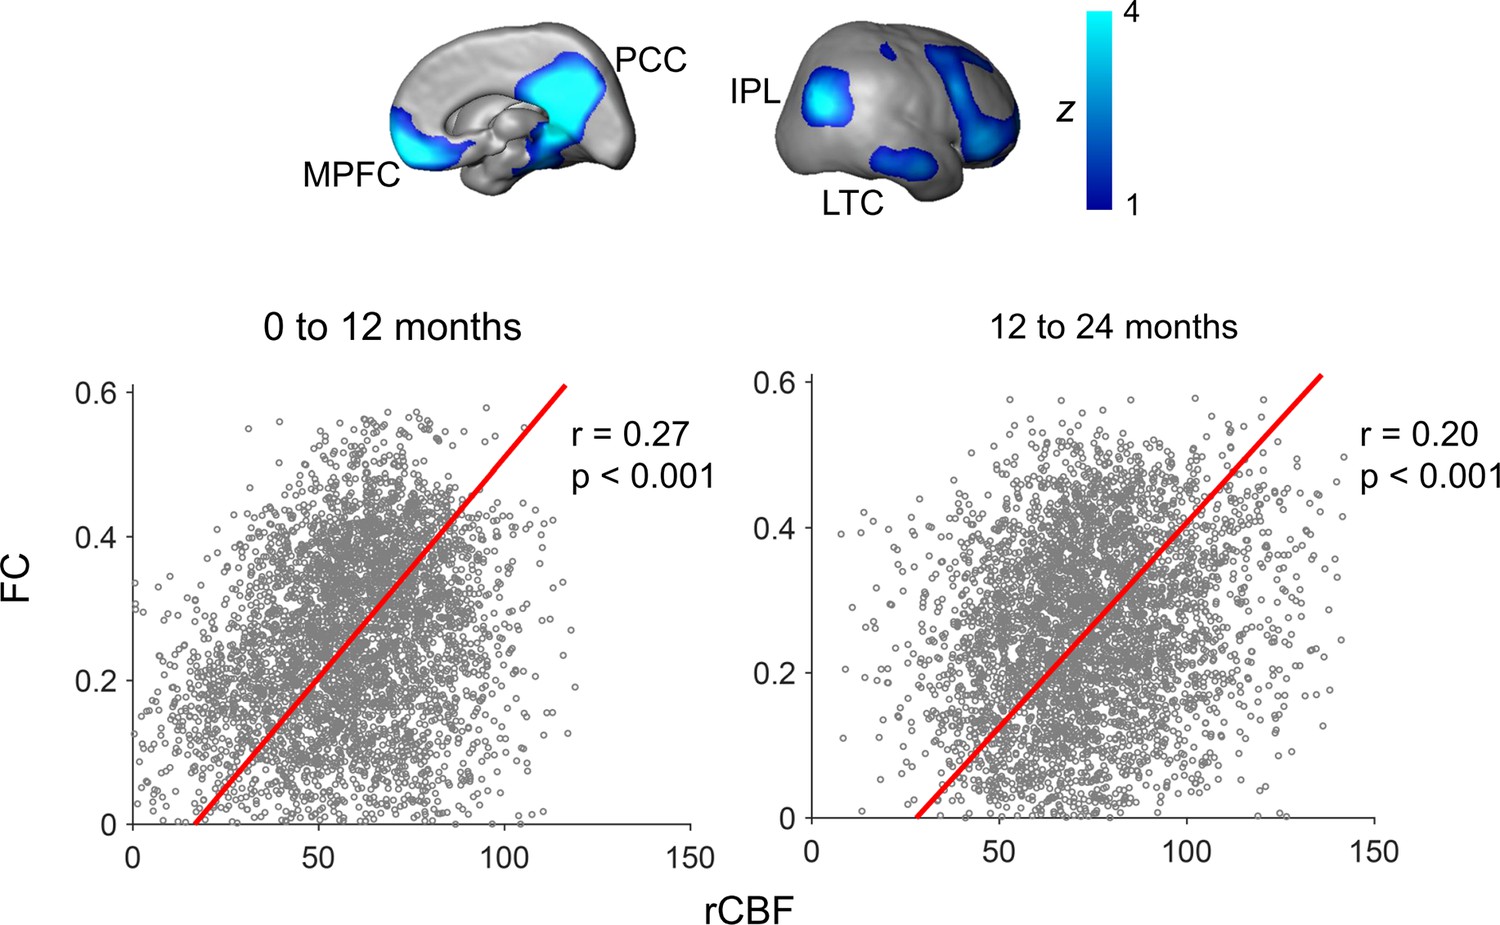
Significant correlation of regional cerebral blood flow (rCBF) and functional connectivity (FC) at randomly selected 4000 voxels within the default-mode network (DMN) for both infants aged 0–12 months (p<0.001, left scatter plot) and infants aged 12–24 months (p<0.001, right scatter plot).
FC is the average of FC of a certain DMN voxel to all other DMN voxels. The DMN regions of interests obtained from a data-driven independent component analysis of resting-state fMRI of the 12–24month infant cohort are shown on the top panels as an anatomical reference. See legend of Figure 1 for abbreviations of the DMN subregions.
Figure 5 with 3 supplements
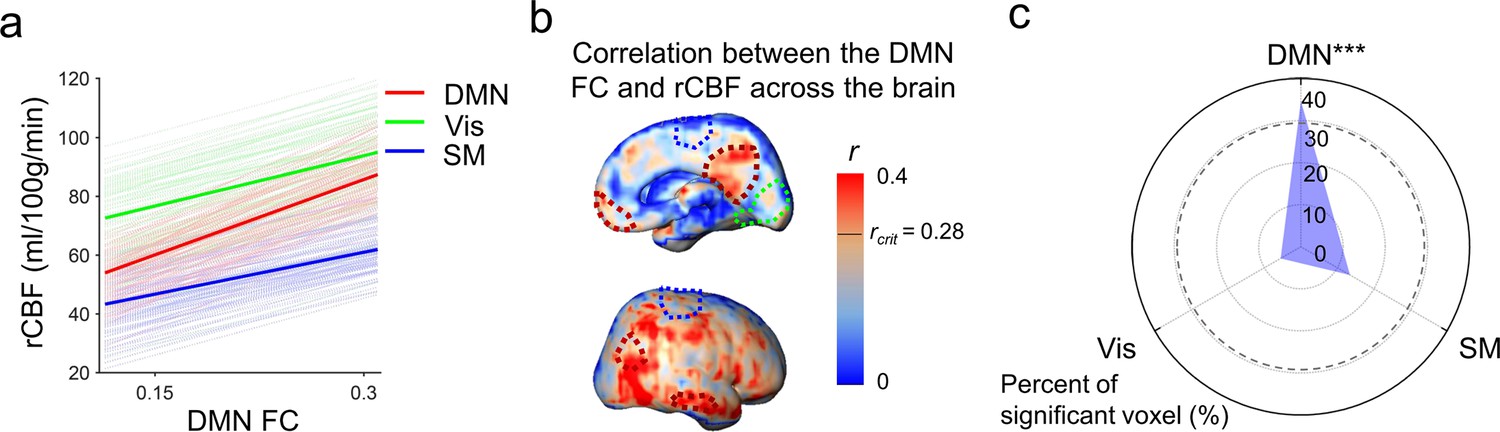
Significant correlation between functional emergence of the default-mode network (DMN) and regional cerebral blood flow (rCBF) increases specifically in the DMN regions, but not in primary sensorimotor (visual or sensorimotor) regions.
(a) Correlation of intra-default-mode-network functional connectivity (DMN FC) and rCBF at randomly selected voxels in the DMN (light red lines), visual (Vis, light green lines) and sensorimotor (SM, light blue lines) network regions. Correlations of DMN FC and averaged rCBF in the DMN, Vis, and SM network regions are shown as thickened red, green, and blue lines, respectively. (b) Coupling between the DMN FC and rCBF across the brain can be appreciated by distribution of voxel-wise correlation coefficient (r) obtained from correlation between DMN FC and rCBF at each voxel. The short black line in the color bar indicates critical r value rcrit corresponding to p=0.05. Higher r values can be appreciated in the DMN hub regions including posterior cingulate cortex (PCC), medial prefrontal cortex (MPFC), inferior posterior lobule (IPL), and lateral temporal cortex (LTC) with their boundaries delineated by the dashed dark red contours (from Figure 1—figure supplement 1b). Dashed green and blue contours (also from Figure 1—figure supplement 1b) delineate the Vis and SM network regions, respectively. (c) Radar plot shows significant correlation between rCBF and intra-DMN FC in the DMN network (36.7%, p<0.0001), but not in the Vis (14.6%, p>0.05), or SM (5.5%, p>0.05) networks. The radius represents the percent of the voxels with significant correlations between intra-DMN FC and rCBF in DMN, Vis, and SM network regions, respectively. The dashed line circle indicates critical percent of significant voxels with p=0.05 from 10,000 permutation tests. ***p<0.0001.
Figure 5—figure supplement 1

Procedures of generating map of correlation between the default-mode network (DMN) functional connectivity (FC) and reginal cerebral blood flow (rCBF) across the entire brain voxels.
At any brain voxel indicated by a small black box in the correlation map below, correlation between the DMN FC across subjects and the rCBF at this voxel across subjects was conducted and the correlation coefficient was calculated for this voxel. The correlation map between the DMN FC and rCBF across the brain can be generated by projecting the correlation coefficient r of each voxel onto the cortical surface.
Figure 5—figure supplement 2
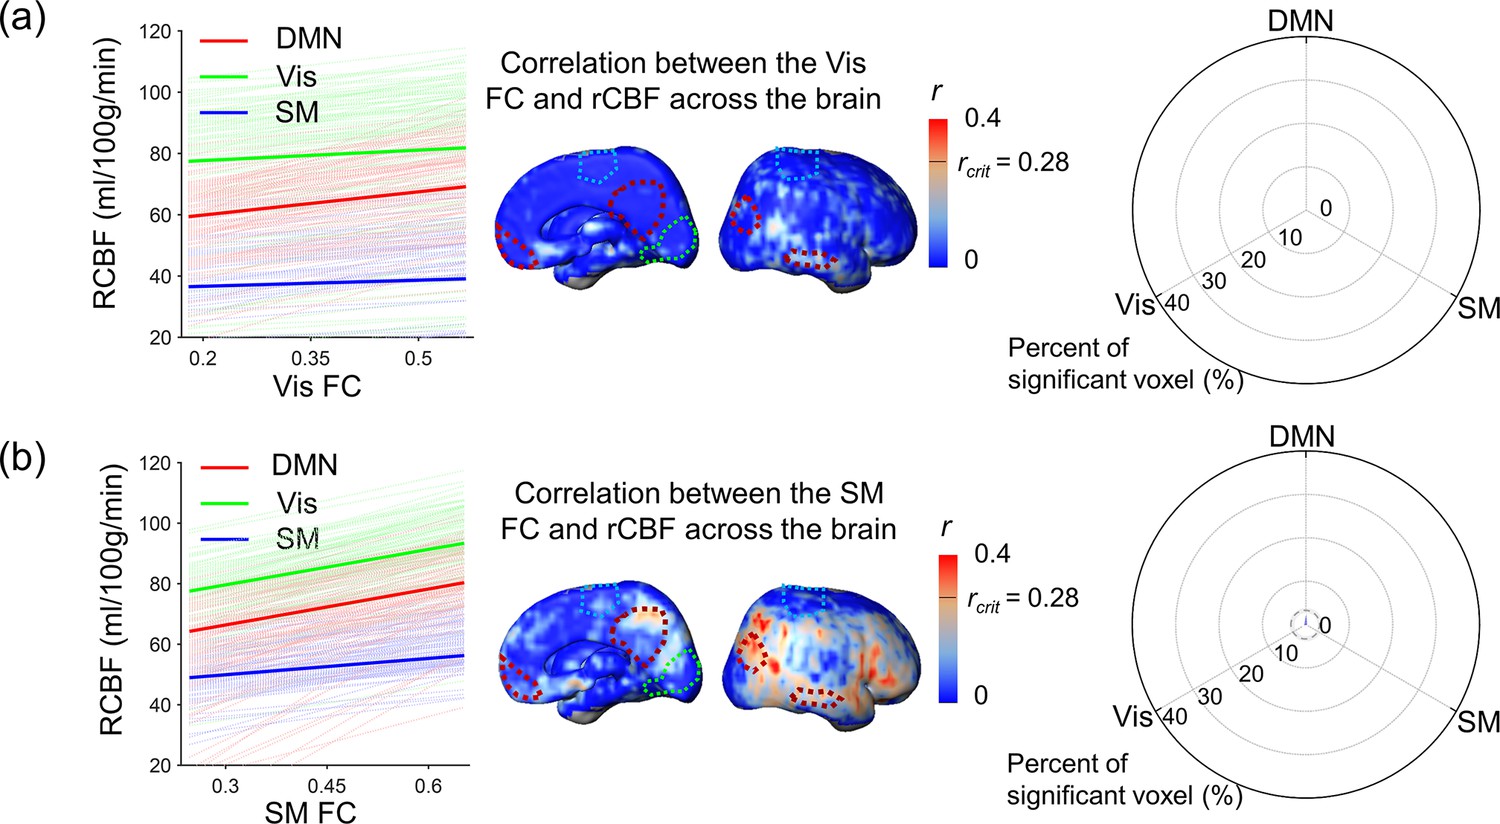
Coupling between intra-visual network functional connectivity (Vis FC) and regional cerebral blood flow (rCBF) and coupling between intra-sensorimotor network (SM FC) and rCBF.
Left panels show the correlation of Vis FC (a) or SM FC (b) and rCBF at randomly selected voxels in the default-mode (DMN) (light red lines), Vis (light green lines) and SM (light blue lines) network regions. Correlations of Vis FC (a) or SM FC (b) and averaged rCBF in the DMN, Vis, and SM network regions are shown as thickened red, green, and blue lines, respectively. Middle panels demonstrate the distribution of voxel-wise correlation coefficient (r) obtained from correlation between Vis FC (a) or SM FC (b) and rCBF at each voxel. The short black line in the color bar indicates critical correlation coefficient r value rcrit corresponding to p=0.05. Low r values are apparent in all network (DMN, Vis, and SM) regions with dashed red, green, and blue contours (from Figure 1—figure supplement 1b) delineating DMN, Vis, and SM network, respectively. Right panels show radar plot with radius representing percent of voxels with significant correlation between Vis FC or SM FC and rCBF in the DMN, Vis, or SM network regions. The radii in radar plots demonstrate that the percent of voxels with significant correlations between intra-Vis (a) or intra-SM (b) FC and rCBF in DMN, Vis, or SM network regions is 0 or close to 0, indicating that coupling between Vis FC or SM FC and rCBF in any network region is not significant. The dashed line circle in the radar plot indicates critical percent of significant voxels with p=0.05 from 10,000 permutation tests.
Figure 5—figure supplement 3

A diagram illustrating hypothesized neuronal mechanism supporting coupling of regional cerebral blood flow (rCBF) and functional connectivity.
Specifically, higher cerebral blood flow delivers larger amount of oxygen and glucose to neurons, leading to cascade of events of regional cerebral metabolic rate of oxygen (CMRO2) ↑ and glucose (CMRGlu) ↑, synaptogenesis ↑ and synaptic efficacy ↑, blood oxygenation level-dependent (BOLD) signal synchronization ↑, and functional connectivity ↑, during infant brain development.
Author response image 1

Physiological connectivity.
Author response image 2
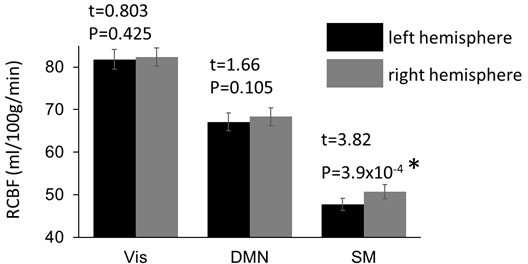
Significant higher rCBF in the sensorimotor (SM) network regions in right hemisphere.
Author response image 3

The gray matter mask and segmented cortical mask overlaid on rCBF map of three representative infants aged 3, 6, and 20 months in the template space.
The gray matter mask on the left panel was created to minimize the contamination of white matter and CSF while keeping the continuity of the cortical gray matter mask across the cerebral cortex. The contour of the gray matter mask was highlighted with bule line.
Author response image 4
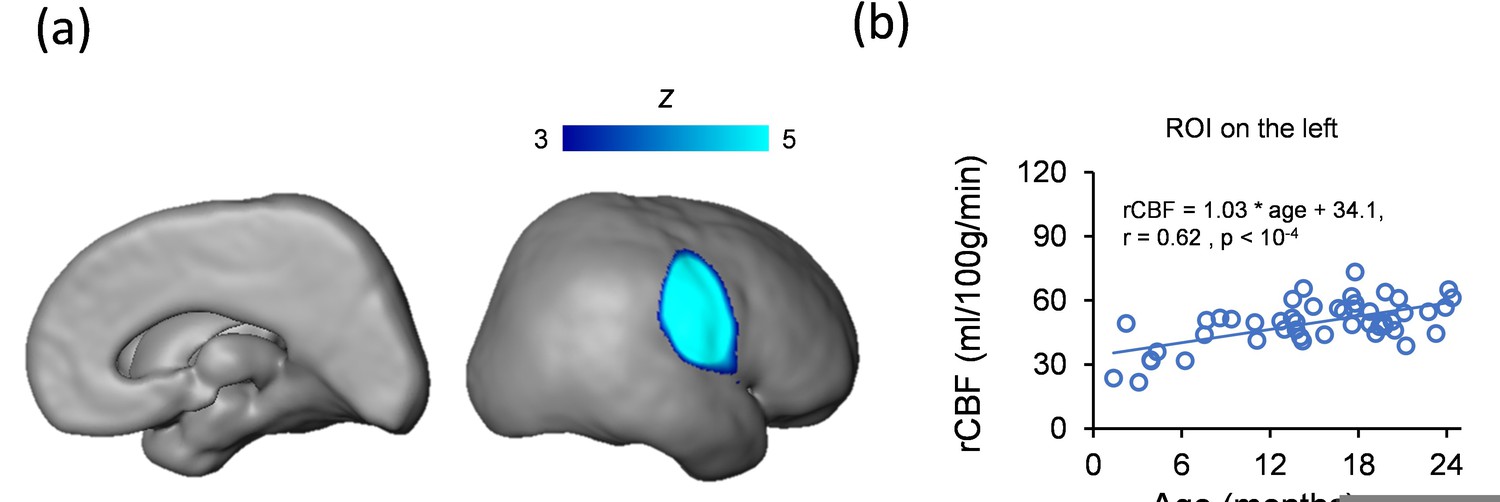
(a) An ROI revealed by ICA analysis included inferior SM and auditory cortex.
(b) In ROI shown in a, no significant difference (p > 0.05) of rCBF increase rate between this ROI and SM network ROI included in the manuscript was found. The rCBF of this ROI also increases significantly with age (r = 0.62, p<10-4).
Videos
Video 1
Video of the 4D spatiotemporal whole-brain dynamics of regional cerebral blood flow from 0 to 24 months.
Additional files
Download links
A two-part list of links to download the article, or parts of the article, in various formats.
Downloads (link to download the article as PDF)
Open citations (links to open the citations from this article in various online reference manager services)
Cite this article (links to download the citations from this article in formats compatible with various reference manager tools)
Infant brain regional cerebral blood flow increases supporting emergence of the default-mode network
eLife 12:e78397.
https://doi.org/10.7554/eLife.78397


