Enteroendocrine cell lineages that differentially control feeding and gut motility
- Department of Cell Biology, Howard Hughes Medical Institute, Harvard Medical School, United States
- Wellcome Trust MRC Institute of Metabolic Science, University of Cambridge, United Kingdom
Figures
Figure 1 with 1 supplement

Establishing intersectional tools for genetic access to enteroendocrine cells in vivo.
(A) Bright-field microscopy and native GFP fluorescence microscopy of intestinal tissue from Vil1-p2a-FlpO; fsf-Gfp mice (left) and fsf-Gfp mice (right). Scale bars: 5 mm. (B) Cartoon depicting intersectional genetic strategy to access enteroendocrine cells. (C) Native reporter fluorescence in cryosections (20 μm, except 50 μm for cortex and dorsal root ganglion) or wholemounts (tongue) of fixed tissues indicated from Neurod1-Cre; lsl-tdTomato mice (left), Vil1-p2a-FlpO; fsf-Gfp mice (middle), and Neurod1INTER; inter-tdTomato mice (right). Scale bars: 100 μm for all except 500 μm for tongue. Intestine sections from duodenum (middle) or jejunum (left, right). See Figure 1—figure supplement 1.
Figure 1—figure supplement 1
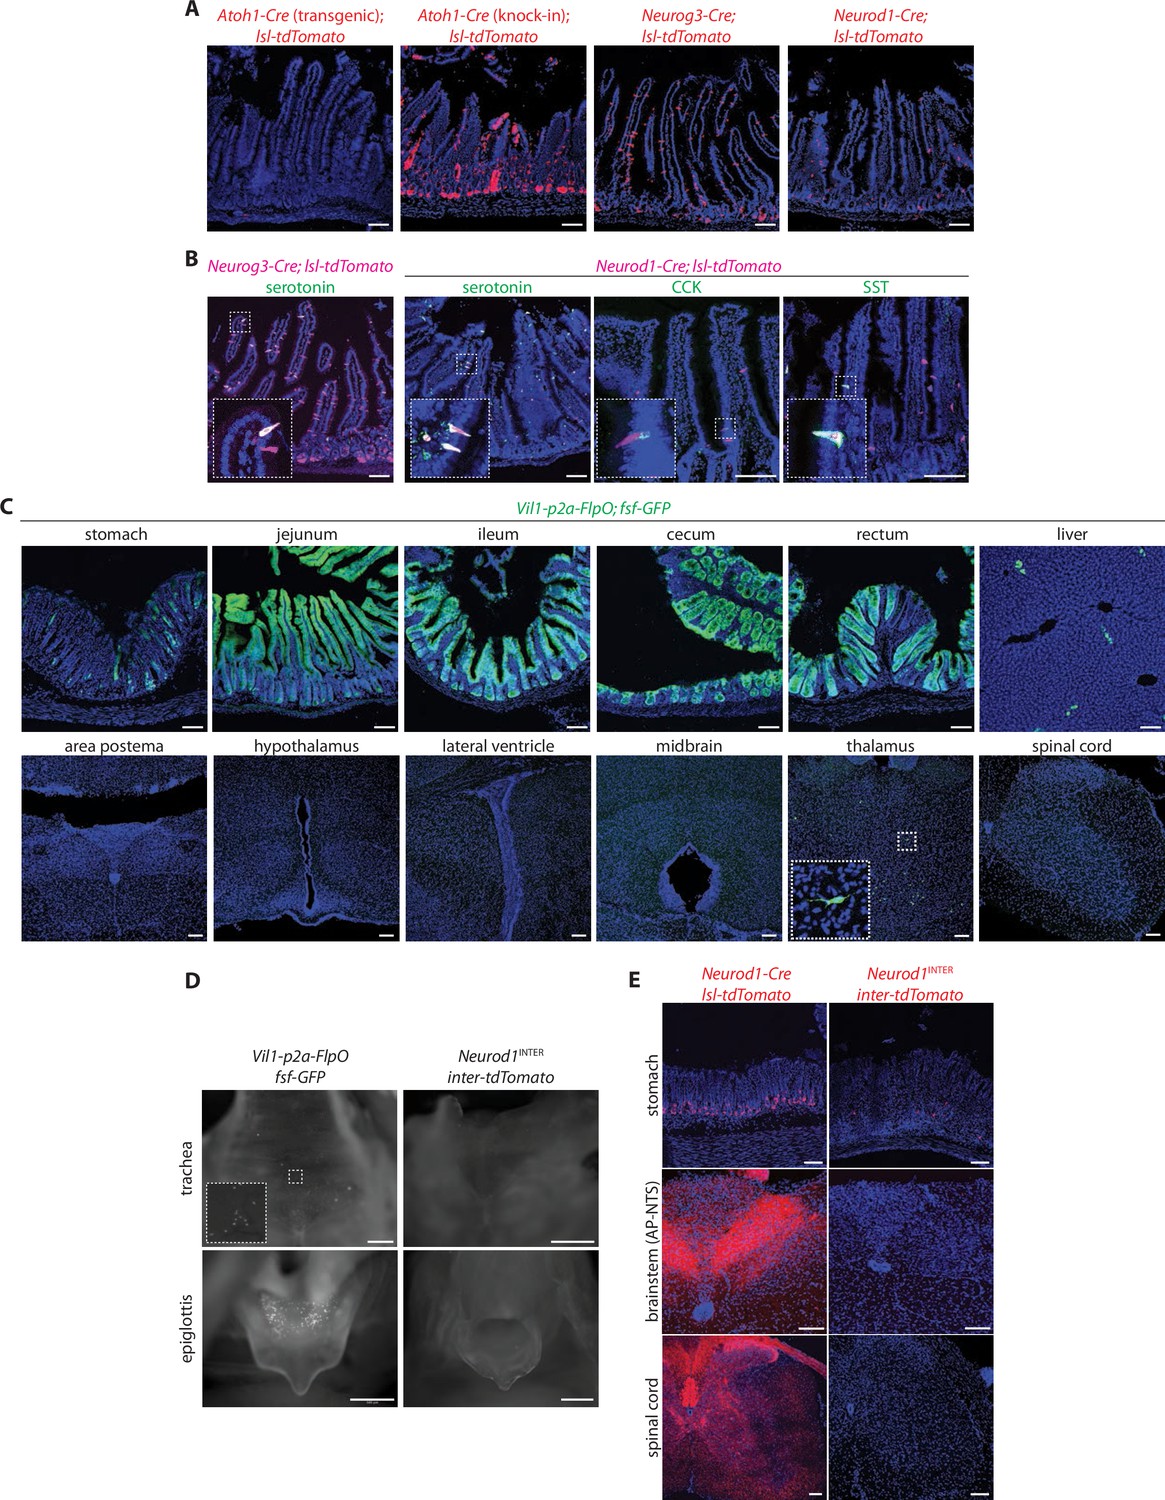
Characterization of mouse lines for intersectional genetics.
(A) Native tdTomato fluorescence in fixed intestinal cryosections (20 μm) of mouse lines indicated. (B) Two-color analysis examining expression of tdTomato (native fluorescence, magenta) and hormones (immunochemistry, green) in fixed intestinal cryosections (20 μm) of mouse lines indicated, SST: somatostatin. (C) Native GFP fluorescence in fixed cryosections of tissues (20 μm), spinal cord (50 μm) and brain regions indicated (50 μm) in Vil1-p2a-FlpO; fsf-Gfp mice. (D) Native reporter fluorescence in fixed wholemount tissue preparations from mouse lines indicated. Scale bars: 500 μm. (E) Native tdTomato fluorescence in fixed tissue cryosections (20 μm for stomach, 50 μm for cortex, spinal cord) from mouse lines indicated. Scale bars: 100 μm.
Figure 2 with 2 supplements

An enteroendocrine cell atlas reveals differential hormone and receptor expression.
(A) A uniform manifold approximation and projection (UMAP) plot of enteroendocrine cell transcriptomic data reveals 10 cell clusters. (B) Violin plots showing expression of genes encoding key transcriptional regulators, hormones, other secreted molecules, and receptors across enteroendocrine cell subtypes. Gene loci used for genetic targeting are highlighted with dashed boxes. (C) Normalized expression of enriched signature genes (see Figure 2—source data 1 for a gene list) in single enteroendocrine cells. The dendrogram (top) depicts the relatedness (quantified by position along the Y-axis) between cell clusters based on gene expression. (D) For each enteroendocrine cell type, examples of gene loci used for genetic targeting (top, also highlighted in B), expressed cell surface receptor genes (middle) and expressed hormone and neurotransmitter-related genes (bottom). Genes were selected among the top 30 differentially expressed genes. See Figure 2—figure supplement 1.
-
Figure 2—source data 1
Signature genes with differential expression across enteroendocrine cell types.
- https://cdn.elifesciences.org/articles/78512/elife-78512-fig2-data1-v2.xlsx
Figure 2—figure supplement 1
Analyzing cell types marked in different Cre-defined lineages.
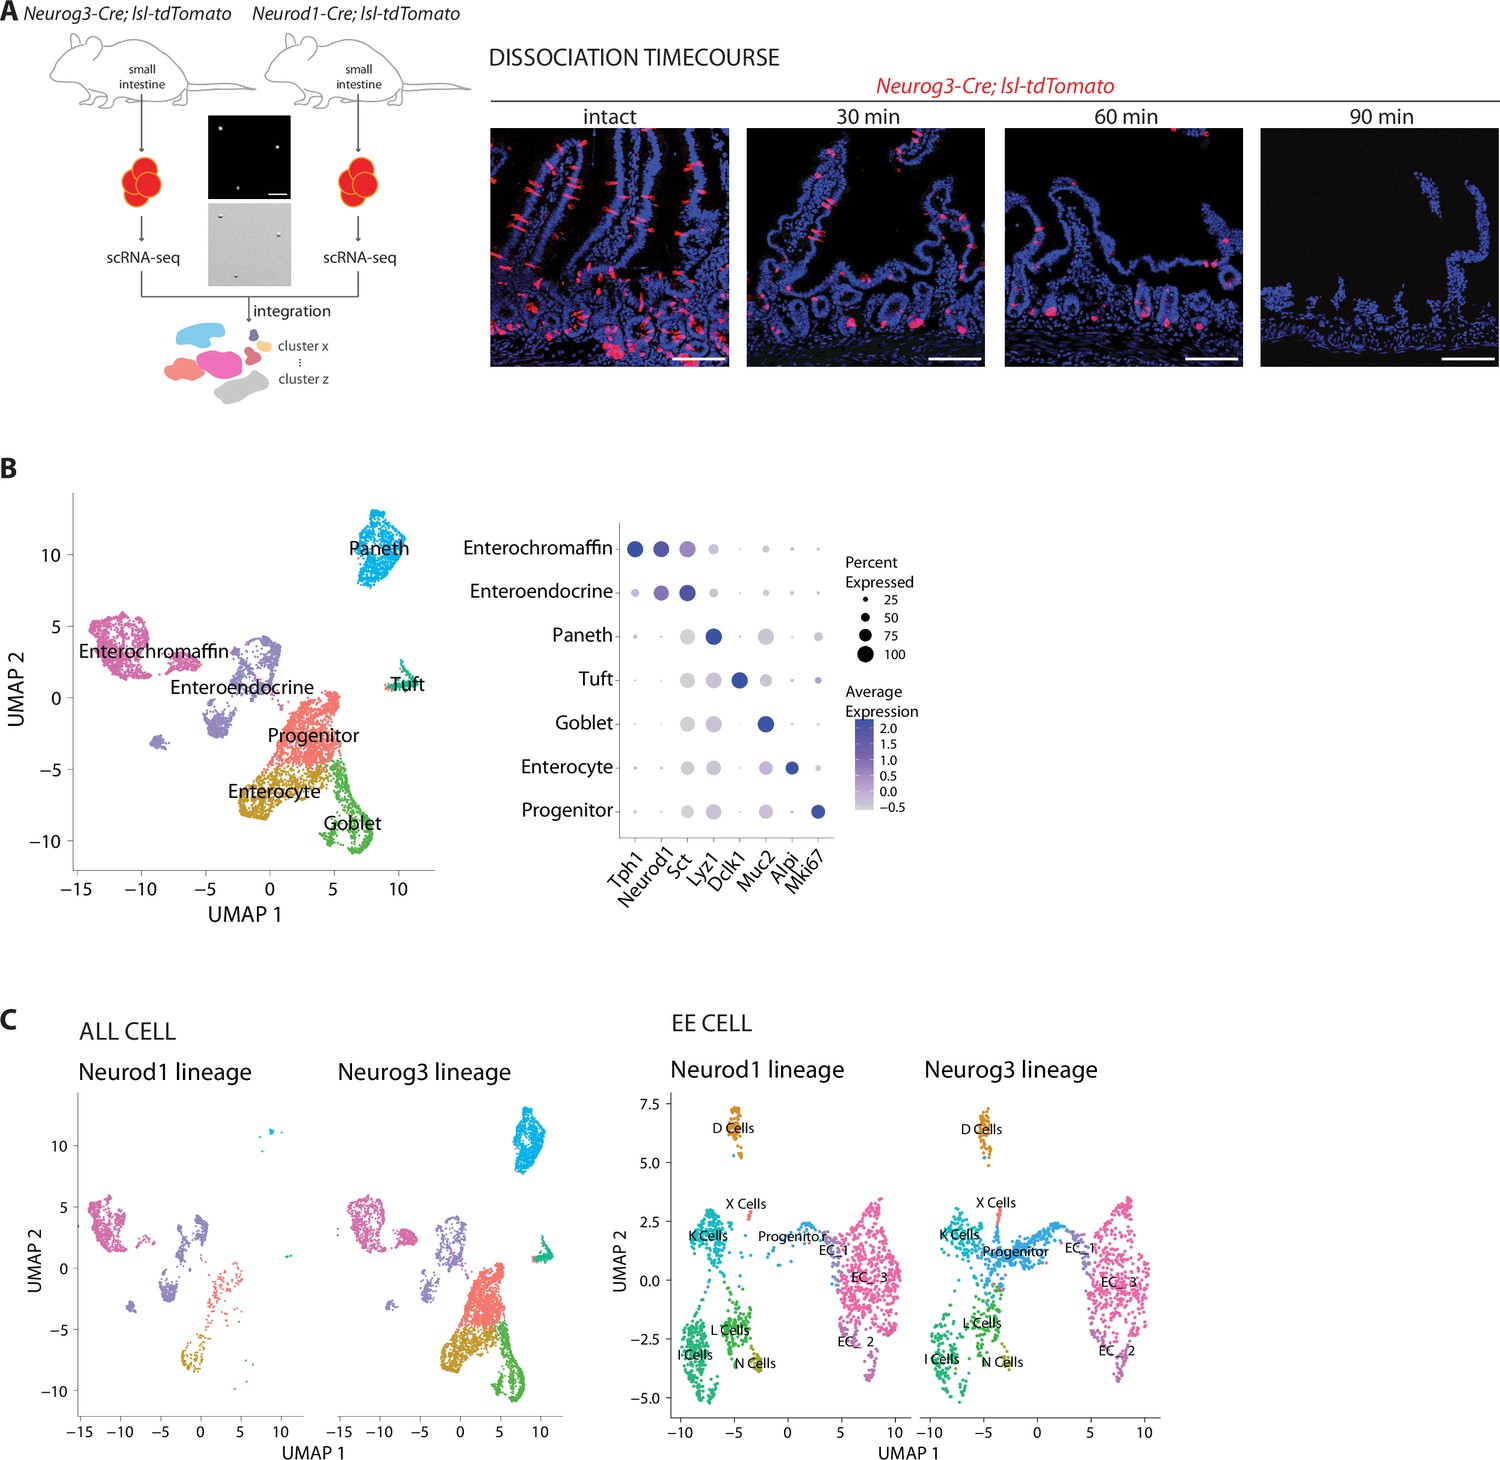
(A) Left: small intestines were collected from Neurog3-Cre; lsl-tdTomato (one male) and Neurod1-Cre; lsl-tdTomato (three females) mice. Fluorescent cells were collected by cell sorting and separately analyzed by single-cell RNA sequencing. (Center) Cell purity was determined by visualizing tdTomato fluorescence (top) and bright-field microscopy (bottom), scale bar: 100 um. Right: duodenum tissue from Neurog3-Cre; lsl-tdTomato mice was fixed at different time points after the onset of cell dissociation and analyzed for tdTomato fluorescence in 20 μm tissue cryosections. Scale bars: 100 μm. (B) (left) UMAP plot of single-cell transcriptomic data merged from both Neurog3-Cre; lsl-tdTomato and Neurod1-Cre; lsl-tdTomato mice. Cells are colored based on the expression of signature genes indicated in the dot plot on right (average expression from natural log of normalized UMI counts). (C) UMAP plots indicating all cell types (left) and enteroendocrine cell types (right) purified from Neurod1-Cre; lsl-tdTomato (Neurod1 lineage) and Neurog3-Cre; lsl-tdTomato (Neurog3 lineage) mice.
Figure 2—figure supplement 2
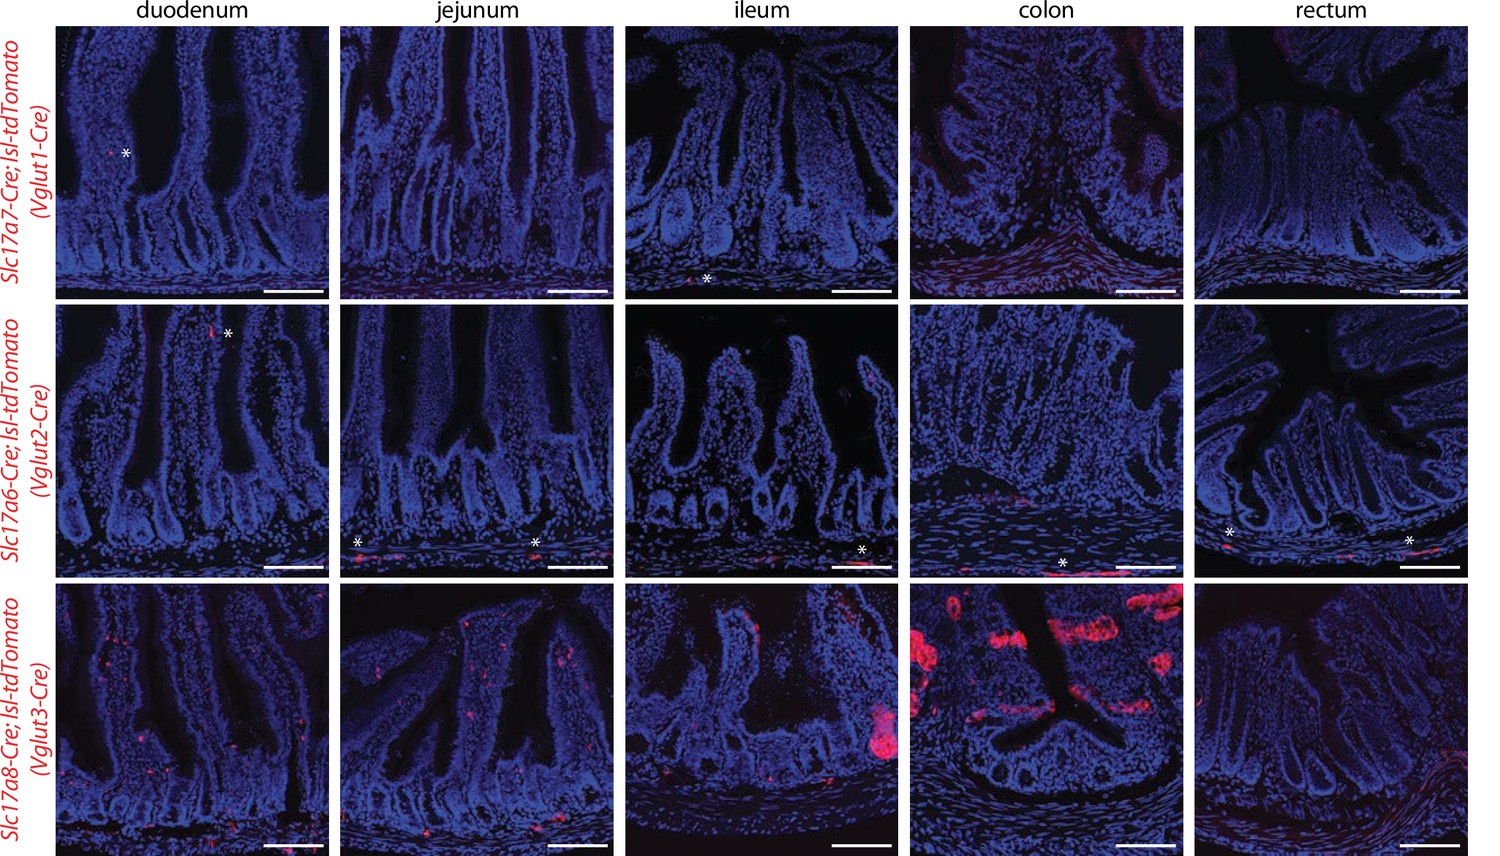
Analyzing reporter expression in intestine of Vglut-Cre mice.
Native tdTomato fluorescence in fixed intestinal cryosections (20 μm) of mouse lines indicated. Asterisks indicate labeled cells in the lamina propria or muscular layer. Scale bars: 100 μm.
Figure 3 with 4 supplements
Differential targeting of enteroendocrine cell types using intersectional genetic tools.
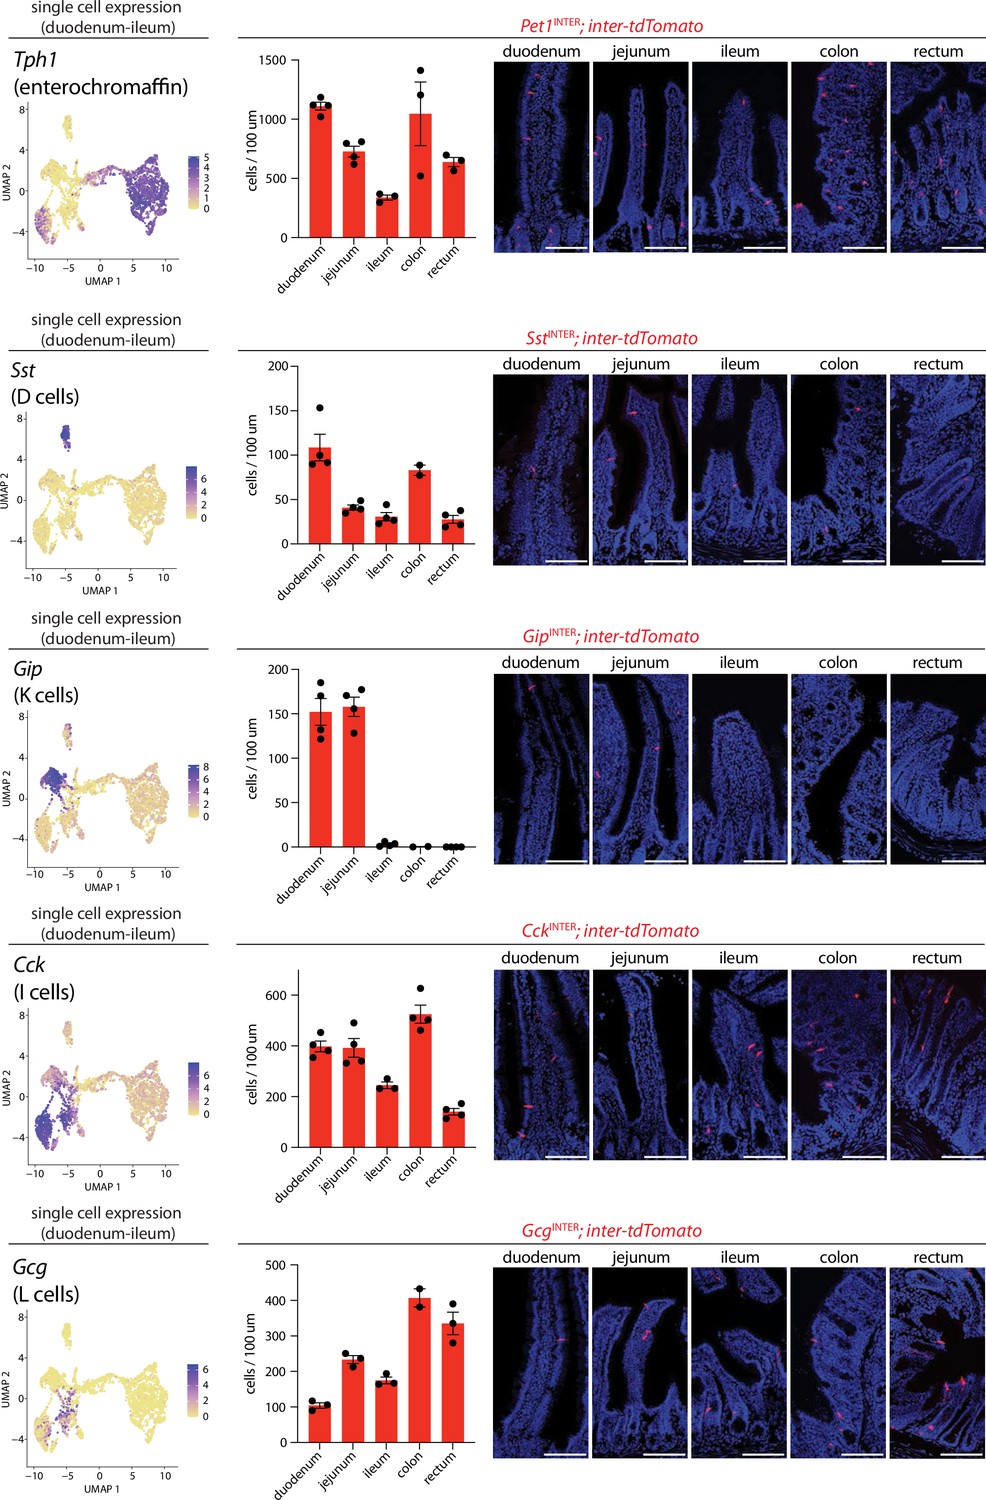
(Left) UMAP plots based on single-cell transcriptome data showing expression of indicated genes across the enteroendocrine cell atlas. (Middle) Number of cells expressing inter-tdTomato reporter in five 20 μm sections from intestinal regions of mice indicated, dots: individual animals, n: 2–4 mice, mean ± sem. (Right) Representative images of native tdTomato fluorescence in intestinal tissue from mouse lines indicated. Scale bars: 100 μm. See Figure 3—figure supplements 1–4.
Figure 3—figure supplement 1
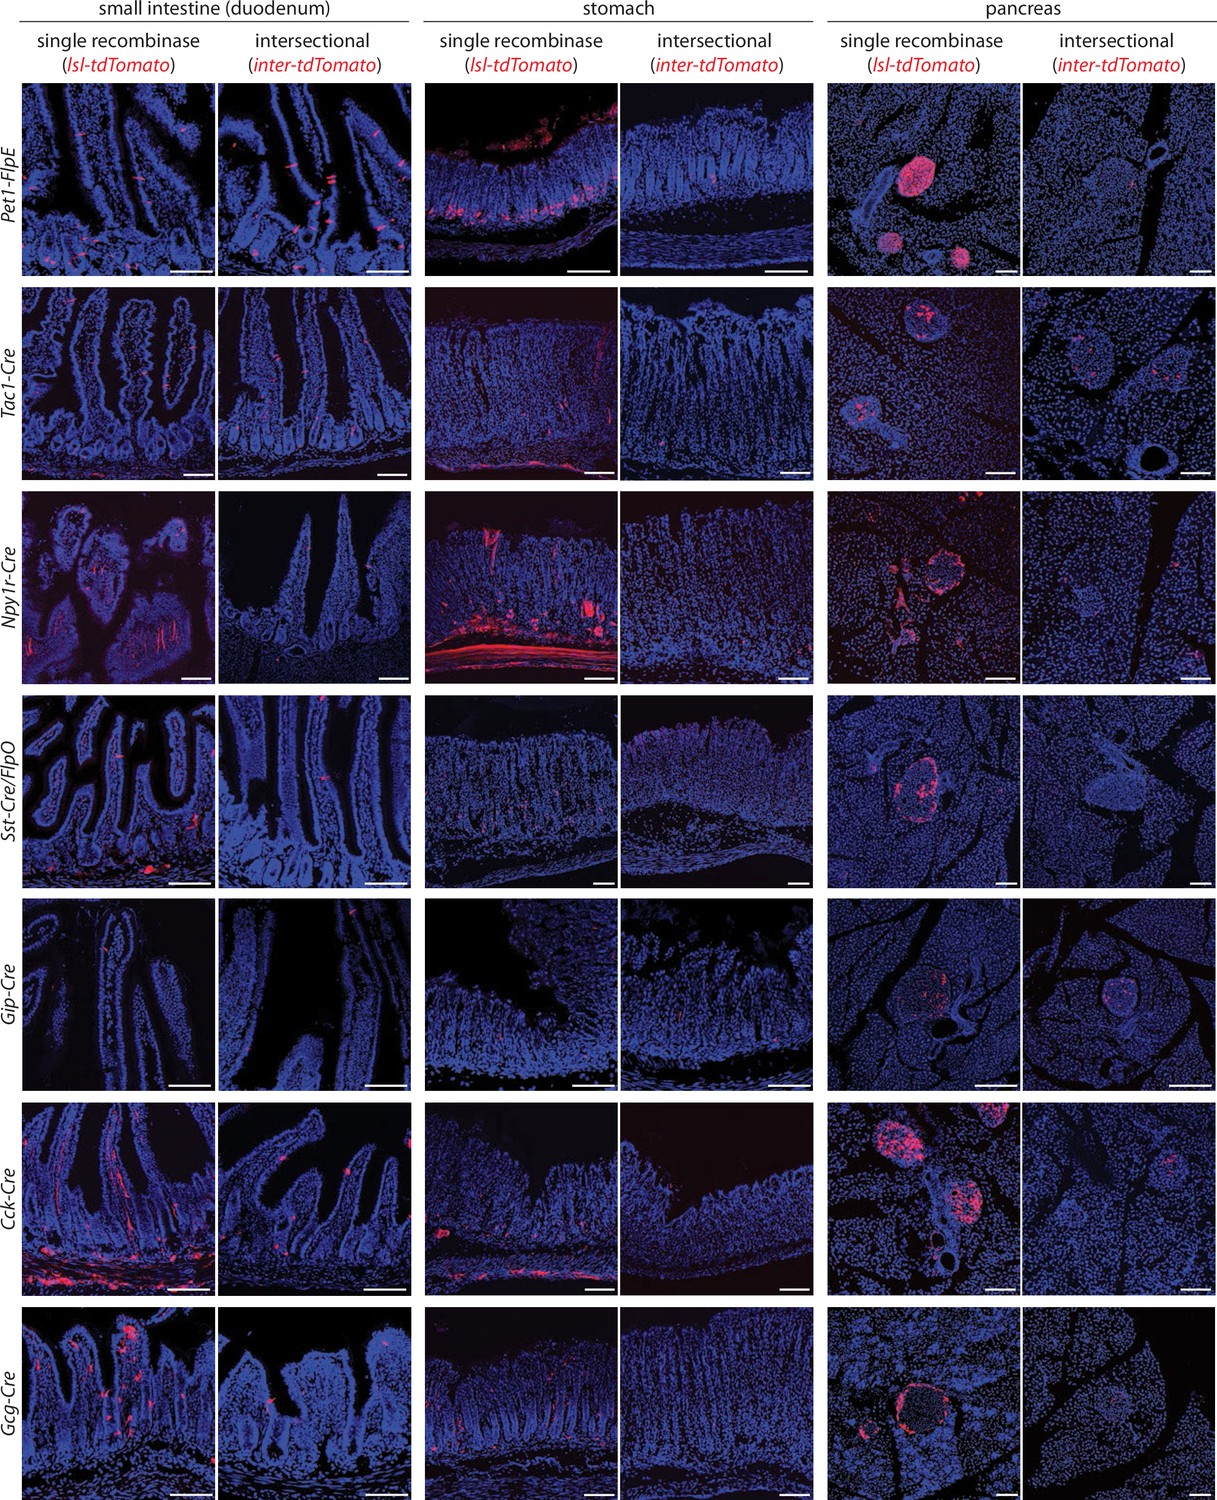
Determining selectivity of tools for intersectional genetics.
Native tdTomato fluorescence was analyzed in cryosections (20 μm) of fixed tissues indicated. Tissue was obtained from mice expressing a single recombinase (single recombinase; Cre lines indicated including Sst-ires-Cre were crossed with lsl-tdTomato, while Pet1-FlpE was crossed with fsf-Gfp and images pseudocolored in red) or two recombinases (intersectional; Cre lines indicated crossed with Vil1-p2a-FlpO and inter-tdTomato while Pet1-FlpE and Sst-ires-FlpO were crossed with Vil1-Cre and inter-tdTomato). For Gcg-Cre mice, images are taken from the ileum rather than duodenum. Scale bars: 100 μm.
Figure 3—figure supplement 2
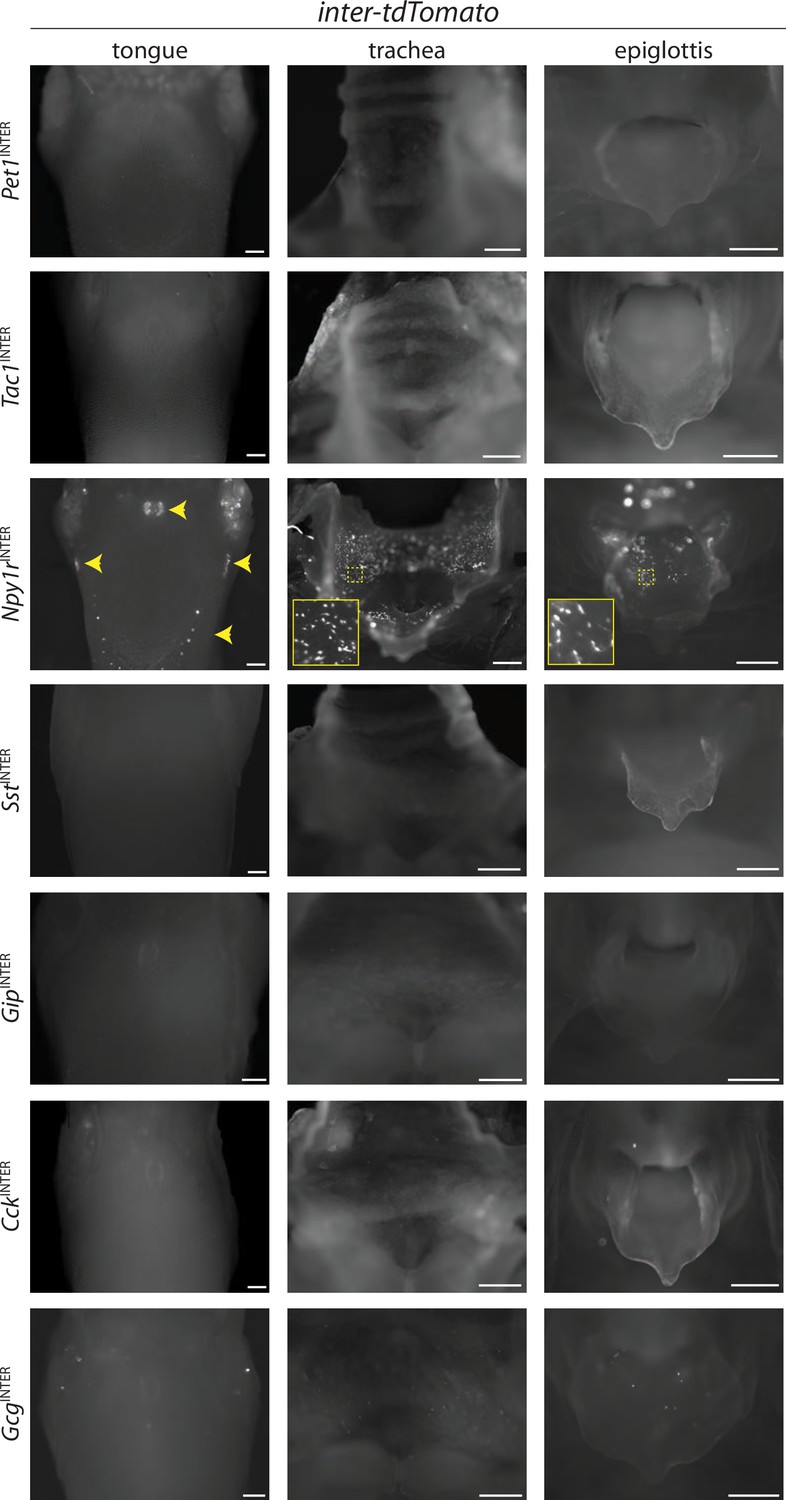
Characterization of reporter expression in the oral cavity and airways.
Mouse lines indicated were crossed to inter-tdTomato and native reporter fluorescence was analyzed in wholemount tissue preparations from fixative-perfused mice, scale bars: 500 μm.
Figure 3—figure supplement 3
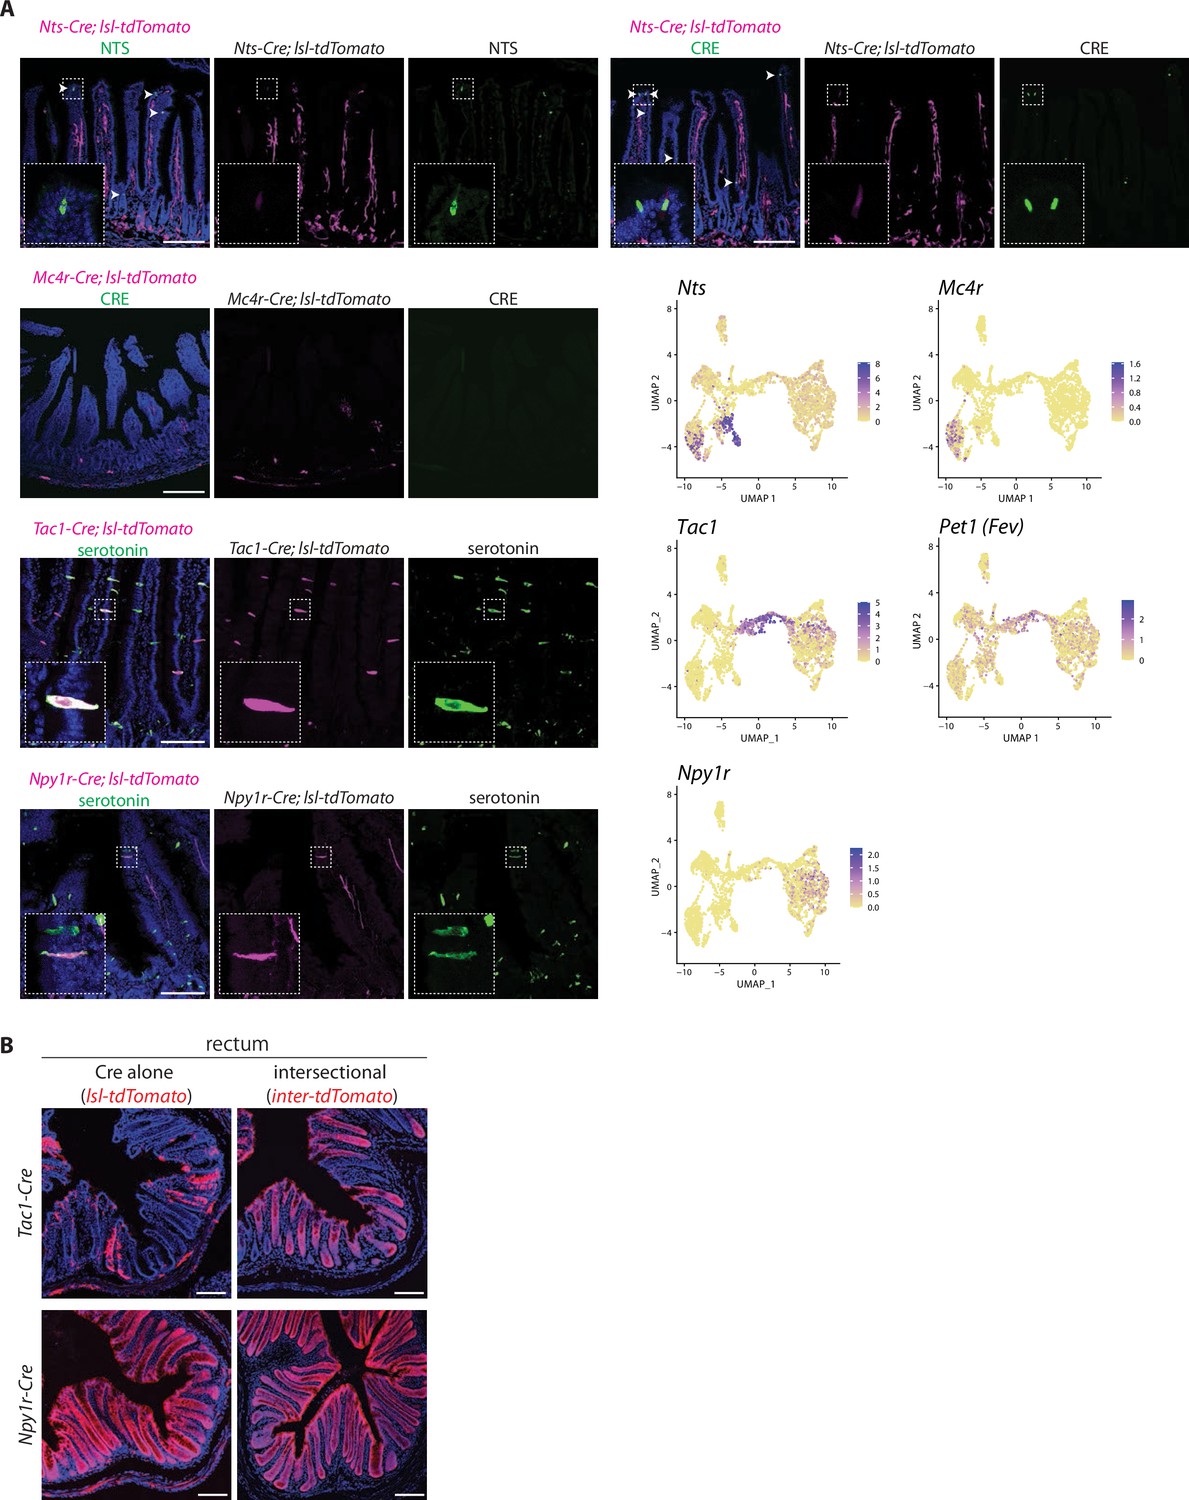
Characterization of genetic tools.
(A) Two-color analysis examining expression of tdTomato (native fluorescence, magenta) and either neurotensin (NTS), CRE, or serotonin (immunochemistry, green) in fixed intestinal cryosections (20 μm) of mouse lines indicated. UMAP plots (bottom right) indicate gene expression in single-cell RNA sequencing data from enteroendocrine cells. (B) Native tdTomato fluorescence in fixed cryosections (20 μm) from the rectum of mouse lines indicated, scale bars: 100 μm.
Figure 3—figure supplement 4
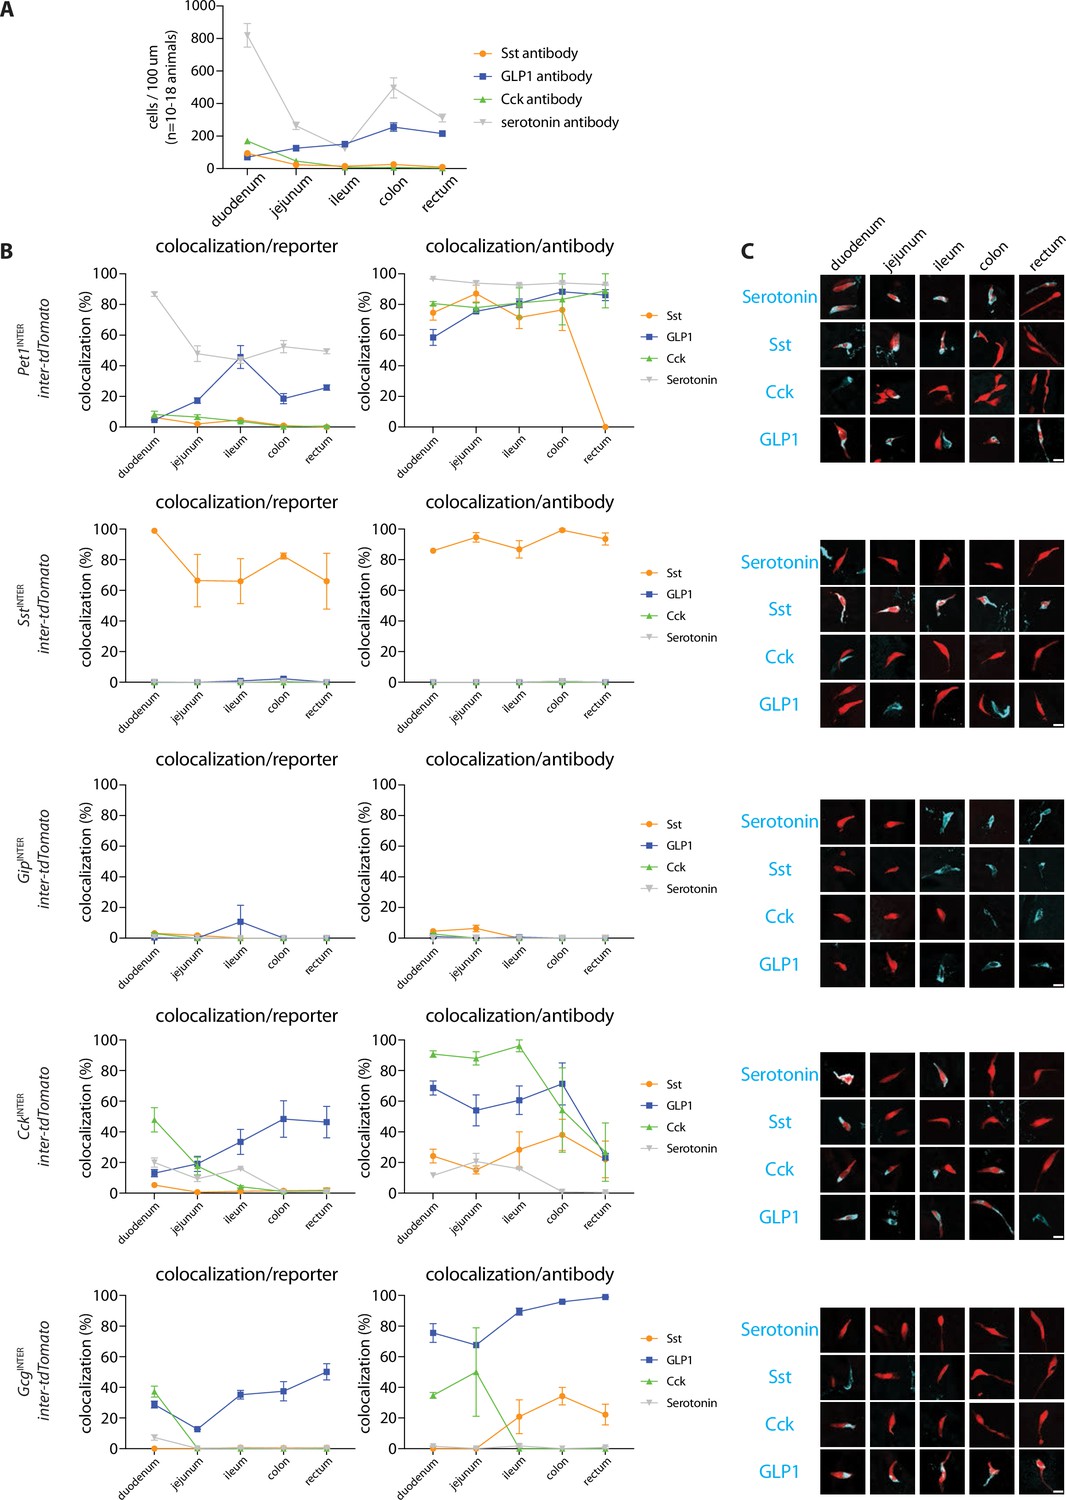
Differential targeting of enteroendocrine cell types by genetic tools.
(A) Numbers of cells labeled by hormone-targeting antibodies across five 20 μm sections in different regions of intestine. n: 2–4 mice, mean ± sem. (B) Quantification of cells expressing both inter-tdTomato and hormones indicated shown as a percentage of all reporter-expressing cells (left) or all hormone-expressing cells (right), n: 2–4 mice (see source data for more information), mean ± sem. (C) Representative images of intestinal tissue harvested from mouse lines indicated and analyzed simultaneously for expression of tdTomato (native fluorescence, red) and hormones (immunohistochemistry, cyan), scale bars: 10 μm.
-
Figure 3—figure supplement 4—source data 1
Quantification of differential targeting of enteroendocrine cell types by genetic tools.
- https://cdn.elifesciences.org/articles/78512/elife-78512-fig3-figsupp4-data1-v2.xlsx
Figure 4 with 1 supplement

Enteroendocrine cell types that accelerate or slow gut transit.
Mice of genotypes indicated were injected with CNO (IP, 3 mg/kg) and gavaged orally with charcoal dye. Intestinal tissue was harvested, and the distance between the pyloric sphincter and the charcoal dye leading edge was measured. Representative images (left) and quantification (right) of gut transit. Scale bars: 1 cm, circles: individual mice, n: 5–14 mice, mean ± sem, *p<0.05, **p<0.01 by a Mann–Whitney test with Holm–Šídák correction. See Figure 4—figure supplement 1.
-
Figure 4—source data 1
Quantification of gut transit.
- https://cdn.elifesciences.org/articles/78512/elife-78512-fig4-data1-v2.xlsx
Figure 4—figure supplement 1
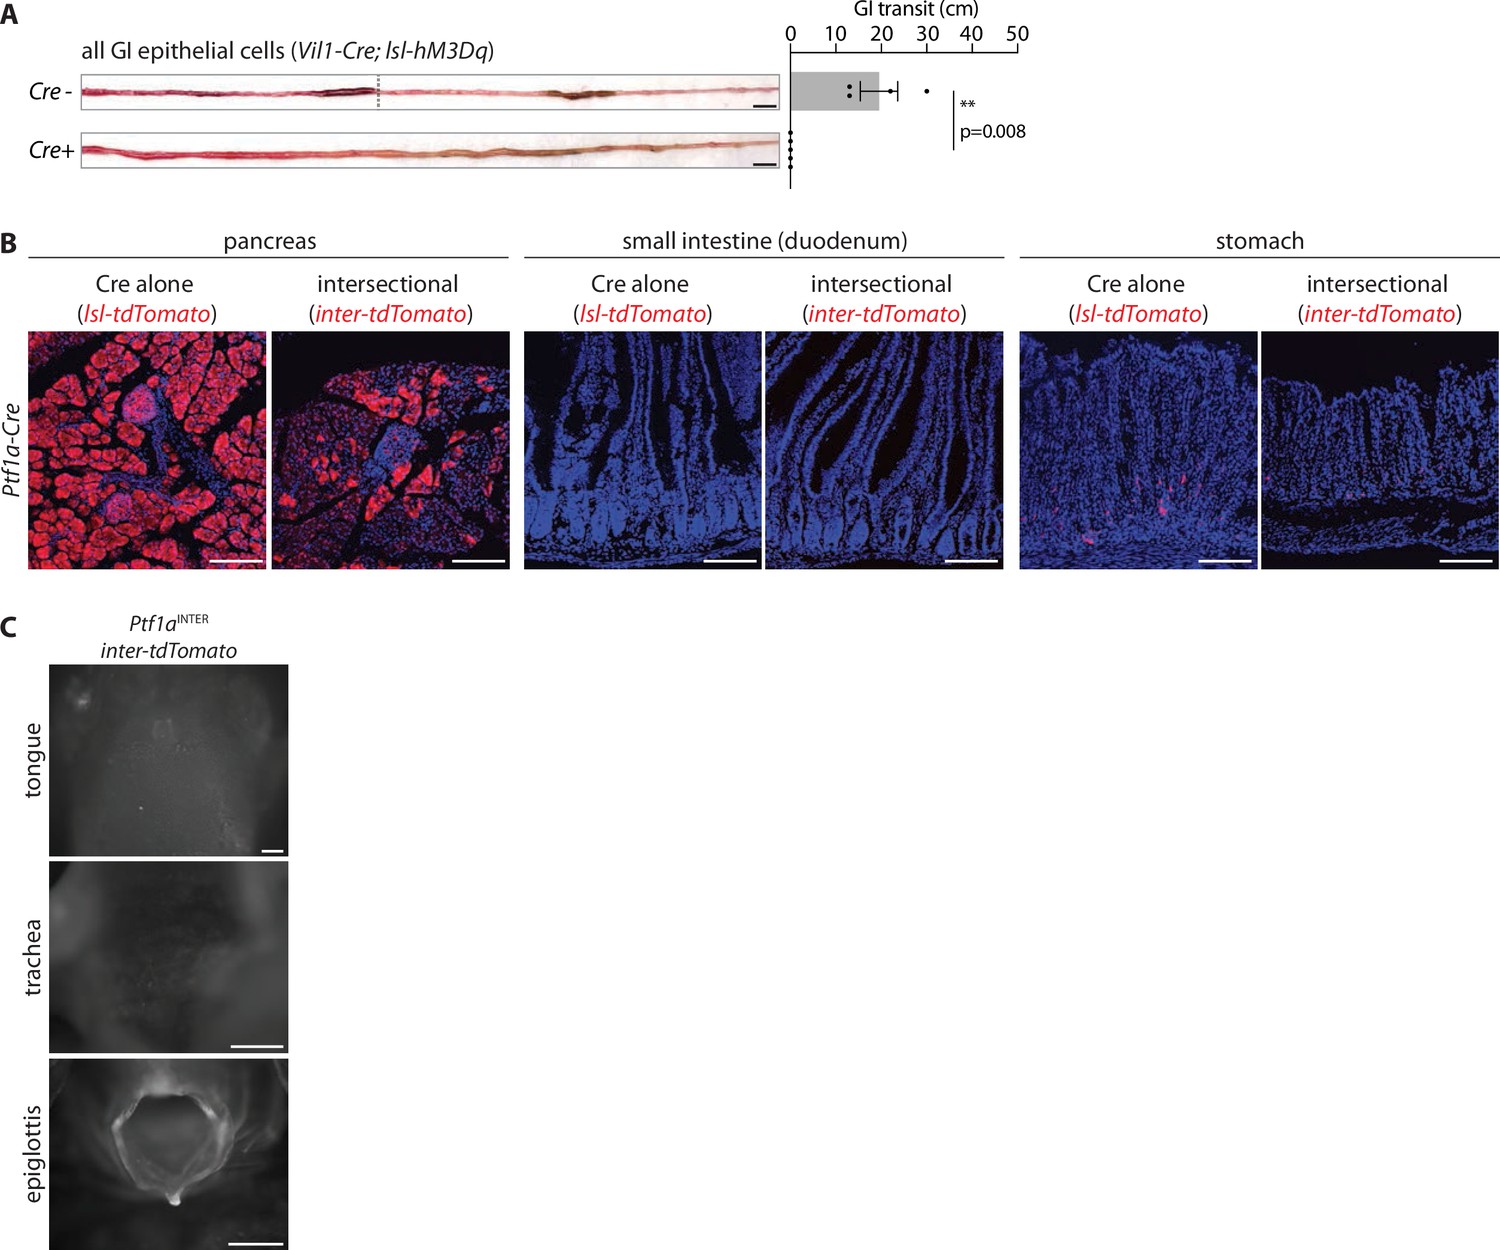
Supporting data for gut transit measurements.
(A) Mice indicated were injected with CNO (IP, 3 mg/kg), and gavaged orally with carmen red dye. Intestinal tissue was harvested and the distance between the pyloric sphincter and the dye leading edge measured. Representative images (left) and quantification (right) of gut transit, scale bar: 1 cm, circles: individual mice, n: 4–5 mice, mean ± sem, **p<0.01 by a Mann–Whitney test. (B) Native tdTomato fluorescence in fixed cryosections (20 μm) of tissues from mice indicated, scale bars: 100 μm. (C) Native reporter fluorescence was analyzed in wholemount tissue preparations indicated. Scale bars: 500 μm.
Figure 5 with 1 supplement

Enteroendocrine cell types that reduce feeding.
(A) Timeline for behavioral assay. (B) Mice of genotypes indicated were fasted overnight, injected with CNO (IP, 3 mg/kg), and total food intake was measured during 2 hr ad libitum food access, circles: individual mice, n: 8–13 mice, mean ± sem, *p<0.05 by a Mann–Whitney test with Holm–Šídák correction. See Figure 5—figure supplement 1.
-
Figure 5—source data 1
Quantification of feeding behavior.
- https://cdn.elifesciences.org/articles/78512/elife-78512-fig5-data1-v2.xlsx
Figure 5—figure supplement 1
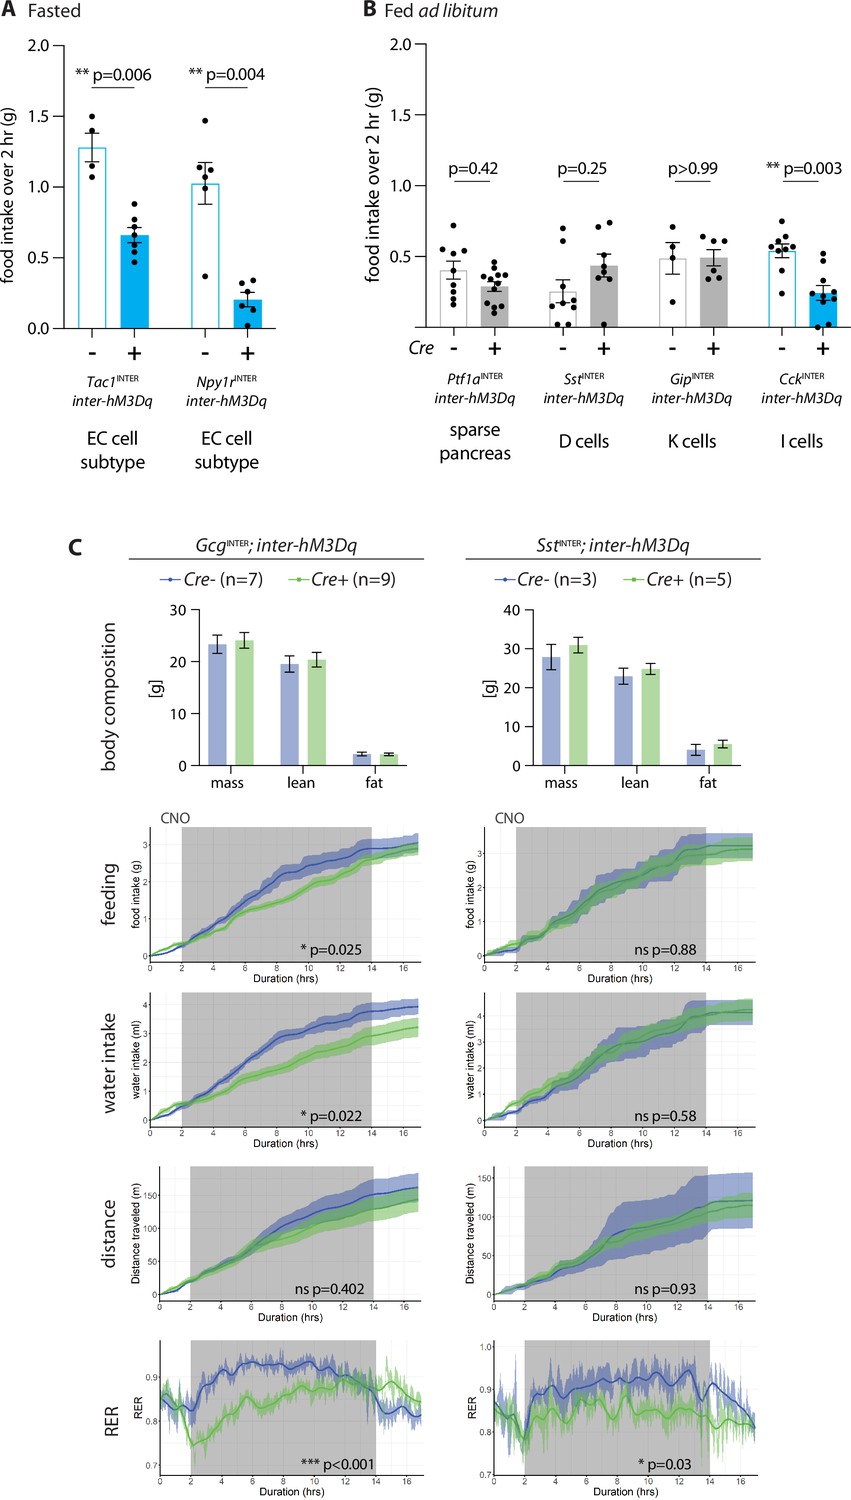
Behavioral responses to enteroendocrine cell activation.
(A) Mice of genotypes indicated were fasted overnight, injected with CNO (IP, 3 mg/kg), and total food intake was measured during 2 hr ad libitum food access, circles: individual mice, n: 4–7 mice, mean ± sem, *p<0.05 by a Mann–Whitney test with Holm–Šídák correction. (B) Effects of enteroendocrine cell activation on feeding behavior in ad libitum fed mice. Mice of genotypes indicated were injected with CNO (IP, 3 mg/kg), and total food intake was measured over 2 hr, circles: individual mice, n: 4–12 mice, mean ± sem, **p<0.01 by a Mann–Whitney tests with Holm–Šídák correction. (C) Analysis of CNO-evoked behavioral changes in genotypes indicated by a Comprehensive Lab Animal Monitoring System (CLAMS). CNO was injected 30 min prior to dark onset (dark: gray shading), n: 3–9 mice, mean ± sem, *p<0.05 by an ANCOVA (feeding, water intake) or ANOVA (distance traveled, respiratory exchange ratio or RER).
-
Figure 5—figure supplement 1—source data 1
Quantification of feeding behavior.
- https://cdn.elifesciences.org/articles/78512/elife-78512-fig5-figsupp1-data1-v2.xlsx
Figure 6
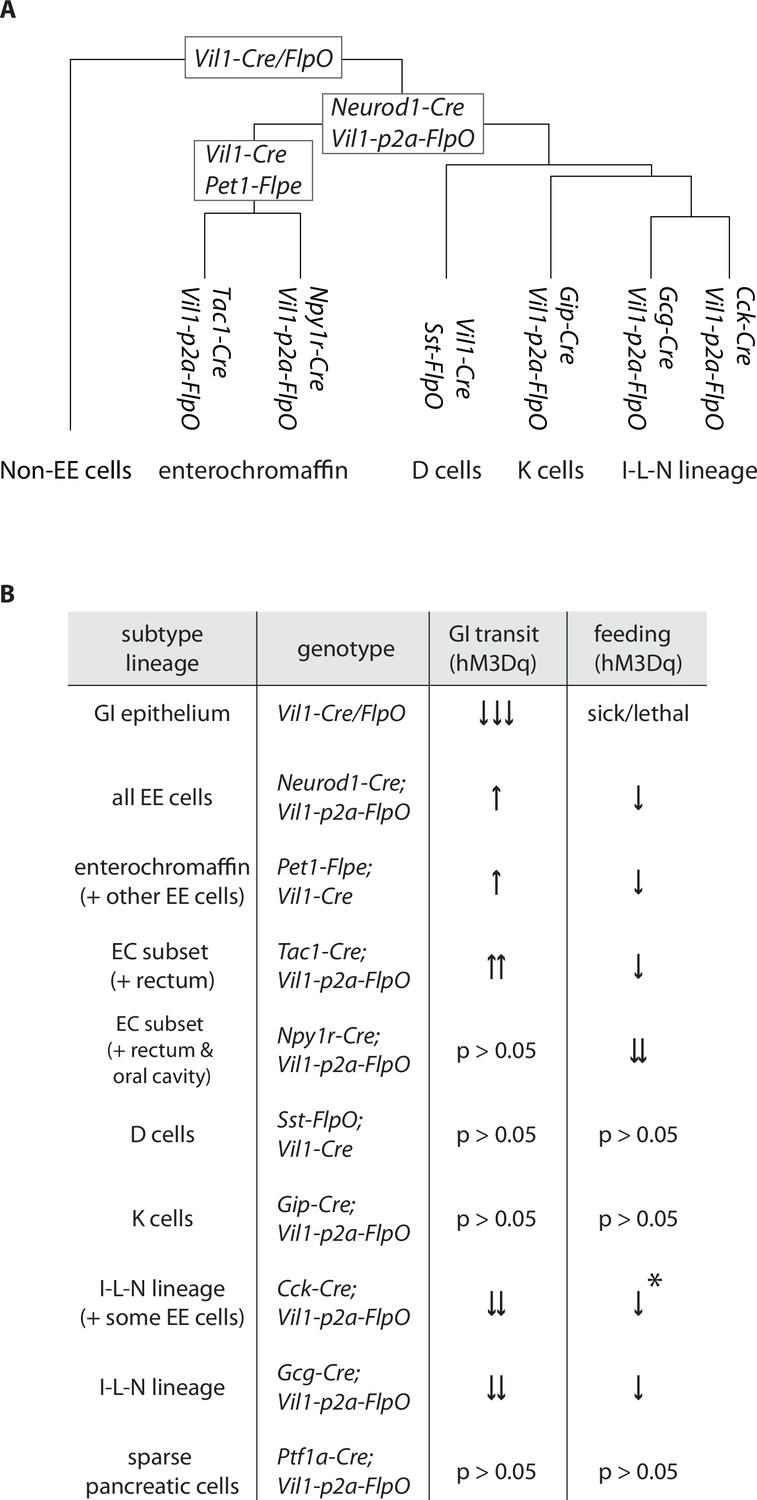
Differential regulation of physiology and behavior by enteroendocrine cell subtypes.
(A) A dendrogram depicting cell types targeted by different genetic tools. (B) Summary of feeding and gut transit data obtained for genetic tools that target different enteroendocrine cell types, *only observed in fed state.
Author response image 1

Tables
Key resources table
| Reagent type (species) or resource | Designation | Source or reference | Identifiers | Additional information |
|---|---|---|---|---|
| Strain, strain background (Mus musculus) | Atoh1-Cre knock-in | Yang et al., 2010 | ||
| Strain, strain background (M. musculus) | Pet1-FlpE | Jensen et al., 2008 | ||
| Strain, strain background (M. musculus) | Ptf1a-Cre | Kawaguchi et al., 2002 | ||
| Strain, strain background (M. musculus) | Gip-Cre | Svendsen et al., 2016 | ||
| Strain, strain background (M. musculus) | Atoh1-Cre transgenic | Jax 011104 | ||
| Strain, strain background (M. musculus) | Neurog3-Cre | Jax 006333 | ||
| Strain, strain background (M. musculus) | Neurod1-Cre | Jax 028364 | ||
| Strain, strain background (M. musculus) | Sst-ires-Cre | Jax 013044 | ||
| Strain, strain background (M. musculus) | Sst-ires-FlpO | Jax 028579 | ||
| Strain, strain background (M. musculus) | Vil1-Cre | Jax 021504 | ||
| Strain, strain background (M. musculus) | Gcg-Cre | Jax 030542 | ||
| Strain, strain background (M. musculus) | Cck-ires-Cre | Jax 012706 | ||
| Strain, strain background (M. musculus) | Nts-ires-Cre | Jax 017525 | ||
| Strain, strain background (M. musculus) | Mc4r-t2a-Cre | Jax 030759 | ||
| Strain, strain background (M. musculus) | Npy1r-Cre | Jax 030544 | ||
| Strain, strain background (M. musculus) | Tac1-ires2-Cre | Jax 021877 | ||
| Strain, strain background (M. musculus) | Rosa26CAG-lsl-tdTomato, Ai14 (lsl-tdTomato) | Jax 007914 | ||
| Strain, strain background (M. musculus) | Rosa26CAG-lsl-fsf-tdTomato, Ai65 (inter-tdTomato) | Jax 021875 | ||
| Strain, strain background (M. musculus) | Rosa26CAG-fsf-eGFP-FLEX-hM3Dq-mCherry, (inter-hM3Dq-mCherry) | Jax 026943 | ||
| Strain, strain background (M. musculus) | lsl-hM3Dq | Jax 026220 | ||
| Strain, strain background (M. musculus) | C57BL/6 | Jax 000664 | ||
| Strain, strain background (M. musculus) | Vil1-p2a-FlpO | This paper | ||
| Commercial assay or kit | Chromium single-cell 3’ reagent kit v3 | 10X Genomics | ||
| Peptide, recombinant protein | TrypLE express | Thermo Fisher 12604013 | ||
| Other | FBS | VWR 10802-772 | 5% See ‘Single-cell RNA sequencing’ | |
| Peptide, recombinant protein | DNase | Worthington Biochemical LK003172 | 100 U/ml | |
| Other | TO-PRO-3 | Thermo Fisher T3605 | 1:10,000 See ‘Single-cell RNA sequencing’ | |
| Other | Calcein Violet | Thermo Fisher 65-0854-39 | 1:10,000 See ‘Single-cell RNA sequencing’ | |
| Other | Normal donkey serum | Jackson Immuno 017-000-121 | 5% See ‘Tissue histology’ section | |
| Other | Bovine serum albumin | Jackson Immuno 001-000-161 | 1% See ‘Tissue histology’ | |
| Other | DAPI Fluoromount-G | Southern Biotech 0100-20 | See ‘Tissue histology’ | |
| Antibody | Anti-CCK (rabbit polyclonal) | Abcam ab27441 | 1:1000 | |
| Antibody | Anti-CRE (rabbit polyclonal) | Cell Signaling 15036 | 1:500 | |
| Antibody | Anti-GLP1 (rabbit polyclonal) | Novus 2622B MAB10473 | 1:2000 | |
| Antibody | Anti-NTS (rabbit polyclonal) | Immunostar 20072 | 1:2000 | |
| Antibody | Anti-SST (rabbit polyclonal) | Novus 906552 MAB2358 | 1:1000 | |
| Antibody | Anti-5HT (goat polyclonal) | Abcam ab66047 | 1:2000 | |
| Antibody | Donkey anti-rabbit Alexa488 | Jackson Immuno 711-545-152 | 1:500 | |
| Antibody | Donkey anti-rabbit AlexaCy3 | Jackson Immuno 711-165-152 | 1:500 | |
| Antibody | Donkey anti-rabbit AlexaCy5 | Jackson Immuno 711-175-152 | 1:500 | |
| Antibody | Donkey anti-rabbit Alexa680 | Thermo Fisher A32802 | 1:500 | |
| Antibody | Donkey anti-goat Alexa488 | Jackson Immuno 705-545-147 | 1:500 | |
| Chemical compound, drug | Clozapine N-oxide dihydrochloride | Fisher Scientific Tocris 6329/10 | 3 mg/kg |
Additional files
Download links
A two-part list of links to download the article, or parts of the article, in various formats.
Downloads (link to download the article as PDF)
Open citations (links to open the citations from this article in various online reference manager services)
Cite this article (links to download the citations from this article in formats compatible with various reference manager tools)
Enteroendocrine cell lineages that differentially control feeding and gut motility
eLife 12:e78512.
https://doi.org/10.7554/eLife.78512


