Brain-wide screen of prelimbic cortex inputs reveals a functional shift during early fear memory consolidation
- Laboratory of Neuroepigenetics, Brain Mind Institute, School of Life Sciences, Ecole Polytechnique Fédérale de Lausanne, Switzerland
Figures
Figure 1
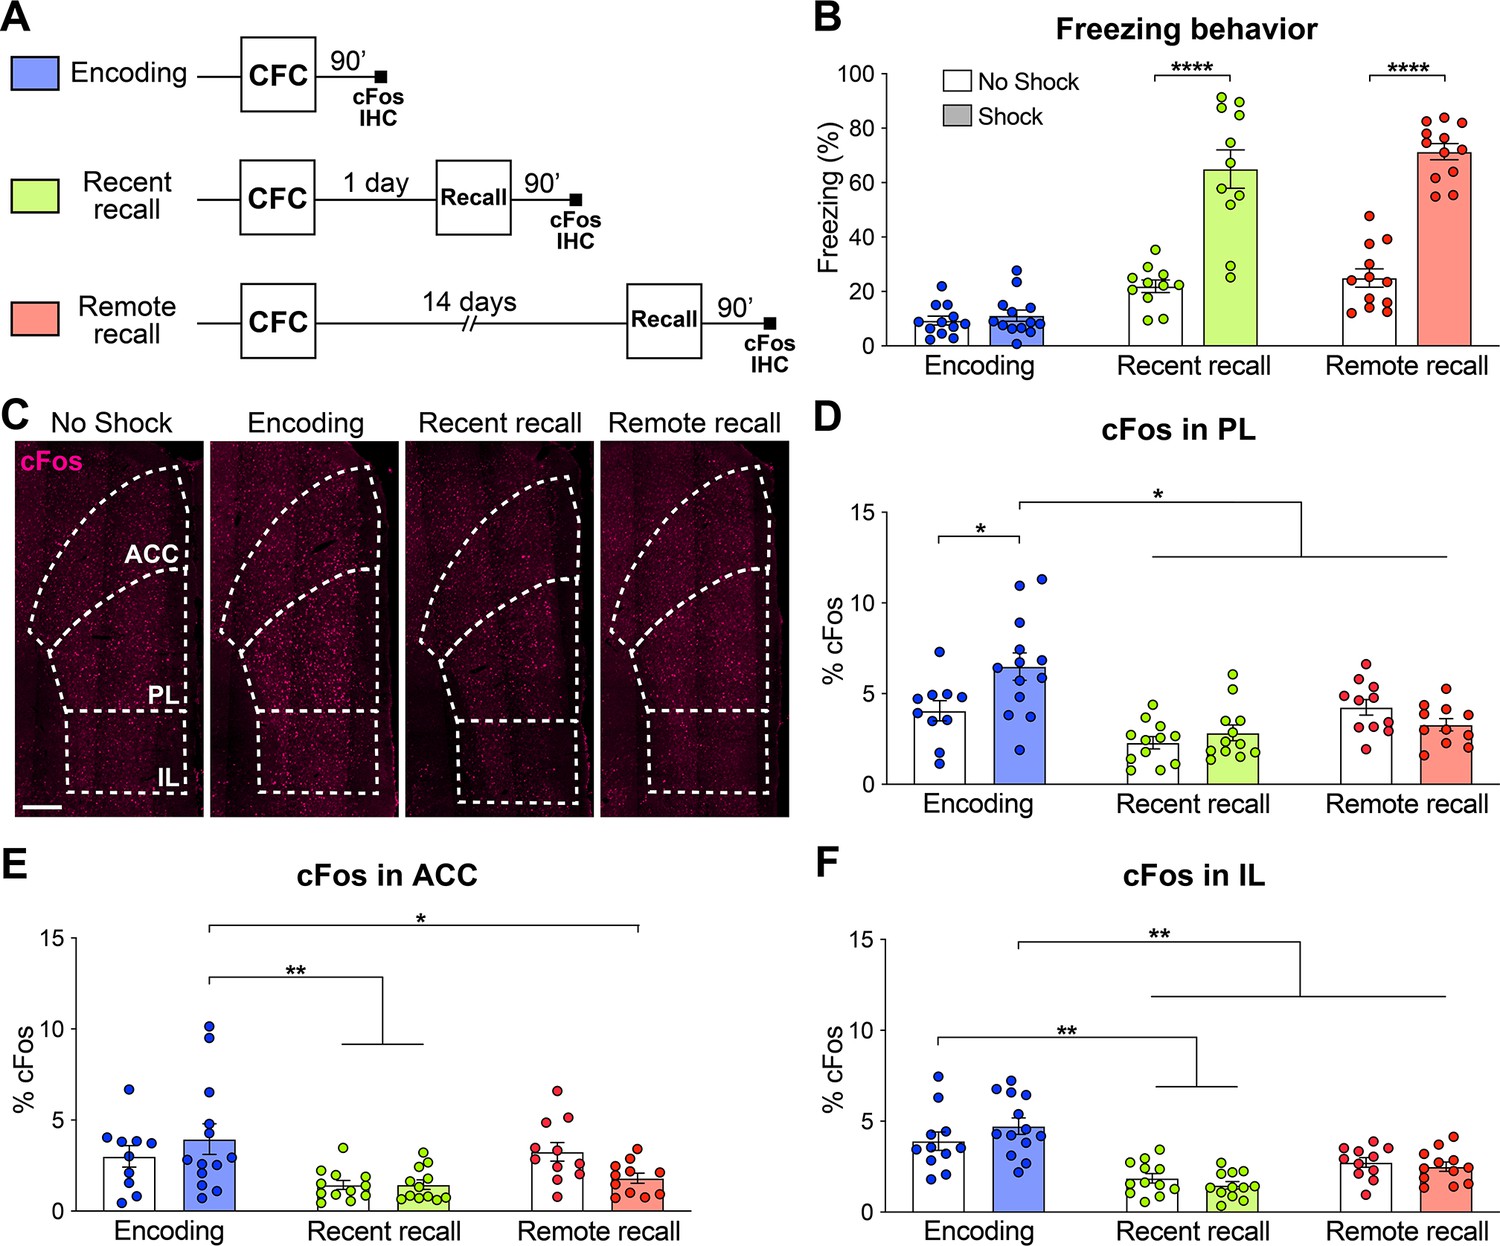
The prelimbic cortex (PL) is activated by the encoding of a contextual fear memory.
(A) Experimental design. For encoding, mice were perfused 90 min after contextual fear conditioning (CFC). For recent and remote recalls, mice were perfused 90 min after a 1 day and a 14 day recall, respectively. (B) Percentage freezing measured during the 3 min of habituation before the shocks (encoding, in blue), at recent (in green) or remote (in red) memory recalls, for the animals undergoing CFC (shock, filled) and the control groups that were exposed to the CFC chamber without the shock (no shock, clear). Two-tailed unpaired t-tests, ****: p<0.0001. At recent recall, Cohen’s d=2.48; at remote recall, Cohen’s d=4.24. (C) Representative images of cFos immunostainings in the medial prefrontal cortex (mPFC). Scale: 250 µm. (D–F) Percentage of cFos over DAPI in (D) PL (one-way-ANOVA, F(5, 63)=9.172, p<0.0001), (E) anterior cingulate cortex (ACC) (one-way ANOVA, F(5, 63)=4.394, p=0.0017) and (F) infralimbic cortex (IL) (one-way ANOVA, F(5, 65)=13.34, p<0.0001). (D–F) Stars represent least significant p-values of Tukey’s multiple comparisons tests: *: 0.01 < p < 0.05; **: 0.001 < p < 0.01. n=11–13 animals per group.
-
Figure 1—source data 1
Raw data for Figure 1.
- https://cdn.elifesciences.org/articles/78542/elife-78542-fig1-data1-v1.xlsx
Figure 2 with 1 supplement
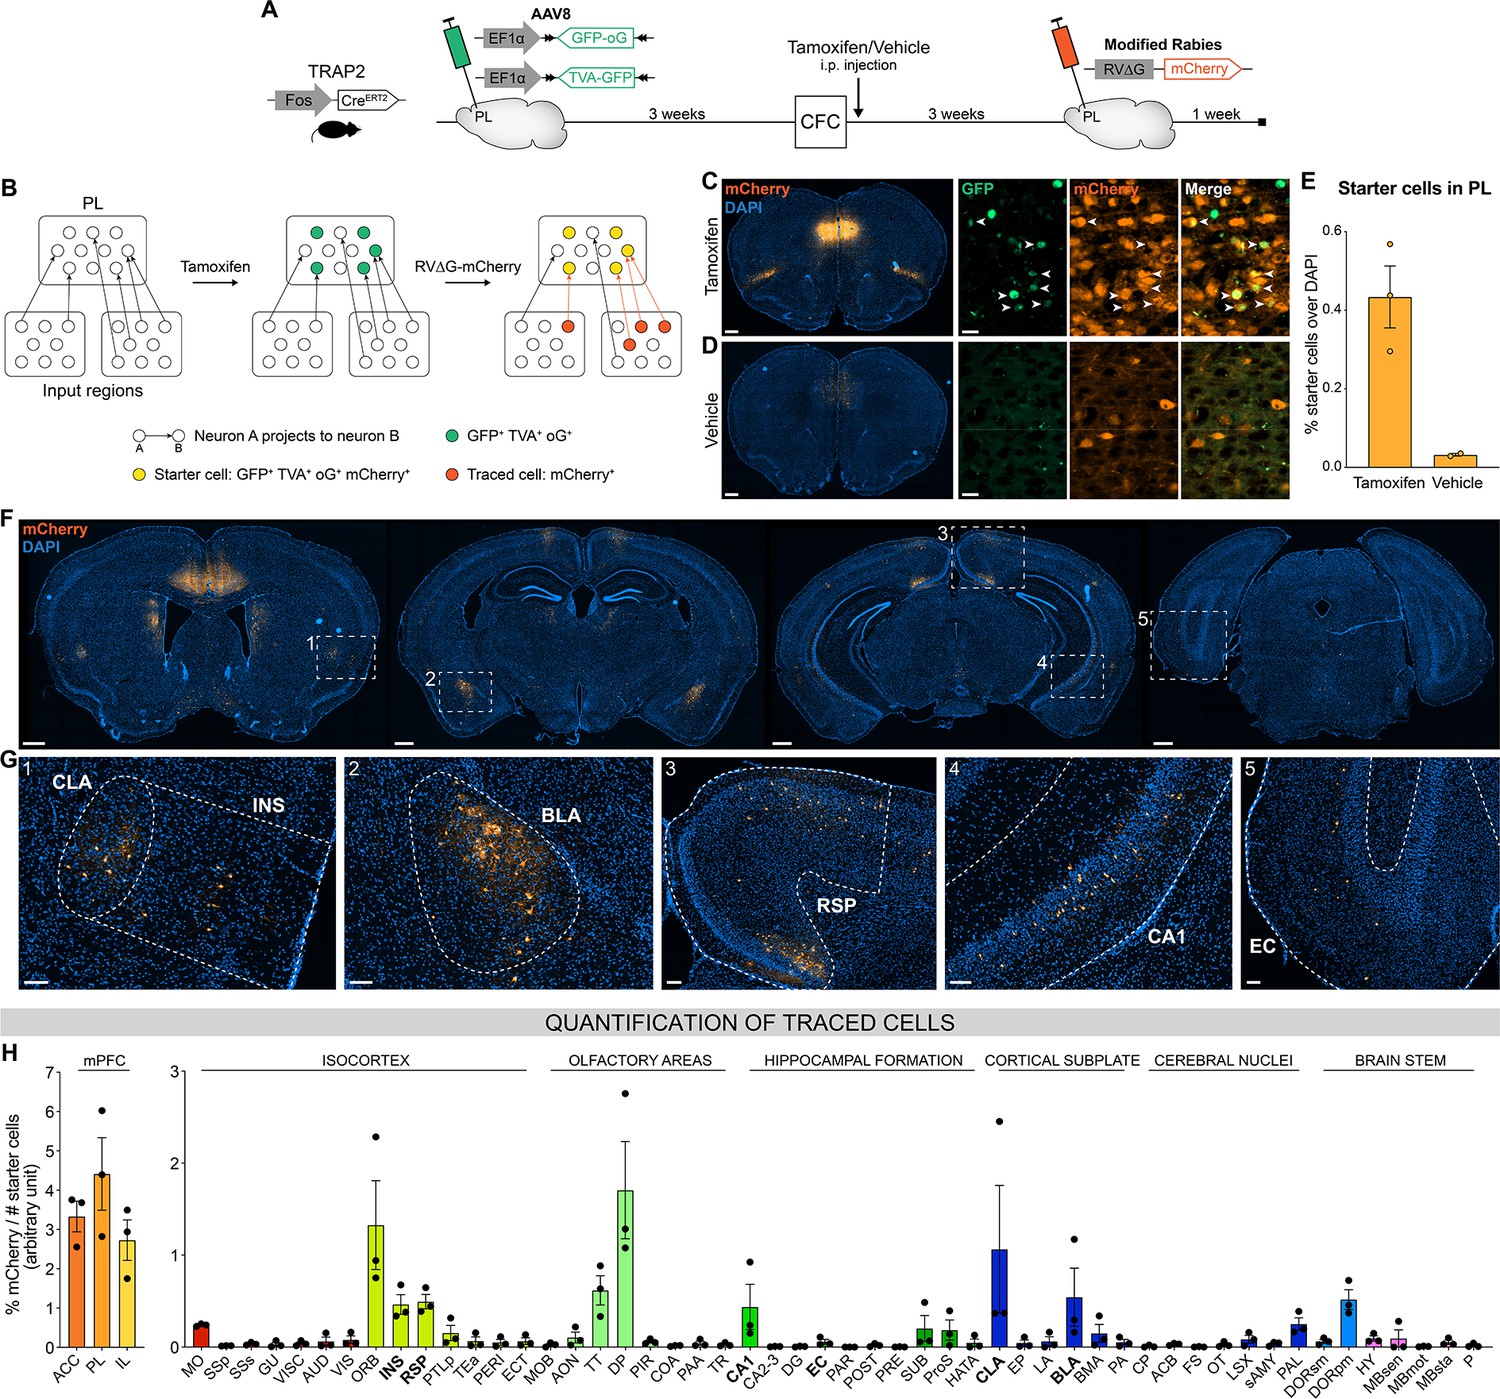
Brain-wide retrograde tracing identifies monosynaptic inputs of prelimbic cortex (PL) engram cells.
(A–B) Experimental design and timeline. Fos-CreERT2 animals were first injected in the PL with helper adeno-associated viruses (AAVs) expressing GFP, TVA receptor, and oG (rabies optimized glycoprotein) in a Cre-dependent manner. Tamoxifen (or vehicle for control) was injected right after contextual fear conditioning (CFC) to trigger recombination in cFos+ cells. Three weeks later, a modified rabies virus (RV∆G-mCherry with EnvA coating) was injected in PL where it infected TVA-expressing cells, replicated in oG-expressing cells, and was retrogradely transsynaptically transported. A week later, brains were collected to quantify monosynaptic inputs of PL engram cells labelled with mCherry. (C, D) Representative images of the PL injection site (scale 400 µm) and magnified view of starter cells (scale 20 µm) with tamoxifen (C) or vehicle (D) injection. (E) Percentage of starter cells over DAPI in PL. (F) Representative images of traced cells throughout the brain (scale 500 µm). (G) Magnified views of traced cells (scale 100 µm) in claustrum (CLA) (inset 1), insular cortex (INS) (1), basolateral amygdala (BLA) (2), retrosplenial cortex (RSP) (3), ventral CA1 (vCA1) (4), and entorhinal cortex (EC) (5). (H) Brain-wide quantification of traced cells, normalized by the number of starter cells for each animal, in the medial prefrontal cortex (mPFC) subregions (left) and the rest of the brain (right). Tamoxifen: n=3 animals; vehicle: n=2 animals.
-
Figure 2—source data 1
Raw data for Figure 2 and its supplement.
- https://cdn.elifesciences.org/articles/78542/elife-78542-fig2-data1-v1.xlsx
-
Figure 2—source data 2
Abbreviations for the brain regions.
- https://cdn.elifesciences.org/articles/78542/elife-78542-fig2-data2-v1.docx
Figure 2—figure supplement 1
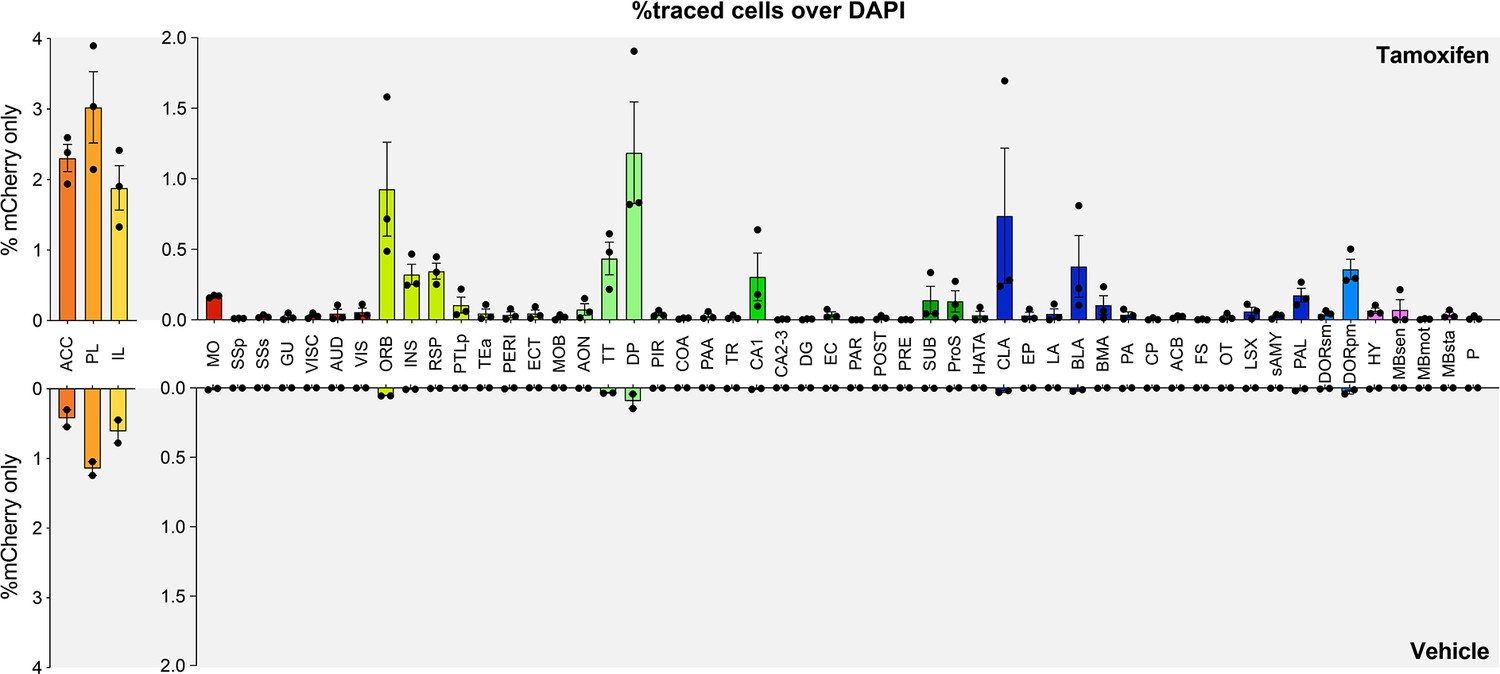
Raw quantifications of the rabies tracing experiment.
Percentage of traced cells (mCherry+ only) in all regions with tamoxifen (top, n=3 animals) or vehicle (bottom, n=2 animals).
Figure 3 with 2 supplements
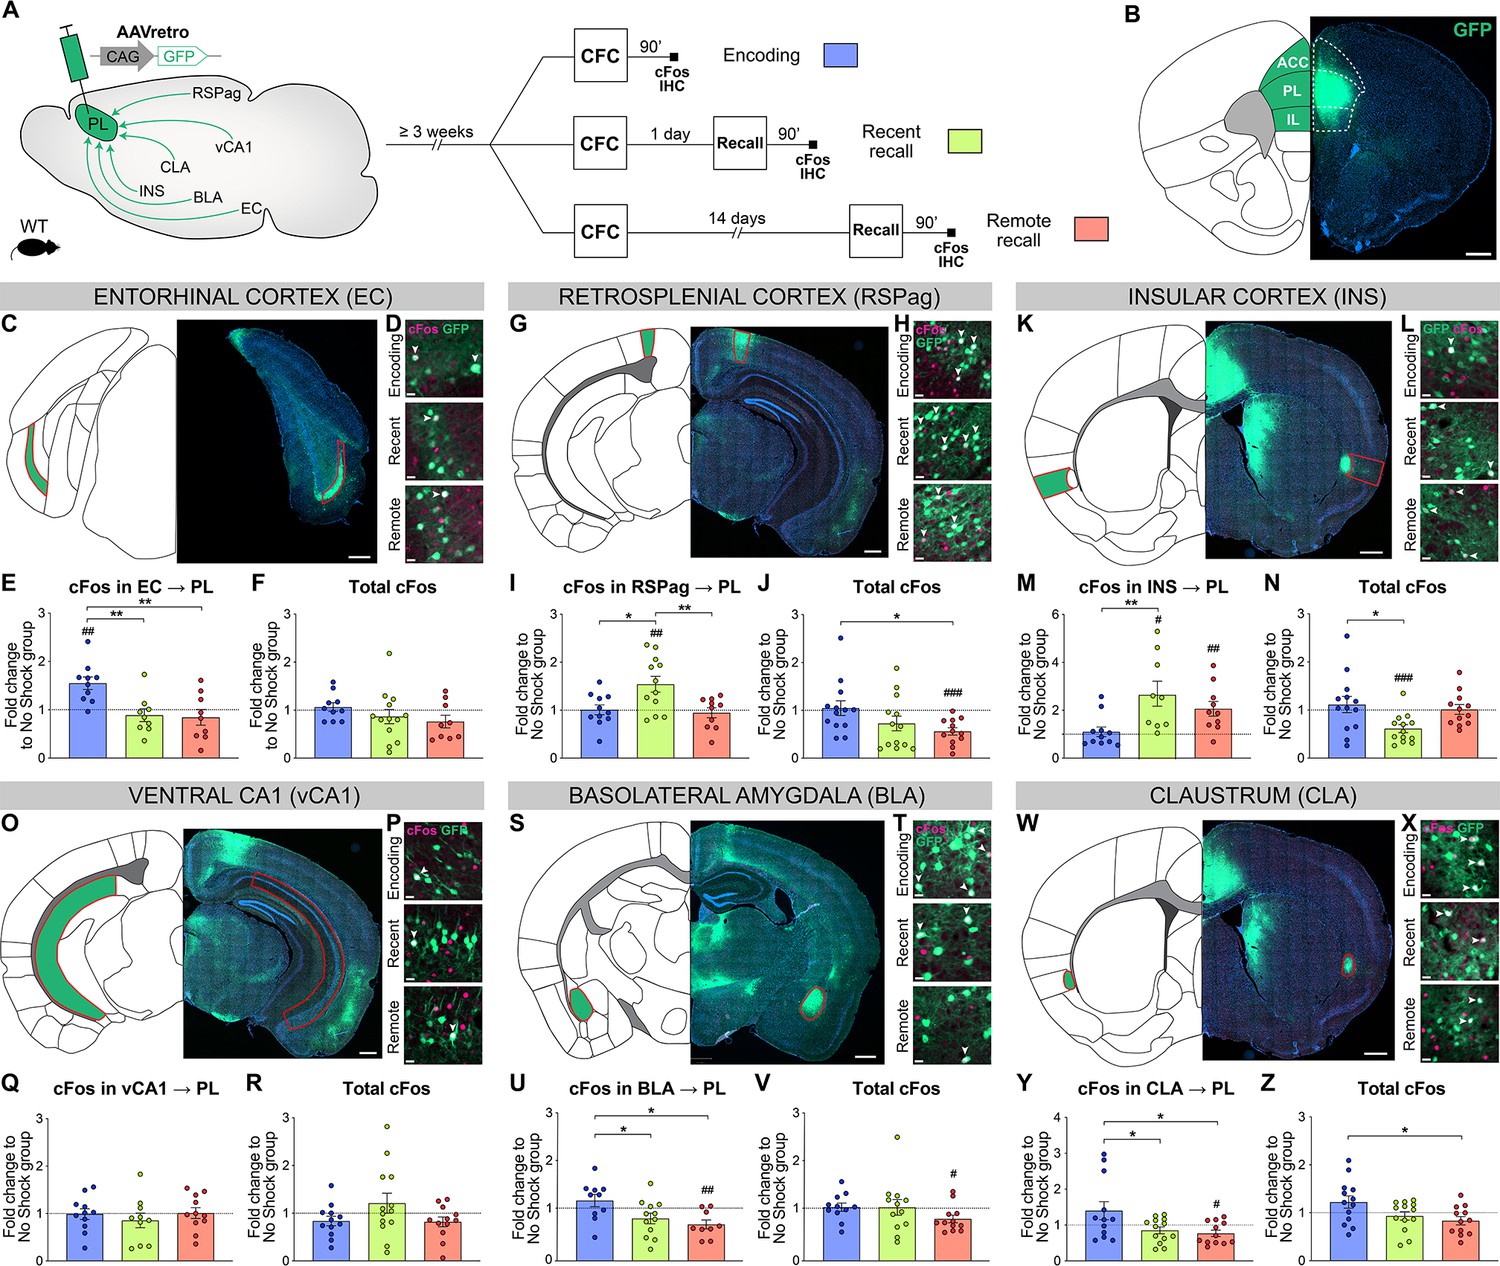
Prelimbic cortex (PL) inputs are differentially activated during memory consolidation.
(A) Experimental design, injection of AAVretro-GFP in the PL for input tracing, and quantification of activation by cFos immunostaining 3 weeks later at either contextual fear conditioning (CFC) encoding (blue), recent (green), or remote (red) recall. Brains were collected 90 min after the behavior session. (B) Representative image of AAVretro-GFP injection site in the PL region of the medial prefrontal cortex (mPFC). Scale: 500 µm. (C–Z) For each region: Representative image of PL input tracing, magnified view of GFP and cFos at encoding, recent, and remote time points (all scales: 20 µm); quantifications of cFos in PL projections and total cFos in the input region, expressed as fold change to the no shock control group. Note that cFos in PL projections values were first normalized by chance level for each animal (see Figure 3—figure supplement 1). (C–F) EC (C, scale 500 µm), (E) cFos in EC → PL (one-way ANOVA, F(2,25)=8.153, p=0.0019) and (F) total cFos. (G–J) RSPag (G, scale 400 µm), (I) cFos in RSPag → PL (one-way ANOVA, F(2,35)=3.275, p=0.0497) and (J) total cFos (one-way ANOVA, F(2,35)=3.275, p=0.0497). (K–N) INS (K, scale 500 µm), (M) cFos in INS → PL (one-way ANOVA, F(2,27)=5.405 p=0.0106) and (N) total cFos (one-way ANOVA, F(2,35)=4.583, p=0.0171). (O–R) vCA1 (O, scale 400 µm), (Q) total cFos and (R) cFos in vCA1 → PL. (S–V) basolateral amygdala (BLA) (S, scale 500 µm), (U) cFos in BLA → PL (one-way ANOVA, F(2,28)=4.922, p=0.0147) and (V) total cFos. (W–Z) claustrum (CLA) (W, scale 500 µm), (Y) cFos in CLA → PL (one-way ANOVA, F(2,34)=4.502, p=0.0184), and (Z) total cFos (one-way ANOVA, F(2,35)=3.833, p=0.0313). Stars represent p-values of Tukey’s multiple comparisons tests (*: 0.01 < p < 0.05; **: 0.001 < p < 0.01), hashtag signs represent p-values of two-tailed one-sample t-tests comparing the difference to 1, which represents levels of the no shock controls (#: p≤0.05; ##: 0.001 < p ≤ 0.01; ###: p≤0.001). n=9–13 animals per group.
-
Figure 3—source data 1
Raw data for Figure 3 and its supplements.
- https://cdn.elifesciences.org/articles/78542/elife-78542-fig3-data1-v1.xlsx
Figure 3—figure supplement 1
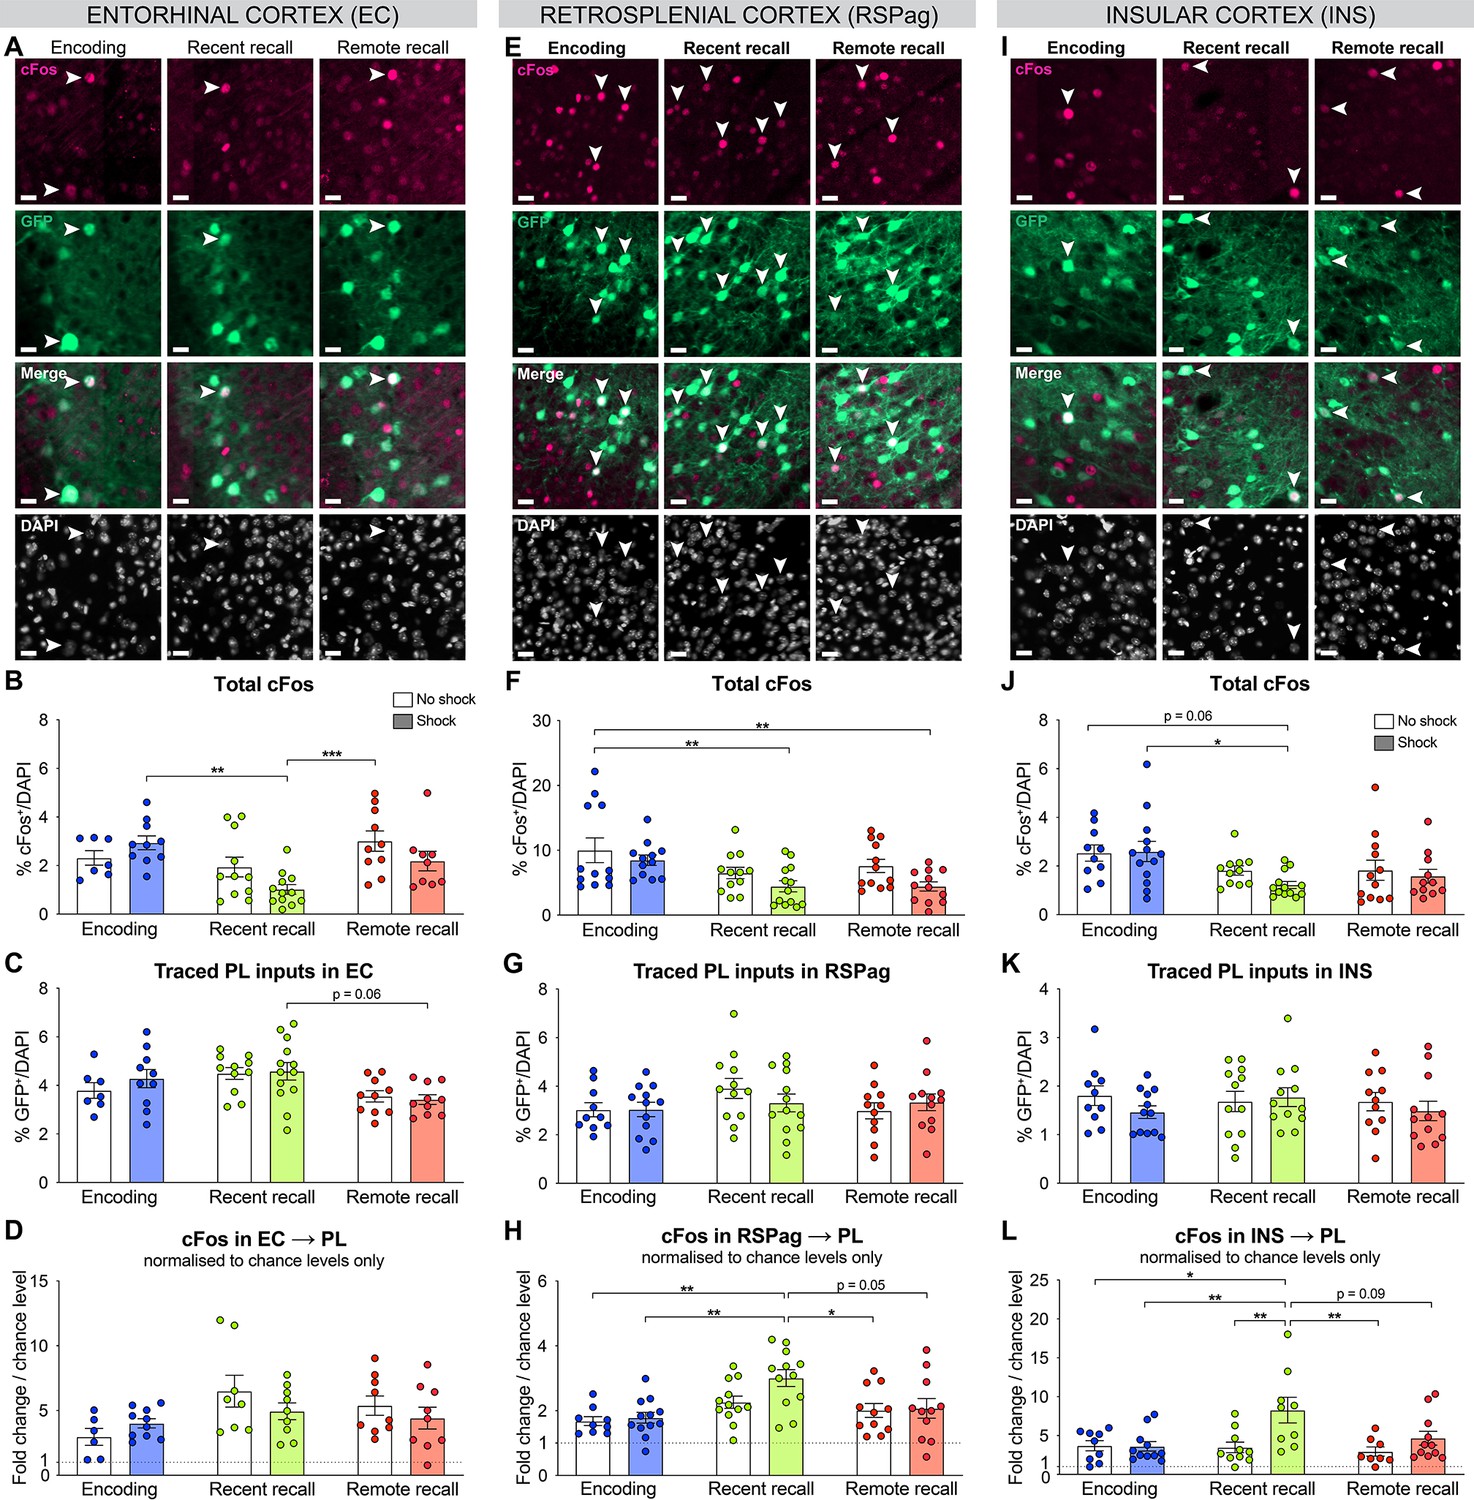
Complementary quantifications for the activation of prelimbic cortex (PL) inputs in entorhinal cortex (EC), RSPag and insular cortex (INS).
All representative images (from Figure 3) for EC (A), RSPag (E), and INS (I), scale 20 µm. Total cFos percentage in EC (B, one-way ANOVA, F(5,53)=5.075, p=0.0007), RSPag (F, one-way ANOVA, F(5,67)=4.156, p=0.0024) and INS (J, one-way ANOVA, F(5,64)=2.971, p=0.0179). Distribution of traced PL inputs across behavioral groups in EC (C, one-way ANOVA, F(5,55)=2.794, p=0.0255), RSPag (G), and INS (K). Double positives (cFos+GFP+) normalized to chance levels in EC (D), RSPag (H, one-way ANOVA, F(5,61)=4.618, p=0.0012), and INS (L, one-way ANOVA, F(5,52)=4.312, p=0.0023). Stars represent p-values of Tukey’s multiple comparisons tests (*:p ≤ 0.05; **: 0.001 <p ≤ 0.01, ***: 0.0001 < p ≤ 0.001, ****: p ≤ 0.0001). n=9–13 animals per group.
Figure 3—figure supplement 2
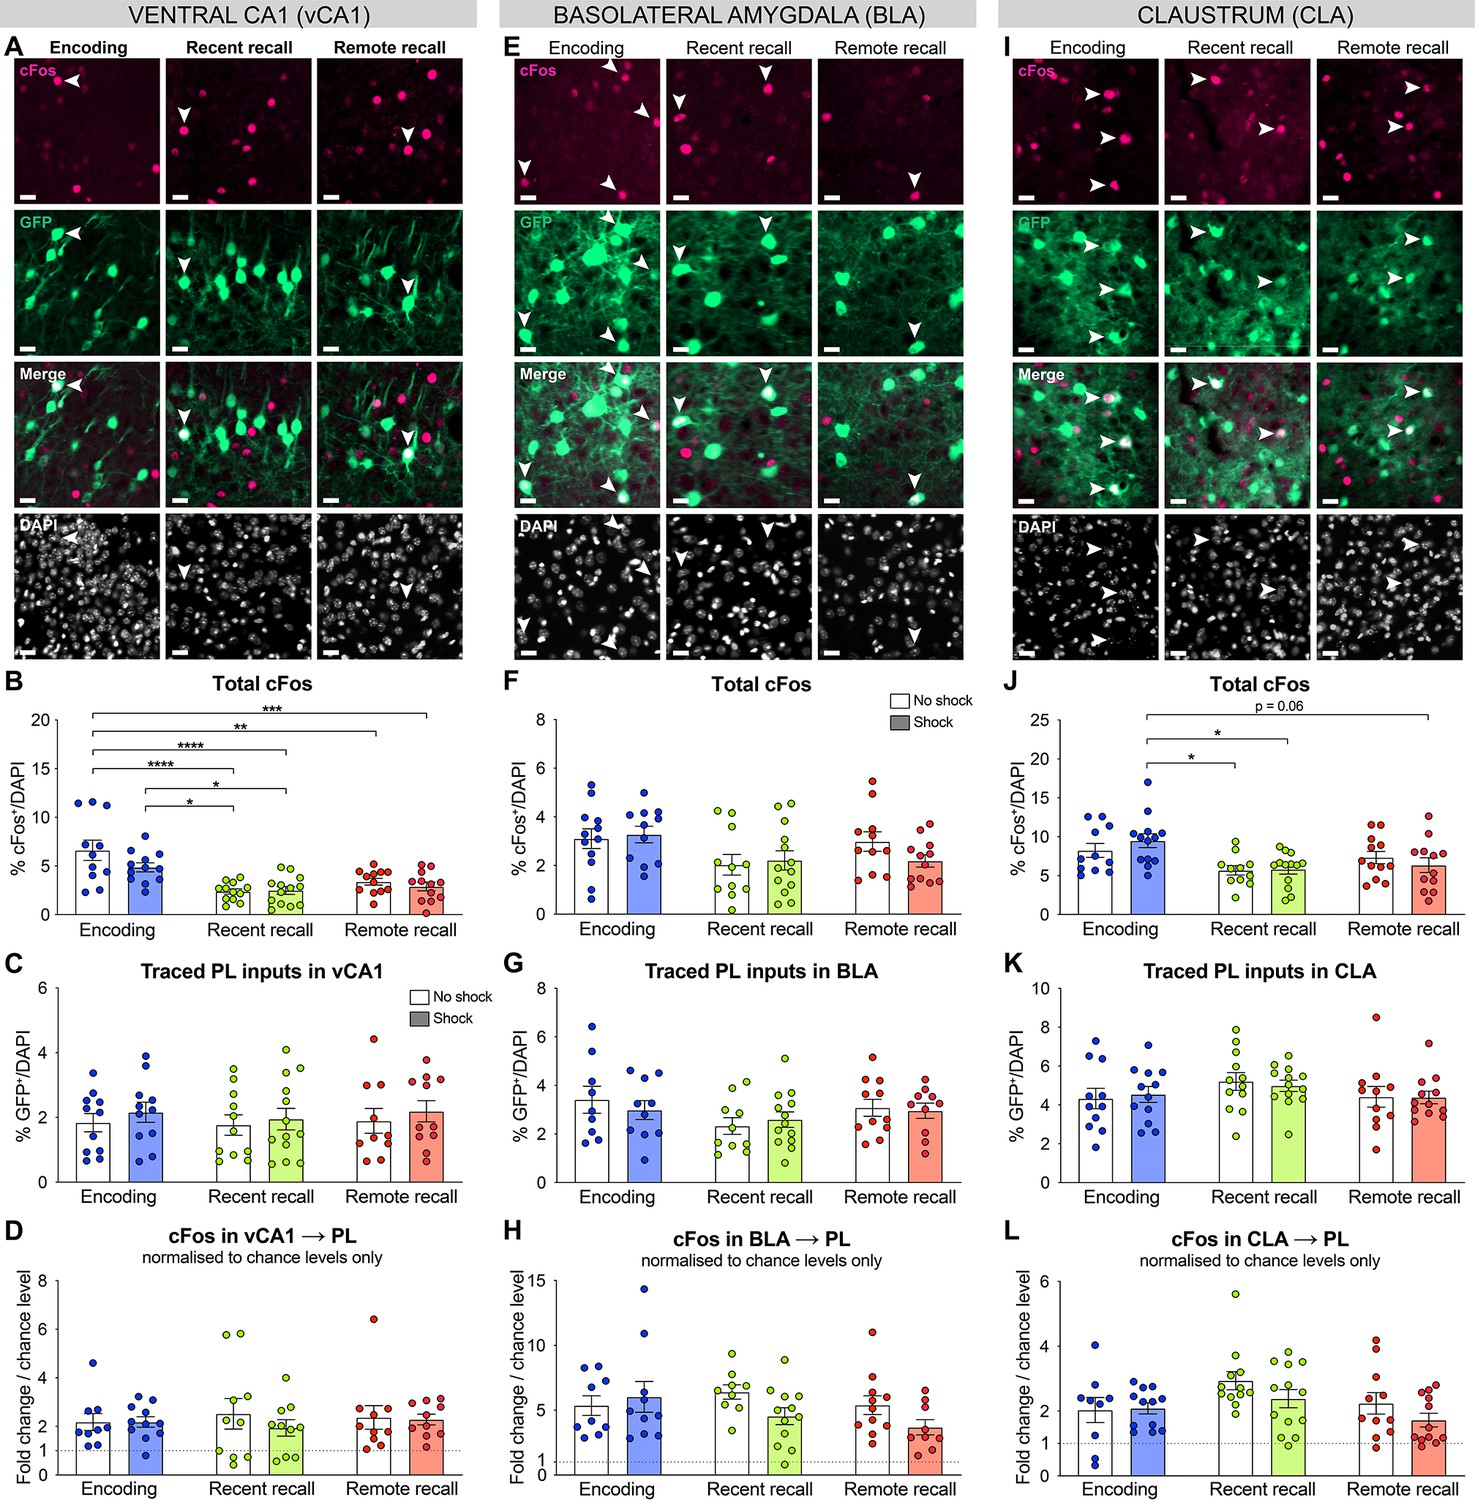
Complementary quantifications for the activation of prelimbic cortex (PL) inputs in vCA1, basolateral amygdala (BLA), and claustrum (CLA).
All representative images (from Figure 3) for vCA1 (A), BLA (E), and CLA (I), scale 20 µm. Total cFos percentage in vCA1 (B, one-way ANOVA, F(5,66)=9.298, p<0.0001), BLA (F) and CLA (J, one-way ANOVA, F(5,66)=3.593, p=0.0062). Distribution of traced PL inputs across behavioral groups in vCA1 (C), BLA (G), and CLA (K). Double positives (cFos+GFP+) normalized to chance levels only in vCA1 (L), BLA (H), and CLA (L, one-way ANOVA, F(5,63)=2.282, p=0.0570). Stars represent p-values of Tukey’s multiple comparisons tests (*:p ≤ 0.05; **: 0.001 <p ≤ 0.01, ***: 0.0001 < p ≤ 0.001, ****: p ≤ 0.0001). n=9–13 animals per group.
Figure 4 with 3 supplements
Chemogenetic manipulation of prelimbic cortex (PL) inputs reveals the functional importance of claustrum (CLA) projections at encoding and insular cortex (INS) projections at recent memory recall.
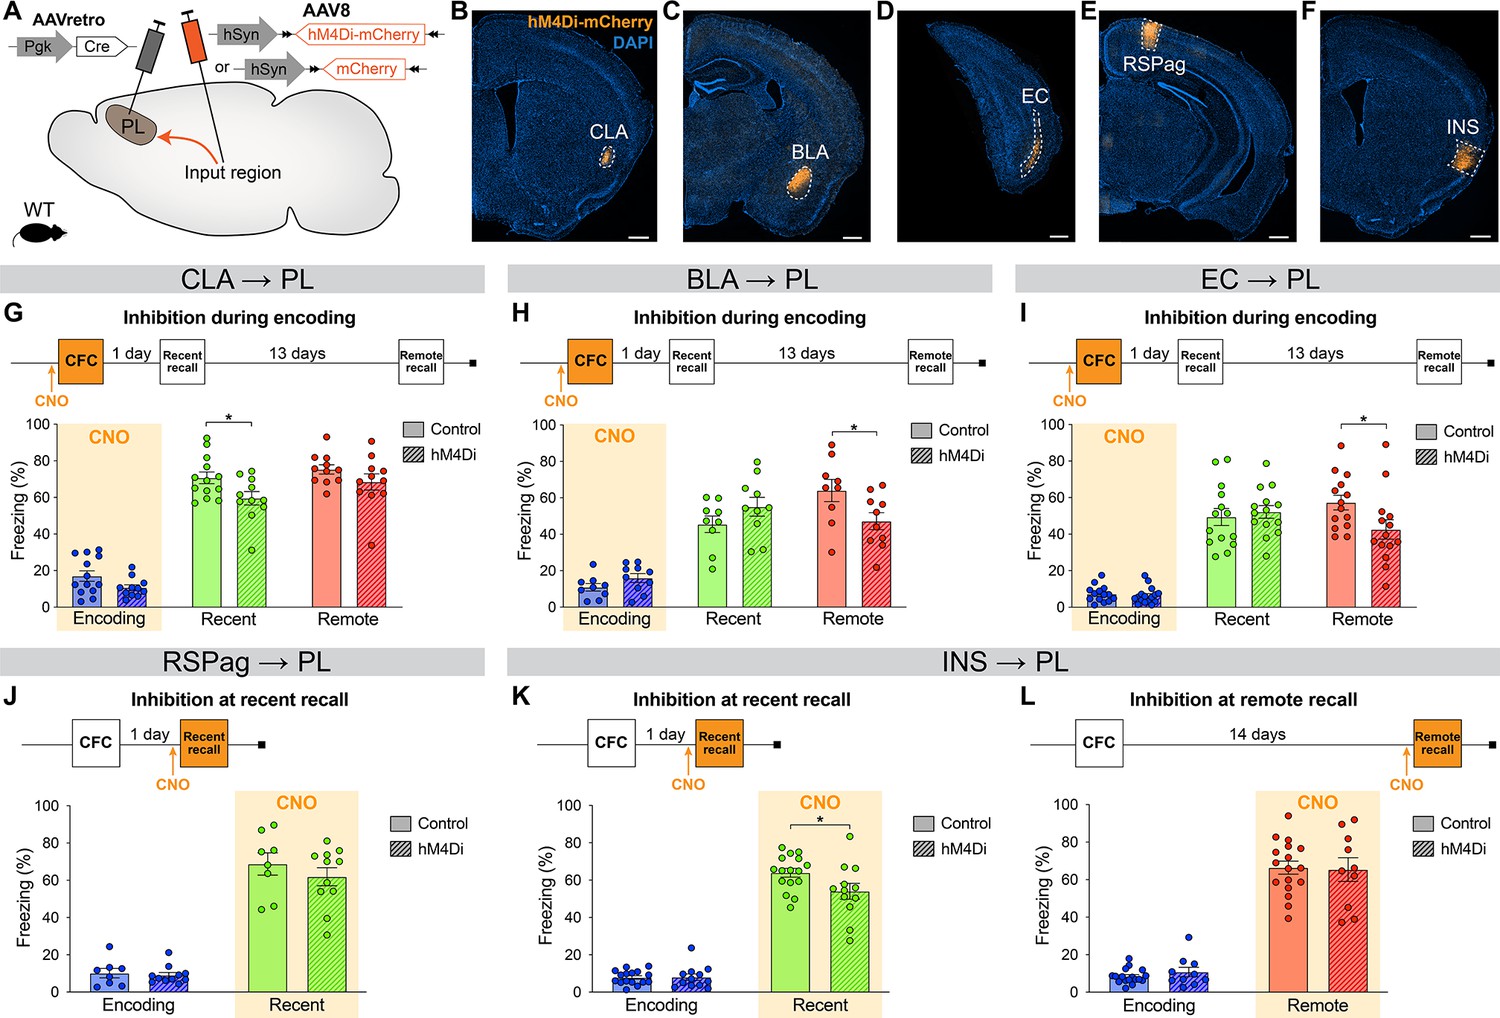
(A) Experimental design. AAVretro-Cre was injected in the PL, and AAV-DIO-hM4Di-mCherry (or AAV-DIO-mCherry for controls) in the desired input region in order to specifically inhibit the projections to the PL upon clozapine-N-oxide (CNO) injection. Representative images of the injection site in the input region for CLA (B), basolateral amygdala (BLA) (C), entorhinal cortex (EC) (D), RSPag (E), and insular cortex (INS) (F), all scales 500 µm. Experimental timeline and freezing percentage of (G) CLA → PL inhibition during encoding (at recent recall, Cohen’s d=–0.95), (H) BLA → PL inhibition during encoding (at remote recall, Cohen’s d=–1.02), (I) EC → PL inhibition during encoding (at remote recall, Cohen’s d=–0.84), (J) RSPag → PL inhibition during recent recall, (K–L) INS → PL inhibition during recent (Cohen’s d=–0.83) (K) and remote (L) recall. Stars represent p-values of two-tailed unpaired t-tests between hM4Di and control groups (*: p≤0.05). n=8–17 animals per group.
-
Figure 4—source data 1
Raw data for Figure 4 and its supplements.
- https://cdn.elifesciences.org/articles/78542/elife-78542-fig4-data1-v1.xlsx
Figure 4—figure supplement 1
Quantification of the chemogenetic inactivation of claustrum (CLA) → prelimbic cortex (PL) projections.
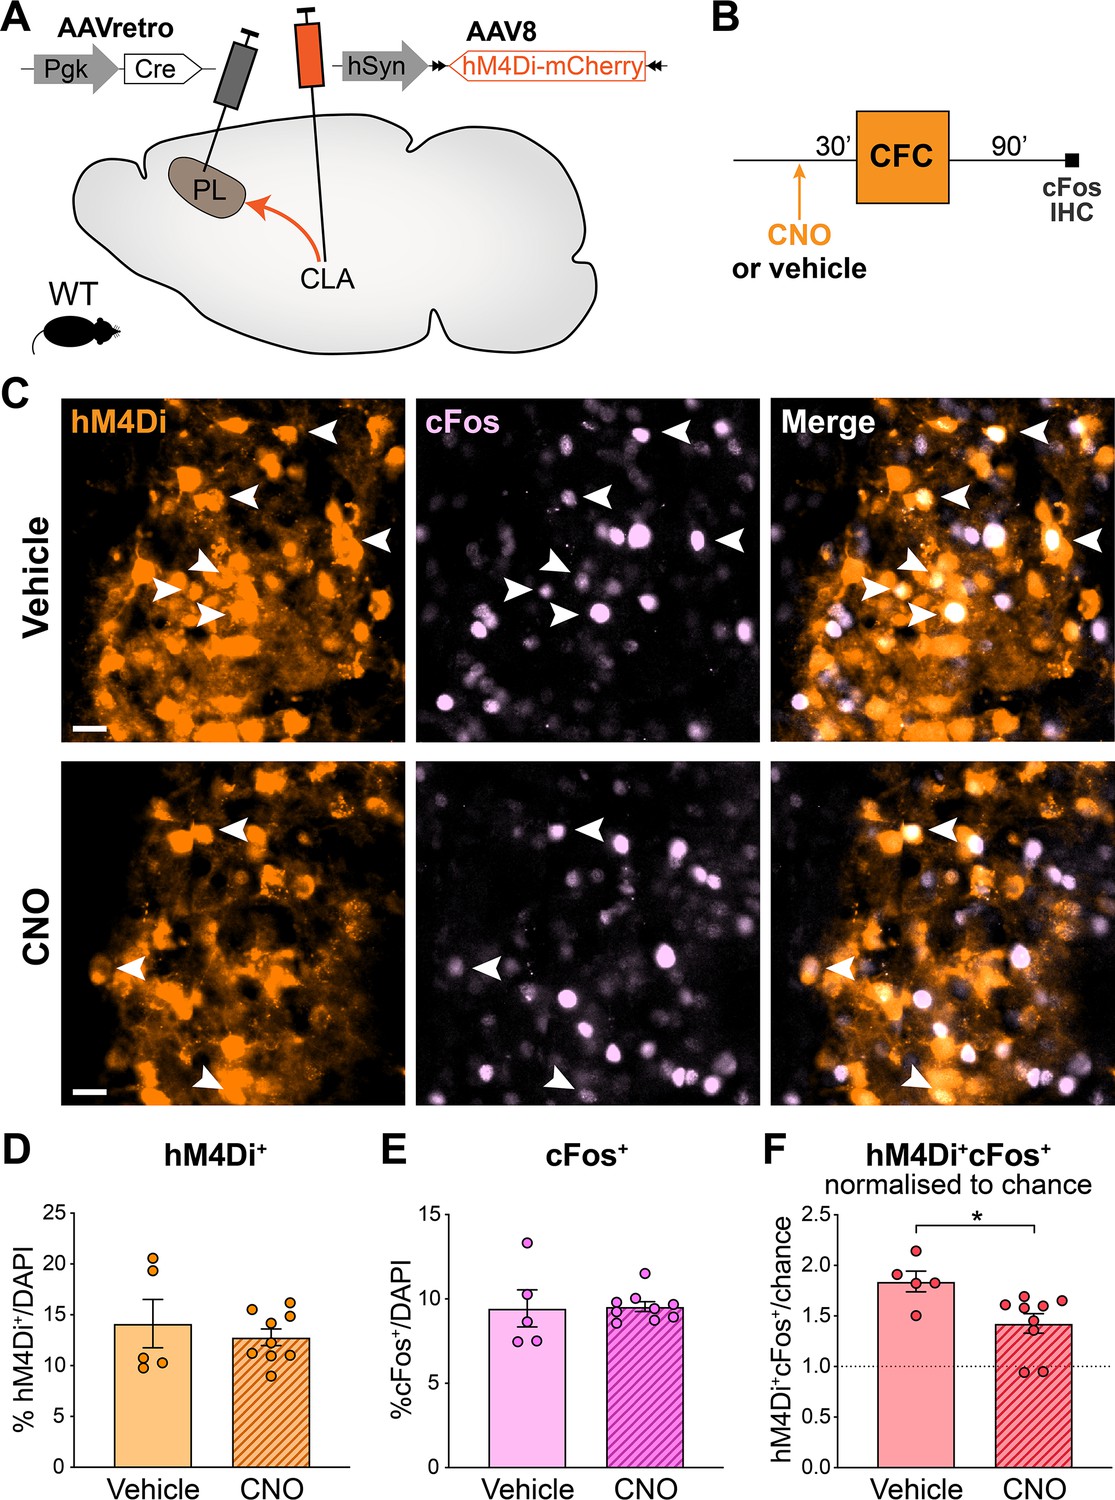
(A) Experimental design: AAVretro-Cre was injected in the PL and AAV-DIO-hM4Di-mCherry in the CLA, to express hM4Di specifically in CLA → PL projections. (B) Timeline of the experiment. Clozapine-N-oxide (CNO) was injected 30 min before contextual fear conditioning (CFC), and mice were perfused 90 min later for cFos immunohistochemistry (IHC). (C) Representative images of CNO and vehicle-injected groups, in the CLA. hM4Di in orange, cFos in light pink. Arrows indicate double positive hM4Di+cFos+ cells. Scale 20 µm. (D) Quantification of hM4Di+ in CLA. (E) Quantification of cFos+ in CLA. (F) Quantification of double positive hM4Di+cFos+ cells in CLA, normalized to chance. Star represents p-value of two-tailed unpaired t-test between CNO and vehicle groups (*: p≤0.05). Vehicle: n=5 animals; CNO: n=9 animals.
Figure 4—figure supplement 2
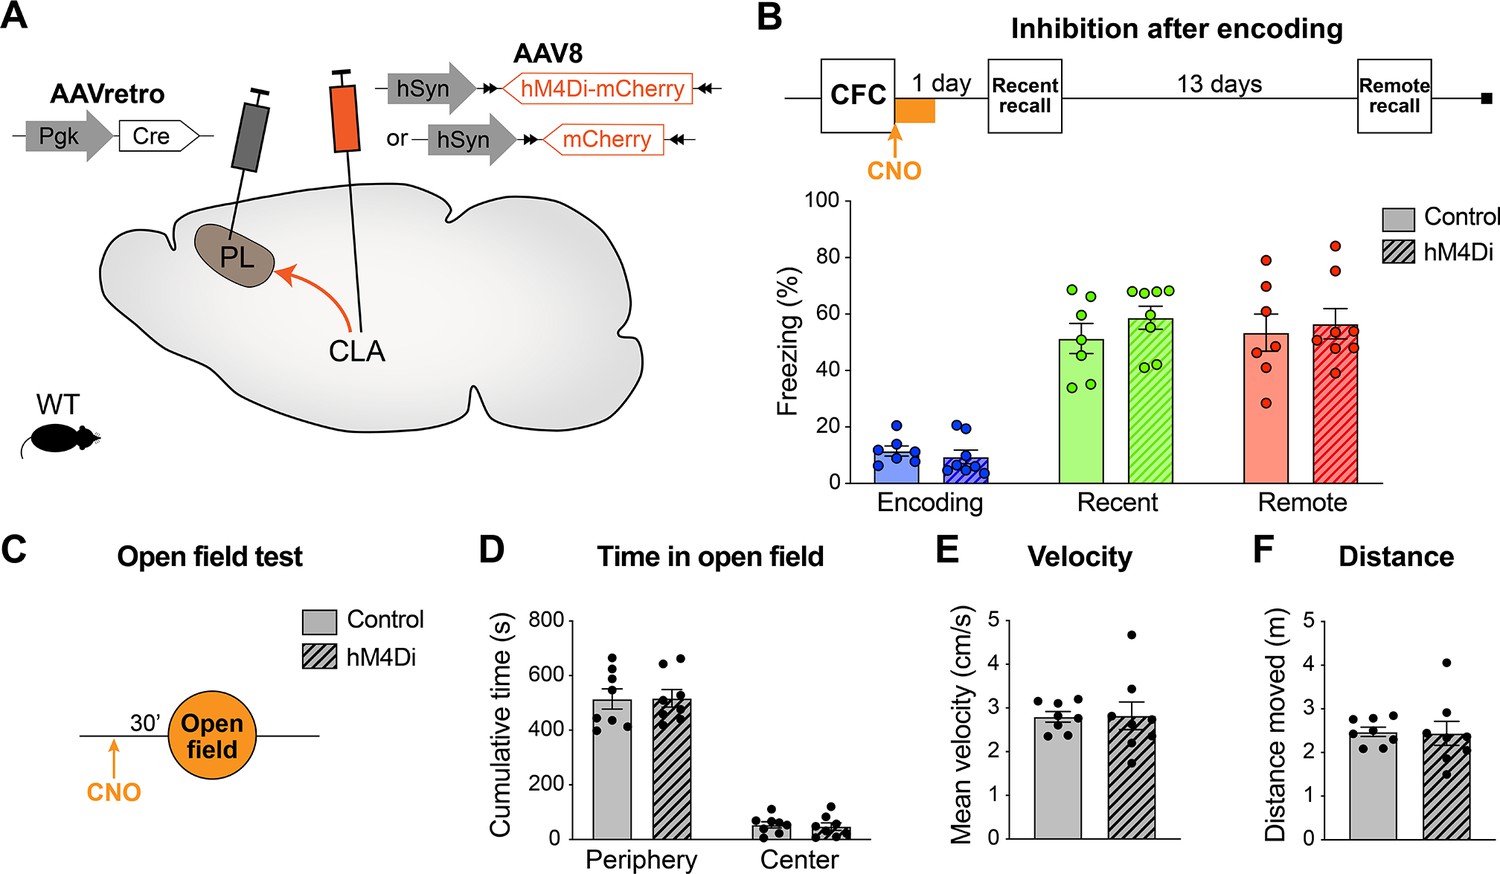
Claustrum (CLA) → prelimbic cortex (PL) inhibition after encoding does not impair memory recall and does not alter locomotion and exploration behavior.
(A) Experimental design: AAVretro-Cre was injected in the PL and AAV-DIO-hM4Di-mCherry in the CLA (or AAV-DIO-mCherry for controls), to express hM4Di (or mCherry) specifically in CLA → PL projection. (B) Experimental timeline and freezing percentage for CLA → PL inhibition after encoding. Clozapine-N-oxide (CNO) was injected i.p. after contextual fear conditioning (CFC), and every 2 hr, for a total of four injections. n=7–8 per group. (C) Experimental timeline of the open field test, 30 min after a single CNO injection, measuring (D) time spent in the periphery or center of the arena, (E) velocity, and (F) total distance moved. n=8 per group.
Figure 4—figure supplement 3
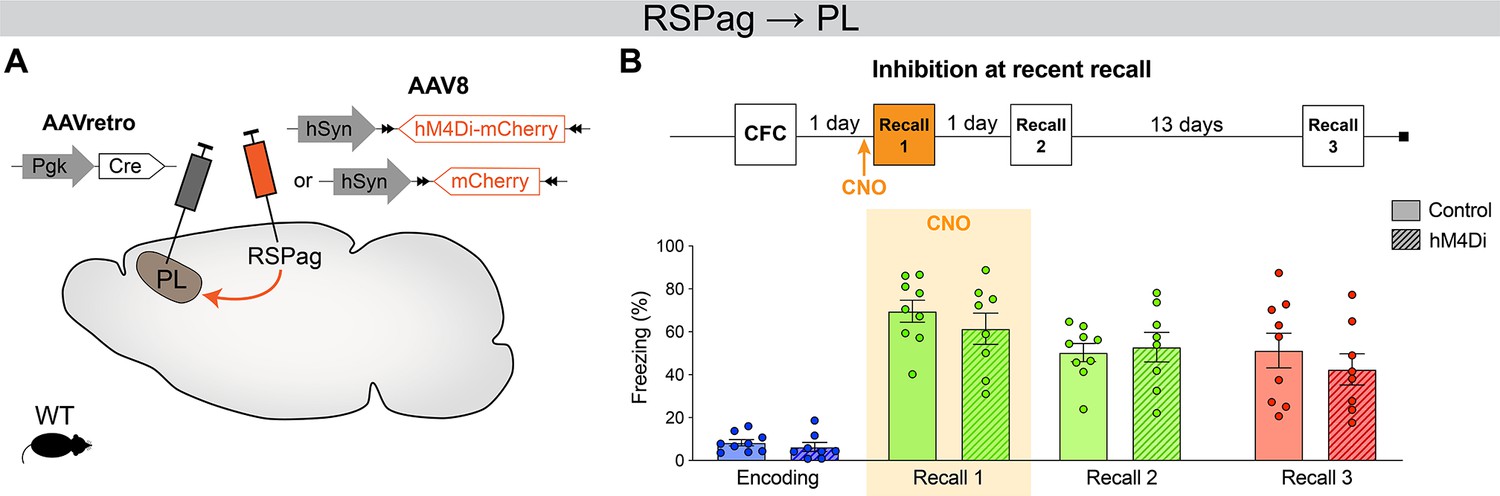
Inhibition of RSPag → prelimbic cortex (PL) at recent recall does not impair reconsolidation at later times.
(A) Experimental design. AAVretro-Cre was injected in the PL and AAV-DIO-hM4Di-mCherry in the RSPag (or AAV-DIO-mCherry for controls), to express hM4Di (or mCherry) specifically in RSPag → PL projection. (B) Experimental timeline and freezing percentage for RSPag → PL inhibition at recent recall. Recalls 2 and 3 were done in absence of clozapine-N-oxide (CNO) injection. n=8–9 per group.
Figure 5 with 3 supplements

Prelimbic cortex (PL) engram reactivation correlates with freezing when claustrum (CLA) or insular cortex (INS) inputs are inhibited.
(A) Experimental design. 3 weeks before behavior started, Fos::tTA mice were injected with AAVretro-Cre in PL and AAV-DIO-hM4Di-mCherry in the desired input region, as well as AAV-TRE-GFP in the PL, so that GFP was only expressed in cFos+ cells in the absence of doxycycline (Dox). (B) GFP expression at the PL injection site (scale 400 µm). (C) Magnified view in the PL (scale 20 µm) of reactivated engram cells, indicated by white arrows. (D) Representative image of the CLA input region. (E) Experimental timeline (top) and freezing percentage (bottom) during recent memory recall when CLA → PL projections were inhibited during encoding (Cohen’s d=–0.87). (F) Reactivation of PL engram cells (%GFP+cFos+/GFP+) at recent recall for CLA → PL inhibition, correlated with freezing percentage at recent recall for clozapine-N-oxide (CNO) (orange) and vehicle (gray) groups. (G) Representative image of the INS input region. (H) Experimental timeline (top) and freezing percentage (bottom) during recent memory recall when INS → PL projections were inhibited during recent recall (Cohen’s d=–1.33). (I) Reactivation of PL engram cells (%GFP+cFos+/GFP+) at recent recall for INS → PL inhibition, correlated with freezing percentage at recent recall for CNO (orange) and vehicle (gray) groups. (E, H) Stars represent p-values of two-tailed unpaired t-tests between CNO and vehicle groups (*: p≤0.05). (F, I) Correlations assessed with linear regressions, R2 and p-values are reported on the graphs. n=11–12 (CLA) or 5–9 (INS) per group.
-
Figure 5—source data 1
Raw data for Figure 5 and its supplements.
- https://cdn.elifesciences.org/articles/78542/elife-78542-fig5-data1-v1.xlsx
Figure 5—figure supplement 1
Complementary quantifications for the engram reactivation analysis in the prelimbic cortex (PL).
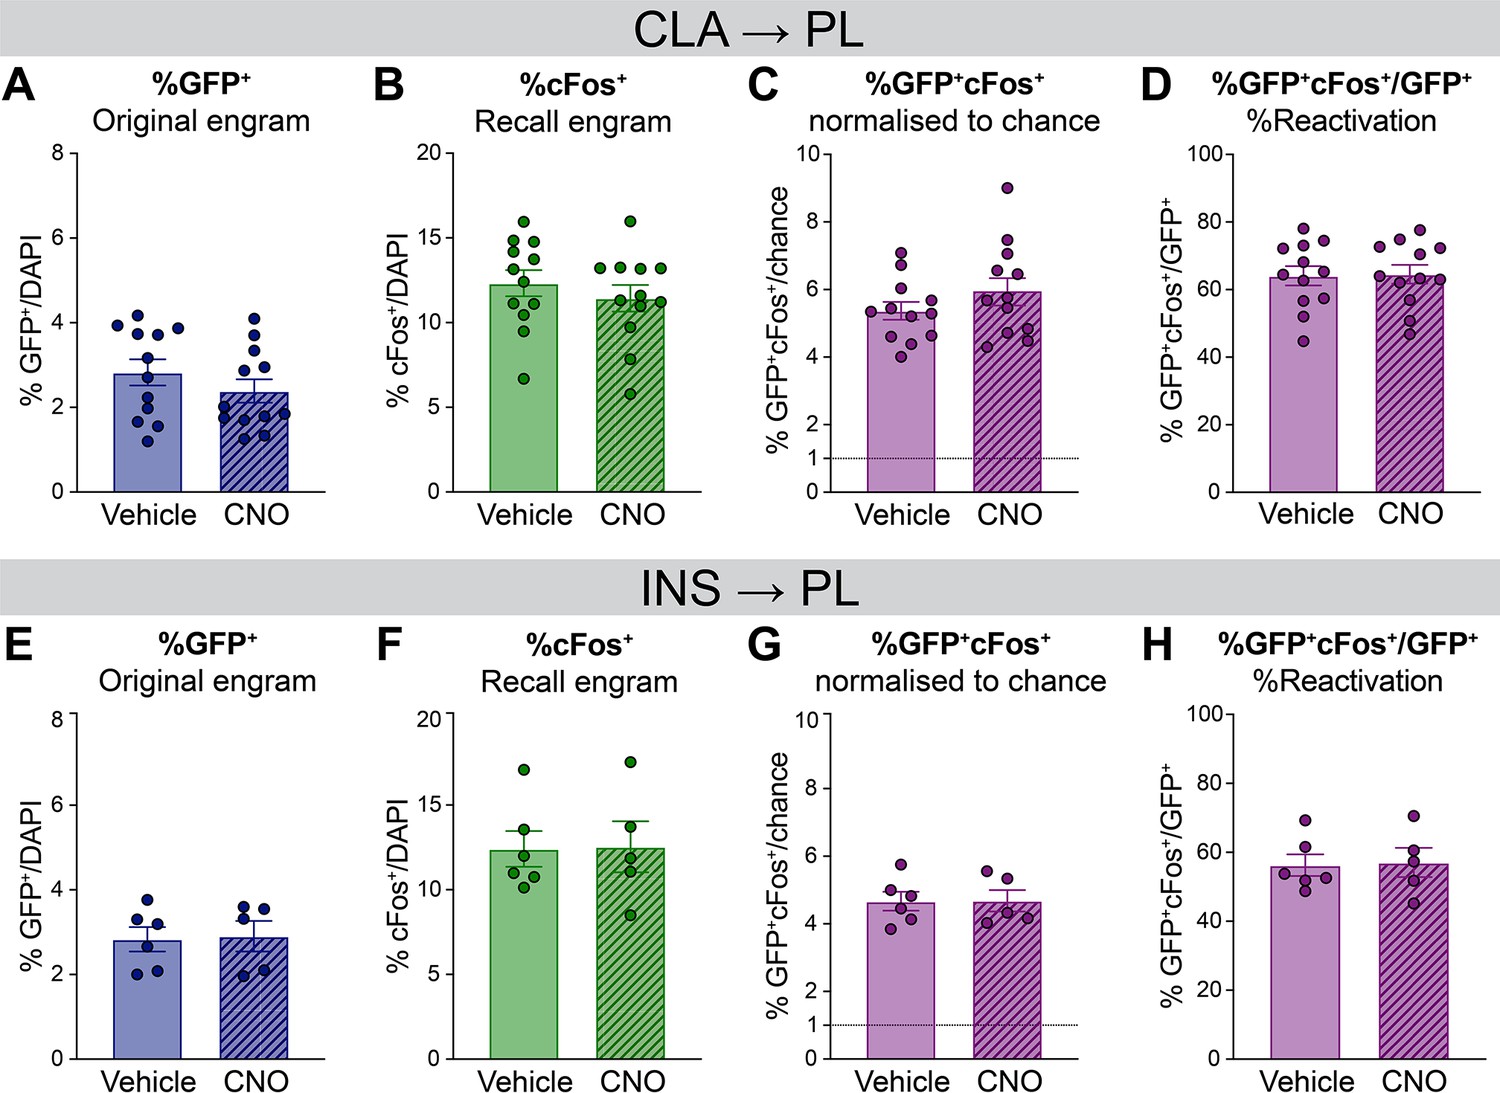
(A–D) For claustrum (CLA) → PL inhibition during encoding, percentage of (A) GFP+ cells, (B) cFos+ cells, (C) double positive GFP+cFos+ cells normalized to chance and (D) reactivation expressed as %GFP+cFos+/GFP+. (E–H) For insular cortex (INS) → PL inhibition during recent recall, percentage of (E) GFP+ cells, (F) cFos+ cells, (G) double positive GFP+/cFos+ cells normalized to chance and (H) reactivation.
Figure 5—figure supplement 2
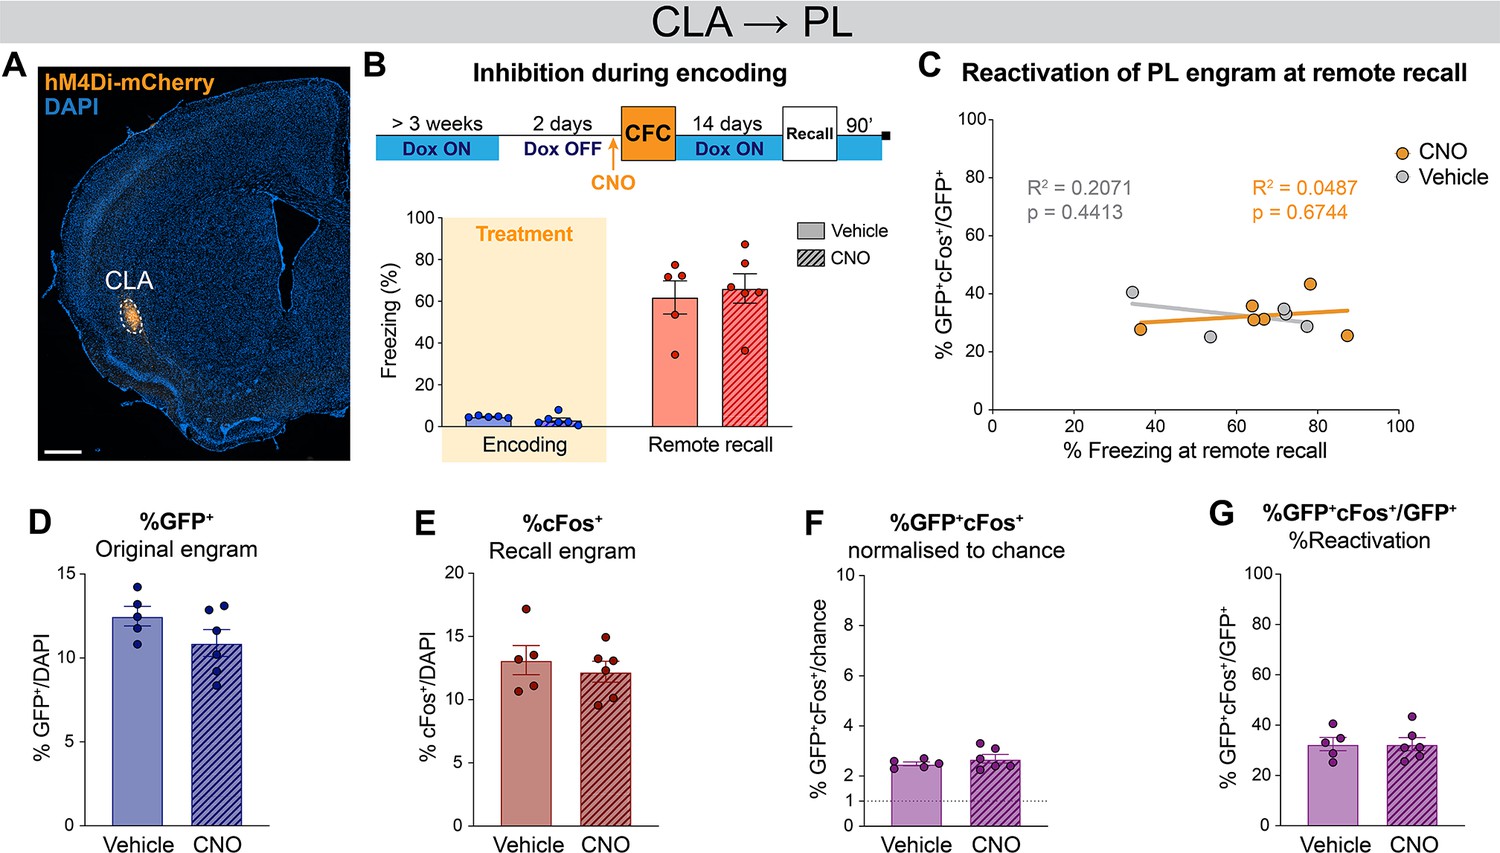
Claustrum (CLA) → prelimbic cortex (PL) inhibition during encoding does not affect remote recall and remote engram reactivation in PL.
(A) Representative image of the CLA input region. (B) Timeline and freezing percentage of CLA → PL inhibition during encoding and tested at remote recall. (C) Reactivation of PL engram cells (%GFP+cFos+/GFP+) at remote recall, correlated with freezing percentage for clozapine-N-oxide (CNO) (orange) and vehicle (gray) groups. Percentage of (D) GFP+, (E) cFos+, (F) double positives GFP+cFos+ normalized to chance and (G) reactivation as %GFP+cFos+/GFP+. Correlation assessed with linear regression, R2 and p-value are reported on the graphs. n=5–6.
Figure 5—figure supplement 3
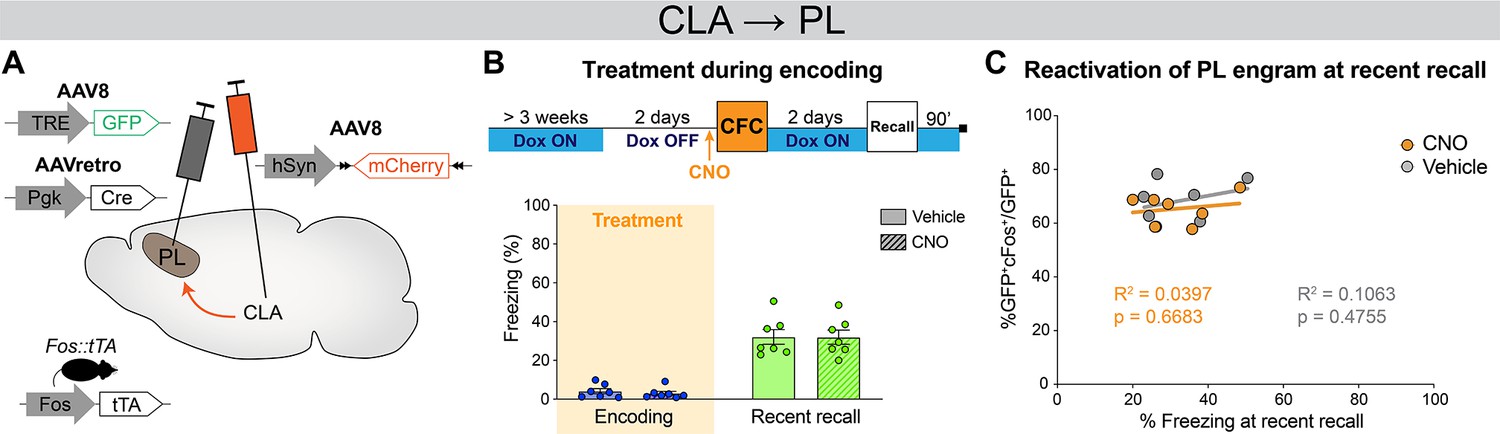
Clozapine-N-oxide (CNO) administration per se does not alter memory recall or engram reactivation.
(A) Experimental design. Fos::tTA mice were injected with AAVretro-Cre in PL and AAV-DIO-mCherry in the claustrum (CLA), as well as AAV-TRE-GFP in prelimbic cortex (PL). (B) Experimental timeline and freezing percentage at recent memory recall following CNO or vehicle administration at encoding. (C) Reactivation of PL engram cells (%GFP+cFos+/GFP+) at recent recall showed no correlation with freezing for the CNO (orange) and vehicle (gray) groups. n=7 animals per group.
Additional files
-
MDAR checklist
- https://cdn.elifesciences.org/articles/78542/elife-78542-mdarchecklist1-v1.docx
-
Source code 1
Script for image analysis on QuPath 0.3, to detect and classify colocalized cells.
- https://cdn.elifesciences.org/articles/78542/elife-78542-code1-v1.zip
Download links
A two-part list of links to download the article, or parts of the article, in various formats.
Downloads (link to download the article as PDF)
Open citations (links to open the citations from this article in various online reference manager services)
Cite this article (links to download the citations from this article in formats compatible with various reference manager tools)
Brain-wide screen of prelimbic cortex inputs reveals a functional shift during early fear memory consolidation
eLife 11:e78542.
https://doi.org/10.7554/eLife.78542


