Schizosaccharomyces pombe Rtf2 is important for replication fork barrier activity of RTS1 via splicing of Rtf1
- Genome Damage and Stability Centre, University of Sussex, United Kingdom
- Department of Biochemistry and Biomedicine, University of Sussex, United Kingdom
Figures
Figure 1
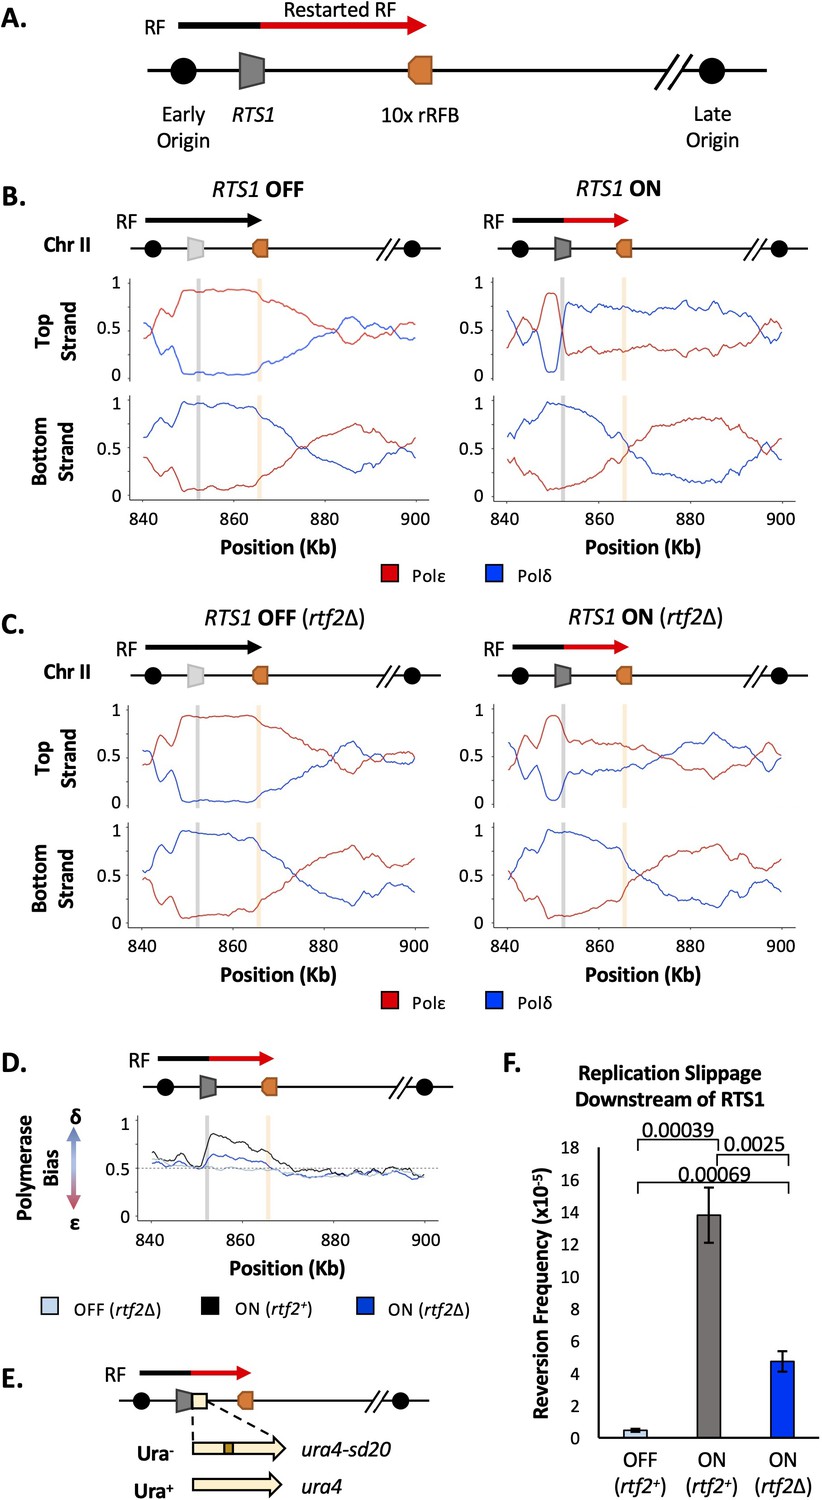
Rtf2 deletion reduces replication fork restart at RTS1.
(A) The RTS1 sequence (grey box) is inserted between an early and a late firing replication origin and 10 ribosomal replication fork barriers (10 x rRFB, orange box) are inserted ~10 Kb downstream of RTS1. The predominant direction of replication is shown with canonical (black) and restarted replication forks (red) indicated. (B) Polymerase usage around the RTS1 RFB locus in rtf2+ cells. RTS1 OFF (left panel) and ON (right panel). The ratio of Polymerase ε (red) and Polymerase ẟ (blue) for both the top and bottom strand is shown. (C) Polymerase usage around the RTS1 RFB locus in rtf2Δ cells. RTS1 OFF: rtf1Δ rtf2Δ. RTS1 ON: rtf1+ rtf2Δ. Panel details as in B. (D) Polymerase bias graph calculated using the ratio of polymerase usage across both strands around the RTS1 RFB locus. (E) Schematic of the RTS1-RFB replication slippage assay. A ura4 allele containing a 20 bp tandem repeat (ura4-sd20) is inserted immediately downstream of the RTS1 sequence. Replication slippage can result in loss of one repeat, which manifests as ura+. (F) Replication fork slippage events scored as the frequency of ura4+ reversions over 2 cell cycles using the RTS1-ura4-sd20 replication fork slippage assay. Data from three independent experiments ± SD. Statistical analysis by two-tailed Students T-test.
Figure 2 with 2 supplements
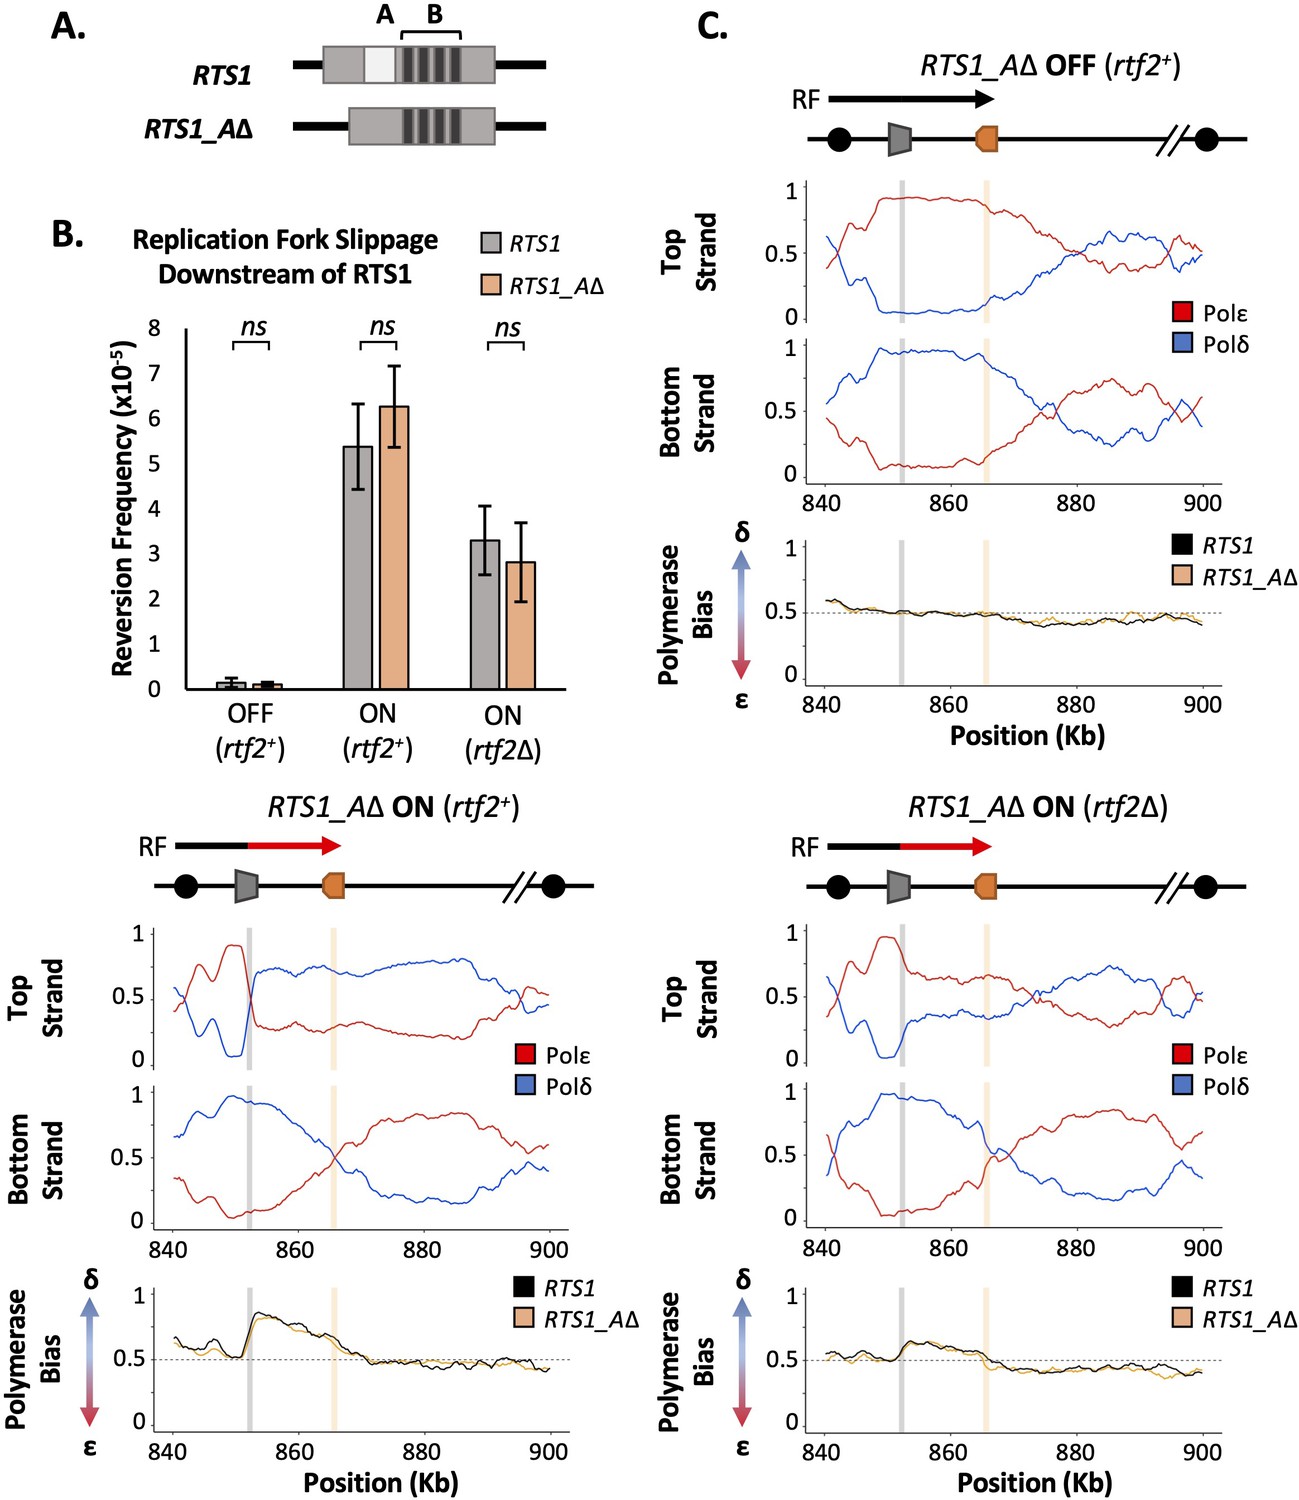
RTS1 region A is dispensable for efficient replication fork restart.
(A) Schematic of the RTS1 RFB. Region A is a~60 bp purine rich region and Region B is ~450 bp containing the four repeated sequence motifs essential for RTS1 activity. (B) Replication fork slippage events scored as the frequency of ura4+ reversions over two cell cycles. Data from three independent experiments ± SD. Statistical analysis by two-tailed Students T-test, p>0.05 = not significant (ns). (C) Polymerase usage around the RTS1_AΔ RFB locus for RFB OFF (Top panel) and ON (bottom left panel) for rtf2+ and polymerase usage around the RTS1_AΔ RFB locus in rtf2Δ cells with the barrier ON (bottom right panel). For each panel the ratio of Polymerase ε (red) and Polymerase ẟ (blue) for both the top and bottom strand is shown along with a polymerase bias graph calculated using the ratio of polymerase usage across both strands and comparing RTS1_AΔ (orange) with the RTS1 locus (black).
Figure 2—figure supplement 1

Mud1 does not impact the turnover of Rtf2 or cell sensitivity to HU/MMS.
(A) The absence of Mud1 does not reduce cell viability in the presence of HU/MMS. Cells were spotted onto plates in 10 x serial dilutions and incubated at 30 °C for 4 days. (B) Cycloheximide treatment of cells containing Rtf2-3HA with (mud1+) and without (mud1Δ) Mud1 over the course of 10 min post-treatment. Presence of Rtf2 probed with anti-HA, and tubulin probed for with anti-tubulin as a loading control.
-
Figure 2—figure supplement 1—source data 1
Source data for Figure 2—figure supplement 1.
- https://cdn.elifesciences.org/articles/78554/elife-78554-fig2-figsupp1-data1-v2.zip
Figure 2—figure supplement 2

Uncropped blots for Figure 2—figure supplement 1.
Figure 3 with 3 supplements
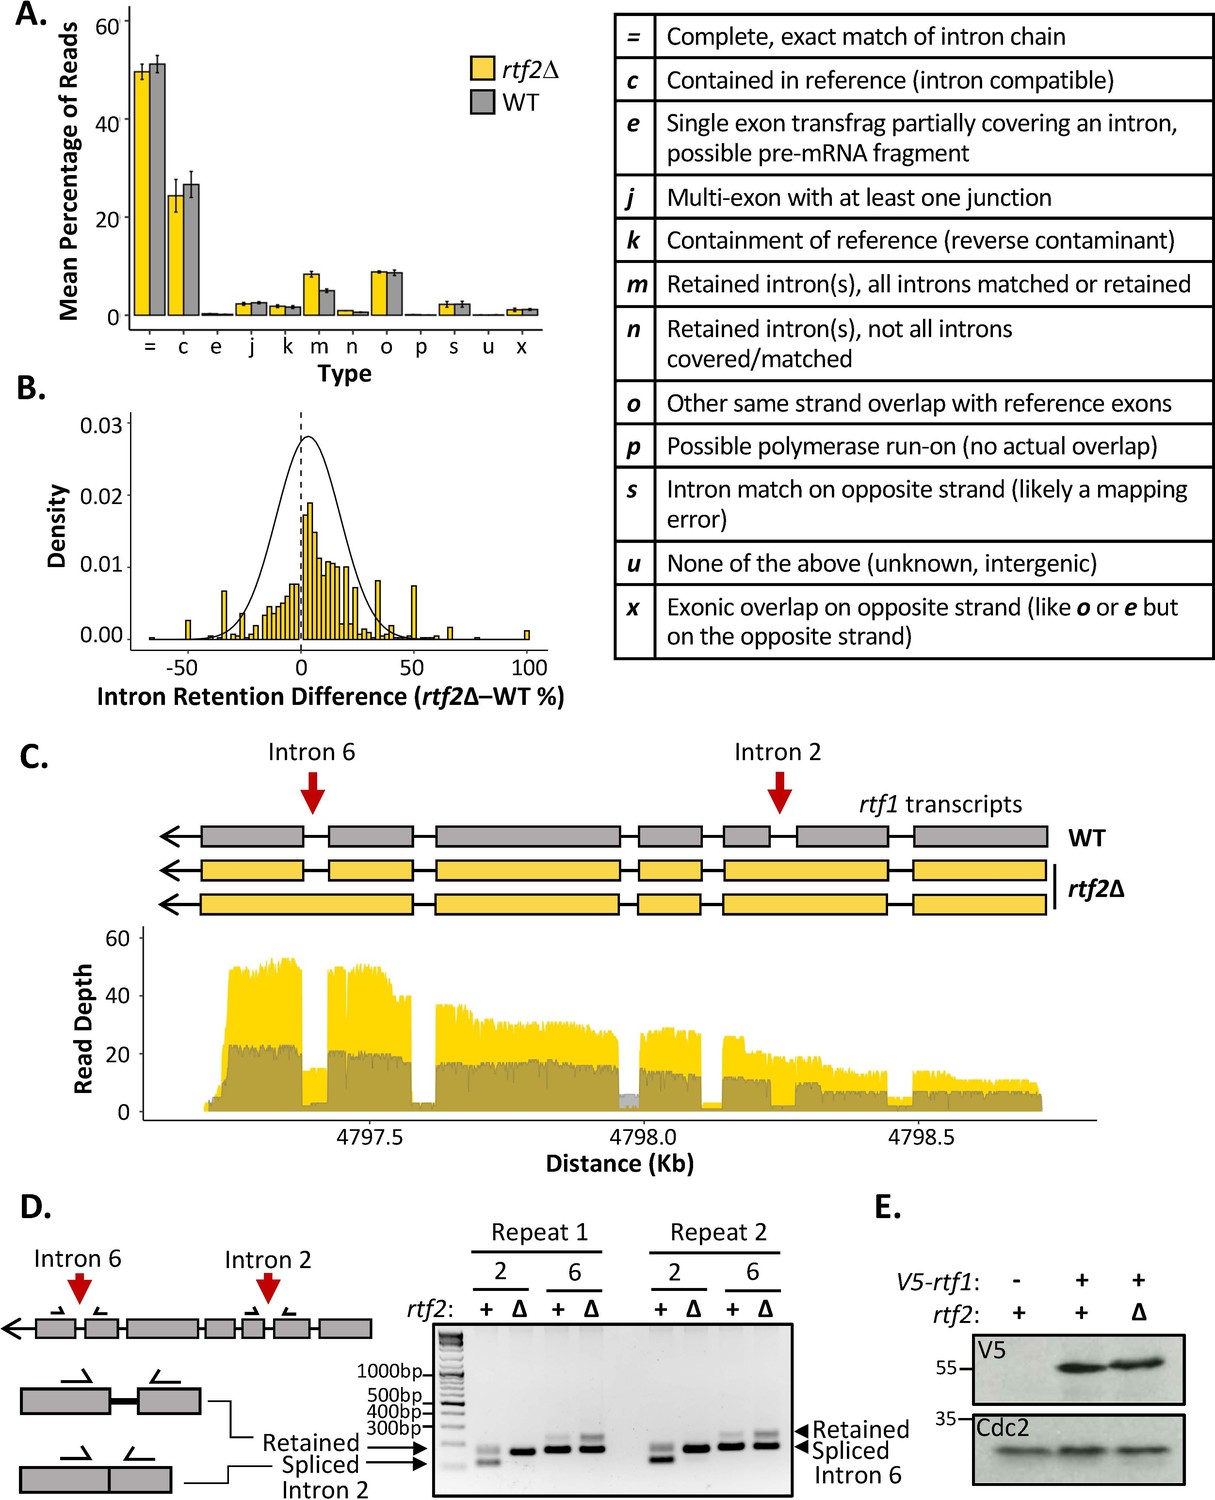
rtf2Δ results in increased retention of a subset of introns including within the rtf1 transcript.
(A) GffCompare classification analysis of transcripts from WT (grey) and rtf2Δ (yellow) samples. Graph shows the mean of three biological repeats with error bars representing SD. The table (right) describes each classification. (B) Graph showing the difference in intron retention for each individual intron with a normal distribution curve fitted. Introns that show no difference between WT and rtf2Δ are not included on the graph. (C) Depth of reads mapped across the rtf1 transcript for WT (grey) and rtf2Δ (yellow) samples. Corresponding transcripts as calculated by GffCompare are shown above. (D) Two repeats of PCR amplification of intron 2 and intron 6 from cDNA derived from polyA-mRNA. Schematic shows the principle behind the shift in size from a smaller band, representing correctly spliced, to a larger band, representing a retained intron. (E) Whole cell extract of V5-rtf1 containing cells in WT and rtf2Δ background probed with indicated antibody. Cdc2 is shown as a loading control.
-
Figure 3—source data 1
Source data for Figure 3.
- https://cdn.elifesciences.org/articles/78554/elife-78554-fig3-data1-v2.zip
Figure 3—figure supplement 1
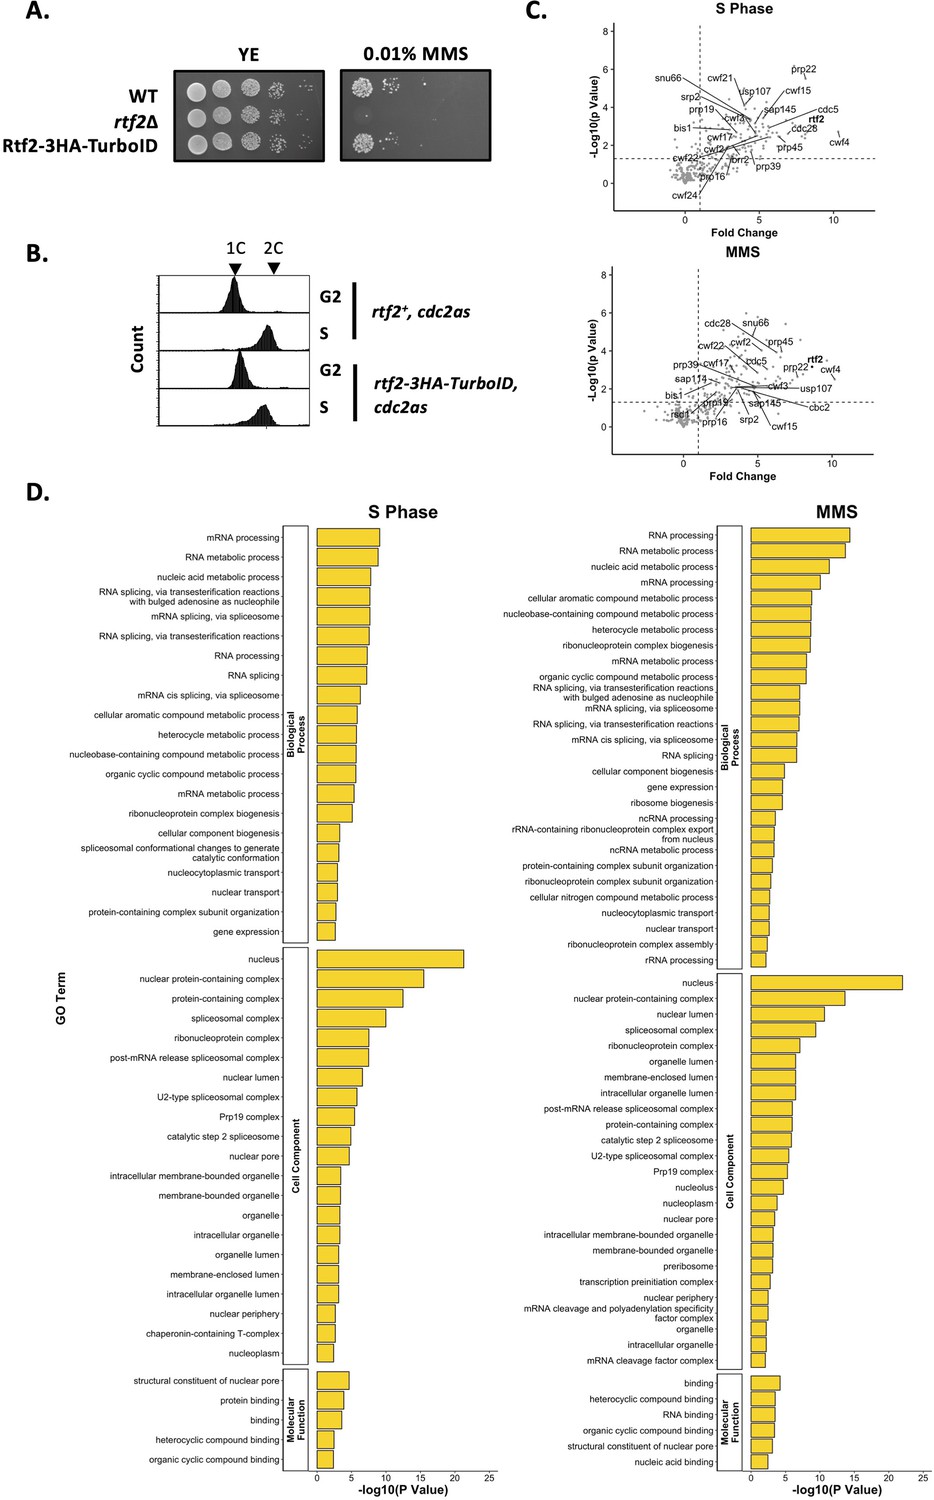
Proximal Proteins of Rtf2 identified via TurboID Proximity Based Labelling Mass Spectrometry.
(A) The presence of Rtf2-3HA-BirATbID does not reduce cell viability in the presence of MMS to that of rtf2Δ. Cells were spotted onto plates in 10 x serial dilutions and incubated at 30 °C for 4 days. (B) FACS analysis of cells synchronised in G2 and S phase using the cdc2asM17 ATP-sensitive allele. (C) Volcano plot of mass spectrometry protein hits. Proteins are plotted as p value against fold change calculated using Welch’s T-test. Identified splicing factors are indicated. (D) GO Term analysis of significant protein hits (p<0.01) with a fold change of >2.
Figure 3—figure supplement 2
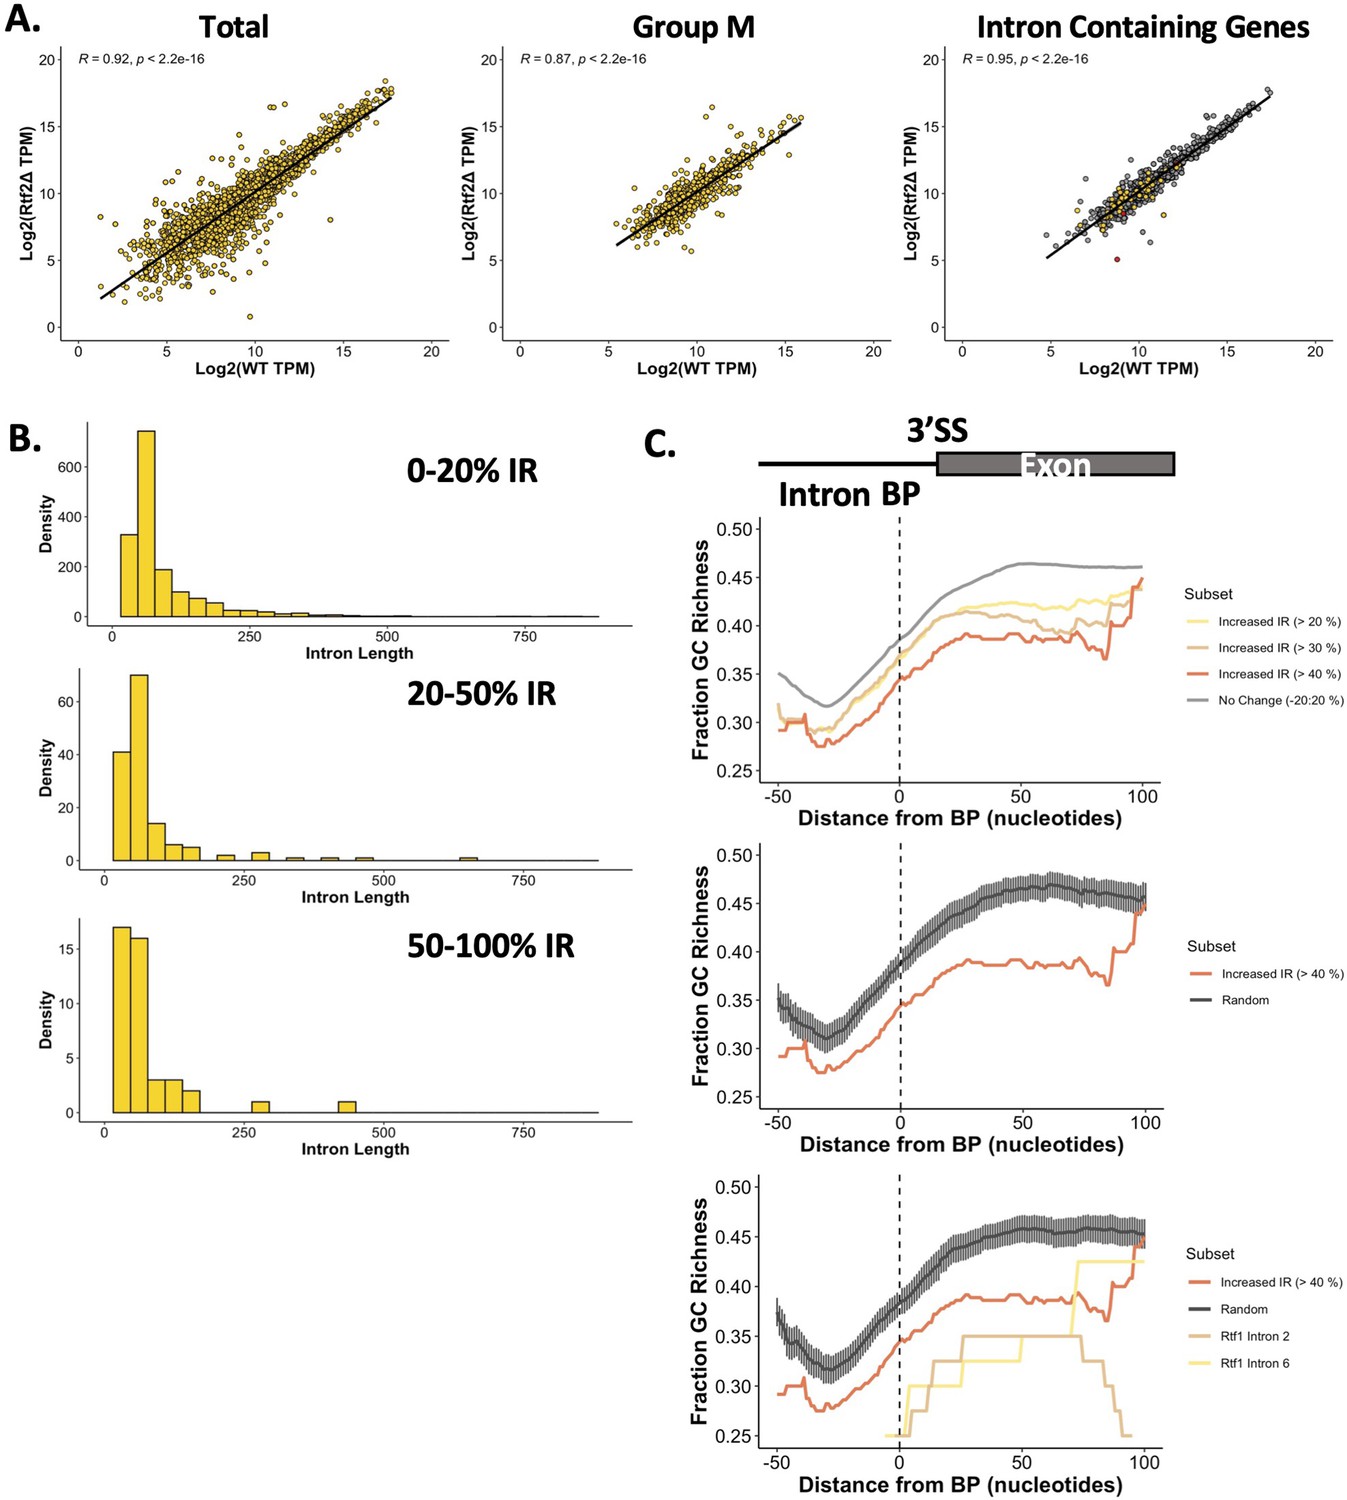
cDNA-Seq analysis of retained introns.
(A) Gene expression analysis between rtf2+ and rtf2Δ samples using TPM (Transcripts Per Million) as calculated by GffCompare. Spearmans Rank correlation coefficient and associated p value are shown. Left graph: Total transcripts; Middle graph: Transcripts classified as Type ‘m’ by GffCompare; Right graph: Intron containing transcripts (rtf2Δ>20% retention = yellow, WT >20% retention = red, no retention = grey). (B) Histogram of intron length for introns retained (IR) at the indicated percentage for rtf2Δ samples. (C) Rolling average of GC richness (rolling window of 40 bp) for introns and the following exon aligned around the centre of the branch point (BP) motif. Top graph: different subsets of intron:exon sequences based on difference in intron retention (IR; rtf2Δ – WT); Middle graph: Random represents GC richness of 100 random intron:exon sequences with error bars representing the 95% confidence intervals. Bottom graph: Middle graph with added actual G/C content from intron 2 and intron 6 of rtf1.
Figure 3—figure supplement 3
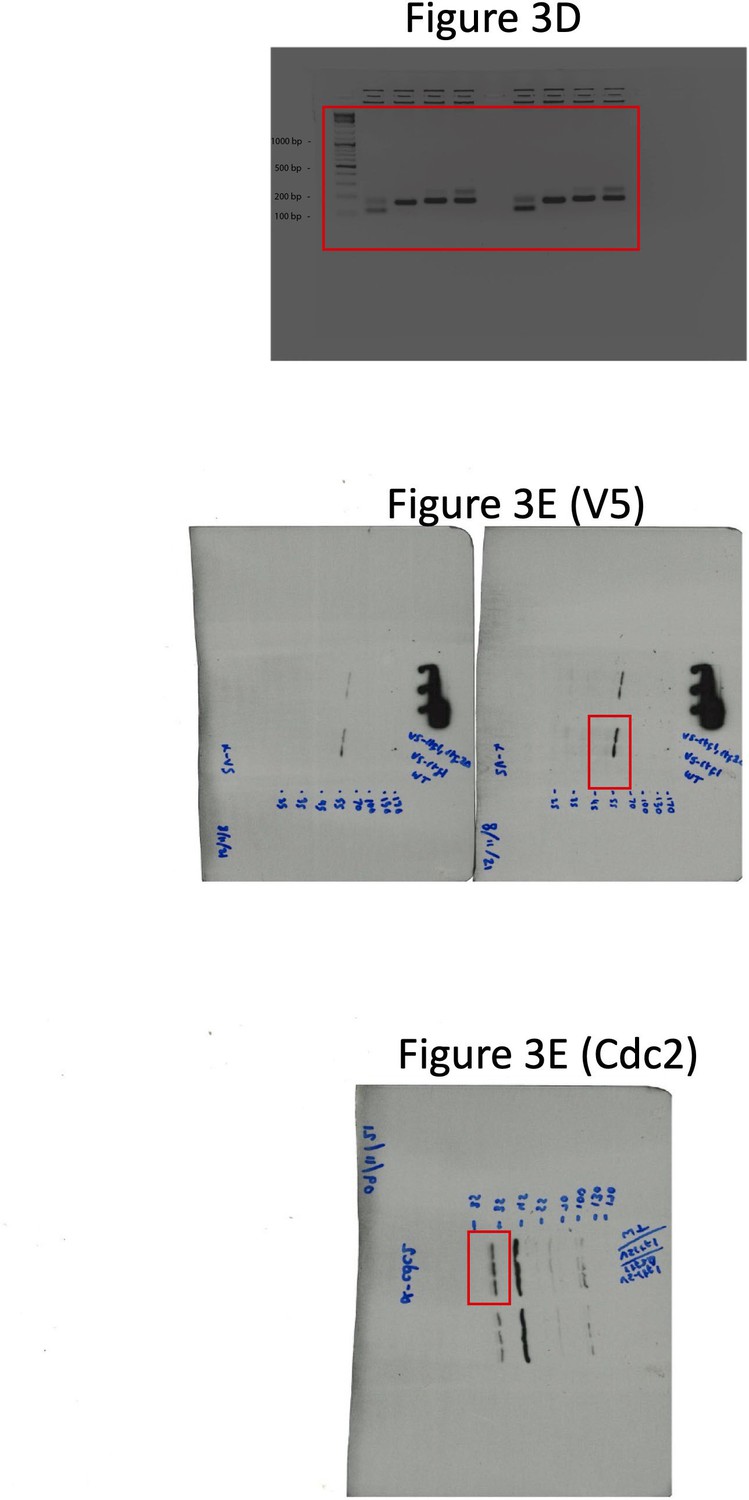
Uncropped blots for Figure 3.
Figure 4 with 4 supplements

Intronless rtf1 rescues the rtf2Δ phenotype restoring full RTS1 RFB activity.
(A) Representative schematic of the rtf1+ gene containing both exons and introns, and the intronless version, rtf1Δint that contains only exons. rtf1Δint was inserted at the native locus and is under the control of the native promoter. (B) Replication fork slippage events scored as the frequency of ura4+ reversions. Data from at least three independent experiments ± SD. Statistical analysis was by two-tailed Students T-test, p>0.05 = not significant (ns). (C) Polymerase bias graph calculated using the ratio of polymerase usage across both strands at the RTS1 RFB In cells expressing rtf1Δint and either with or deleted for rtf2+.
Figure 4—figure supplement 1
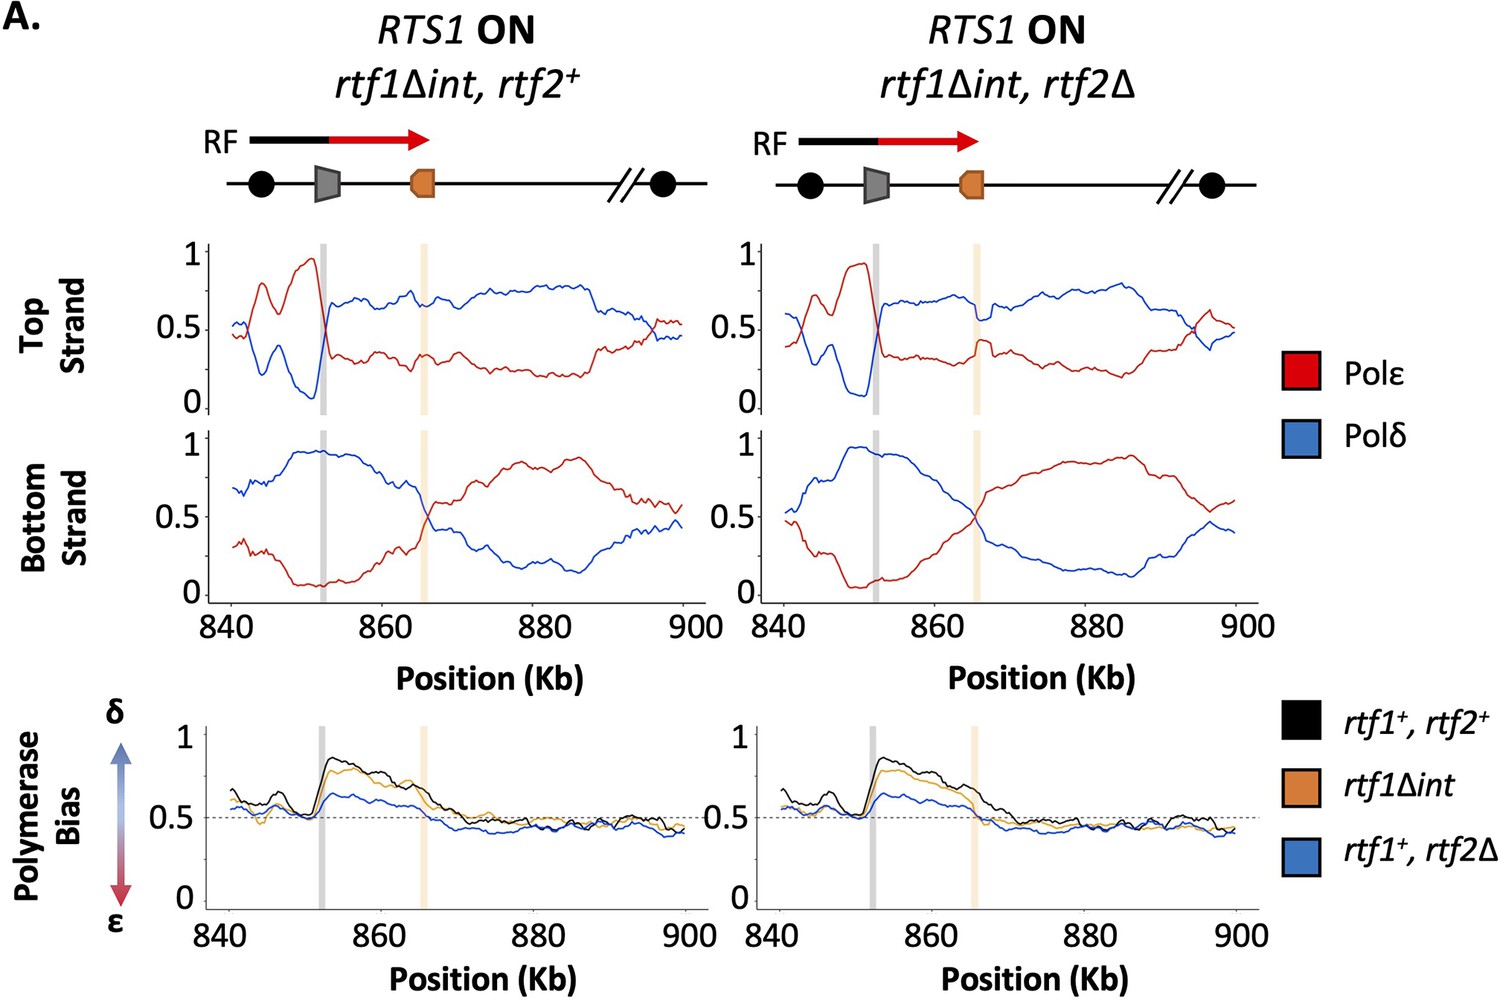
Intronless rtf1 raw Pu-seq traces.
(A) Polymerase-usage sequencing at active RTS1 RFB (RTS1 ON) in an rtf1Δint background with either rtf2+ (left panel) or rtf2Δ (right panel) backgrounds. Top panel shows the ratio of Polymerase ε (red) and Polymerase ẟ (blue) for both the top and bottom strand. Bottom panel shows the polymerase bias calculated using the ratio of polymerase usage across both strands at the RTS1 RFB from the samples traces above (orange) in comparison to a WT rtf1+ background with either rtf2+ (black) or rtf2Δ (blue).
Figure 4—figure supplement 2
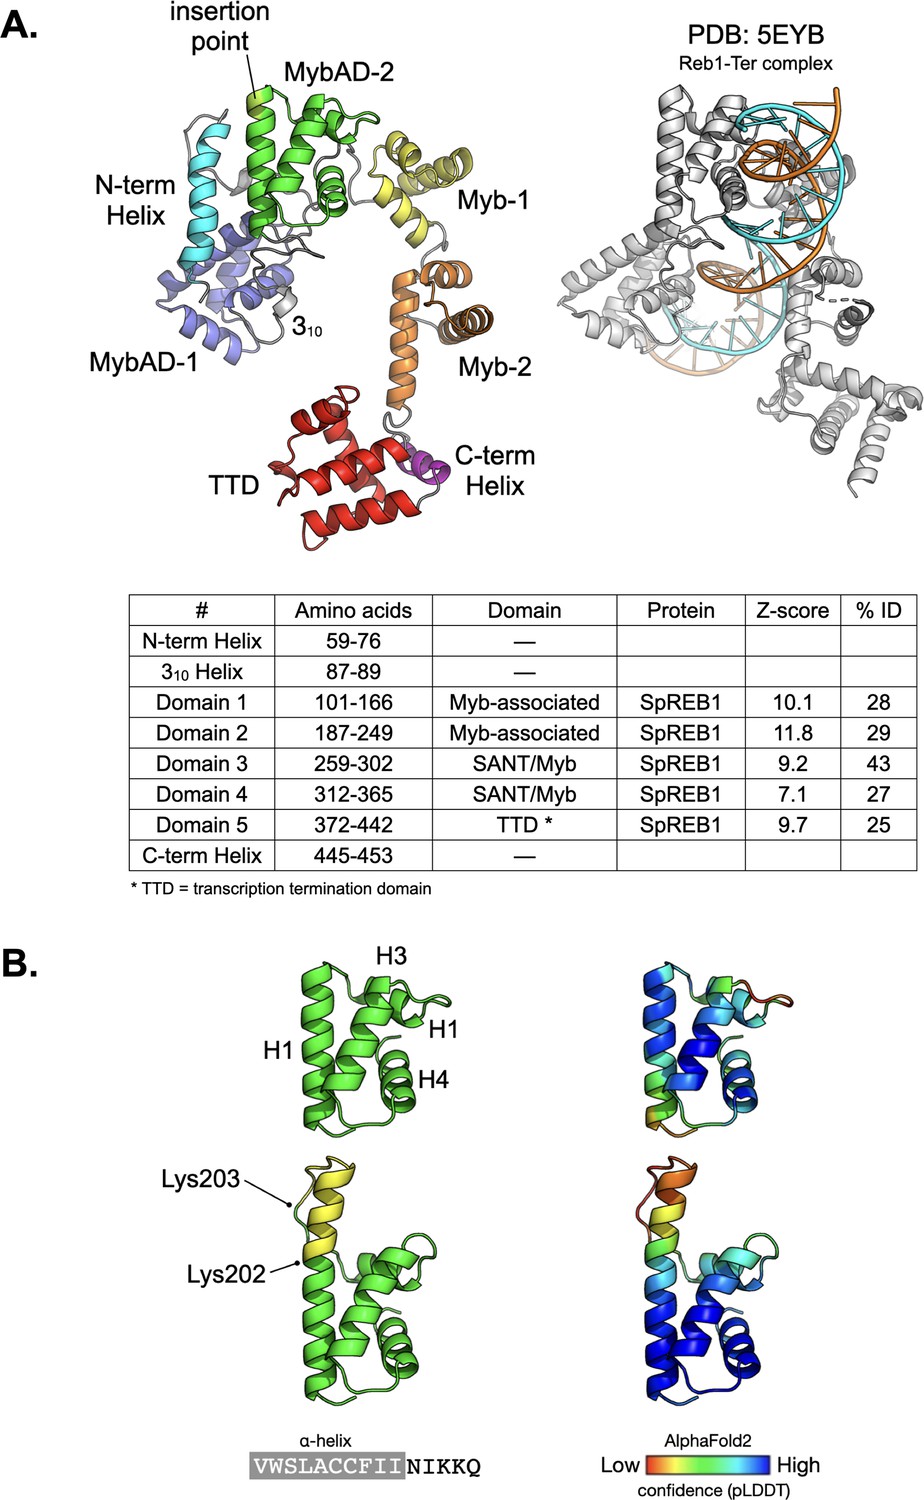
Rtf1 structural predictions.
(A) Left: Secondary structure cartoon for an AlphaFold2 (AF2) model of S. pombe Rtf2, coloured according to its predicted domain composition. Right: A DALI search using the AF2 model, indicated a high degree of similarity to the X-ray crystal structure of S. pombe Reb1 in complex (coloured grey) with a cognate Ter3 terminator DNA binding site (orange/cyan). (B) Left: AF2 model for the wildtype (top) and splice variant (bottom) of S. pombe Rtf2. Wildtype residues are coloured green and the inserted amino acids are coloured yellow. These are predicted to extend the H1 helix, yet preserve the overall fold of the MybAD-2 domain. Right: The two models are also shown coloured according to AF2 pLDDT confidence score.
-
Figure 4—figure supplement 2—source data 1
Source data for Figure 4—figure supplement 2.
- https://cdn.elifesciences.org/articles/78554/elife-78554-fig4-figsupp2-data1-v2.zip
Figure 4—figure supplement 3
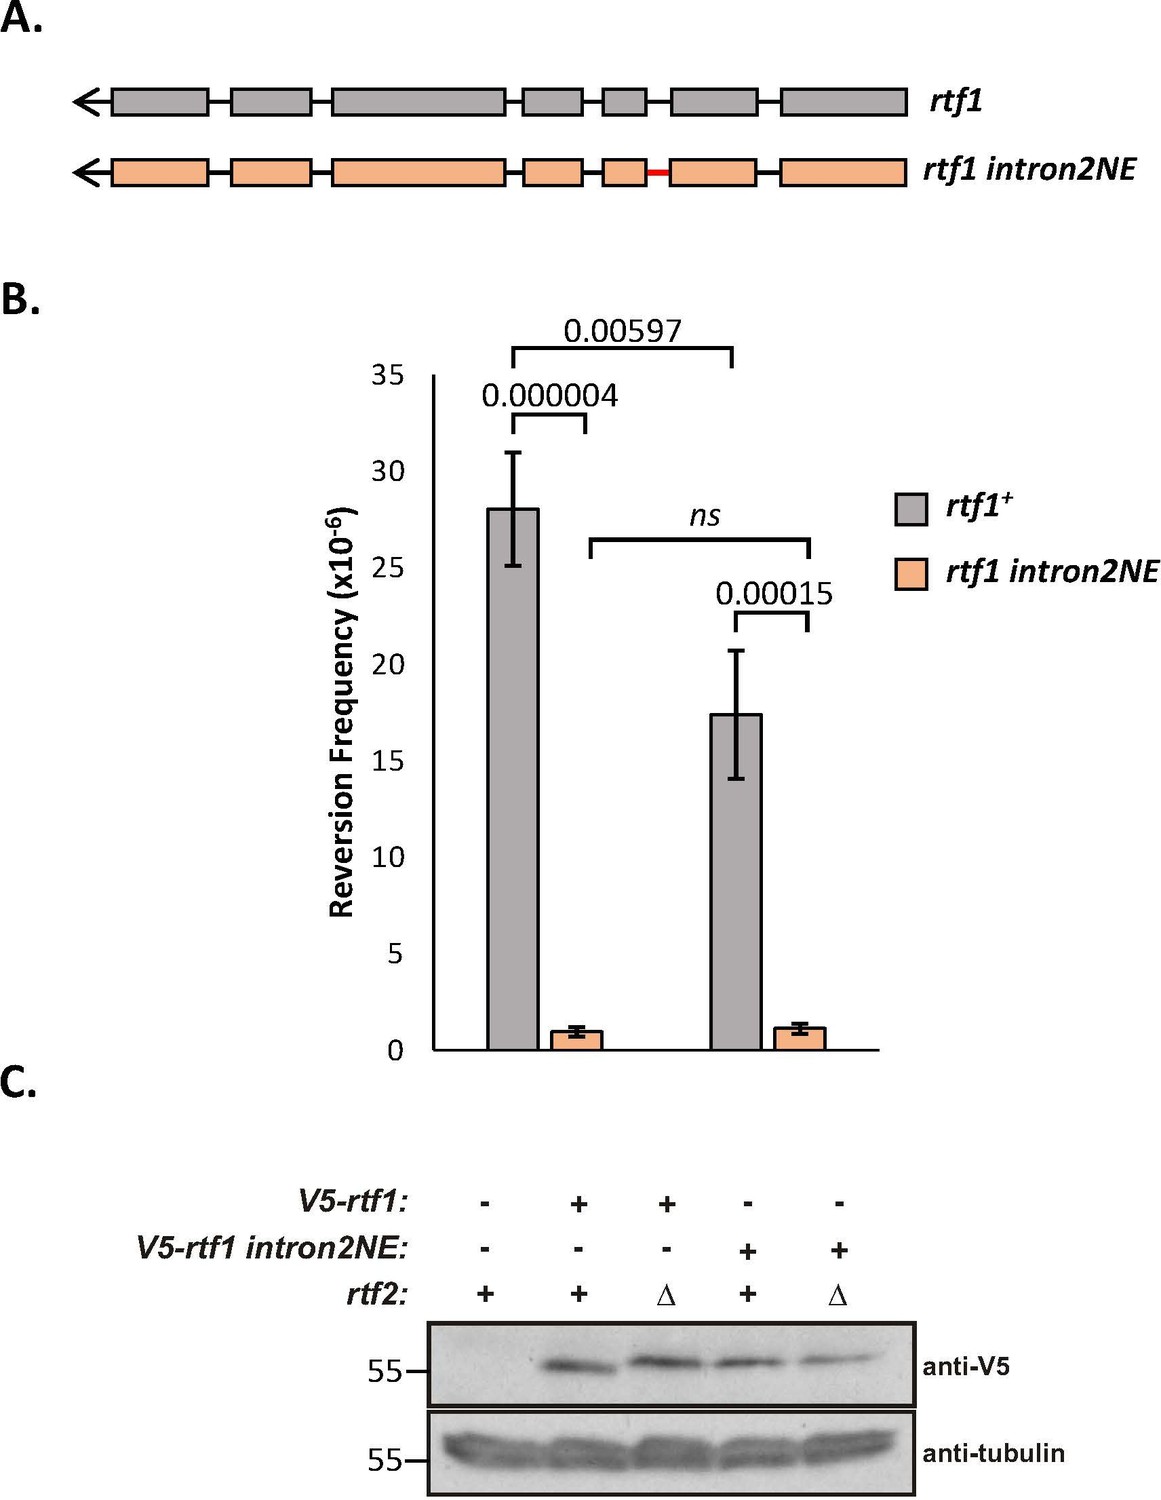
Rtf1 with the amino acid sequence from a non-excisable intron 2 does not increase slippage.
(A) Schematic of rtf1+ (grey) and rtf1-2NE (orange), where intron 2 is modified to encode the same amino acid sequence but to be non-excisable (red line). (B) Replication fork slippage events scored as the frequency of ura4+ reversions. Data from at least three independent experiments ± SD. Statistical analysis was by two-tailed Students T-test. (C) Whole cell extract of V5-rtf1 and V5-rtf1 intron2NE containing cells in WT and rtf2Δ background probed with indicated antibody. Tubulin is shown as a loading control.
Figure 4—figure supplement 4
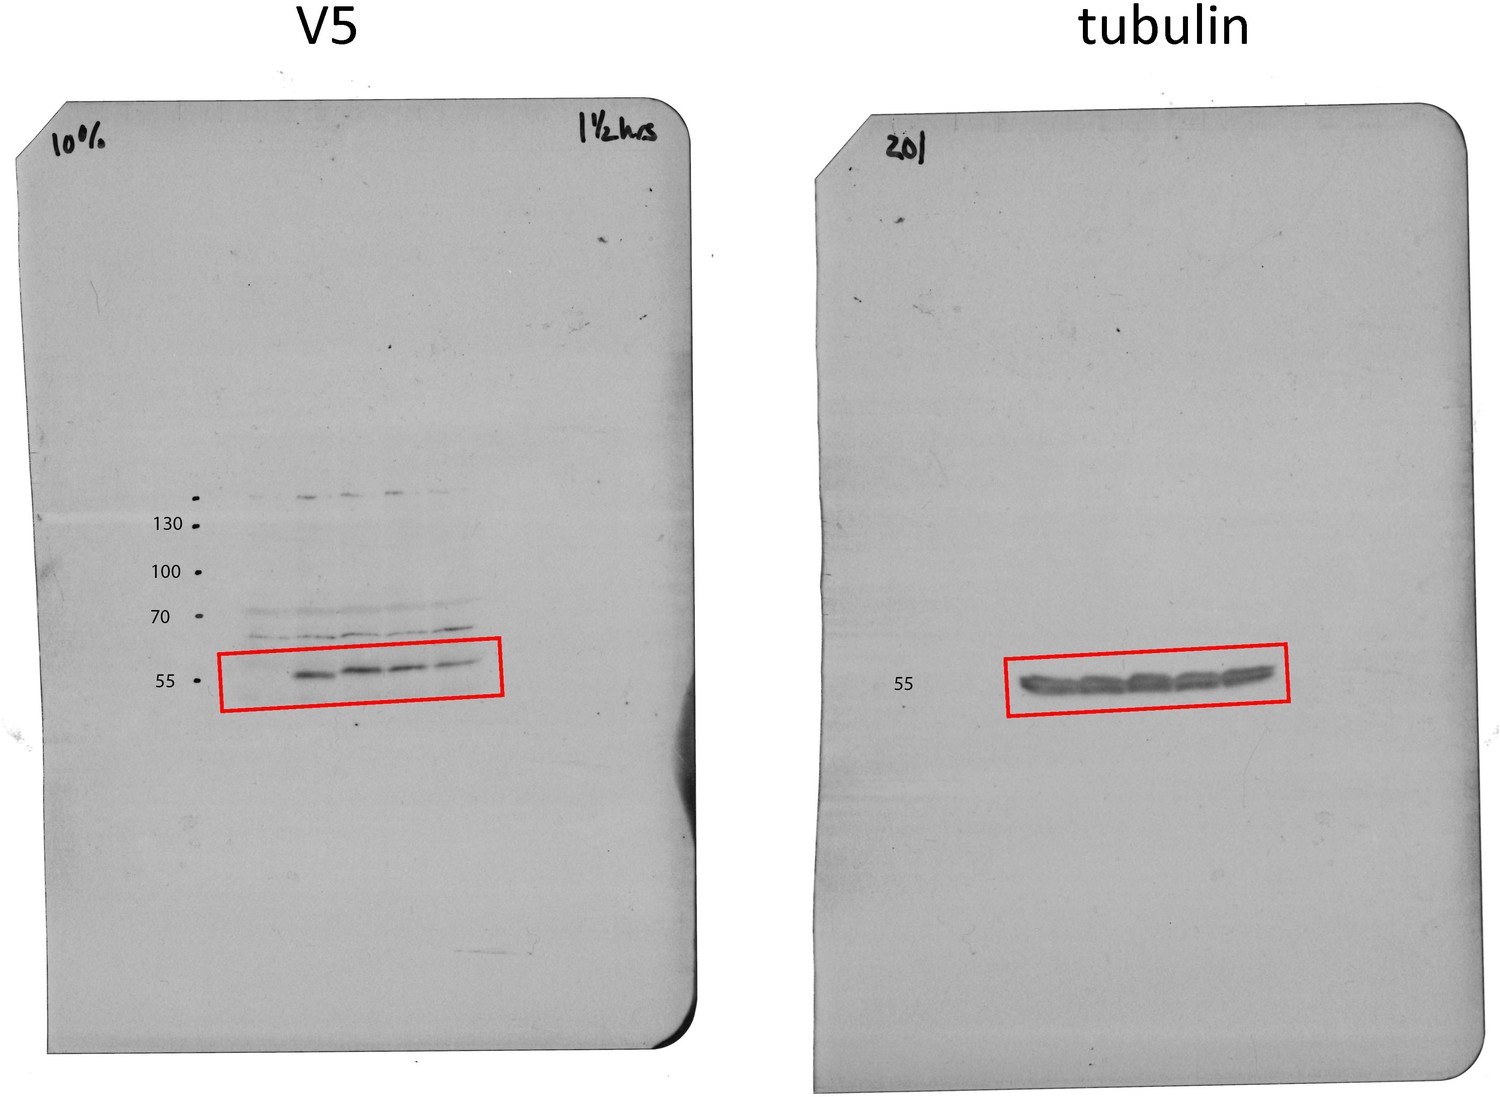
Uncropped blots for Figure 4—figure supplement 3.
Figure 5
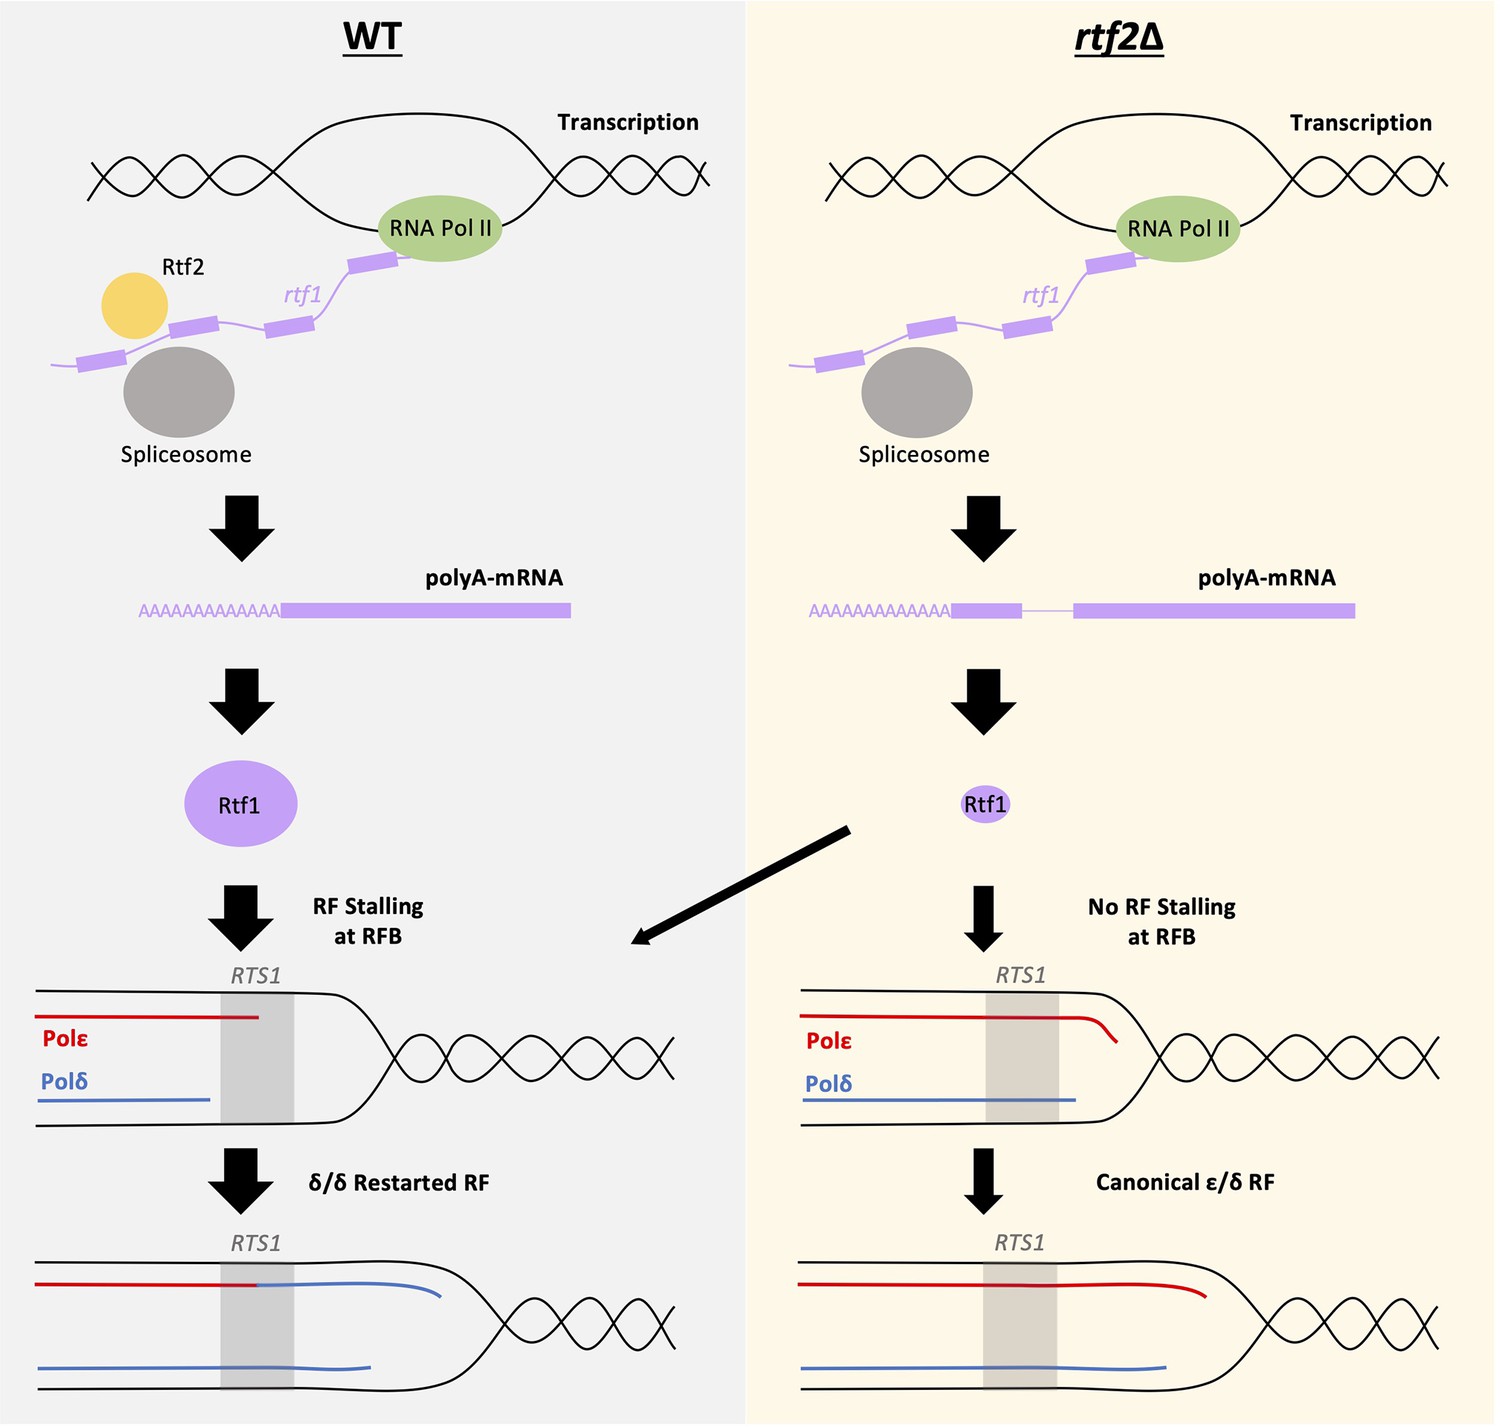
Mis-splicing of rtf1 mRNA in rtf2Δ cells results in reduced RTS1 RFB Activity.
Left panel: In wildtype cells Rtf2 is present and allows for the correct splicing of rtf1 mRNA and the production of functional Rtf1 protein. This results in replication fork stalling at RTS1 and RDR, which produces non-canonical δ/δ replication forks. Right panel: In rtf2Δ cells, rtf1 mRNA is mis-spliced resulting in retention of intron 2. This produces an Rtf1 protein less capable of blocking replication forks at RTS1 manifesting as some forks able to bypass RTS1 unhindered and continue as canonical replication forks. A small portion of forks are still arrested and restart by RDR resulting in a small proportion of non-canonical δ/δ replication.
Tables
Key resources table
| Reagent type (species) or resource | Designation | Source or reference | Identifiers | Additional information |
|---|---|---|---|---|
| Antibody | Anti-HA (mouse monoclonal) | SantaCruz | SC-7392 | IB(1:1000) |
| Recombinant DNA reagent | Anti-V5 (mouse monoclonal) | Bio-Rad | MCA1360 | IB(1:5000) |
| Sequence-based reagent | Anti-Tubulin (mouse monoclonal) | Sigma | T5168 | IB(1:20,000) |
| Peptide, recombinant protein | Anti-Cdc2 (rabbit polyclonal) | SantaCruz | SC-53 | IB(1:5000) |
| Commercial assay or kit | NEBuilder HiFi DNA Assembly Master Mix | NEB | E2621L | |
| Commercial assay or kit | MasterPure Yeast RNA Extraction Kit | Biosearch Technologies | MPY03100 | |
| Commercial assay or kit | NEBNext Poly(A) mRNA Magnetic Isolation Module | NEB | E7490 | |
| Commercial assay or kit | RevertAid Firest Strand cDNA Synthesis Kit | Thermo | K1621 | |
| Commercial assay or kit | Nanopore Direct cDNA Sequencing Kit | Oxford Nanopore | SQK-DCS109 | |
| Commercial assay or kit | MiniION sequencing device | Oxford Nanopore | MIN-101B | |
| Commercial assay or kit | MiniION Flow Cell | Oxford Nanopore | FLO-MIN106D | Chemistry type (R9.4.1) |
| Commercial assay or kit | Microcon Y M-30 Filter Unit | Millipore | 42410 MRCF0R030 | |
| Commercial assay or kit | SPE Column (C18 resin) | Pierce | 89870 | |
| Chemical compound, drug | 3-BrB-PP1 | Abcam | ab143756 | |
| Software, algorithm | Bowtie2 | PMID:22388286 | v2.4.4 | |
| Software, algorithm | Puseq_app | PMID:26492137 | v1 | R script |
| Software, algorithm | MaxQuant | PMID:27809316 | v1.6.12.0 | |
| Software, algorithm | Perseus | PMID:27348712 | v1.6.15.0 | |
| Software, algorithm | Minimap2 | Li, 2018 | ||
| Software, algorithm | GffCompare | Pertea and Pertea, 2020 |
Table 1
Strain list.
| Strain | Genotype | Reference |
|---|---|---|
| BAY119 | II::RTS1-ura4-10xrRFB, RTS1Δ::Phleo, rnh201Δ::KAN, rtf2Δ::NAT, cdc6L591G, ade6-704, leu1-32, ura4-d18 | This study |
| BAY120 | II::RTS1-ura4-10xrRFB, RTS1Δ::Phleo, rnh201Δ::KAN, rtf2Δ::NAT, rtf1Δ::HYG, cdc6L591G, ade6-704, leu1-32, ura4-d18 | This study |
| BAY121 | II::RTS1-ura4-10xrRFB, RTS1Δ::Phleo, rnh201Δ::KAN, rtf2Δ::NAT, cdc20_M630F, ade6-704, leu1-32, ura4-d18 | This study |
| BAY122 | II::RTS1-ura4-10xrRFB, RTS1Δ::Phleo, rnh201Δ::KAN, rtf2Δ::NAT, rtf1Δ::HYG, cdc20_M630F, ade6-704, leu1-32, ura4-d18 | This study |
| BAY123 | II::RTS1-ura4-10xrRFB, RTS1Δ::Phleo, rnh201Δ::KAN, rtf1Δ::HYG, cdc20M630F, ade6-704, leu1-32, ura4-d18 | Naiman et al., 2021 |
| BAY124 | II::RTS1-ura4-10xrRFB, RTS1Δ::Phleo, rnh201Δ::KAN, cdc20M630F, ade6-704, leu1-32, ura4-d18 | Naiman et al., 2021 |
| BAY125 | II: RTS1-ura4-10xrRFB, RTS1Δ::Phleo, rnh201Δ::KAN, rtf1Δ::HYG, cdc6L591G, ade6-704, leu1-32, ura4-d18 | Naiman et al., 2021 |
| BAY126 | II::RTS1-ura4-10xrRFB, RTS1Δ::Phleo, rnh201Δ::KAN, cdc6L591G, ade6-704, leu1-32, ura4-d18 | Naiman et al., 2021 |
| BAY144 | II::Rura4sd20-10xrRFB, RTS1Δ::Phleo, rtf1Δ::NAT, ade6-704, leu1-32, ura4-d18 | This study |
| BAY146 | II::Rura4sd20-10xrRFB, RTS1Δ::Phleo, ade6-704, leu1-32, ura4-d18 | This study |
| BAY176 | II::Rura4sd20-10xrRFB, RTS1Δ::Phleo, rtf2Δ::NAT, ade6-704, leu1-32, ura4-d18 | This study |
| BAY182 | rtf2-3HA:KAN, ade6-704, leu1-32, ura4-d18 | This study |
| BAY237 | II::RTS1_AΔ-ura4-10xrRFB, RTS1Δ::Phleo, rnh201Δ::KAN, cdc6L591G, ade6-704, leu1-32, ura4-d18 | This study |
| BAY238 | II::RTS1_AΔ-ura4-10xrRFB, RTS1Δ::Phleo, rnh201Δ::KAN, cdc20M630F, ade6-704, leu1-32, ura4-d18 | This study |
| BAY239 | II::RTS1_AΔ-ura4-10xrRFB, RTS1Δ::Phleo, rnh201Δ::KAN, rtf1Δ::HYG, cdc6L591G, ade6-704, leu1-32, ura4-d18 | This study |
| BAY240 | II::RTS1_AΔ-ura4-10xrRFB, RTS1Δ::Phleo, rnh201Δ::KAN, rtf1Δ::HYG, cdc20M630F, ade6-704, leu1-32, ura4-d18 | This study |
| BAY241 | II::RTS1_AΔ-ura4-10xrRFB, RTS1Δ::Phleo, rnh201Δ::KAN, rtf2Δ::NAT, cdc20_M630F, ade6-704, leu1-32, ura4-d18 | This study |
| BAY242 | II::RTS1_AΔ-ura4-10xrRFB, RTS1Δ::Phleo, rnh201Δ::KAN, rtf2Δ::NAT, cdc6L591G, ade6-704, leu1-32, ura4-d18 | This study |
| BAY246 | rtf2-3HA:TurboID:KAN, ade6-704, leu1-32, ura4-d18 | This study |
| BAY249 | II::RTS1_AΔura4sd20-10xrRFB, RTS1Δ::Phleo, rtf1Δ::HYG, ade6-704, leu1-32, ura4-d18 | This study |
| BAY251 | II::RTS1_AΔura4sd20-10xrRFB, RTS1Δ::Phleo, ade6-704, leu1-32, ura4-d18 | This study |
| BAY252 | II::RTS1_AΔura4sd20-10xrRFB, RTS1Δ::Phleo, rtf2Δ::NAT, ade6-704, leu1-32, ura4-d18 | This study |
| BAY253 | II::RTS1_AΔura4sd20-10xrRFB, RTS1Δ::Phleo, rtf2Δ::NAT, rtf1Δ::HYG, ade6-704, leu1-32, ura4-d18 | This study |
| BAY267 | rtf2-3HA-TurboID:KAN, cdc2asM17, II::RTS1-ura4-10xrRFB, ade6-704, leu1-32, ura4-d18 | This study |
| BAY268 | mud1Δ::HYG, ade6-704, leu1-32, ura4-d18 | This study |
| BAY269 | mud1Δ::HYG, rtf2-3HA:KAN, ade6-704, leu1-32, ura4-d18 | This study |
| BAY273 | mud1Δ::HYG, rtf2Δ::NAT, ade6-704, leu1-32, ura4-d18 | This study |
| BAY278 | II::RTS1-ura4sd20-10xrRFB, rtf1Δint:HYG, RTSΔ::Phleo, ade6-704, leu1-32, ura4-d18 | This study |
| BAY279 | II::RTS1-ura4sd20-10xrRFB, rtf1Δint:HYG, RTSΔ::Phleo, rtf2Δ::NAT, ade6-704, leu1-32, ura4-d18 | This study |
| BAY280 | II::RTS1-ura4-10xrRFB, RTS1Δ::Phleo, rtf1Δint:HYG, rnh201Δ::KAN, cdc20M630F, ade6-704, leu1-32, ura4-d18 | This study |
| BAY281 | II::RTS1-ura4-10xrRFB, RTS1Δ::Phleo, rtf1Δint:HYG, rtf2Δ::NAT, rnh201Δ::KAN, cdc20M630F, ade6-704, leu1-32, ura4-d18 | This study |
| BAY282 | II::RTS1-ura4-10xrRFB, RTS1Δ::Phleo, rtf1Δint:HYG, rnh201Δ::KAN, cdc6L591G, ade6-704, leu1-32, ura4-d18 | This study |
| BAY283 | II::RTS1-ura4-10xrRFB, RTS1Δ::Phleo, rtf1Δint:HYG, rtf2Δ::NAT, rnh201Δ::KAN, cdc6L591G, ade6-704, leu1-32, ura4-d18 | This study |
| BAY285 | V5-rtf1, ade6-704, leu1-32, ura4-d18 | This study |
| BAY286 | V5-rtf1, rtf2Δ::NAT, ade6-704, leu1-32, ura4-d18 | This study |
| AW2280 | rtf1 intron2NE-hphMX6, ade6-704, leu1-32, ura4D18 | This study |
| AW2284 | V5-rtf1 intron2NE-hphMX6, ade6-704, leu1-32, ura4D18 | This study |
| AW2309 | V5-rtf1 intron2NE-hphMX6, rtf2::natMX6, ade6-704, leu1-32, ura4D18 | This study |
| AW2324 | II:Rura4sd20-10XrRFB, RTS1::pleoMX6, rtf1 intron2NE:hphMX6, ade6-704, leu1-32, ura4D18 | This study |
| AW2327 | II:Rura4sd20-10XrRFB, RTS1::pleoMX6, rtf1 intron2NE:hphMX6, rtf2::natMX6, ade6-704, leu1-32, ura4D18 | This study |
Table 2
Primer list.
| Name | Sequence |
|---|---|
| A30 | GGAGGTTGAGTGTGGGACGTTTCTGCCATACCCTTTTTAAGT |
| A31 | GGTATGGCAGAAACGTCCCACACTCAACCTCCCAAT |
| P1 | ATTATACGAAGTTATGCATGGTTTGATATGAGGCAGATAC |
| P2 | TTCCTTGCATAATAATGTTCACTTGTCTGAAG |
| P3 | GAACATTATTATGCAAGGAAAAAACAATTTAAG |
| P4 | CGCTGGCCGGCTAGCATAAATCATCGGC |
| P5 | TTTATGCTAGCCGGCCAGCGACATGGAG |
| P6 | ATACCATATACGAAGTTATACGACAGCAGTATAGCGACCAG |
| P7 | GGAGCAAACGACATTATCAC |
| P8 | CATCACGATGGTTATCAGAC |
| P9 | CTATGGACAGCAGATGCTTG |
| P10 | GCGGTGTAAGAATCATGTAA |
| P11 | GAAGTTATGCATGCTCTACCCGTATGATGTTCCGGA |
| P12 | AGCTGCGGCGCGCCTCACTTTTCGGCAGACCGCAGAC |
Additional files
-
Supplementary file 1
List of significant Mass spec. hits.
- https://cdn.elifesciences.org/articles/78554/elife-78554-supp1-v2.xlsx
-
Supplementary file 2
GO terms -S phase experiment.
- https://cdn.elifesciences.org/articles/78554/elife-78554-supp2-v2.xlsx
-
Supplementary file 3
GO terms -MMS experiment.
- https://cdn.elifesciences.org/articles/78554/elife-78554-supp3-v2.xlsx
-
Supplementary file 4
Transcript types.
- https://cdn.elifesciences.org/articles/78554/elife-78554-supp4-v2.xlsx
-
Supplementary file 5
Intron retention calculations.
- https://cdn.elifesciences.org/articles/78554/elife-78554-supp5-v2.xlsx
-
Supplementary file 6
Gene list.
- https://cdn.elifesciences.org/articles/78554/elife-78554-supp6-v2.xlsx
-
Supplementary file 7
Data for slippage assays.
- https://cdn.elifesciences.org/articles/78554/elife-78554-supp7-v2.xlsx
-
MDAR checklist
- https://cdn.elifesciences.org/articles/78554/elife-78554-mdarchecklist1-v2.docx
Download links
A two-part list of links to download the article, or parts of the article, in various formats.
Downloads (link to download the article as PDF)
Open citations (links to open the citations from this article in various online reference manager services)
Cite this article (links to download the citations from this article in formats compatible with various reference manager tools)
Schizosaccharomyces pombe Rtf2 is important for replication fork barrier activity of RTS1 via splicing of Rtf1
eLife 12:e78554.
https://doi.org/10.7554/eLife.78554


