Macrophages regulate gastrointestinal motility through complement component 1q
- Department of Immunology, The University of Texas Southwestern Medical Center, United States
- The Howard Hughes Medical Institute, The University of Texas Southwestern Medical Center, United States
Figures
Figure 1 with 1 supplement

Complement component 1q (C1q) is expressed by macrophages in the mouse small intestine.
(A) RNA-seq analysis of soluble defense collagen expression in the small intestines (ileum) of C57BL/6 mice. Data were adapted from a previously published RNA-seq analysis (Gattu et al., 2019). Data are available in the Gene Expression Omnibus repository under accession number GSE122471. Each column represents one mouse. (B) Quantitative PCR (qPCR) measurement of C1qa, C1qb, and C1qc transcript abundance in CD45+ and CD45- cells purified from mouse small intestines by flow cytometry. Each data point represents one mouse, and the results are representative of two independent experiments. (C) qPCR measurement of C1qa, C1qb, and C1qc transcript abundance in subepithelial and intraepithelial cells recovered from mouse small intestines. Each data point represents one mouse, and the results are representative of three independent experiments. (D) Representative immunoblot of subepithelial and intraepithelial cells recovered from mouse small intestines, with detection of C1q and actin (control). Each lane represents cells from one mouse and the immunoblot is representative of three independent experiments. (E) Flow cytometry gating strategy for analysis of mouse small intestinal cell suspensions in panels F, G, and H. Cells were pre-gated as live CD45+ cells. SSC, side-scatter; MHCII, major histocompatibility complex II. (F) qPCR measurement of C1qa, C1qb, and C1qc transcript abundance in cells isolated by flow cytometry from mouse small intestines as indicated in (E). Each data point represents cells pooled from three mice, and the results are representative of three independent experiments. (G) Flow cytometry analysis of intracellular C1q in small intestinal subepithelial cells identified as indicated in (E). (H) Quantitation of flow cytometry analysis in (G). Each data point represents one mouse, and the results are representative of two independent experiments. Sm. int., mouse small intestine; Error bars represent SEM. **p<0.01; ***p<0.001; ****p<0.0001; ns, not significant by one-way ANOVA (A,F) or two-tailed Student’s t-test (B,C,H).
-
Figure 1—source data 1
Unedited, uncropped immunoblot for Figure 1D.
- https://cdn.elifesciences.org/articles/78558/elife-78558-fig1-data1-v2.zip
Figure 1—figure supplement 1

Complement component 1q (C1q) is expressed in the mouse colon.
RNA-seq analysis of soluble defense collagen expression in the colons of C57BL/6 mice. Data were reanalyzed by Gattu et al., 2019. Each column represents one mouse. Data are available in the Gene Expression Omnibus repository under accession number GSE122471.
Figure 2 with 1 supplement
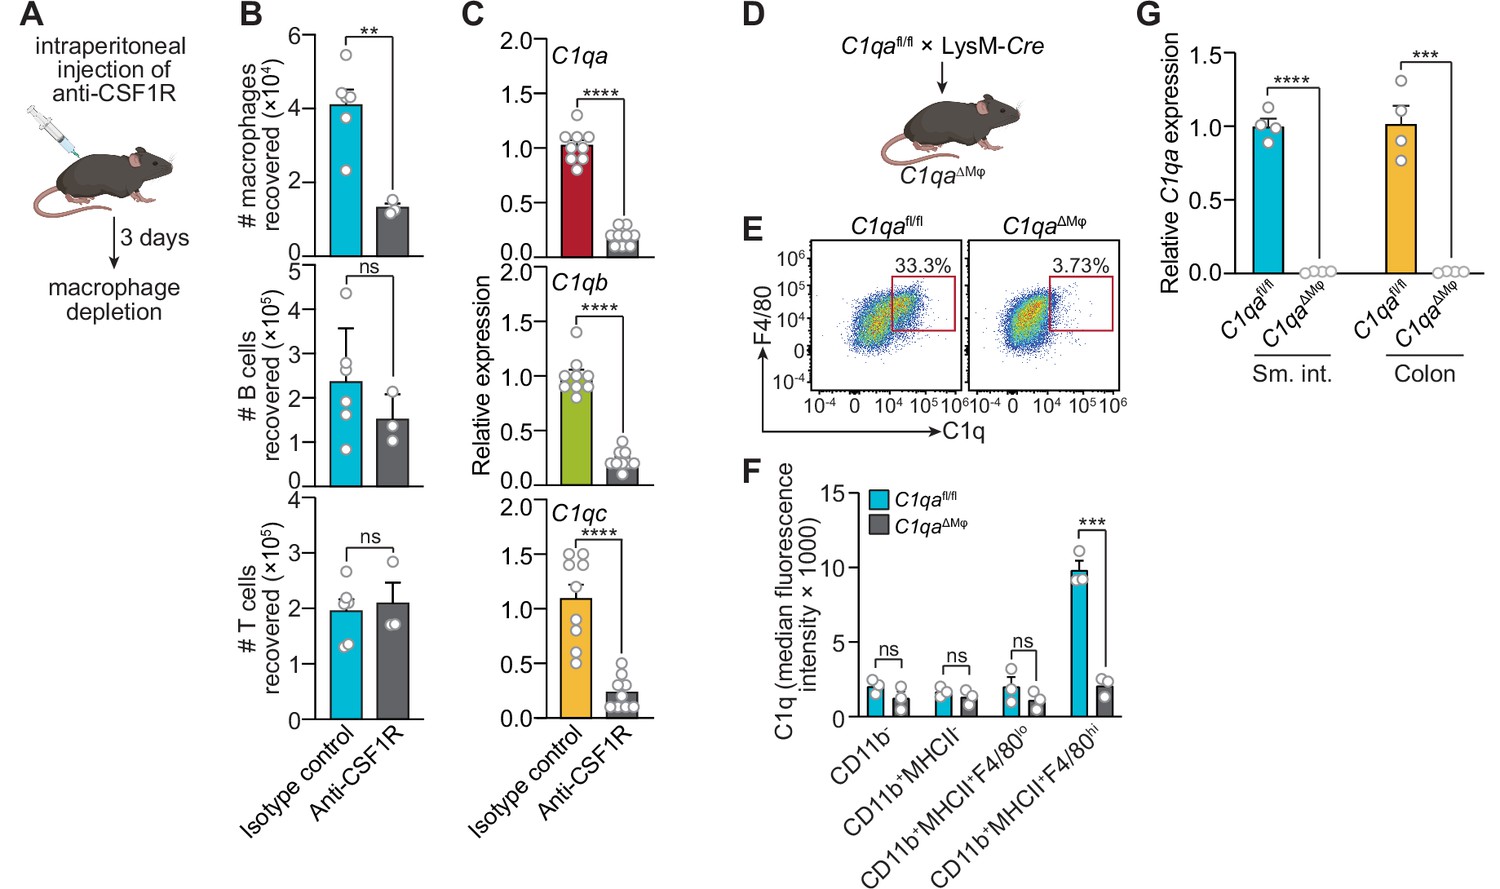
Macrophages are the primary source of complement component 1q (C1q) in the mouse gastrointestinal tract.
(A) Macrophages were selectively depleted in C57BL/6 mice by intraperitoneal injection of anti-CSF1R antibody. Control mice were injected with isotype-matched non-specific antibodies. Mice were analyzed 72 hr after antibody injection. Panel was generated at Biorender.com. (B) Representative flow cytometry analysis of mouse small intestines after intraperitoneal injection of anti-CSF1R or isotype control antibody. All cells were gated as live CD45+. Macrophages were MHCII+ F4/80hi; B cells were CD19+; T cells were CD3+. Total small intestinal cell yields were 1.5 × 10⁶ ± 4.9 × 10⁵ cells. (C) Quantitative PCR (qPCR) measurement of C1qa, C1qb, and C1qc transcript abundance in mouse small intestines after intraperitoneal injection of anti-CSF1R or rat IgG2a (isotype control). Each data point represents one mouse and results are pooled from two independent experiments. (D) C1qafl/fl mice were crossed with LysM-Cre transgenic mice to generate mice having a macrophage-selective deletion of C1qa (C1qa∆Mφ mice). Panel was generated at Biorender.com. (E) Representative flow cytometry analysis of intracellular C1q expression in small intestinal macrophages from C1qafl/fl and C1qa∆Mφ mice. Mice were littermates from heterozygous crosses that remained co-housed. Cells were gated on live CD45+CD11b+MHCII+. (F) Quantitation of the flow cytometry analysis in (E). Each data point represents one mouse. Results are representative of two independent experiments. (G) qPCR measurement of C1qa transcript abundance in the small intestines (sm. int.) and colons of C1qafl/fl and C1qa∆Mφ littermates. Each data point represents one mouse. Error bars represent SEM. **p<0.01; ***p<0.001; ****p<0.0001; ns, not significant by the two-tailed Student’s t-test.
Figure 2—figure supplement 1

Complement component 1q (C1q) expression is lost systemically but preserved in the central nervous system of C1qa∆Mφ mice.
(A) Quantitative PCR (qPCR) measurement of C1qa expression in lung, skin, liver, kidney, and brain. Each data point represents one mouse. Data are representative of two independent experiments. (B) C1q is absent from the serum of C1qa∆Mφ mice. Enzyme-linked immunosorbent assay (ELISA) detection of serum C1q protein from C1qafl/fl and C1qa∆Mφ littermates. Data are presented as C1q serum concentration based on a standard curve generated from purified recombinant mouse C1q. Each data point represents one mouse. nd, not detected. Data are representative of three independent experiments. Error bars represent SEM. ***p<0.001; ****p<0.0001; ns, not significant by the two-tailed Student’s t-test.
Figure 3 with 6 supplements
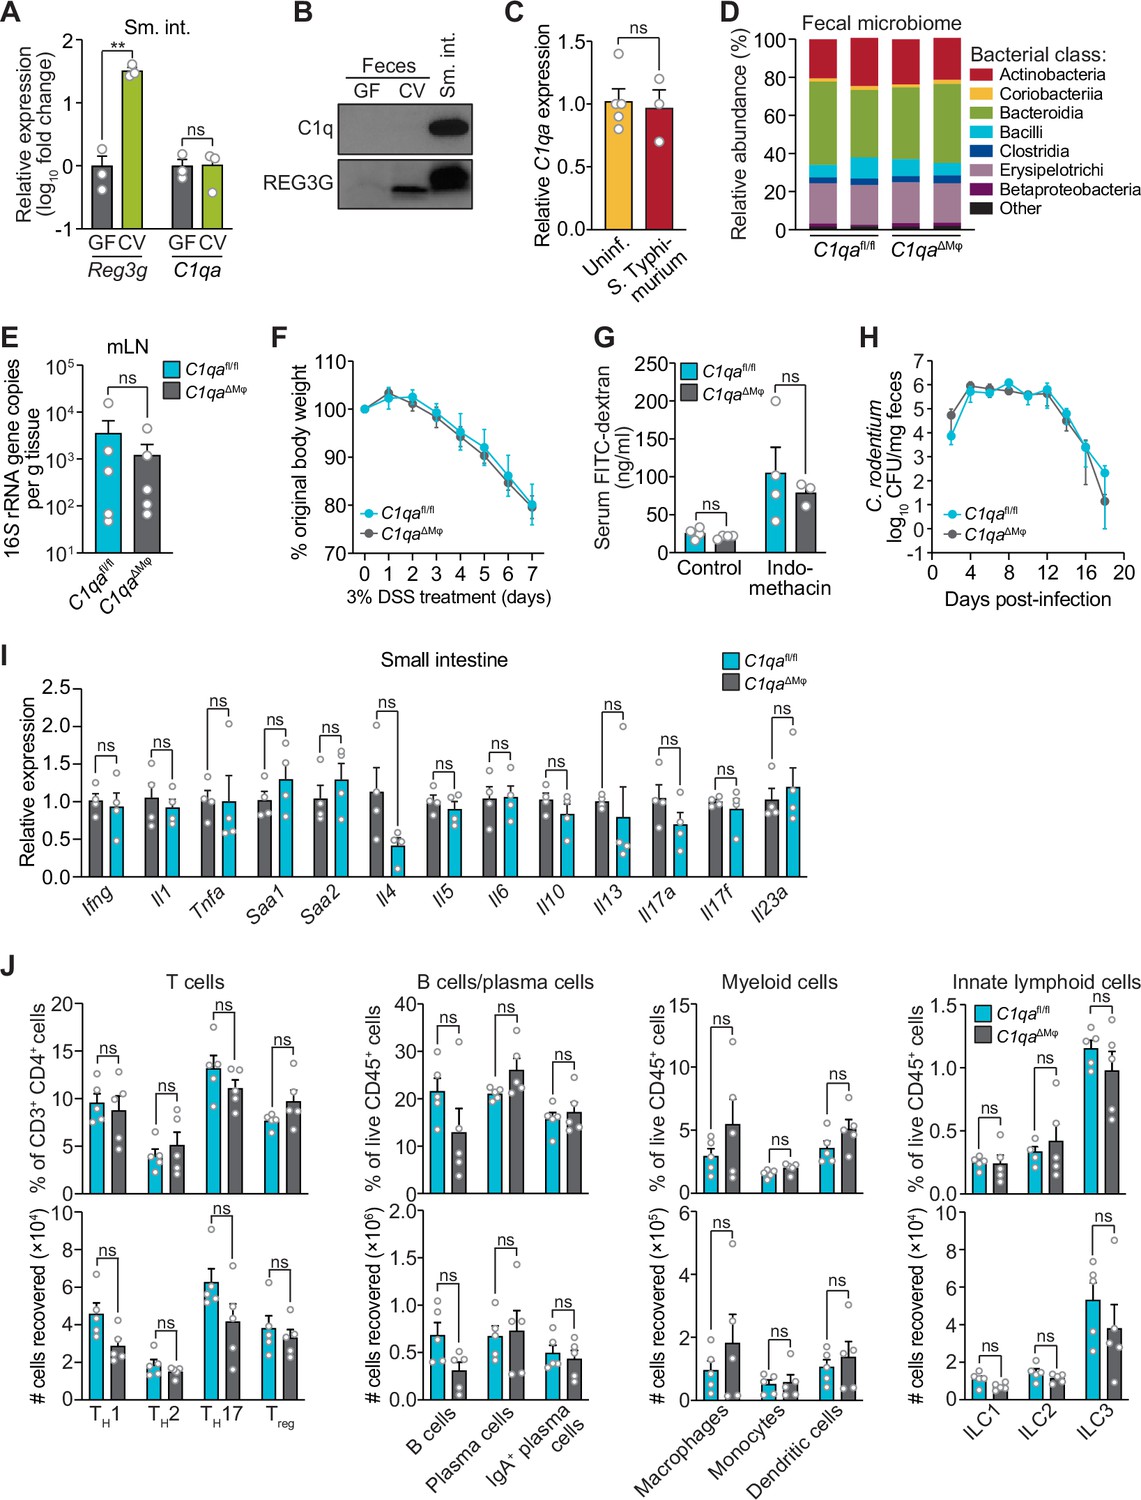
C1qaΔMφ mice do not show altered microbiota composition, barrier function, or resistance to enteric infection.
(A) Small intestinal C1qa expression is not induced by the intestinal microbiota. Quantitative PCR (qPCR) measurement of Reg3g and C1qa transcript abundances in the small intestines of germ-free (GF) and conventional (CV) C57BL/6 mice. Each data point represents one mouse and the results are representative of two independent experiments. (B) C1q is not detected in the mouse intestinal lumen or feces. Representative immunoblot of an ammonium sulfate precipitation of intestinal luminal contents and feces from germ-free and conventional mice with detection of C1q. C1q in small intestinal tissue is shown for comparison at right. REG3G was analyzed as a control, as it is secreted into the intestinal lumen of conventional mice (Cash et al., 2006). Each lane represents multiple mice pooled (n=5 and 9 for germ-free and conventional, respectively) and the immunoblot is representative of three independent experiments. (C) C1q gene expression is not altered by acute enteric infection with Salmonella typhimurium. qPCR measurement of C1qa transcript abundance in small intestinal tissue after oral inoculation of mice with 109 colony-forming units of S. typhimurium strain SL1344. Each data point represents one mouse, and the results are representative of two independent experiments. (D) Intestinal microbiota composition is not altered in C1qaΔMφ mice. Phylogenetic analysis of 16S rRNA gene sequences from fecal pellets collected from C1qafl/fl and C1qaΔMφ littermates. Operational taxonomic units with an average of 100 reads and populations greater than or equal to 1% were included in the graphical analysis. Each bar represents one mouse. Data are available from the Sequence Read Archive under BioProject ID PRJNA793870. (E) C1qaΔMφ mice do not show altered translocation of bacteria to mesenteric lymph nodes (mLN). 16S rRNA gene copy numbers were measured by qPCR with reference to a standard curve. Each data point represents one mouse. (F) C1qaΔMφ mice do not show altered susceptibility to dextran sulfate sodium (DSS)-induced colitis. Mice were provided with 3% DSS in drinking water and body weights were monitored for 7 days. n=4 and 6 for C1qafl/fl and C1qaΔMφ littermates, respectively. Differences at each time point were not significant by the two-tailed Student’s t-test. (G) C1qaΔMφ mice do not show altered intestinal permeability. To measure intestinal permeability, C1qafl/fl and C1qaΔMφ littermates were gavaged with fluorescein isothiocyanate (FITC)-dextran (4 kDa), and serum FITC-dextran levels were determined by fluorescence microplate assay against a FITC-dextran standard curve. Indomethacin induces intestinal damage in mice and was used as a positive control. Each data point represents one mouse. (H) Time course of fecal Citrobacter rodentium burden following oral gavage of C1qafl/fl and C1qaΔMφ mice with 5×10⁸ colony forming units (CFU) of C. rodentium. n=5 and 5 for C1qafl/fl and C1qaΔMφ littermates, respectively. Differences at each time point were not significant by the two-tailed Student’s t-test. (I) qPCR measurement of transcripts encoding secreted immune effectors in the small intestines of C1qafl/fl and C1qaΔMφ littermates. Each data point represents one mouse. (J) Flow cytometry analysis of small intestinal immune cell subsets from C1qafl/fl and C1qaΔMφ littermates. Gating strategies are shown in Figure 3—figure supplement 1 through 4. ILC, innate lymphoid cell. Total small intestinal cell yields were 8.8 × 10⁶ ± 2.9 × 10⁶ cells. Each data point represents one mouse. Sm. int., small intestine. Error bars represent SEM. **p<0.01; ns, not significant by the two-tailed Student’s t-test.
-
Figure 3—source data 1
Unedited, uncropped immunoblot for Figure 3B.
- https://cdn.elifesciences.org/articles/78558/elife-78558-fig3-data1-v2.zip
Figure 3—figure supplement 1

Histological analysis of dextran sulfate sodium (DSS)-treated mice.
C1qafl/fl and C1qaΔMφ mice were given 3% DSS in drinking water to induce colitis. (A) Representative sections of the colon were stained with hematoxylin and eosin. Scale bars = 50 μm. (B) Colon length and histology scores were determined. Histology scoring was performed by a pathologist who was blinded as to the mouse genotypes. n=3 for both C1qafl/fl and C1qaΔMφ littermates. Error bars represent SEM. ns, not significant by the two-tailed Student’s t-test.
Figure 3—figure supplement 2

Colon histology of Citrobacter rodentium-infected mice.
C1qafl/fl and C1qaΔMφ mice were infected orally with C. rodentium grown to log phase and fecal bacterial burdens were monitored for 18 days (Figure 3H). Representative sections of the colon from day 18 post-infection were stained with hematoxylin and eosin. Scale bars = 50 μm.
Figure 3—figure supplement 3

Flow cytometry gating strategy for comparison of T cell populations in C1qafl/fl and C1qa∆Mφ mice.
Small intestinal cells were recovered from C1qafl/fl and C1qa∆Mφ littermates and analyzed by flow cytometry. T cells were gated as live CD45+ CD3+ CD4+. T cell subsets were further identified by gating into Treg (FoxP3+), TH1 (T-bet+), TH17 (RORγt+), and TH2 (GATA3+). Representative plots from C1qafl/fl mice are presented and comparisons between C1qafl/fl and C1qa∆Mφ littermates are shown in Figure 3. FSC, forward scatter.
Figure 3—figure supplement 4

Flow cytometry gating strategy for comparison of B cell and plasma cell populations in C1qafl/fl and C1qa∆Mφ mice.
Small intestinal cells were recovered from C1qafl/fl and C1qa∆Mφ littermates and analyzed by flow cytometry. B cells were gated as live CD45+ CD19+ B220+. Plasma cells were gated as CD19+ B220-, and IgA+ plasma cells were further identified. Representative plots from C1qafl/fl mice are presented and comparisons between C1qafl/fl and C1qa∆Mφ littermates are shown in Figure 3. SSC, side scatter.
Figure 3—figure supplement 5
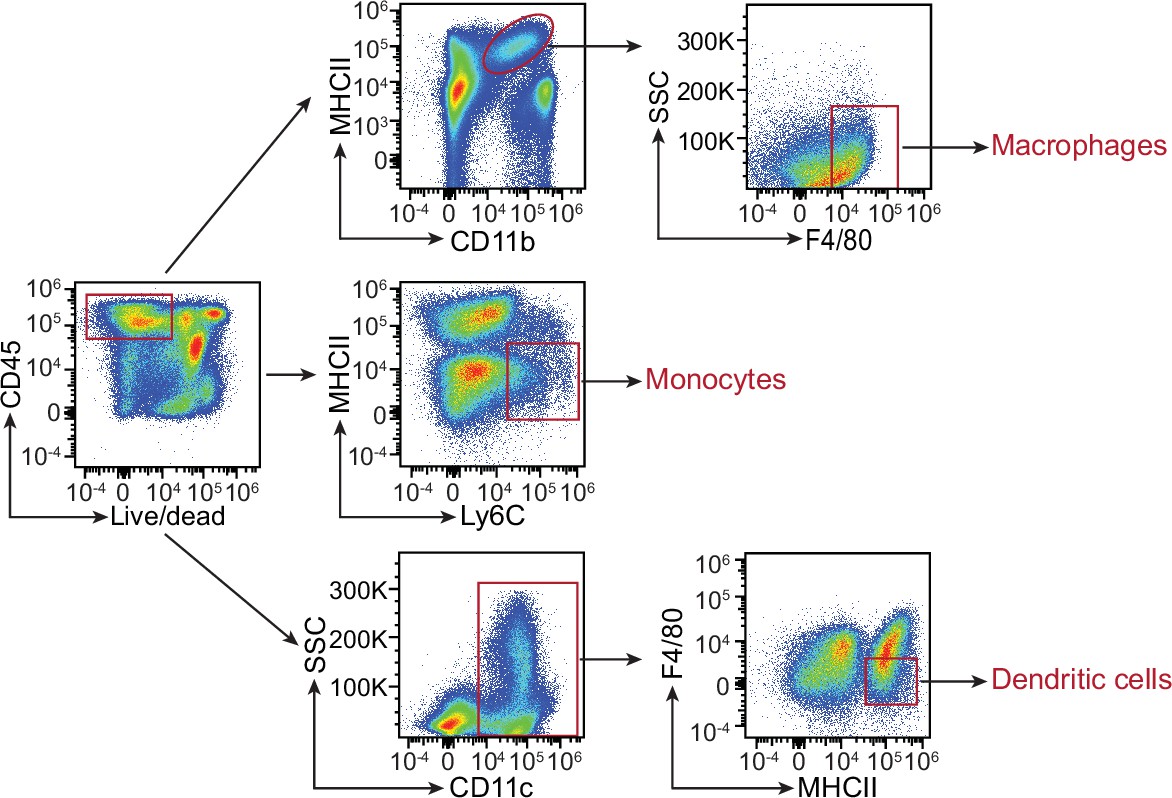
Flow cytometry gating strategy for comparison of myeloid cell populations in C1qafl/fl and C1qa∆Mφ mice.
Small intestinal cells were recovered from C1qafl/fl and C1qa∆Mφ littermates and analyzed by flow cytometry. Macrophages were gated as live CD45+ MHCII+ CD11b+ F4/80hi. Monocytes were gated as live CD45+ MHCII- Ly6C+. Dendritic cells were gated as live CD45+ CD11c+ MHCII+ F4/80lo. Representative plots from C1qafl/fl mice are presented and comparisons between C1qafl/fl and C1qa∆Mφ littermates are shown in Figure 3. SSC, side scatter; MHCII, major histocompatibility complex II.
Figure 3—figure supplement 6

Flow cytometry gating strategy for comparison of innate lymphoid cell populations in C1qafl/fl and C1qa∆Mφ mice.
Small intestinal cells were recovered from C1qafl/fl and C1qa∆Mφ littermates and analyzed by flow cytometry. Innate lymphoid cells (ILC) were gated as live CD45+ Lin- CD90.2+ and then further identified as ILC1 (RORγt- GATA3- T-bet+), ILC2 (RORγt- GATA3+) and ILC3 (RORγt+ GATA3-). Representative plots from C1qafl/fl mice are presented and comparisons between C1qafl/fl and C1qa∆Mφ littermates are shown in Figure 3. SSC, side scatter.
Figure 4 with 1 supplement

Complement component 1q (C1q) is expressed by muscularis macrophages that are located near enteric neurons.
(A) Graphic depicting the muscularis of the mouse small intestine. The lumen, epithelium (epi), lamina propria (LP), submucosal plexus (SP), and longitudinal muscle-myenteric plexus (LMMP) are indicated. Created at Biorender.com. (B) Immunofluorescence detection of C1q (violet) and macrophages marked with CD169 (green) in the small intestine and colon of C1qafl/fl and C1qa∆Mφ littermates. Nuclei were detected with 4’,6-diamidino-2-phenylindole (DAPI; blue). Detection with isotype control antibodies on C1qafl/fl small intestines is shown at right. Anti-rat IgG AlexaFluor 488 and streptavidin-Cy5 were used as secondary stains for CD169 and C1q, respectively. The intestinal surface is denoted with a red dotted line and the gut lumen, epithelium, and lamina propria are indicated. The approximate region encompassing the submucosal plexus and the muscularis is denoted with two white dotted lines. Examples of C1q+ areas are indicated with yellow arrows and examples of CD169+ macrophages are indicated with white arrowheads. Note that the violet staining near the bottom of the muscularis is non-specific, as indicated by its presence in the isotype control image. Images are representative of three independent experiments. Scale bars = 50 μm. (C) Immunofluorescence detection of C1q (violet), macrophages marked with CD169 (green), and neurons marked with TUBB3 (yellow) in the small intestines of wild-type C57BL/6 mice. Nuclei are detected with DAPI (blue). The epithelium and lamina propria are indicated. The approximate region encompassing the submucosal plexus and the muscularis is denoted with two white dotted lines. The expanded image area delineated by a yellow square shows an example of the close association between C1q and TUBB3+ neurons. Images are representative of images captured from three mice. Anti-rat IgG AlexaFluor 488, anti-rabbit IgG AlexaFluor 594, and streptavidin-Cy5 were used as secondary stains for CD169, TUBB3, and C1q, respectively, and an isotype control image is shown at upper right. Scale bars = 50 μm. (D) RNAscope detection of C1qa (green), muscularis macrophages marked by Csf1r (red), and immunofluorescence detection of enteric neuronal ganglia by HuC/D (blue) in LMMP wholemounts of small intestines and colons from C1qafl/fl and C1qa∆Mφ mice. The expanded area denoted by a yellow square shows a close association between C1qa-expresssing muscularis macrophages and enteric neurons. Images are representative of three independent experiments. Scale bars = 50 μm. (E) C1q+ intestinal macrophages express genes that are characteristic of nerve-adjacent macrophages. Flow cytometry analysis of CD169, Arginase 1, and TREM2 on C1q- and C1q+ macrophages recovered from the small intestines of wild-type C57BL/6 mice. Median fluorescence intensities from multiple mice are quantified in the panels at the right. Each data point represents one mouse (n=5–6 mice), and the results are representative of two independent experiments. Error bars represent SEM. **p<0.01; ****p<0.0001 by the two-tailed Student’s t-test. Epi, epithelium; LP, lamina propria; SP, submucosal plexus; Mφ, macrophage; DAPI, 4′,6-diamidino-2-phenylindole, LMMP, longitudinal muscle-myenteric plexus. Error bars represent SEM. ns, not significant by the two-tailed Student’s t-test.
Figure 4—figure supplement 1

Flow cytometry analysis of complement component 1q (C1q) and CD169 expression on small intestinal macrophages.
(A) Similar numbers of CD169+ macrophages are present in the small intestines of C1qaΔMφ and C1qafl/fl littermates. Flow cytometry analysis of CD169+ macrophages was conducted on cells recovered from the small intestines of C1qaΔMφ and C1qafl/fl littermates. CD169+ cells were determined as a percentage of total macrophages (live CD45+ CD11b+ MHCII+ F4/80hi cells). (B) Similar numbers of C1q+ macrophages are present in the small intestinal lamina propria-submucosal plexus and the muscularis-myenteric plexus. Each data point represents one mouse. Error bars represent SEM. ns, not significant by the two-tailed Student’s t-test.
Figure 5
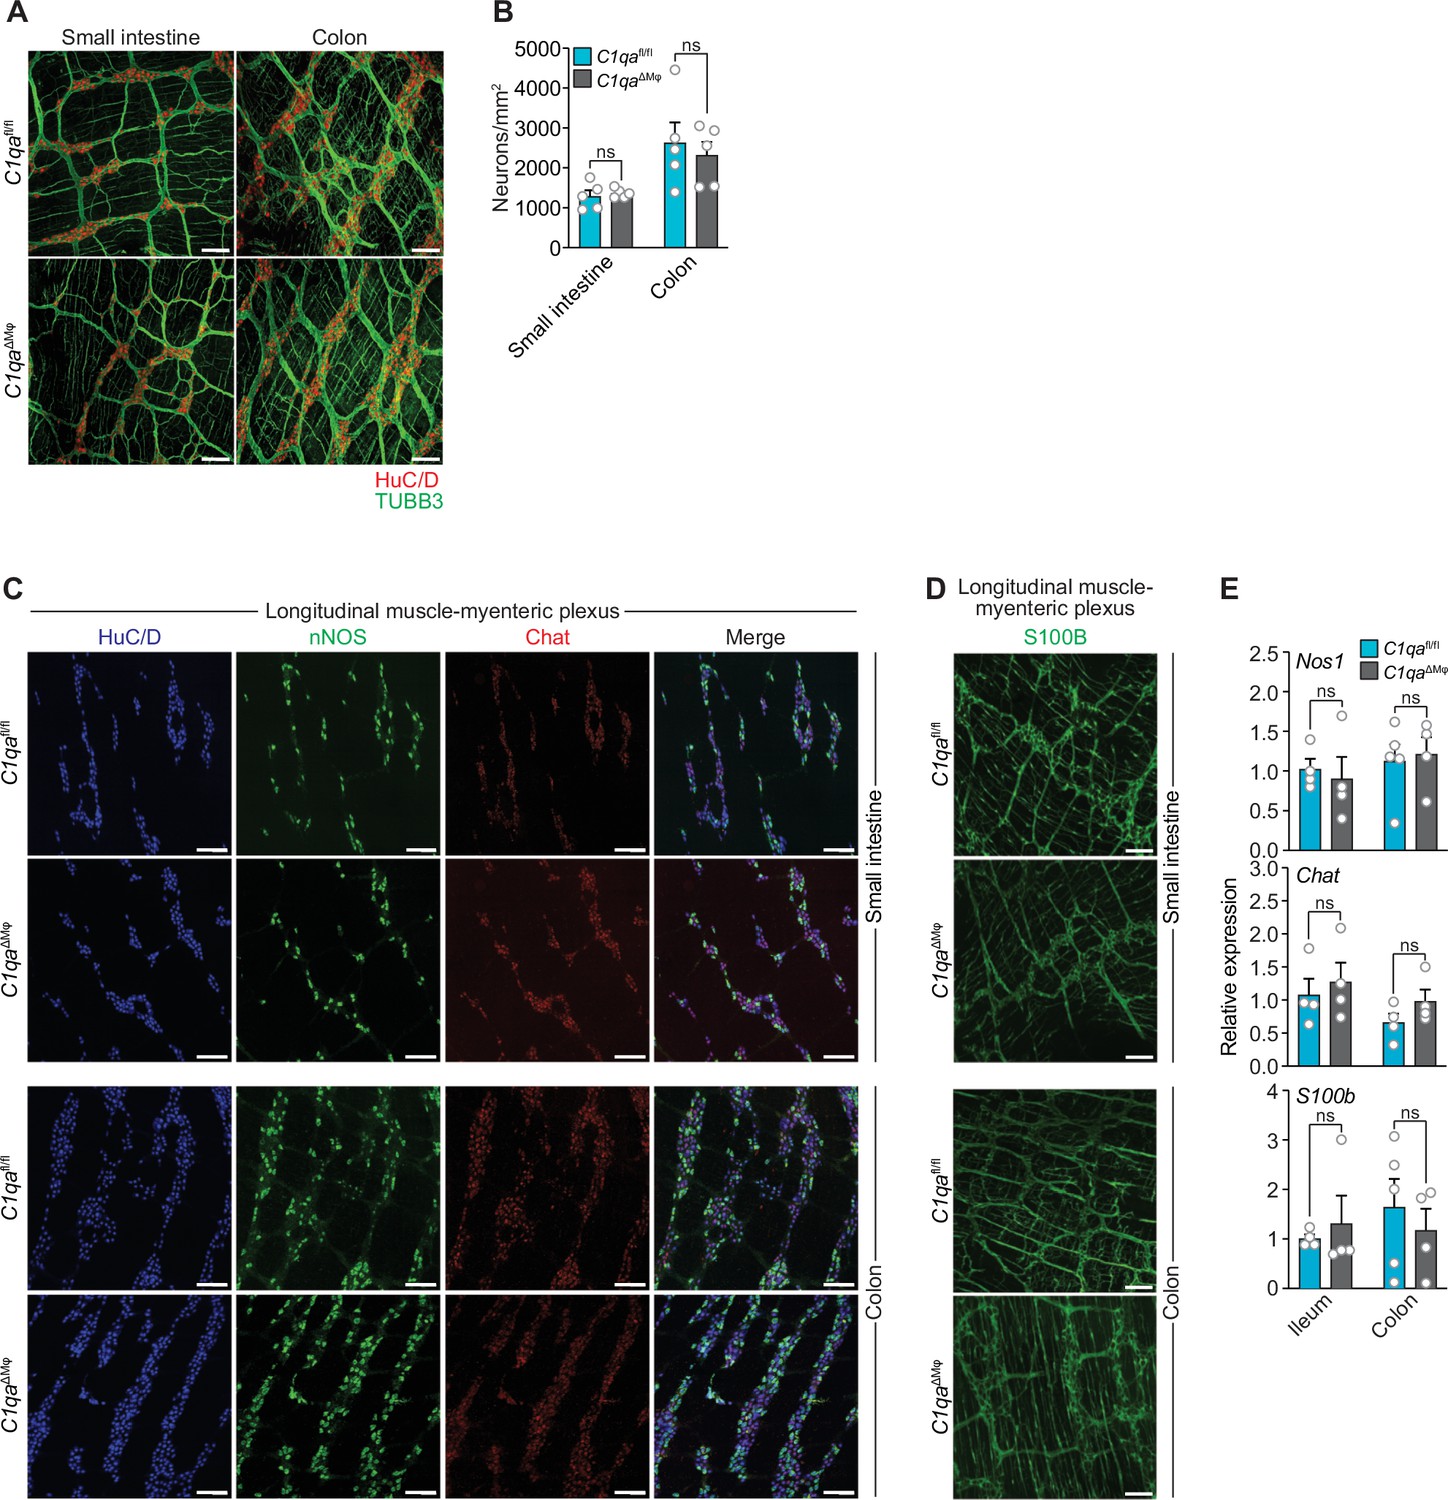
Numbers of enteric neurons are similar in C1qafl/fl and C1qa∆Mφ mice.
(A) Immunofluorescence analysis of enteric neuronal ganglia marked with HuC/D (red) and neuronal fibers marked with TUBB3 (green) in LMMP wholemounts of small intestines and colons from C1qafl/fl and C1qa∆Mφ mice. Anti-mouse IgG AlexaFluor 594 and anti-rabbit IgG AlexaFluor 488 were used as secondary stains for HuC/D and TUBB3, respectively. Images are representative of three independent experiments. Scale bars = 50 μm. (B) Quantification of total enteric neurons per unit area (mm2) from the images shown in panel (A). Data are pooled from two independent experiments. Each data point represents one mouse. (C) Visualization of specific neuronal subsets in the LMMP from C1qafl/fl and C1qa∆Mφ mice by RNAscope detection. Inhibitory neurons were marked by Nos1 (green) and excitatory neurons were marked by Chat (red). Neuronal nuclei marked by HuC/D (blue) were detected by immunofluorescence. Images are representative of two independent experiments. Scale bars = 50 μm. (D) Immunofluorescence detection of enteric glial cells marked by S100B (green) in LMMP wholemounts from the small intestines and colons of C1qafl/fl and C1qa∆Mφ mice. Images are representative of two independent experiments. Scale bars = 50 μm. (E) qPCR analysis of Nos1, Chat, and S100b in the LMMP of small intestines and colons from C1qafl/fl and C1qa∆Mφ mice. Each data point represents one mouse. Error bars represent SEM. ns, not significant by the two-tailed Student’s t-test. LMMP, longitudinal muscle-myenteric plexus.
Figure 6 with 4 supplements
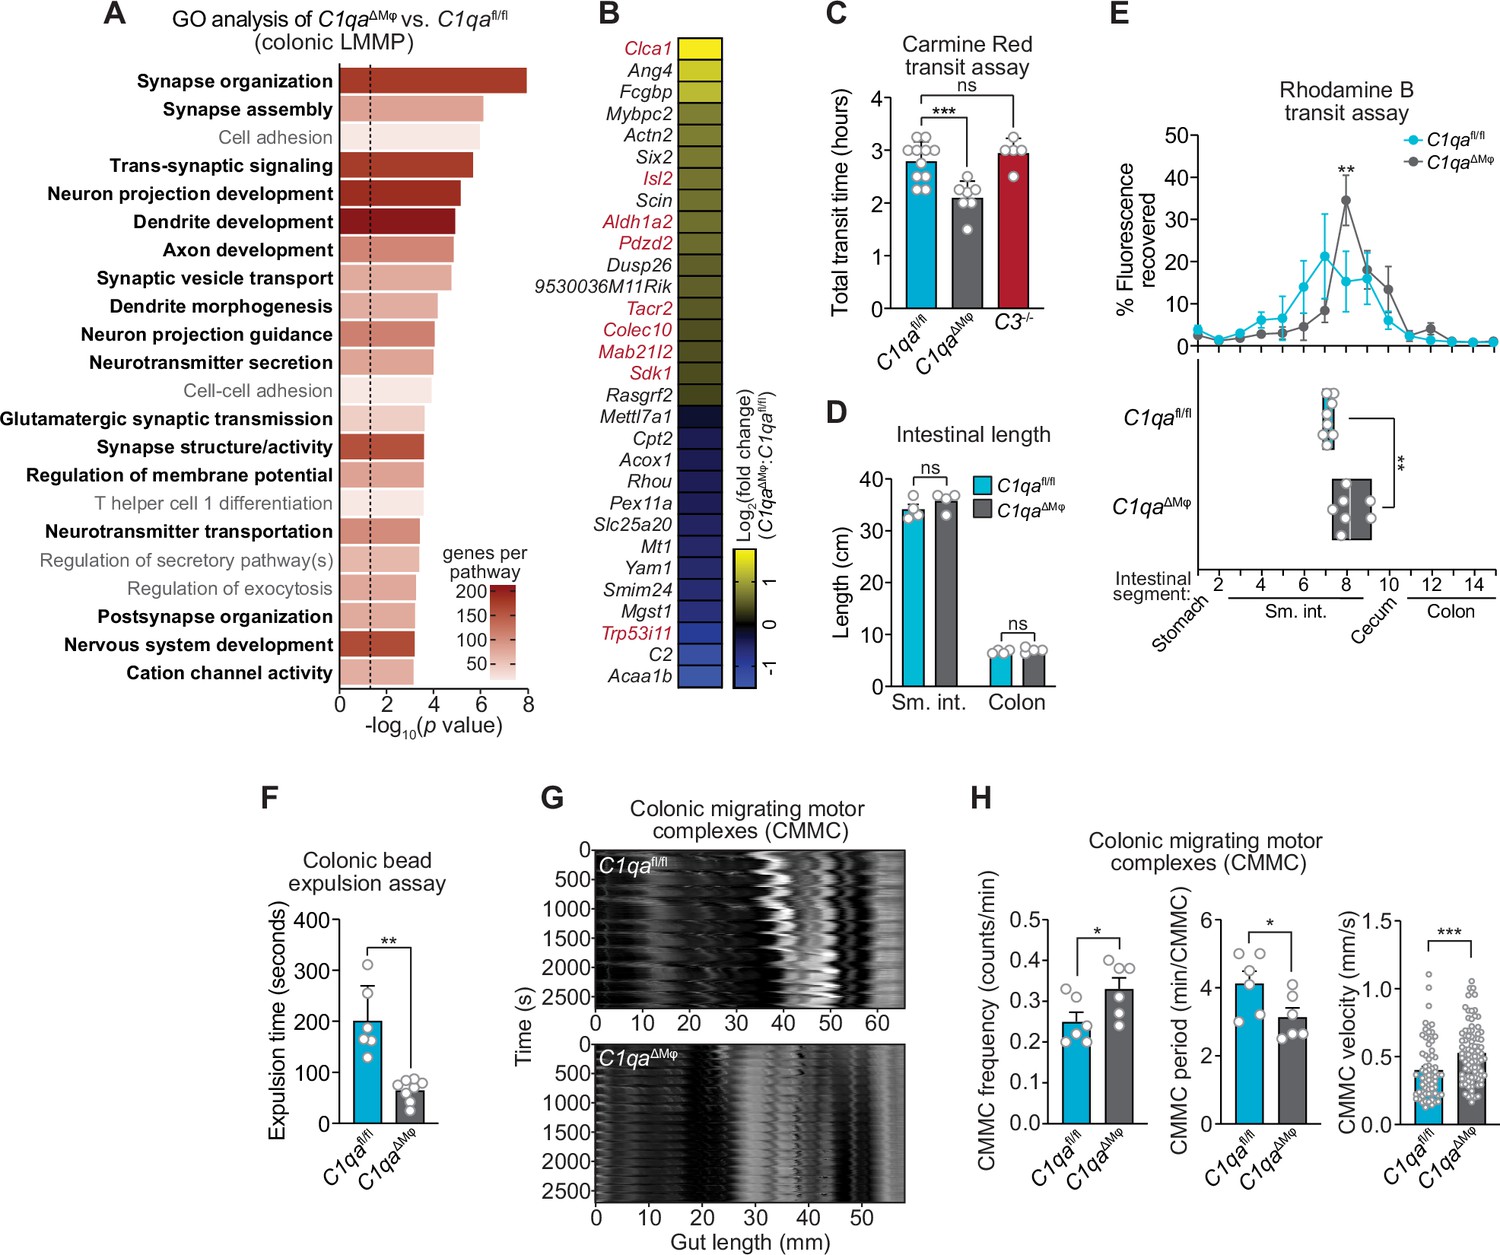
C1qa∆Mφ mice have altered gastrointestinal motility.
(A) RNA-seq was performed on colonic LMMP from C1qaΔMφ and C1qafl/fl littermates. Annotated gene ontology (GO) biological processes were assigned to genes that were differentially expressed in C1qaΔMφ mice when compared to their C1qafl/fl littermates. GO biological processes associated with neurons are in bold type. The dotted line indicates the cutoff for statistical significance. Five mice per group were analyzed as pooled biological replicates. Data are available from the Sequence Read Archive under BioProject ID PRJNA793870. (B) The colonic longitudinal muscle myenteric plexus of C1qa∆Mφ mice have a transcriptional profile like that of mice with a gastrointestinal motility disorder. RNA-seq was performed on the colonic longitudinal muscle-myenteric plexus from five C1qafl/fl and five C1qaΔMφ littermates. Genes that were differentially expressed are represented in a heatmap that depicts log2(fold change). Genes that also showed altered expression in the TashT mouse line, which is a model of human Hirschsprung’s disease (Bergeron et al., 2015), are indicated in red. Statistical significance of the overlap between differentially expressed genes in C1qaΔMφ and TashT mice was determined by Fisher’s exact test (p=0.0032). (C) Measurement of total intestinal transit time in C1qafl/fl and C1qa∆Mφ littermates and C3-/- mice. Mice were gavaged with 100 μl of Carmine Red [5% (w/v in 1.5% methylcellulose)]. Fecal pellets were collected every 15 min and transit time was recorded when the dye was first observed in the feces. Each data point represents one mouse and the results are pooled from five independent experiments. (D) Intestinal tract length is not altered in C1qa∆Mφ mice. Small intestines and colons from C1qafl/fl and C1qa∆Mφ littermates were excised and measured. Each data point represents one mouse. (E) Transit of rhodamine B-dextran through the intestines of C1qafl/fl and C1qa∆Mφ littermates. Mice were sacrificed 90 min after gavage with rhodamine B-dextran. The intestines were divided into 16 segments, the rhodamine B fluorescence was measured in each segment (top panel), and the geometric center of the fluorescence was determined for each mouse (bottom panel). Each data point represents one mouse and the results were pooled from four independent experiments. (F) Colonic motility was measured by determining the expulsion time of a glass bead inserted intrarectally into C1qafl/fl and C1qa∆Mφ littermates. Each data point represents one mouse and the results are representative of three independent experiments. (G) Representative spatiotemporal maps of colonic migrating motor complex (CMMC) formation in colons of C1qafl/fl and C1qa∆Mφ mice. Representative video recordings were captured in Figure 6—video 1 (C1qafl/fl mice) and Figure 6—video 2 (C1qa∆Mφ mice). Each map represents one mouse and is representative of two independent experiments. (H) Analysis of CMMC parameters in colons of C1qafl/fl and C1qa∆Mφ mice. Each data point represents one mouse (for CMMC frequency and CMMC period) or one individual CMMC event (for velocity). Data are pooled from two independent experiments. LMMP, longitudinal muscle-myenteric plexus; sm. int., small intestine. Error bars represent SEM. *p<0.05; **p<0.01; ***p<0.001; ****p<0.0001; ns, not significant by the two-tailed Student’s t-test.
Figure 6—figure supplement 1
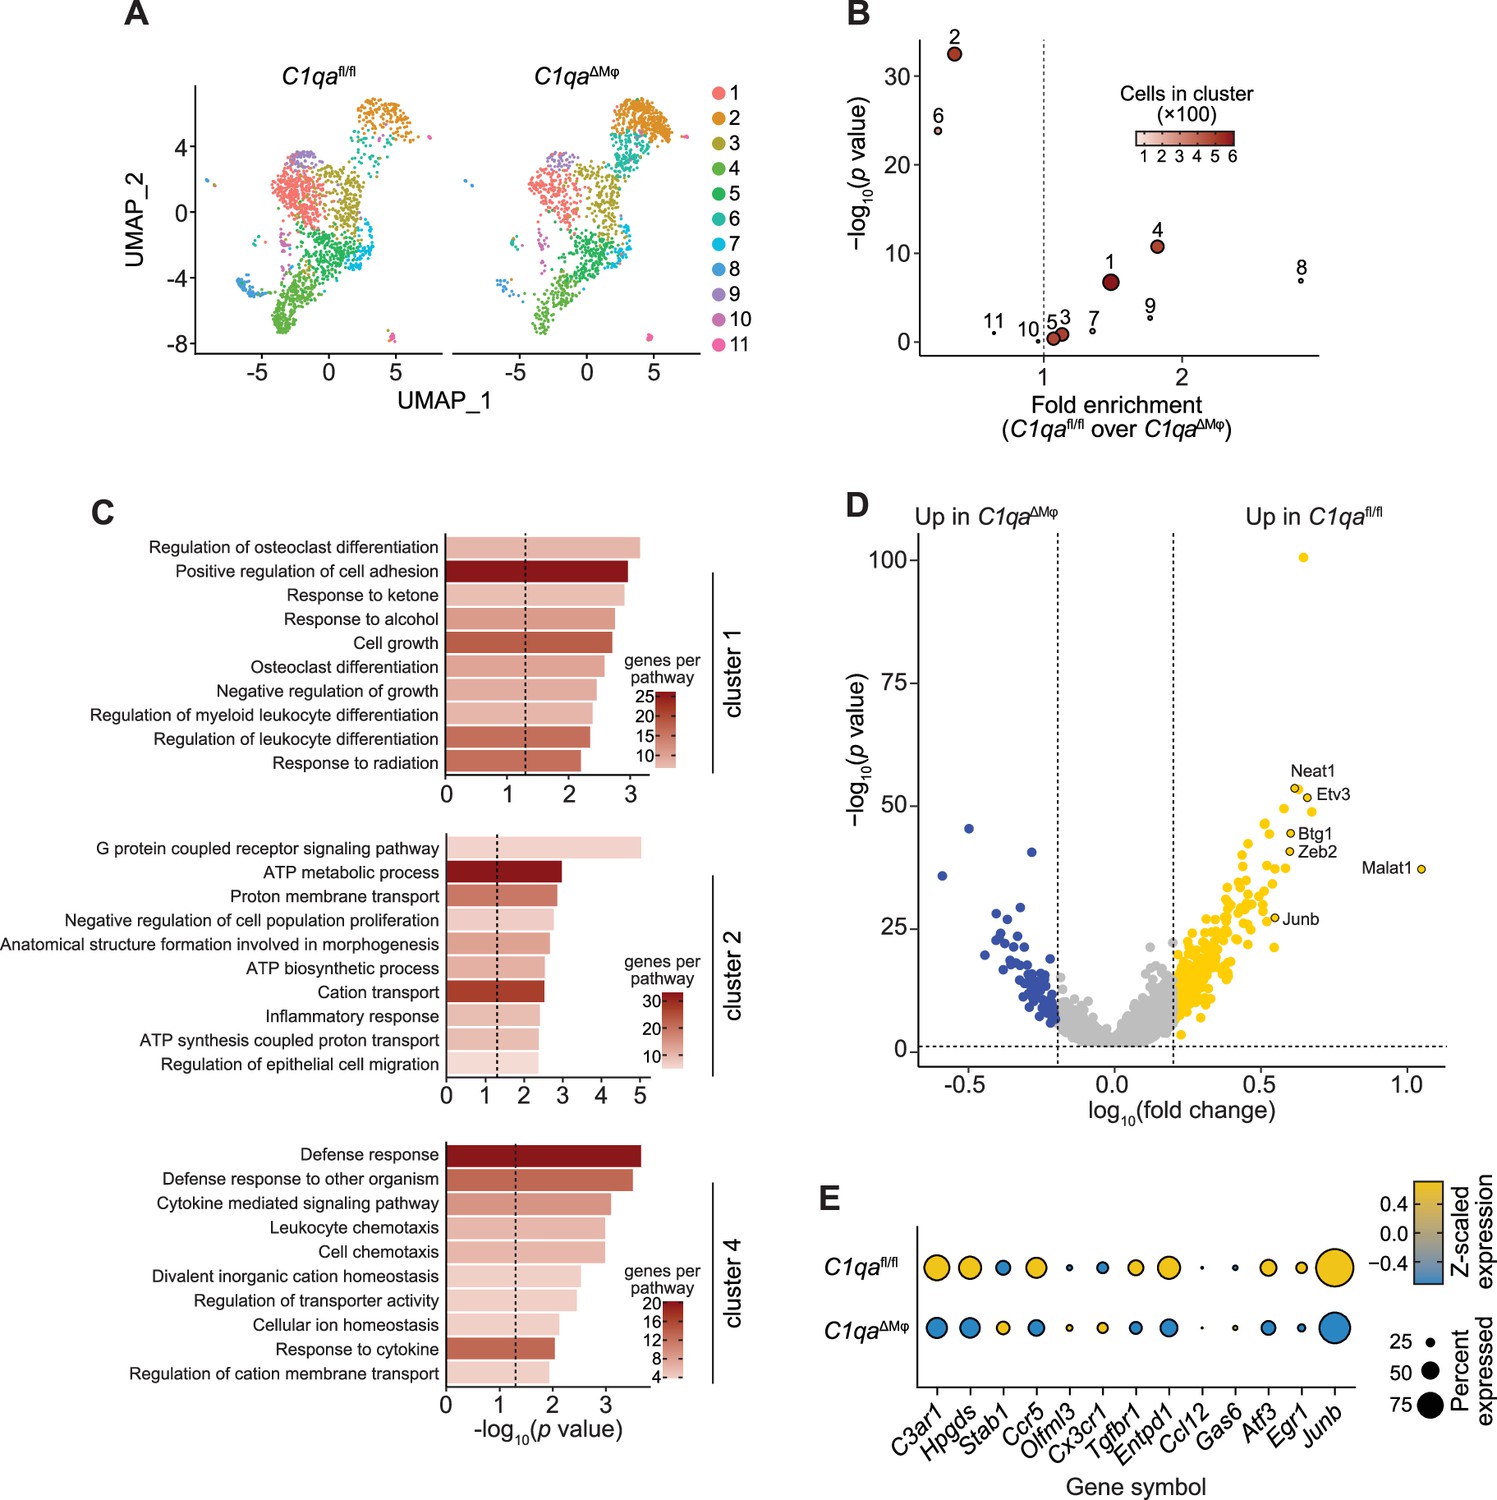
Single-cell RNA-seq analysis of intestinal macrophages from C1qaΔMφ and C1qafl/fl littermates.
Lamina propria cell suspensions were prepared from the small intestines of C1qafl/fl and C1qaΔMφ littermates (n=3 for each genotype). Total small intestinal cells were pooled according to genotype and live CD45+CD11b+MHCII+F4/80hi macrophages were sorted using a FACSAria (BD Biosciences). 5000–10,000 macrophages from each genotype with a viability score of >70% were input into each library. Data are available from the Sequence Read Archive under BioProject ID PRJNA793870. (A) Uniform Manifold Approximation Projection (UMAP) plots of intestinal macrophages. 11 unique macrophage clusters were identified. (B) Statistical analysis of macrophage cluster enrichment comparing C1qafl/fl and C1qaΔMφ littermates. (C) Gene Set Enrichment Analysis (GSEA) analysis of gene signatures of macrophage clusters 1, 2, and 4. (D) Volcano plot of differentially expressed genes across all recovered macrophages between C1qafl/fl and C1qaΔMφ littermates. Yellow dots indicate differentially expressed genes that were higher in C1qafl/fl macrophages, while blue dots indicate genes that were higher in C1qaΔMφ macrophages. Annotated genes were manually curated and have known functions relating to macrophage state and differentiation. (E) Gene expression analysis of 13 ‘microglia-specific genes’ in macrophages from C1qafl/fl and C1qaΔMφ littermates. The microglia-specific gene signature was previously identified as representing a unique transcriptional overlap between microglia in the CNS and intestinal macrophages (Verheijden et al., 2015). ‘Percent expressed’ refers to the percentage of cells expressing a given gene.
Figure 6—figure supplement 2

The gene encoding complement component 1q (C1q) receptor BAI1 (Adgrb1) is expressed by enteric neurons.
(A) A recent report identified five candidate C1q receptor proteins encoded by neural stem cells in humans and mice (Benavente et al., 2020). We searched for the mouse homologs of the genes encoding these receptors in the dataset published by Obata et al., 2020, which compared the transcriptomes of mouse myenteric plexus neurons with those of non-neuronal cells and detected expression of four of the five receptors (Cd44, Gpr62, Adgrb1, and Adcy5). The gene encoding BAI1 (Adgrb1) was unique among these four genes by being more highly expressed in neurons as compared to non-neurons in both the small intestine and the colon. Each data point represents one mouse. (B) RNAscope detection of Adgrb1 transcript (red) and immunofluorescence detection of neuronal nuclei by HuC/D (blue) on small intestinal and colonic LMMP wholemounts. The zoomed area is delineated by a yellow box and shows the expression of Adgrb1 in neurons, with white arrows indicating examples. Scale bars = 50 μm. Error bars represent SEM. *p<0.05; ns, not significant by the two-tailed Student’s t-test. LMMP, longitudinal muscle-myenteric plexus.
Figure 6—video 1
Ex vivo recording of colonic peristalsis in C1qafl/fl mice.
Figure 6—video 2
Ex vivo recording of colonic peristalsis in C1qa∆Mφ mice.
Tables
Key resources table
| Reagent type (species) or resource | Designation | Source or reference | Identifiers | Additional information |
|---|---|---|---|---|
| Strain, strain background (Mus musculus) | C1qafl/fl; B6(SJL)-C1qatm1c(EUCOMM)Wtsi/TennJ | Jackson Laboratory; Fonseca et al., 2017 | Stock #031261 | |
| Strain, strain background (Mus musculus) | LysM-Cre; B6.129P2-Lyz2tm1(cre)Ifo/J | Jackson Laboratory; Clausen et al., 1999 | Stock #004781 | |
| Strain, strain background (Mus musculus) | C1qaΔMΦ | this paper | Generated by crossing C1qafl/fl mice with LysM-Cre mice | |
| Strain, strain background (Mus musculus) | C3-/-; B6.129S4-C3tm1Crr/J | Jackson Laboratory; Wessels et al., 1995 | Stock #029661 | |
| Strain, strain background (Mus musculus) | Germ-free C57BL/6 J mice | UT Southwestern Gnotobiotics Core Facility | ||
| Strain, strain background (Salmonella enterica) | Salmonella enterica subsp. enterica serovar Typhimurium strain SL1344 | Dr. Vanessa Sperandio; Eichelberg and Galán, 1999 | ||
| Strain, strain background (Citrobacter rodentium) | Citrobacter rodentium strain DBS100 | ATCC | Strain# 51459 | |
| Antibody | Anti-Actin HRP (rabbit monoclonal) | Cell Signaling | Clone: 13E5 | Immunoblot (1:5000) |
| Antibody | Anti-ARG1 (sheep monoclonal) | R&D Systems | Clone: P05089 | Flow (1:100) |
| Antibody | Anti-B220 (rat monoclonal) | Thermo Fisher | Clone: RA3-6B2 | Flow (1:500) |
| Antibody | Anti-C1q (rat monoclonal) | Cedarlane Laboratories | Clone: RmC7H8 | Flow (1:50) |
| Antibody | Anti-C1q (rabbit polyclonal) | Thermo Fisher | Cat# PA5-29586 | Immunoblot (1:500) |
| Antibody | Anti-C1q-biotin (mouse monoclonal) | Abcam | Clone: JL1 | ELISA (1:1000); Immunofluorescence (1:100) |
| Antibody | Anti-CD3 (rat monoclonal) | Thermo Fisher | Clone: 17A2 | Flow (1:200) |
| Antibody | Anti-CD4 (rat monoclonal) | BioLegend | Clone: GK1.5 | Flow (1:500) |
| Antibody | Anti-CD11b (rat monoclonal) | Thermo Fisher | Clone: M1/70 | Flow (1:200) |
| Antibody | Anti-CD11c (Armenian hamster monoclonal) | Thermo Fisher | Clone: N418 | Flow (1:500) |
| Antibody | Anti-CD16/32 (rat monoclonal) | BioLegend | Clone: 93 | Fc receptor block (1:1000) |
| Antibody | Anti-CD19 (rat monoclonal) | BioLegend | Clone: 1D3 | Flow (1:500) |
| Antibody | Anti-CD45 (rat monoclonal) | BioLegend | Clone: 30-F11 | Flow (1:500) |
| Antibody | Anti-CD90.2 (rat monoclonal) | BioLegend | Clone: 30-H12 | Flow (1:500) |
| Antibody | Anti-CD169 (rat monoclonal) | BioLegend | Clone: 3D6.112 | Flow (1:200) |
| Antibody | Anti-CD169 (rat monoclonal) | Abcam | Clone: 3D6.112 | Immunofluorescence (1:200) |
| Antibody | Anti-CSF1R (rat monoclonal) | Bio X Cell | Cat# AFS98 | Macrophage depletion (100 mg/kg) |
| Antibody | Anti-F4/80 (rat monoclonal) | BioLegend | Clone: BM8 | Flow (1:100) |
| Antibody | Anti-FoxP3 (rat monoclonal) | Thermo Fisher | Clone: FJK-16s | Flow (1:50) |
| Antibody | Anti-GATA3 (mouse monoclonal) | BD Biosciences | Clone: L50-823 | Flow (1:50) |
| Antibody | Anti-IgA (rat monoclonal) | Thermo Fisher | Clone: 11-44-2 | Flow (1:50) |
| Antibody | Anti-LY6C (rat monoclonal) | BioLegend | Clone: RB6-8C5 | Flow (1:500) |
| Antibody | Anti-MHCII (rat monoclonal) | Thermo | Clone: M5/114.15.2 | Flow (1:500) |
| Antibody | Anti-REG3G antiserum (rabbit polyclonal) | Cash et al., 2006; antiserum generated by Pacific Biosciences | Immunoblot (1:1000) | |
| Antibody | Anti-RORγt (rat monoclonal) | Thermo Fisher | Clone: AFKJS-9 | Flow (1:50) |
| Antibody | Anti-T-BET (mouse monoclonal) | BioLegend | Clone: 4B10 | Flow (1:50) |
| Antibody | Anti-TREM2 (rat monoclonal) | R&D Systems | Clone: 237920 | Flow (1:200) |
| Antibody | Anti-TUBB3 (rabbit polyclonal) | Abcam | Cat# ab18207 | Immunofluorescence (1:200) |
| Antibody | Anti-S100β (rabbit polyclonal) | Dako | Cat# GA504 | Immunofluorescence |
| Antibody | Anti-HuC/D (rabbit monoclonal) | Abcam | Cat# ab184267 | Immunofluorescence (1:400) |
| Antibody | Goat anti-rabbit IgG HRP conjugate | Abcam | Cat# ab6721 | Immunoblot (1:5000) |
| Antibody | secondary antibodies – donkey polyclonal anti-rabbit/rat/mouse AlexaFluor 488/594/647 | Invitrogen | Immunofluorescence (1:400) | |
| Antibody | mouse IgG1 | Abcam | Cat# ab18443 | ELISA (10 μg/ml) |
| Antibody | Rat IgG2a | Thermo Fisher | Clone: 2A3 | Isotype control for anti-CSF1R macrophage depletion (100 mg/kg) |
| Antibody | Rat IgG1 PE isotype control | Cedarlane Laboratories | Cat# CLCR104 | Flow (1:50) |
| Sequence-based reagent | mouse C1qa TaqMan assay | Thermo Fisher | Assay ID: Mm00432142_m1 | |
| Sequence-based reagent | mouse C1qb TaqMan assay | Thermo Fisher | Assay ID: Mm01179619_m1 | |
| Sequence-based reagent | mouse C1qc TaqMan assay | Thermo Fisher | Assay ID: Mm00776126_m1 | |
| Sequence-based reagent | mouse Chat TaqMan assay | Thermo Fisher | Assay ID: Mm01221880_m1 | |
| Sequence-based reagent | mouse Nos1 TaqMan assay | Thermo Fisher | Assay ID: Mm01208059_m1 | |
| Sequence-based reagent | mouse S100b TaqMan assay | Thermo Fisher | Assay ID: Mm00485897_m1 | |
| Sequence-based reagent | mouse Reg3g TaqMan assay | Thermo Fisher | Assay ID: Mm00441127_m1 | |
| Sequence-based reagent | mouse Ifng TaqMan assay | Thermo Fisher | Assay ID: Mm01168134_m1 | |
| Sequence-based reagent | mouse Il4 TaqMan assay | Thermo Fisher | Assay ID: Mm00445259_m1 | |
| Sequence-based reagent | mouse IL5 TaqMan assay | Thermo Fisher | Assay ID: Mm00439646_m1 | |
| Sequence-based reagent | mouse Il10 TaqMan assay | Thermo Fisher | Assay ID: Mm01288386_m1 | |
| Sequence-based reagent | mouse Il13 TaqMan assay | Thermo Fisher | Assay ID: Mm00434204_m1 | |
| Sequence-based reagent | mouse Il17a TaqMan assay | Thermo Fisher | Assay ID: Mm00439618_m1 | |
| Sequence-based reagent | mouse Il17f TaqMan assay | Thermo Fisher | Assay ID: Mm00521423_m1 | |
| Sequence-based reagent | mouse 18 S gene TaqMan assay | Thermo Fisher | Assay ID: Mm03928990_g1 | |
| Sequence-based reagent | bacterial 16 S universal rRNA forward primer | Gift from Dr. Andrew Koh | 5’- ACTCCTACGGGAGGCAGCAGT-3’ | |
| Sequence-based reagent | Bacterial 16 S universal rRNA reverse primer | Gift from Dr. Andrew Koh | 5’- ATTACCGCGGCTGCTGGC-3’ | |
| Sequence-based reagent | bacterial 16 S V3 - rRNA gene forward primer | Thermo Fisher; (Klindworth et al., 2013) | 16 S rRNA gene sequencing | 5'-TCGTCGGCAGCGTCAGATGTGTATAAGAGACAGCCTACGGGNGGCWGCAG-3′ |
| Sequence-based reagent | bacterial 16 S v4 - rRNA gene reverse primer | Thermo Fisher; Klindworth et al., 2013 | 16 S rRNA gene sequencing | 5′- GTCTCGTGGGCTCGGAGATGTGTA TAAGAGACAGGACTACHVGGGTATCTAATCC-3′ |
| Sequence-based reagent | mouse C1qa RNAscope probe (C1) | Advanced Cell Diagnostics | Cat# 498241 | |
| Sequence-based reagent | mouse C1qa RNAscope probe (C3) | Advanced Cell Diagnostics | Cat# 498241-C3 | |
| Sequence-based reagent | mouse Chat RNAscope probe (C1) | Advanced Cell Diagnostics | Cat# 408731 | |
| Sequence-based reagent | mouse Nos1 RNAscope probe (C2) | Advanced Cell Diagnostics | Cat# 437651-C2 | |
| Sequence-based reagent | mouse Adgrb1 RNAscope probe (C1) | Advanced Cell Diagnostics | Cat# 317901 | |
| Sequence-based reagent | mouse Csf1r RNAscope probe (C2) | Advanced Cell Diagnostics | Cat# 428191-C2 | |
| Peptide, recombinant protein | recombinant mouse C1q | Complementech | Cat# M099 | |
| Commercial assay or kit | Chromium Next GEM Single Cell 3’ Kit v3.1 | 10 x Genomics | Cat# PN-1000269 | |
| Commercial assay or kit | Chromiium Next GEM Chip G Single Cel Kit | 10 x Genomics | Cat# PN-1000127 | |
| Commercial assay or kit | Dual Index Kit TT Set A | 10 x Genomics | Cat# PN-1000215 | |
| Commercial assay or kit | FOXP3/Transcription Factor Fixation/Permeabilization Buffer Set | Thermo Fisher | Cat# 00-5523-00 | |
| Commercial assay or kit | MMLV Reverse Transcriptase Kit | Thermo Fisher | Cat# 28025–021 | |
| Commercial assay or kit | NextSeq 500/550 High Output Kit v2.5 | Illumina | Cat# 20024907 | |
| Commercial assay or kit | PE300 (Paired end 300 bp) v3 kit | Illumina | Cat# MS-102–3001 | |
| commercial assay or kit | RNAscope Fluorescent Multiple Reagent Kit | Advanced Cell Diagnostics | Cat# 320850 | |
| Commercial assay or kit | RNeasy Universal Mini Kit | Qiagen | Cat# 73404 | |
| Commercial assay or kit | DNEasy Blood & Tissue Kit | Qiagen | Cat# 69504 | |
| Commercial assay or kit | TaqMan Master Mix | Thermo Fisher | Cat# 4369542 | |
| Commercial assay or kit | TruSeq RNA sample preparation kit | Illumina | Cat# RS-122–2001 | |
| Commercial assay or kit | SsoAdvanced Universal SYBR Green Supermix | BioRad | Cat# 1725270 | |
| Chemical compound, drug | Agencourt AmpureXP beads | Beckman Coulter Genomics | Cat# A63880 | |
| Chemical compound, drug | Carmine Red | Sigma | Cat# C1022-25G | |
| Chemical compound, drug | Collagenase IV | Sigma | Cat# C5138-1G | |
| Chemical compound, drug | Borosilicate glass beads (2 mm) | Millipore Sigma | Cat# Z273627-1EA | |
| Chemical compound, drug | Dextran sulfate sodium | Thomas Scientific | Cat# 216011090 | |
| Chemical compound, drug | DNase I | Sigma | Cat# DN25 | |
| Chemical compound, drug | Dispase II | Sigma | Cat# D4693-1G | |
| Chemical compound, drug | FITC-dextran (4000 Da) | Sigma | Cat# FD4-1g | |
| Chemical compound, drug | Ghost 710 | Tonbo Biosciences | Cat# 13–0871 T100 | Flow cytometry viability dye |
| Chemical compound, drug | Methylcellulose | Sigma | Cat# M0262-100G | |
| Chemical compound, drug | Nalidixic acid, sodium salt | Research Products International | Cat# N23100-25.0 | |
| Chemical compound, drug | Optimal Cutting Temperature Compound (OCT) | Thermo Fisher | Cat# 23-730-571 | |
| Chemical compound, drug | Percoll Plus | GE Healthcare | Cat# GE17-0891-09 | |
| Chemical compound, drug | 4% Paraformaldehyde Solution | Thermo Fisher | Cat# J19943.K2 | |
| Chemical compound, drug | Normal donkey serum | Southern Biotech | Cat# 0030–01 | |
| Chemical compound, drug | Triton X-100 | Thermo Fisher | Cat# A16046.AP | |
| Chemical compound, drug | Protease inhibitors | Millipore Sigma | Cat# 11836153001 | |
| Chemical compound, drug | Rhodamine B-dextran | Thermo Fisher | Cat# D1841 | |
| Chemical compound, drug | Streptavidin-Cy5 | Thermo Fisher | Cat# 434316 | |
| Chemical compound, drug | Streptavidin-HRP conjugate | Abcam | Cat# ab7403 | ELISA |
| Chemical compound, drug | Sylgard 184 Silicone Elastomer | Fisher Scientific | Cat# 4019862 | |
| Chemical compound, drug | VECTASHIELD Antifade Mounting Medium with 4′,6-diamidino-2-phenylindole (DAPI) | Vector Labs | Cat# H-1200–10 | |
| Software, algorithm | Cell Ranger Single-Cell Software Suite | 10 X Genomics | ||
| Software, algorithm | clusterProfiler | Yu et al., 2012 | ||
| Software, algorithm | CLC Genomics Workbench | Qiagen | ||
| Software, algorithm | CLC Bio microbial genomics module | Qiagen | https://digitalinsights.qiagen.com/plugins/clc-microbial-genomics-module/ | |
| Software, algorithm | FlowJo | BD Biosciences | ||
| Software, algorithm | ggplot2 | Love et al., 2015 | ||
| Software, algorithm | GraphPad PRISM | GraphPad Software | Version 7.0; RRID:SCR_002798 | |
| Software, algorithm | Gut Analysis Toolbox | Sorensen et al., 2022 | ||
| Software, algorithm | Igor Pro 9 | WaveMetrics | ||
| Software, algorithm | Illumina Nextera Protocol | Illumina | Part # 15044223 Rev. B | |
| Software, algorithm | ImageJ | National Institutes of Health | https://imagej.nih.gov/ij/ | |
| Software, algorithm | Limma | Ritchie et al., 2015 | ||
| Software, algorithm | NovoExpress | Agilent Technologies | ||
| Software, algorithm | PVCAM software | Teledyne Photometrics | ||
| Software, algorithm | Seurat V3 R Package | Stuart et al., 2019 | ||
| Other | Agilent 2100 Bioanalyzer | Agilent Technologies | G2939A | RNA integrity analysis |
| Other | Amicon Ultra centrifugal filters | Millipore | Cat #UFC900324 | Fecal protein extraction |
| Other | BioRad ChemiDoc Touch System | BioRad | Cat# 1708370 | Western blot imaging: |
| Other | Chromium Controller & Next GEM Accessory Kit | 10 X Genomics | Cat# PN-120223 | Single cell RNA sequencing library construction |
| Other | CMOS camera | Teledyne Photometrics | MOMENT | Ex vivo peristalsis: |
| Other | Leica CM1950 (Cryostat) | Leica | Cryosectioning | |
| Other | FACSAria | BD Biosciences | Flow cytometric cell sorting | |
| Other | ORCA-Fusion sCMOS camera | Hamamatsu Photonics | C14440-20UP | Imaging |
| Other | Illumina MiSeq | Illumina | RRID:SCR_016379 | 16 S rRNA |
| Other | Illumina NextSeq 550 | Illumina | Bulk RNA sequencing and single cell RNA sequencing | |
| Other | Keyence Fluorescence Microscope | Keyence | BZ-X800 | Immunofluorescence |
| Other | NovoCyte 3005 | Agilent Technologies | Flow cytometry analysis | |
| Other | Organ bath chamber | Tokai Hit | Ex vivo peristalsis | |
| Other | Peristaltic pump | Gilson | MINIPULS3 | Ex vivo peristalsis |
| Other | QuantStudio 7 Flex Real-Time PCR System | Applied Biosystems | Cat #4485701 | qPCR analysis |
| Other | SpectraMax M5 plate reader | Molecular Devices | ELISA and small intestinal motility analysis | |
| Other | Zeiss Axio Imager M1 Microscope | Zeiss | Immunofluorescence |
Additional files
Download links
A two-part list of links to download the article, or parts of the article, in various formats.
Downloads (link to download the article as PDF)
Open citations (links to open the citations from this article in various online reference manager services)
Cite this article (links to download the citations from this article in formats compatible with various reference manager tools)
Macrophages regulate gastrointestinal motility through complement component 1q
eLife 12:e78558.
https://doi.org/10.7554/eLife.78558


