Cellular mechanisms underlying central sensitization in a mouse model of chronic muscle pain
- Institute of Neuroscience, National Yang Ming Chiao Tung University, Taiwan
- Brain Research Center, National Yang Ming Chiao Tung University, Taiwan
- Department of Neurology, Neurological Institute, Taipei Veterans General Hospital, Taiwan
- Faculty of Medicine, National Yang Ming Chiao Tung University, Taiwan
- Institute of Clinical Medicine, National Yang Ming Chiao Tung University, Taiwan
- Division of Translational Research, Department of Medical Research, Taipei Veterans General Hospital, Taiwan
- Department of Medicine, MacKay Medical College, Taiwan
- Department of Anesthesiology, MacKay Memorial Hospital, Taiwan
- Department of Pharmacology and Physiology, George Washington University, United States
Figures
Figure 1 with 2 supplements
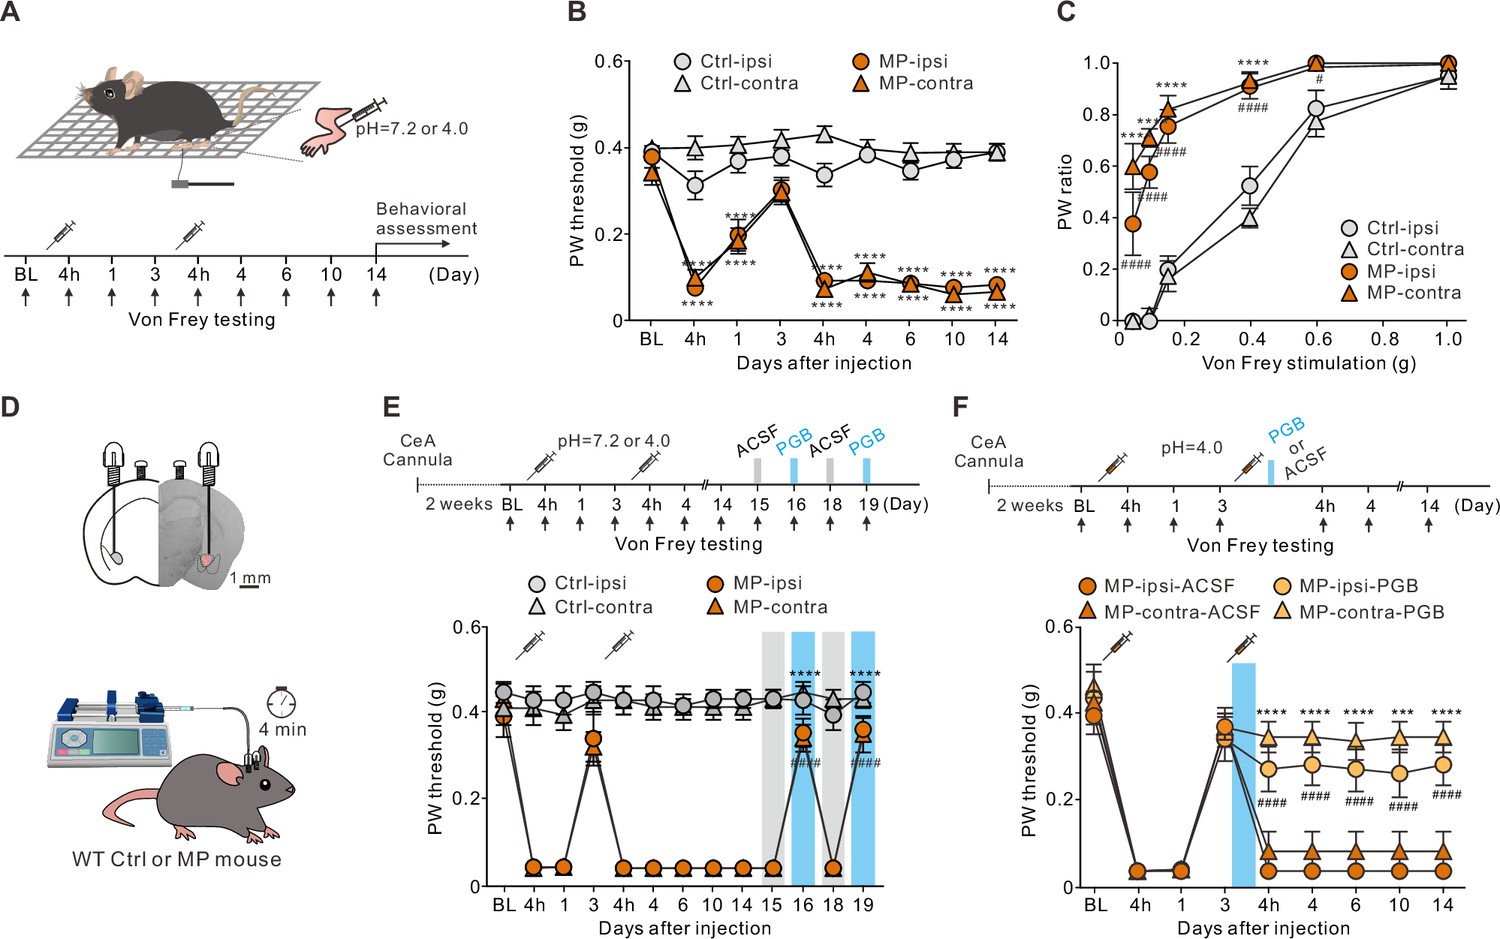
Local application of pregabalin (PGB) in the central nucleus of the amygdala (CeA) alleviated pain in a muscle pain (MP) mouse model.
(A) Schematic of MP induction protocol and experimental timeline. Mice were injected with either neutral (pH 7.2, Ctrl mice) or acidic (pH 4.0, MP mice) saline into the gastrocnemius muscle unilaterally on days 0 and 3. (B) Plot of the paw withdrawal (PW) threshold to the mechanical stimuli over time (Ctrl, n=26; MP, n=28; two-way analysis of variance (ANOVA) with Tukey’s post hoc test, F(8,936) = 30.97, ****p<0.0001 relative to baseline [BL]). (C) The bilateral PW responses to different filaments on day 14 in the Ctrl and MP mice (Ctrl, n=8; MP, n=9; two-way ANOVA with Tukey’s post hoc test, F(3,180) = 121.1, #p<0.05, ****,####p<0.0001; * indicates the comparison between ipsilateral hindpaws; # indicates the comparison between contralateral hindpaws). (D) Representative image of the PGB infusion site (labeled with a red fluorescent dye, sulforhodamine 101) and experimental schematic. (E) Effects of PGB treatment on the PW threshold in the Ctrl and MP mice (Ctrl, n=13; MP, n=12; two-way ANOVA with Tukey’s post hoc test, F(12,598) = 38.2, ****,####p<0.0001 relative to day 15; * indicates the comparison between the ipsilateral hindpaws; # indicates the comparison between the contralateral hindpaws. The blue area indicates the period of PGB treatment). (F) Top, experimental timeline. Right after the second injection of the acidic saline, one of the mouse groups was infused with PGB, and the other with artificial cerebrospinal fluid (ACSF). Bottom, effects of PGB treatment on the PW threshold in the ACSF and PGB groups (ACSF, n=8; PGB, n=9; two-way ANOVA with Tukey’s post hoc test, F(3,270) = 48.7, ***p<0.001, ****,####p<0.0001; * indicates the comparison between the ipsilateral hindpaws; # indicates the comparison between the contralateral hindpaws. The blue area indicates the period of PGB treatment).
-
Figure 1—source data 1
Numerical data to support the graphs in Figure 1.
- https://cdn.elifesciences.org/articles/78610/elife-78610-fig1-data1-v1.xlsx
Figure 1—figure supplement 1
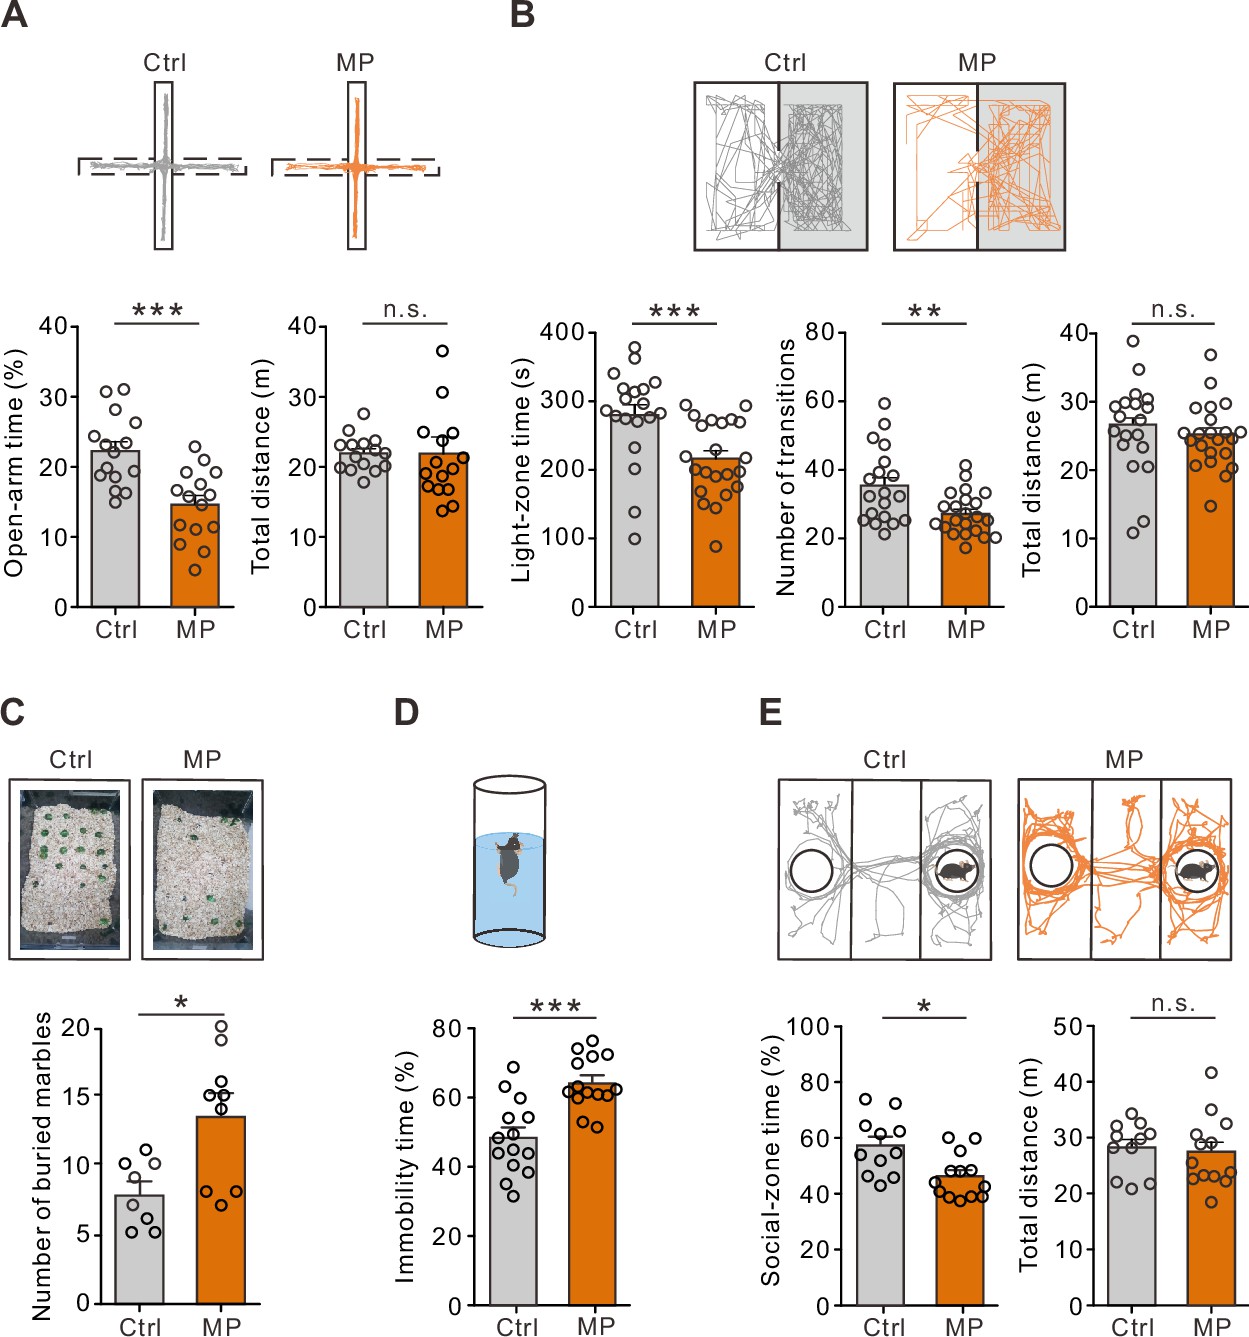
Comorbid affective symptoms in a muscle pain (MP) mouse model.
(A) Top, representative travel trajectories of each group during the elevated plus maze (EPM) test. Bottom, summary plots of open-arm time (Ctrl, 22.3 ± 1.3%, n=15; MP, 14.7 ± 1.3%, n=15; Mann–Whitney test, U=33, ***p=0.001) and total distance (Ctrl, 21.9±0.6 m, n=15; MP, 21.9±1.6 m, n=15; Mann–Whitney test, U=95, n.s., non-significant, p=0.48). (B) Top, representative travel trajectories of each group during the light/dark (L/D) box test. Bottom, summary plots of light-zone time (Ctrl, 277.4±16.1 s, n=19; MP, 214.5±11.9 s, n=22; Mann–Whitney test, U=79, ***p=0.0004), number of transitions (Ctrl, 35.5±2.4, n=19; MP, 26.6±1.5, n=22; Mann–Whitney test, U=104.5, **p=0.005) and total distance (Ctrl, 26.1±1.6 m, n=19; MP, 25.3±1.0 m, n=22; Mann–Whitney test, U=169, n.s., non-significant, p=0.303). (C) Top, representative results of the marble burying test. Bottom, summary plot of the number of buried marbles (Ctrl, 7.9±0.9, n=8; MP, 13.7±1.6, n=9; Mann–Whitney test, U=12, *p=0.018). (D) Top, schematic of the forced swim test (FST). Bottom, summary plot of immobility time (Ctrl, 48.6 ± 2.9%, n=14; MP, 64.7 ± 2.1%, n=14; Mann–Whitney test, U=23, ***p=0.0003). (E) Top, representative trajectories of each group during the three-chamber sociability test. Bottom, summary plots of relative time in the social zone (Ctrl, 57.3 ± 3.2%, n=11; MP, 46.3 ± 2.2%, n=13; Mann–Whitney test, U=28, *p=0.011) and total distance (Ctrl, 28.2±1.4 m, n=11; MP, 27.4±1.8 m, n=13; Mann–Whitney test, U=66, n.s., non-significant, p=0.766).
-
Figure 1—figure supplement 1—source data 1
Numerical data to support the graphs in Figure 1—figure supplement 1.
- https://cdn.elifesciences.org/articles/78610/elife-78610-fig1-figsupp1-data1-v1.xlsx
Figure 1—figure supplement 2
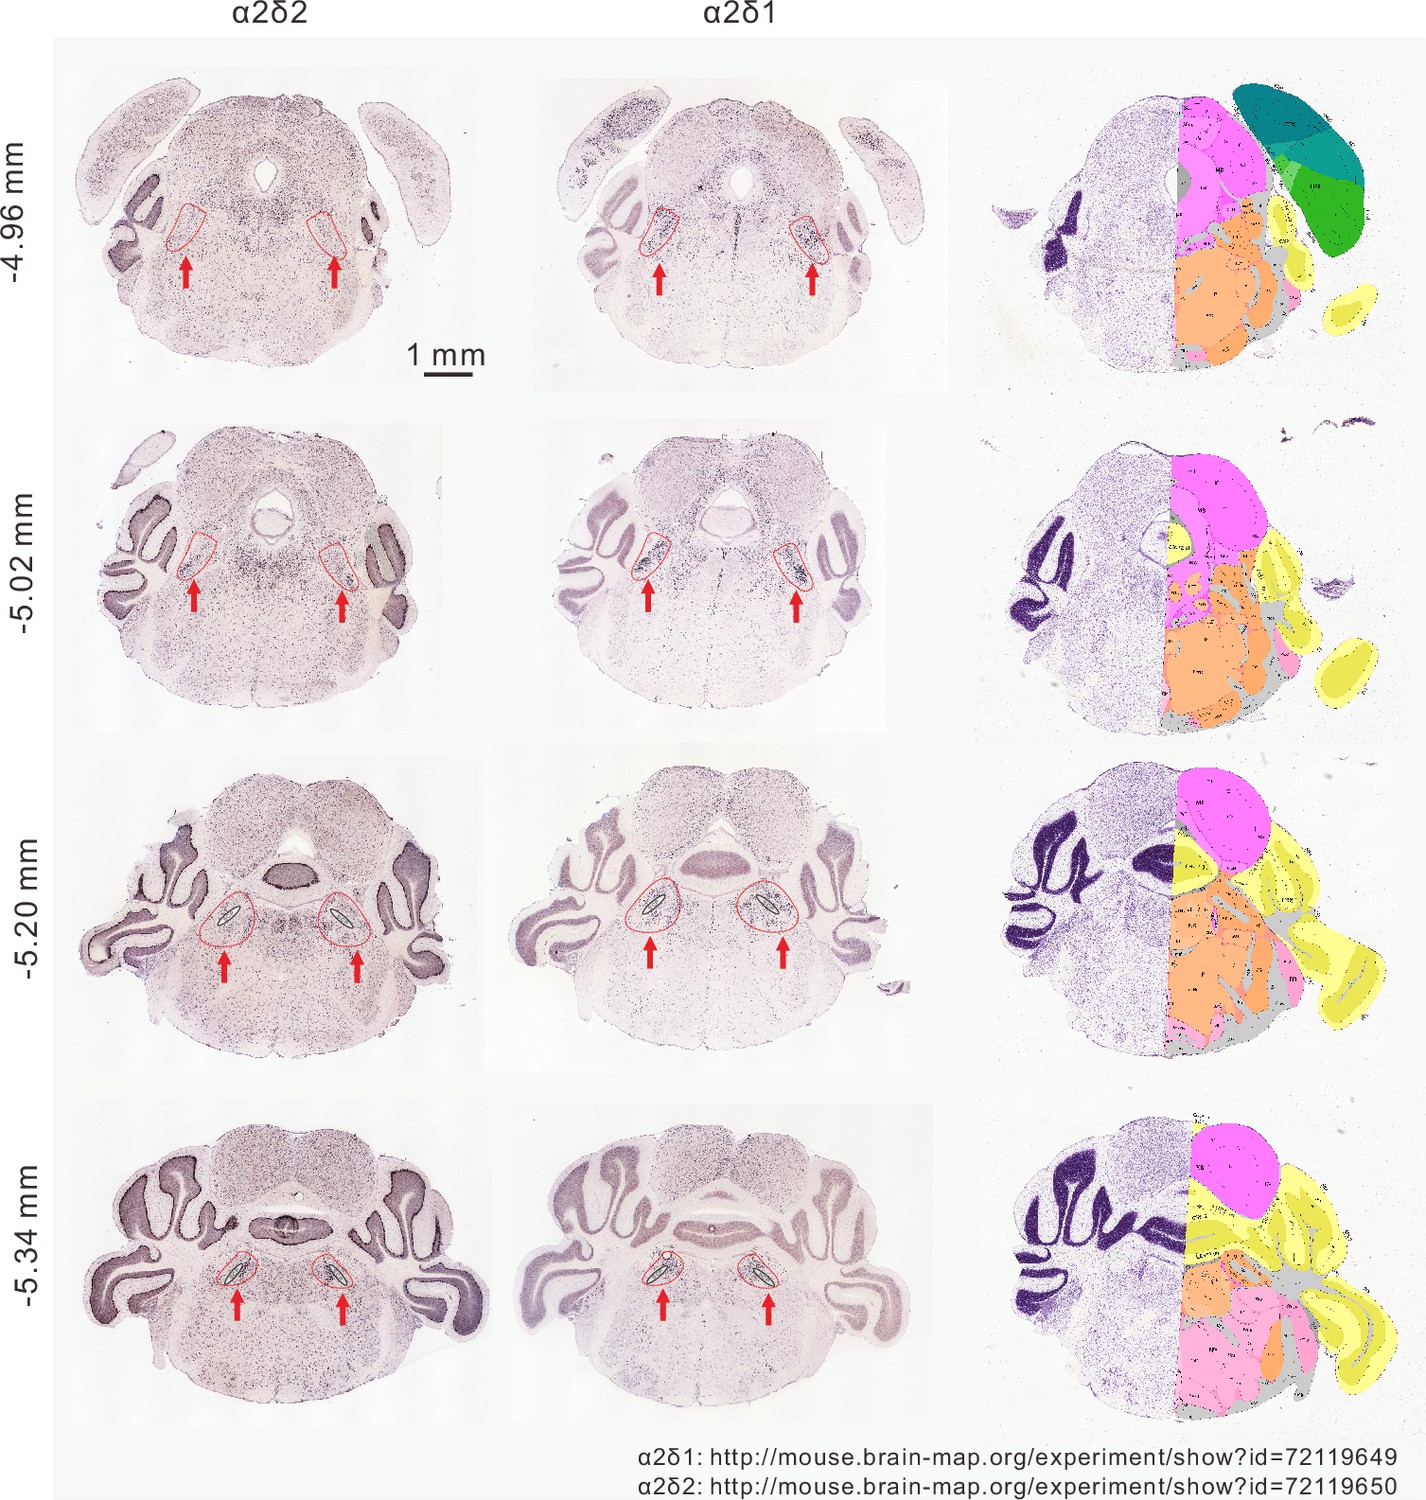
Expression of α2δ in the parabrachial nucleus (PBN).
Serial coronal section of α2δ1 and α2δ2 expression in the PBN obtained from the Allen Mouse Brain Connectivity Atlas which was published by Allen Brain Institute (α2δ1: http://mouse.brain-map.org/experiment/show?id=72119649; α2δ2:http://mouse.brain-map.org/experiment/show?id=72119650).
Figure 2 with 1 supplement
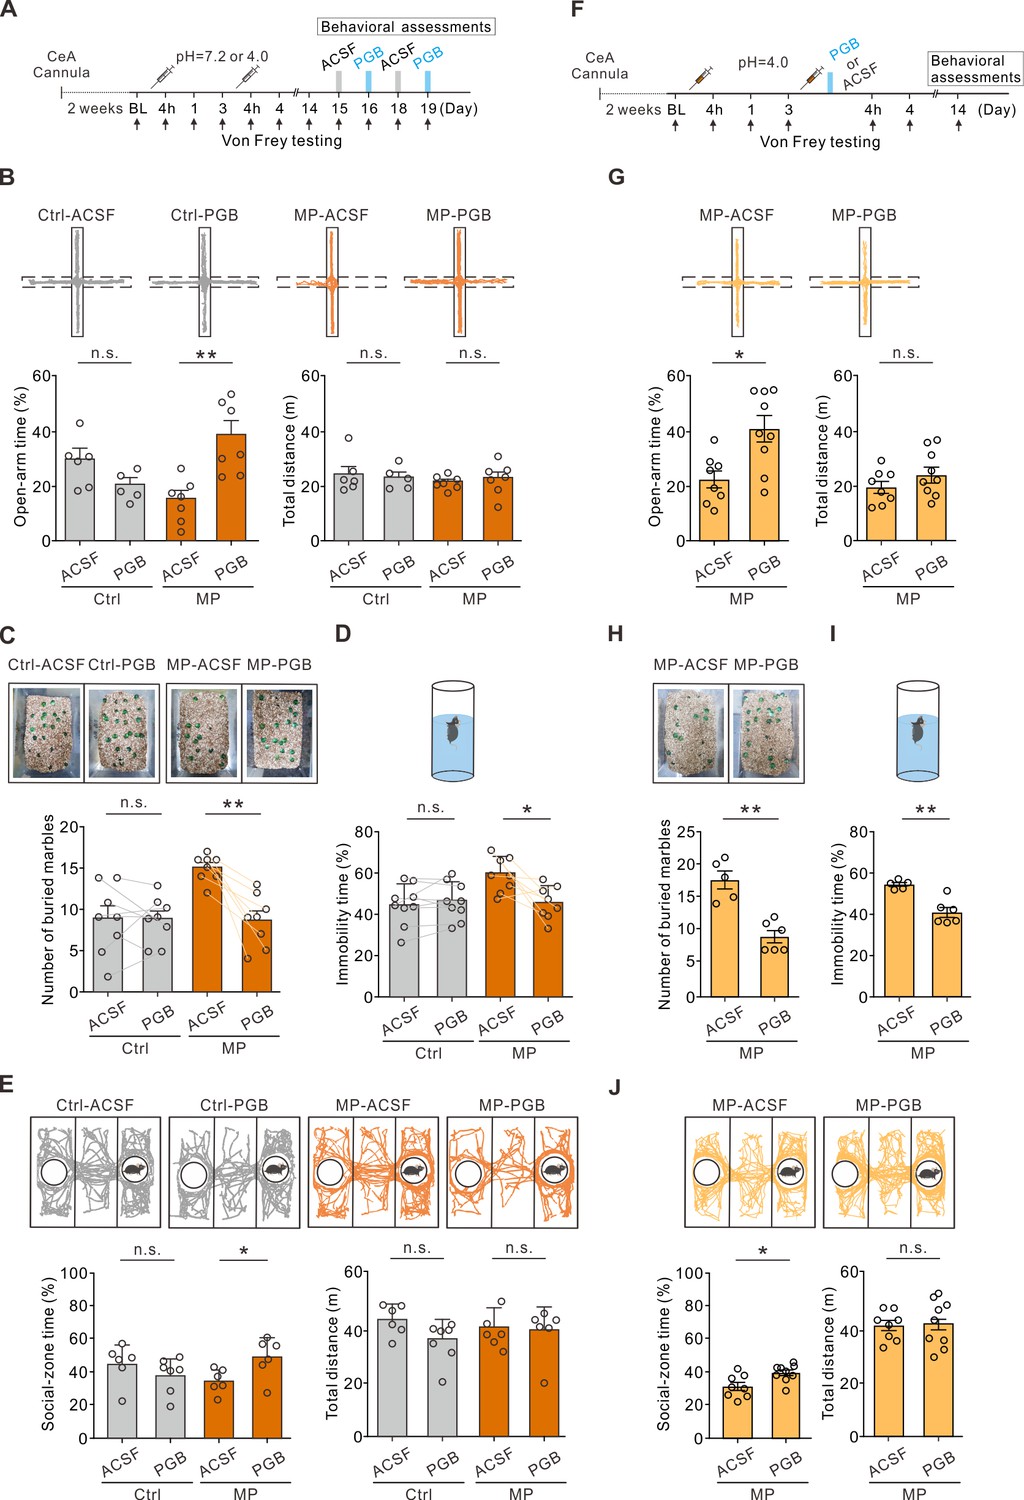
Local infusion of pregabalin (PGB) in the central nucleus of the amygdala (CeA) alleviated negative emotions.
(A) Experimental timeline. (B) Top, representative travel trajectories of each Ctrl and muscle pain (MP) group during the elevated plus maze (EPM) test. Bottom, summary of the effects of PGB treatment on open-arm time (Ctrl: artificial cerebrospinal fluid [ACSF], 29.6 ± 3.8%, n=6; PGB, 20.0 ± 2.7%, n=5; Mann–Whitney test, U=4, n.s., non-significant, p=0.052. MP: ACSF, 15.1 ± 3.0%, n=7; PGB, 38.4 ± 5.1%, n=7; Mann–Whitney test, U=2, **p=0.002) and total distance (Ctrl: ACSF, 24.1±2.9 m, n=6; PGB, 22.9±2.1 m, n=5; Mann–Whitney test, U=14, n.s., non-significant, p=0.875. MP: ACSF, 21.4±1.0 m, n=7; PGB, 22.7±2.3 m, n=7; Mann–Whitney test, U=18, n.s., non-significant, p=0.446). (C) Summary of the effects of PGB treatment on the number of buried marbles (Ctrl: ACSF, 8.9±1.5, n=8; PGB, 8.8±1.0, n=8; Wilcoxon matched-pairs signed rank test, n.s., non-significant, p=0.938. MP: ACSF, 15.0±0.6, n=8; PGB, 8.6±1.1, n=8; Wilcoxon matched-pairs signed rank test, **p=0.008). (D) Summary of relative time of immobility in the forced swim test (FST) (Ctrl: ACSF, 44.2 ± 3.3%, n=9; PGB, 46.1 ± 3.0%, n=9; Wilcoxon matched-pairs signed rank test, n.s., non-significant, p=0.734. MP: ACSF, 57.4 ± 2.4%, n=8; PGB, 46.0 ± 2.8%, n=8; Wilcoxon matched-pairs signed rank test, *p=0.023). (E) Top, representative travel trajectories of each Ctrl and MP group during the three-chamber sociability test. Bottom, summary of the effects of PGB treatment on social-zone time (Ctrl: ACSF, 44.6 ± 4.8%, n=6; PGB, 37.8 ± 3.8%, n=7; Mann–Whitney test, U=10, n.s., non-significant, p=0.138. MP: ACSF, 34.2 ± 2.9%, n=6; PGB, 48.6 ± 5.0%, n=6; Mann–Whitney test, U=5, *p=0.041) and total distance (Ctrl: ACSF, 42.3±2.3 m, n=6; PGB, 35.2±2.7 m, n=7; Mann–Whitney test, U=9, n.s., non-significant, p=0.101. MP: ACSF, 39.5±2.8 m, n=6; PGB, 38.0±3.6 m, n=6; Mann–Whitney test, U=15, n.s., non-significant, p=0.675). (F) Experimental timeline. Right after the second injection of the acidic saline, one of the mouse groups was infused with PGB, and the other with ACSF. The behavior assessments were performed on day 14. (G) Top, representative travel trajectories of each ACSF and PGB group during the EPM test. Bottom, summary of the effects of PGB treatment on the open-arm time (ACSF, 22.1 ± 3.1%, n=8; PGB, 40.5 ± 4.8%, n=9; Mann–Whitney test, U=10, *p=0.011) and total distance (ACSF, 20.4±2.3, n=8; PGB, 25.2±3.1, n=9; Mann–Whitney test, U=25, n.s., non-significant, p=0.315). (H) Summary of the effects of PGB treatment on the number of buried marbles (ACSF, 17.6±1.2, n=5; PGB, 9.0±0.9, n=6; Mann–Whitney test, U=0, **p=0.004). (I) Summary of the effects of PGB treatment on the immobility time (ACSF, 54.8±0.9, n=5; PGB, 41.0±2.4, n=6; Mann–Whitney test, U=0, **p=0.004). (J) Top, representative travel trajectories of each ACSF and PGB group during the three-chamber sociability test. Bottom, summary of the effects of PGB treatment on social-zone time (ACSF, 33.2±2.6, n=8; PGB, 42.1±1.9, n=9; Mann–Whitney test, U=11, *p=0.015) and total distance (ACSF, 39.8±1.8, n=8; PGB, 40.7±2.8, n=9; Mann–Whitney test, U=33, n.s., non-significant, p=0.791).
-
Figure 2—source data 1
Numerical data to support the graphs in Figure 2.
- https://cdn.elifesciences.org/articles/78610/elife-78610-fig2-data1-v1.xlsx
Figure 2—figure supplement 1
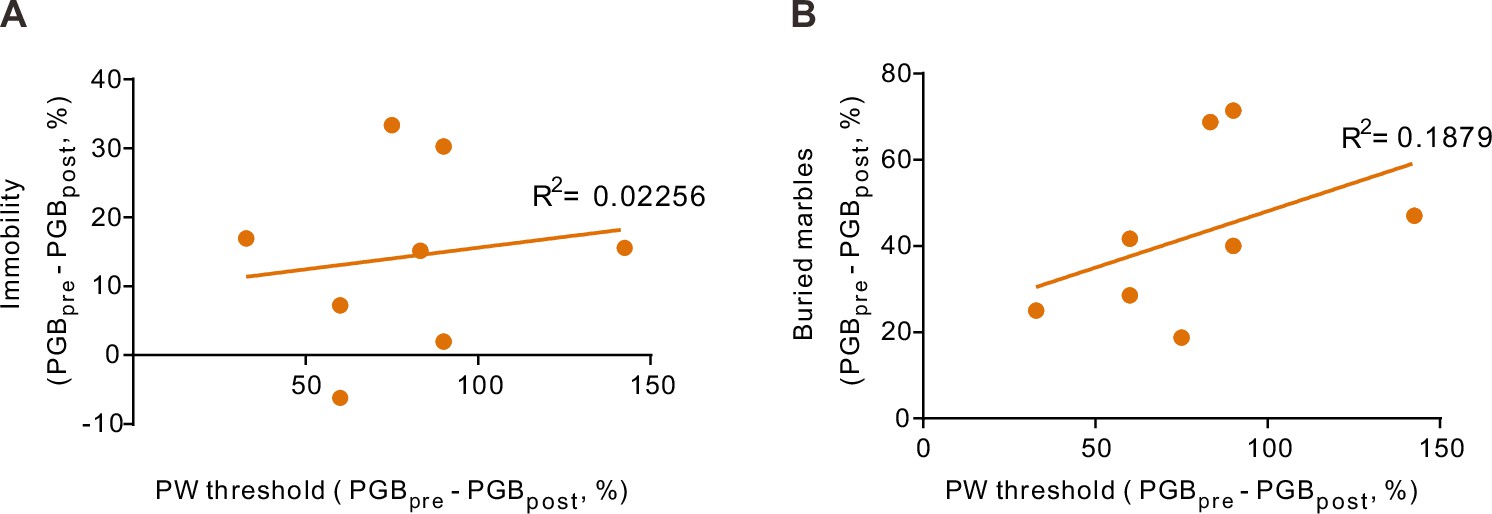
Correlation of the effect of pregabalin (PGB) on the mechano-sensitivity and emotional behavior.
(A) Plot of the change of immobility time against the change of paw withdrawal (PW) threshold (n=8). (B) Plot of the change of number of buried marbles against the change of PW threshold (n=8).
-
Figure 2—figure supplement 1—source data 1
Numerical data to support the graphs in Figure 2—figure supplement 1.
- https://cdn.elifesciences.org/articles/78610/elife-78610-fig2-figsupp1-data1-v1.xlsx
Figure 3 with 4 supplements
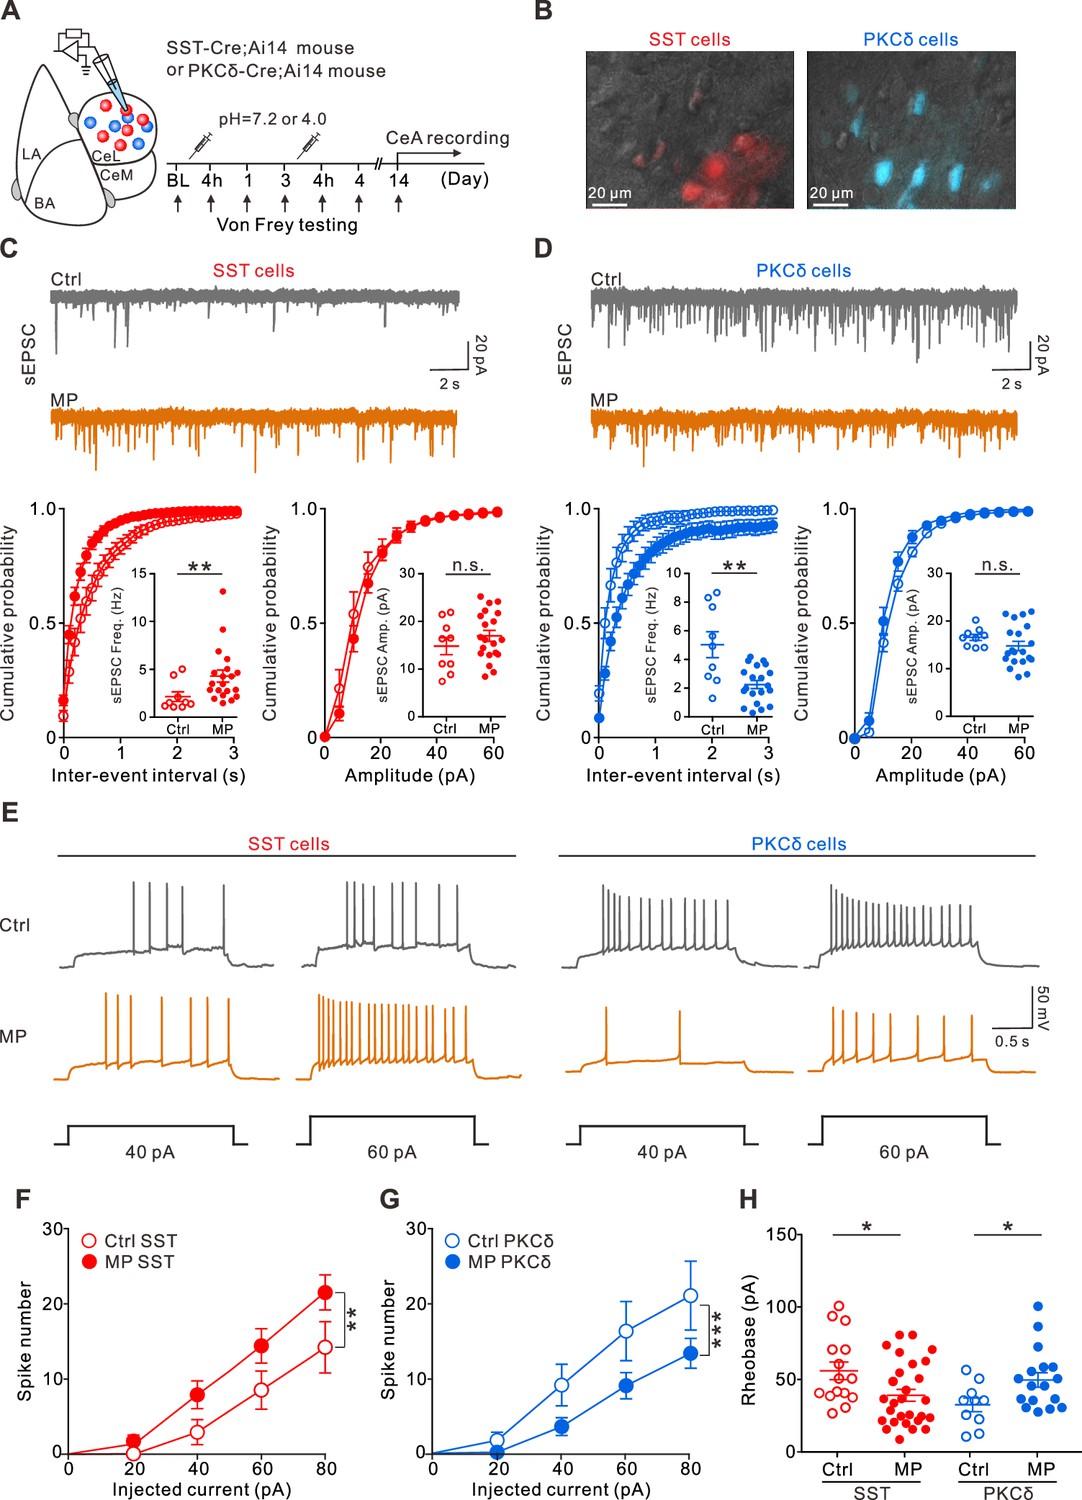
Altered excitatory transmission to the central nucleus of the amygdala (CeA) neurons and changed CeA neuron excitability in muscle pain (MP) mice.
(A) Experimental schematic and timeline. (B) Overlay of epifluorescence and IR-DIC images showing somatostatin-expressing (SST) and protein kinase C delta-expressing (PKCδ) neurons in the CeA. Sections from the SST-Cre;Ai14 and PKCδ-Cre;Ai14 mouse brains. (C) Top, representative spontaneous excitatory postsynaptic current (sEPSC) traces recorded from the CeA-SST neurons of the Ctrl and MP mice. Bottom, cumulative probability of inter-event interval (Ctrl, n=9; MP, n=20; Kolmogorov–Smirnov test, **p=0.0014. Inset, summary of sEPSC frequency, Ctrl, 2.2±0.5 Hz, n=9; MP, 4.3±0.6 Hz, n=20; Mann–Whitney test, U=33, **p=0.006) and amplitude (Ctrl, n=9; MP, n=20; Kolmogorov–Smirnov test, n.s., non-significant, p=0.998. Inset, summary of sEPSC amplitude, Ctrl, 14.9±1.8 pA, n=9; MP, 16.9±1.1 pA, n=20; Mann–Whitney test, U=72, n.s., non-significant, p=0.404). (D) Top, representative sEPSC traces recorded from the CeA-PKCδ neurons of the Ctrl and MP mice. Bottom, cumulative probability of inter-event interval (Ctrl, n=9; MP, n=20; Kolmogorov–Smirnov test, ****p<0.0001. Inset, summary of sEPSC frequency, Ctrl, 5.1±0.9 Hz, n=9; MP, 2.3±0.3 Hz, n=20; Mann–Whitney test, U=36, **p=0.0097) and amplitude (Ctrl, n=9; MP, n=20; Kolmogorov–Smirnov test, n.s., non-significant, p=0.996. Inset, summary of sEPSC amplitude, Ctrl, 16.5±0.6 pA, n=9; MP, 14.7±1.0 pA, n=20, Mann–Whitney test, U=60, n.s., non-significant, p=0.167). (E) Representative responses of the CeA-SST and CeA-PKCδ neurons in the Ctrl and MP mice to depolarizing current injections. (F) Plot of number of spikes in the CeA-SST neurons against injected current (Ctrl, n=15; MP, n=28; two-way analysis of variance (ANOVA) with Bonferroni’s multiple comparison test, F(1,202) = 10.49, **p=0.0014). (G) Plot of number of spikes in CeA-PKCδ neurons against injected current (Ctrl, n=11; MP, n=20; two-way ANOVA with Bonferroni’s multiple comparison test, F(1,143) = 12.77, ***p=0.0005). (H) Summary of rheobase of CeA-SST neurons (Ctrl, 55.7±6.1 pA, n=15; MP, 38.7±4.1 pA, n=28; Mann–Whitney test, U=117, *p=0.017) and CeA-PKCδ neurons (Ctrl, 32±4.7 pA, n=10; MP, 49.6±5.0 pA, n=17; Mann–Whitney test, U=42.5, *p=0.032).
-
Figure 3—source data 1
Numerical data to support the graphs in Figure 3.
- https://cdn.elifesciences.org/articles/78610/elife-78610-fig3-data1-v1.xlsx
Figure 3—figure supplement 1

Comparison of miniature excitatory postsynaptic current (mEPSC), resting potential, and input resistance of the central nucleus of the amygdala (CeA) neurons in the Ctrl and muscle pain (MP) mice.
(A) Top, representative traces of mEPSCs recorded from the somatostatin-expressing CeA (CeA-SST) neurons of the Ctrl and MP mice. Bottom, cumulative probability of inter-event interval (Ctrl, n=6; MP, n=17; Kolmogorov–Smirnov test, ****p<0.0001. Inset, summary of mEPSC frequency, Ctrl, 1.4±0.5 Hz, n=6; MP, 2.5±0.3 Hz, n=17, Mann–Whitney test, U=20, *p=0.029) and amplitude (Ctrl, n=6; MP, n=17; Kolmogorov–Smirnov test, n.s., non-significant, p=0.518. Inset, summary of mEPSC amplitude, Ctrl, 11.8±1.8 pA, n=6; MP, 13.1±0.5 pA, n=17, Mann–Whitney test, U=33, n.s., non-significant, p=0.215). (B) Top, representative traces of mEPSCs recorded from the CeA-PKCδ neurons of the Ctrl and MP mice. Bottom, cumulative probability of inter-event interval (Ctrl, n=7; MP, n=12; Kolmogorov–Smirnov test, ***p=0.0002. Inset, summary of mEPSC frequency, Ctrl, 4.8±0.8 Hz, n=7; MP, 2.6±0.4 Hz, n=12, Mann–Whitney test, U=17, *p=0.036) and amplitude (Ctrl, n=7; MP, n=12; Kolmogorov–Smirnov test, n.s., non-significant, p=0.993. Inset, summary of mEPSC amplitude, Ctrl, 14.0±0.9 pA, n=7; MP, 14.4±0.8 pA, n=12, Mann–Whitney test, U=34, n.s., non-significant, p=0.514). (C) Summary of resting potential of the CeA-SST neurons (Ctrl, –55.3±3.1 mV, n=15; MP, –53.0±2.5 mV, n=28; Mann–Whitney test, U=181, n.s., non-significant, p=0.468). (D) Summary of input resistance of the CeA-SST neurons (Ctrl, 0.42±0.04 GΩ, n=10; MP, 0.53±0.05 GΩ, n=25; Mann–Whitney test, U=97, n.s., non-significant, p=0.312). (E) Summary of resting potential of the CeA-PKCδ neurons (Ctrl, –64.9±4.3 mV, n=11; MP, –63.8±3.1 mV, n=23; Mann–Whitney test, U=120, n.s., non-significant, p=0.821). (F) Summary of input resistance of the CeA-PKCδ neurons (Ctrl, 0.52±0.05 GΩ, n=11; MP, 0.41±0.03 GΩ, n=19; Mann–Whitney test, U=60, n.s., non-significant, p=0.057).
-
Figure 3—figure supplement 1—source data 1
Numerical data to support the graphs in Figure 3—figure supplement 1.
- https://cdn.elifesciences.org/articles/78610/elife-78610-fig3-figsupp1-data1-v1.xlsx
Figure 3—figure supplement 2
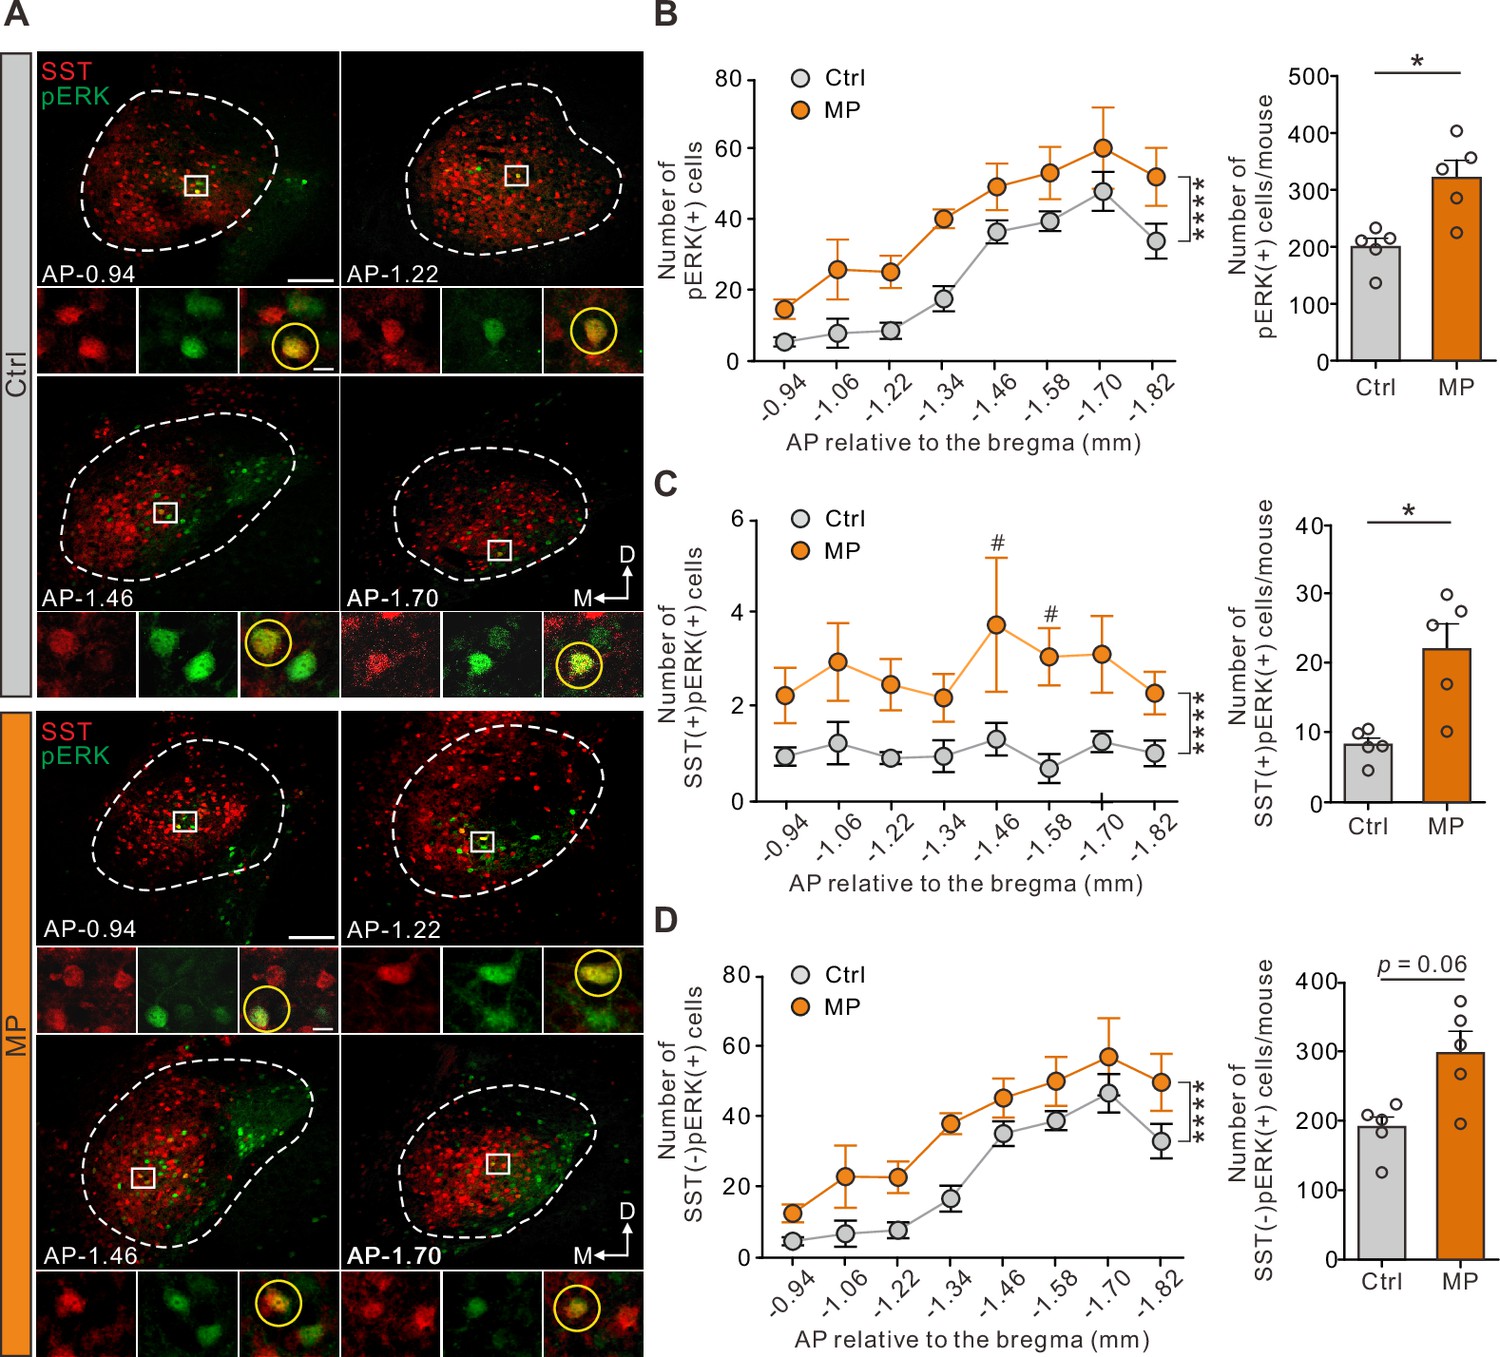
The total number of SST(+)pERK(+) cells in the central nucleus of the amygdala (CeA) was increased in muscle pain (MP) mice.
(A) Representative images of serial coronal sections. Cells positive are shown for SST-tdTomato (red) and pERK (green). Colocalization of pERK and CeA-SST neurons are indicated with yellow color. High-magnification images are shown on the bottom. (B) Left, the total number of pERK(+) cells along the anterior-posterior (AP) axis of the CeA (Ctrl, n=5; MP, n=5; two-way analysis of variance (ANOVA) with Bonferroni’s multiple comparison test, F(1,64) = 29.66; ****p<0.0001). Right, summary of total number of pERK(+) cells per mouse (Ctrl, 197.8±16.5, n=5; MP, 321.0±30.6, n=5; Mann–Whitney test, U=1, *p=0.016). (C) Left, the number of SST(+)pERK(+) cells along the AP axis (Ctrl, n=5; MP, n=5; two-way ANOVA with Bonferroni’s multiple comparison test, F(1,64) = 34.12, ****p<0.0001, #p<0.05; # indicates the comparison between the Ctrl and MP groups at each AP position). Right, summary of total number of SST(+)pERK(+) cells per mouse (Ctrl, 8.2±1.0, n=5; MP, 22.0±3.7, n=5; Mann–Whitney test, U=1, *p=0.016). (D) Left, the total number of SST(-)pERK(+) cells along the AP axis (Ctrl, n=5; MP, n=5; two-way ANOVA with Bonferroni’s multiple comparison test, F(1,64) = 24.4; ****p<0.0001). Right, summary of total number of SST(-)pERK(+) cells per mouse (Ctrl, 189.6±17.0, n=5; MP, 298.8±30.9, n=5; Mann–Whitney test, U=3, p=0.06).
-
Figure 3—figure supplement 2—source data 1
Numerical data to support the graphs in Figure 3—figure supplement 2.
- https://cdn.elifesciences.org/articles/78610/elife-78610-fig3-figsupp2-data1-v1.xlsx
Figure 3—figure supplement 3
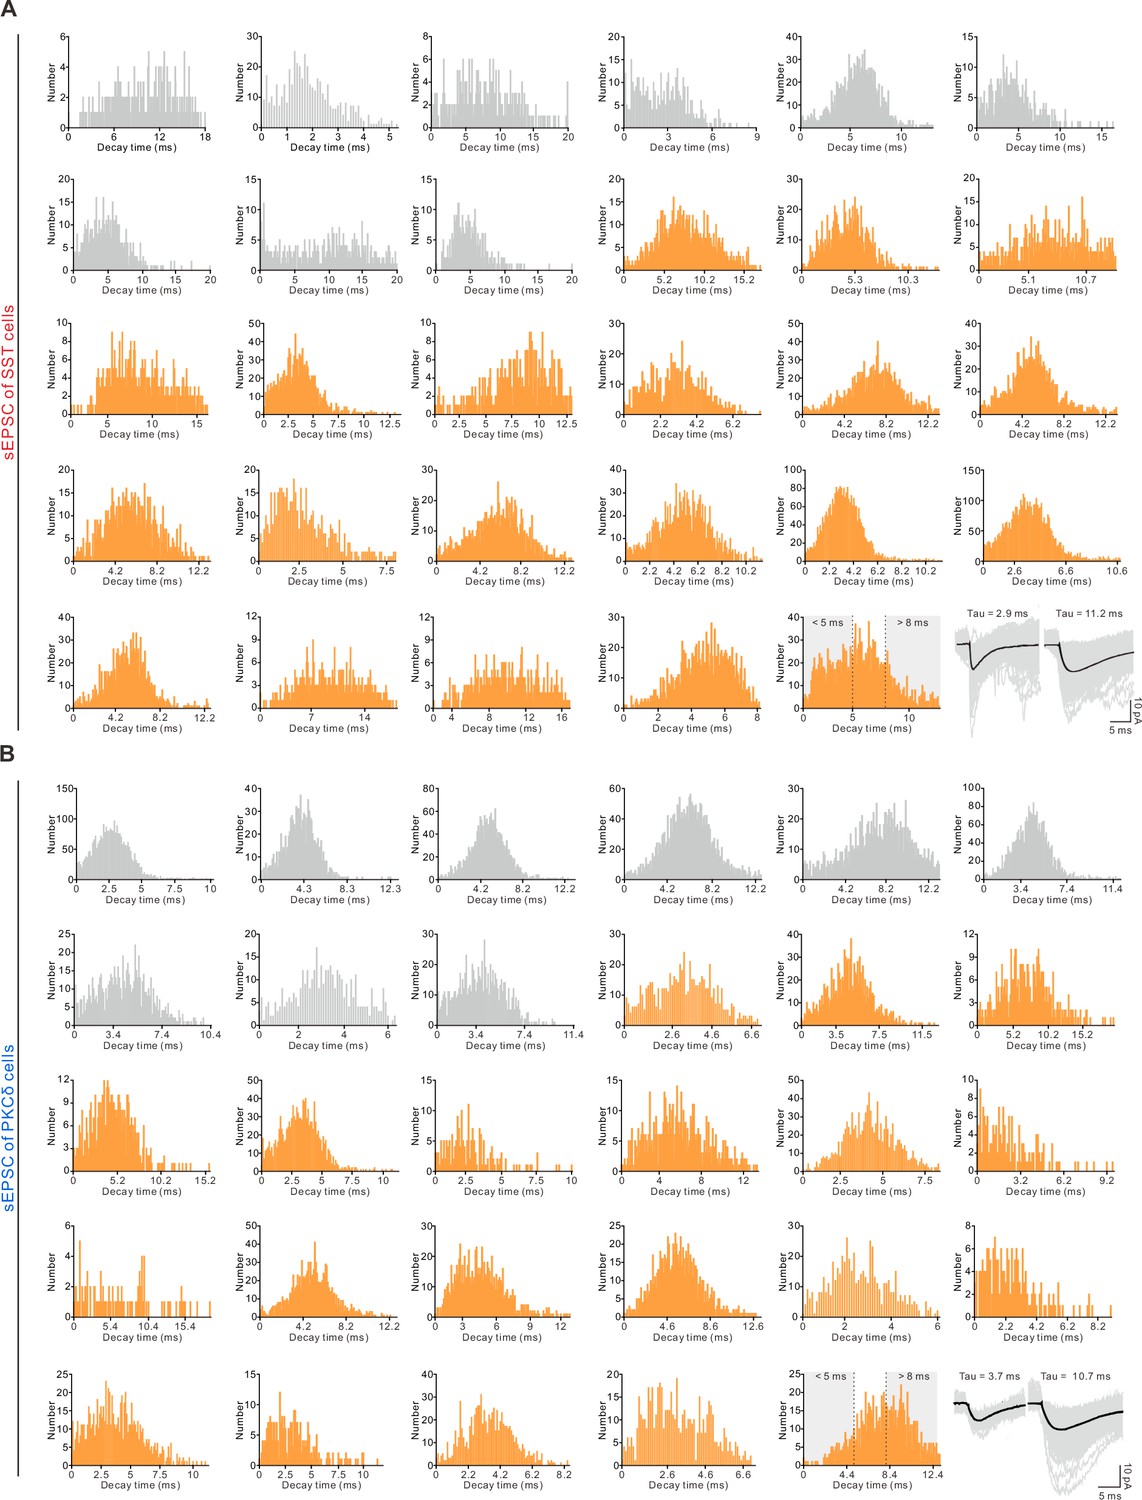
Histogram of the decay time.
(A) Histogram of the decay time recorded from the somatostatin-expressing central nucleus of the amygdala (CeA-SST) neurons of the Ctrl (gray) and muscle pain (MP) (orange) mice. (B) Histogram of the decay time recorded from the CeA-protein kinase C delta-expressing (PKCδ) neurons of the Ctrl (gray) and MP (orange) mice.
Figure 3—figure supplement 4
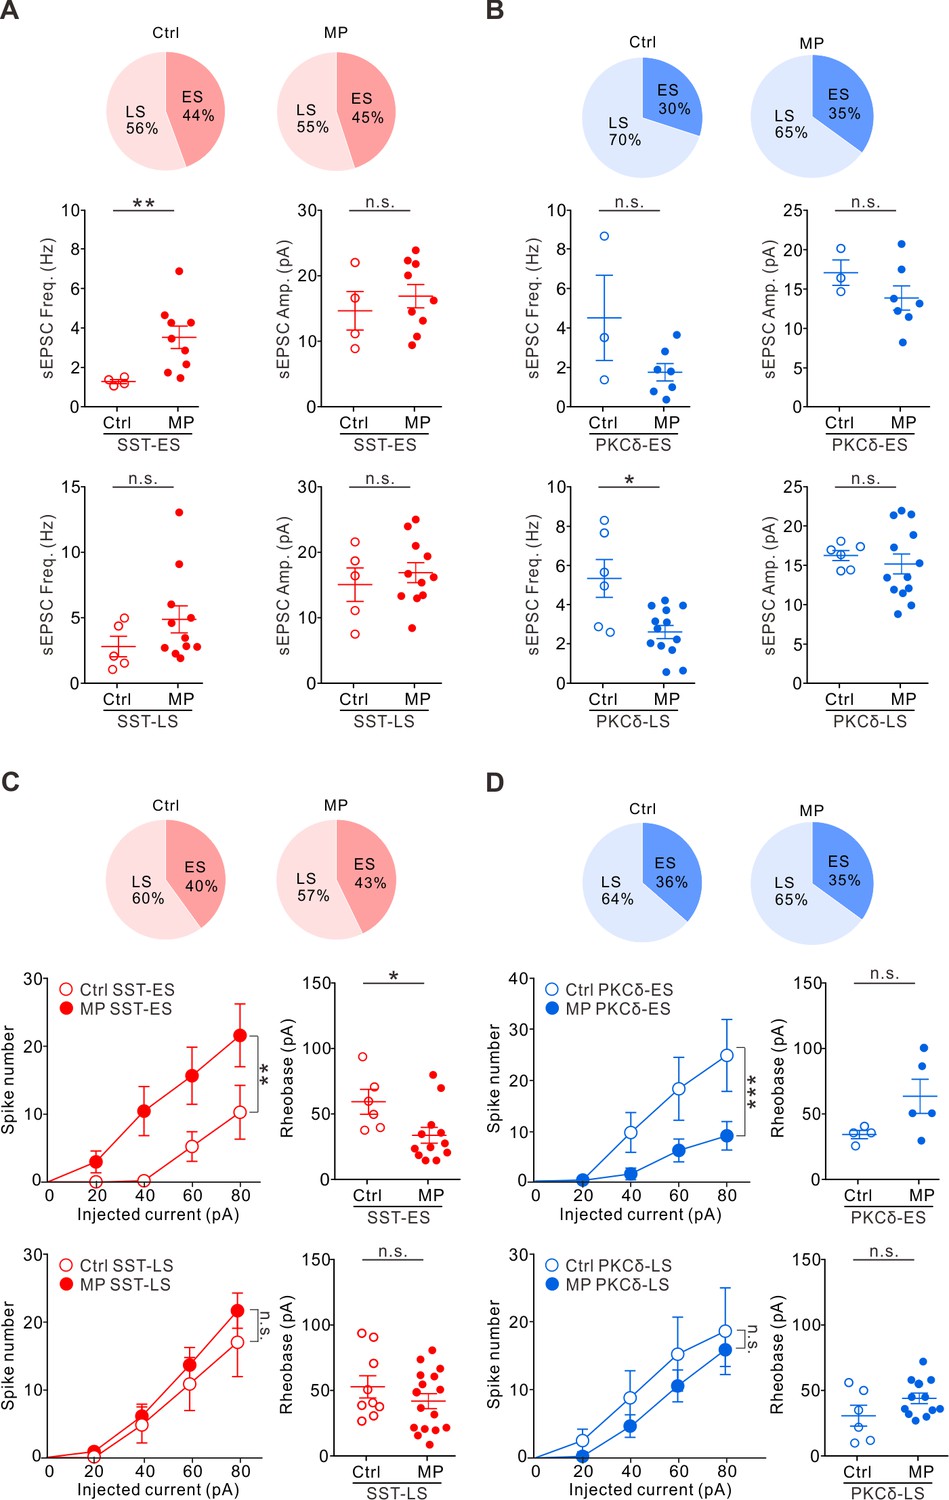
Altered synaptic transmission and excitability of different firing phenotypes of the somatostatin-expressing central nucleus of the amygdala (CeA-SST) and CeA-protein kinase C delta-expressing (PKCδ) neurons in the muscle pain (MP) mice.
(A) Top, the percentage of CeA-SST-ES and CeA-SST-LS neurons in the Ctrl and MP mice quantified after spontaneous excitatory postsynaptic current (sEPSC) recording. Middle, summary of sEPSC frequency (Ctrl, 1.3±0.1 Hz, n=4; MP, 3.5±0.6 Hz, n=9; Mann–Whitney test, U=1, **p=0.006) and amplitude (Ctrl, 14.6±3.0 pA, n=4; MP, 16.9±1.8 pA, n=9; Mann–Whitney test, U=14, p=0.548) of CeA-SST-ES neurons. Bottom, summary of sEPSC frequency (Ctrl, 2.8±0.8 Hz, n=5; MP, 4.9±1.0 Hz, n=11; Mann–Whitney test, U=14, p=0.138) and amplitude (Ctrl, 15.1±2.6 pA, n=5; MP, 16.9±1.5 pA, n=11; Mann–Whitney test, U=23, p=0.617) of CeA-SST-LS neurons. (B) Top, the percentage of the CeA-PKCδ-ES and CeA-PKCδ-LS neurons in the Ctrl and MP mice quantified after sEPSC recording. Middle, summary of sEPSC frequency (Ctrl, 4.5±2.2 Hz, n=3; MP, 1.7±0.4 Hz, n=7; Mann–Whitney test, U=5, p=0.267) and amplitude (Ctrl, 17.1±1.6 pA, n=3; MP, 13.9±1.6 pA, n=7; Mann–Whitney test, U=5, p=0.267) of CeA-PKCδ-ES neurons. Bottom, summary of sEPSC frequency (Ctrl, 5.3±1.0 Hz, n=6; MP, 2.6±0.3 Hz, n=13; Mann–Whitney test, U=13, *p=0.022) and amplitude (Ctrl, 16.3±0.6 pA, n=6; MP, 15.2±1.3 pA, n=13; Mann–Whitney test, U=30, p=0.47) of the CeA-PKCδ-LS neurons. (C) Top, the percentage of the CeA-SST-ES and CeA-SST-LS neurons in the Ctrl and MP mice. Middle left, plot of number of spikes in the CeA-SST-ES neurons against injected current (Ctrl, n=6; MP, n=12; two-way analysis of variance (ANOVA) with Bonferroni’s multiple comparison test, F(1,78) = 10.84, **p=0.0015). Middle right, summary of rheobase of the CeA-SST-ES neurons (Ctrl, 59.7±9.5 pA, n=6; MP, 34.2±6.0 pA, n=12; Mann–Whitney test, U=11.5, *p=0.02). Bottom left, plot of number of spikes in CeA-SST-LS neurons against injected current (Ctrl, n=9; MP, n=16; two-way ANOVA with Bonferroni’s multiple comparison test, F(1,114) = 1.618, p=0.206). Bottom right, summary of rheobase of CeA-SST-LS neurons (Ctrl, 53.0±8.4 pA, n=9; MP, 42.1±5.6 pA, n=16; Mann–Whitney test, U=52.5, p=0.282). (D) Top, the percentage of CeA-PKCδ-ES and CeA-PKCδ-LS neurons in the Ctrl and MP mice. Middle left, plot of number of spikes in CeA-PKCδ-ES neurons against injected current (Ctrl, n=4; MP, n=7; two-way ANOVA with Bonferroni’s multiple comparison test, F(1,45) = 16.4, ***p=0.0002). Middle right, summary of rheobase of CeA-PKCδ-ES neurons (Ctrl, 33.8±3.1 pA, n=4; MP, 63.0±13.0 pA, n=5; Mann–Whitney test, U=3, p=0.127). Bottom left, plot of number of spikes in CeA-PKCδ-LS neurons against injected current (Ctrl, n=7; MP, n=13; two-way ANOVA with Bonferroni’s multiple comparison test, F(1,88) = 2.84, p=0.096). Bottom right, summary of rheobase of CeA-PKCδ-LS neurons (Ctrl, 30.8±7.9 pA, n=6; MP, 44.1±4.0 pA, n=12; Mann–Whitney test, U=20.5, p=0.157).
-
Figure 3—figure supplement 4—source data 1
Numerical data to support the graphs in Figure 3—figure supplement 4.
- https://cdn.elifesciences.org/articles/78610/elife-78610-fig3-figsupp4-data1-v1.xlsx
Figure 4 with 5 supplements
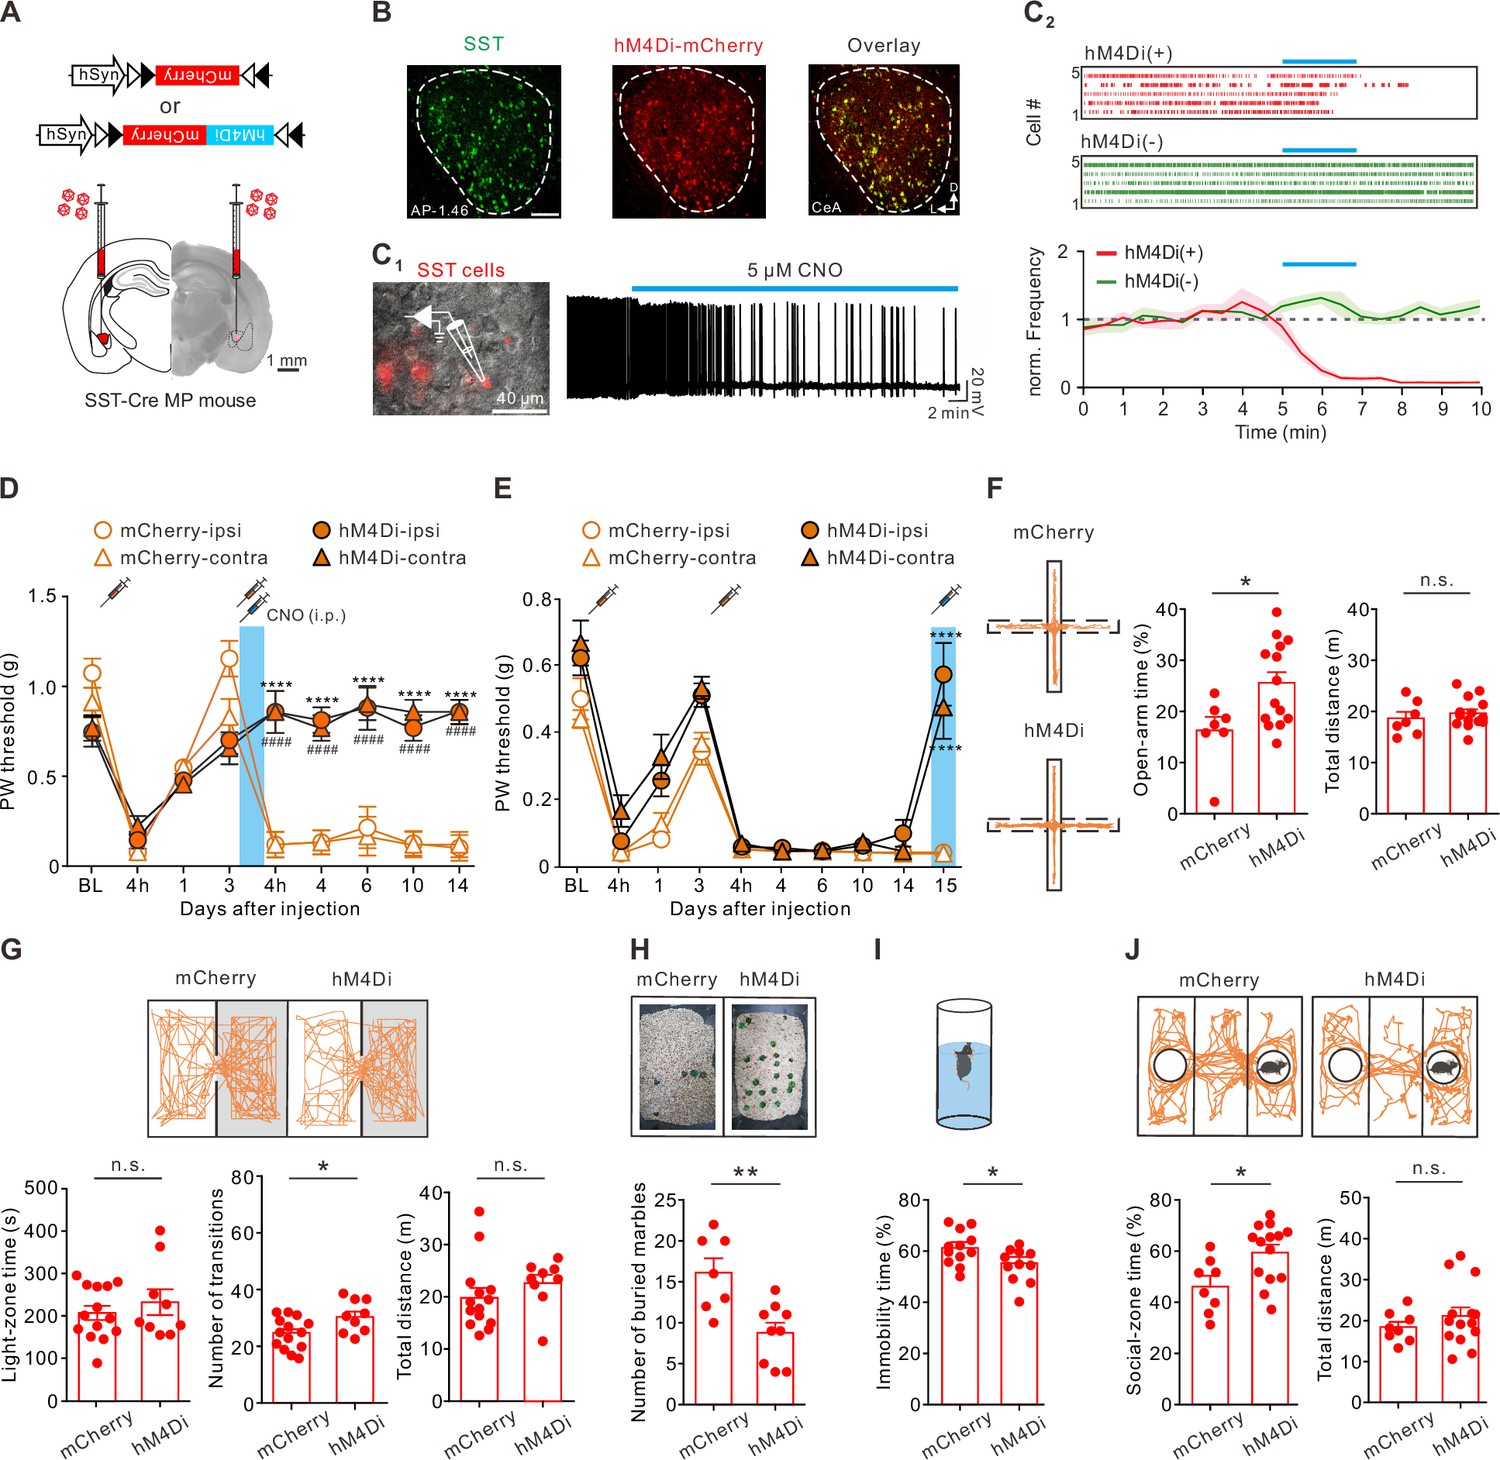
Inactivating the somatostatin-expressing central nucleus of the amygdala (CeA-SST) neurons alleviated pain and affective symptoms.
(A) Viral constructs and experimental schematic. (B) Left, representative image of the CeA-SST neurons (green) recognized by an antibody. Middle, representative image of expression of hM4Di-mCherry (red) virus. Right, overlapping image of hM4Di-mCherry and SST antibody signals. (C1) Left, overlay of epifluorescence and IR-DIC images showing mCherry(+) neurons in the CeA. Right, membrane firing frequency changes of an hM4Di-expressing CeA-SST neuron before and after bath application of clozapine-N-oxide (CNO). (C2) Top, representative of raster plots of hM4Di(+) and hM4Di(-) neurons. Blue bar indicates 5 µM CNO application for 2 min. Bottom, normalized firing frequency in both hM4Di(+) and hM4Di(-) neurons (hM4Di(-), n=10; hM4Di(+), n=10; two-way analysis of variance (ANOVA) with Bonferroni’s multiple comparison test, F(1,376) = 231.1, ****p<0.0001). (D) Effects of the CNO treatment on day 3 on the paw withdrawal (PW) threshold (mCherry, n=5; hM4Di, n=9; two-way ANOVA with Tukey’s post hoc test, F(3,216) = 46.82, ****,####p<0.0001; * indicates the comparison between the ipsilateral hindpaw; # indicates the comparison between the contralateral hindpaws. The blue area indicates the period of CNO treatment). (E) Effects of the CNO treatment on the PW threshold in the muscle pain (MP) mice (mCherry, n=10; hM4Di, n=9; two-way ANOVA with Tukey’s post hoc test, F(9,340) = 124.1, ****p<0.0001 relative to day 14. The blue area indicates the period of CNO treatment). (F) Left, representative trajectories of each MP group during the elevated plus maze (EPM) test. Right, summary of the effects of CNO treatment on the open-arm time (mCherry, 16.2 ± 2.5%, n=7; hM4Di, 25.5 ± 2.2%, n=14; Mann–Whitney test, U=19, *p=0.025) and total distance (mCherry, 18.7±1.3 m, n=7; hM4Di, 19.7±0.8 m, n=14; Mann–Whitney test, U=37, n.s., non-significant, p=0.383). (G) Top, representative travel paths of each MP group during the light/dark (L/D) box test. Bottom, summary of the CNO effect on the light-zone time (mCherry, 204.9±16.7 s, n=14; hM4Di, 230.2±30.3 s, n=9; Mann–Whitney test, U=57, n.s., non-significant, p=0.73), number of transitions (mCherry, 23.6±1.5, n=14; hM4Di, 30.0±1.9, n=9; Mann–Whitney test, U=28.5, *p=0.028) and total distance (mCherry, 20.0±1.8 m, n=14; hM4Di, 22.7±1.6 m, n=9; Mann–Whitney test, U=34, n.s., non-significant, p=0.072). (H) Top, representative images of the marble burying test. Bottom, summary of the effects of CNO treatment on the number of buried marbles (mCherry, 16.1±1.8, n=7; hM4Di, 8.8±1.2, n=9; Mann–Whitney test, U=6.5, **p=0.005). (I) Top, schematic of the forced swim test (FST) setup. Bottom, summary of relative time of immobility (mCherry, 61.4 ± 1.9%, n=12; hM4Di, 54.2 ± 2.0%, n=11; Mann–Whitney test, U=29, *p=0.022). (J) Top, representative travel paths of each MP group during the three-chamber sociability test. Bottom, summary of the effects of CNO treatment on the social-zone time (mCherry, 46.7 ± 3.7%, n=8; hM4Di, 60.0 ± 3.1%, n=14; Mann–Whitney test, U=22, *p=0.019) and total distance (mCherry, 18.5±1.3 m, n=8; hM4Di, 21.2±2.1 m, n=14; Mann–Whitney test, U=47, n.s., non-significant, p=0.55).
-
Figure 4—source data 1
Numerical data to support the graphs in Figure 4.
- https://cdn.elifesciences.org/articles/78610/elife-78610-fig4-data1-v1.xlsx
Figure 4—figure supplement 1
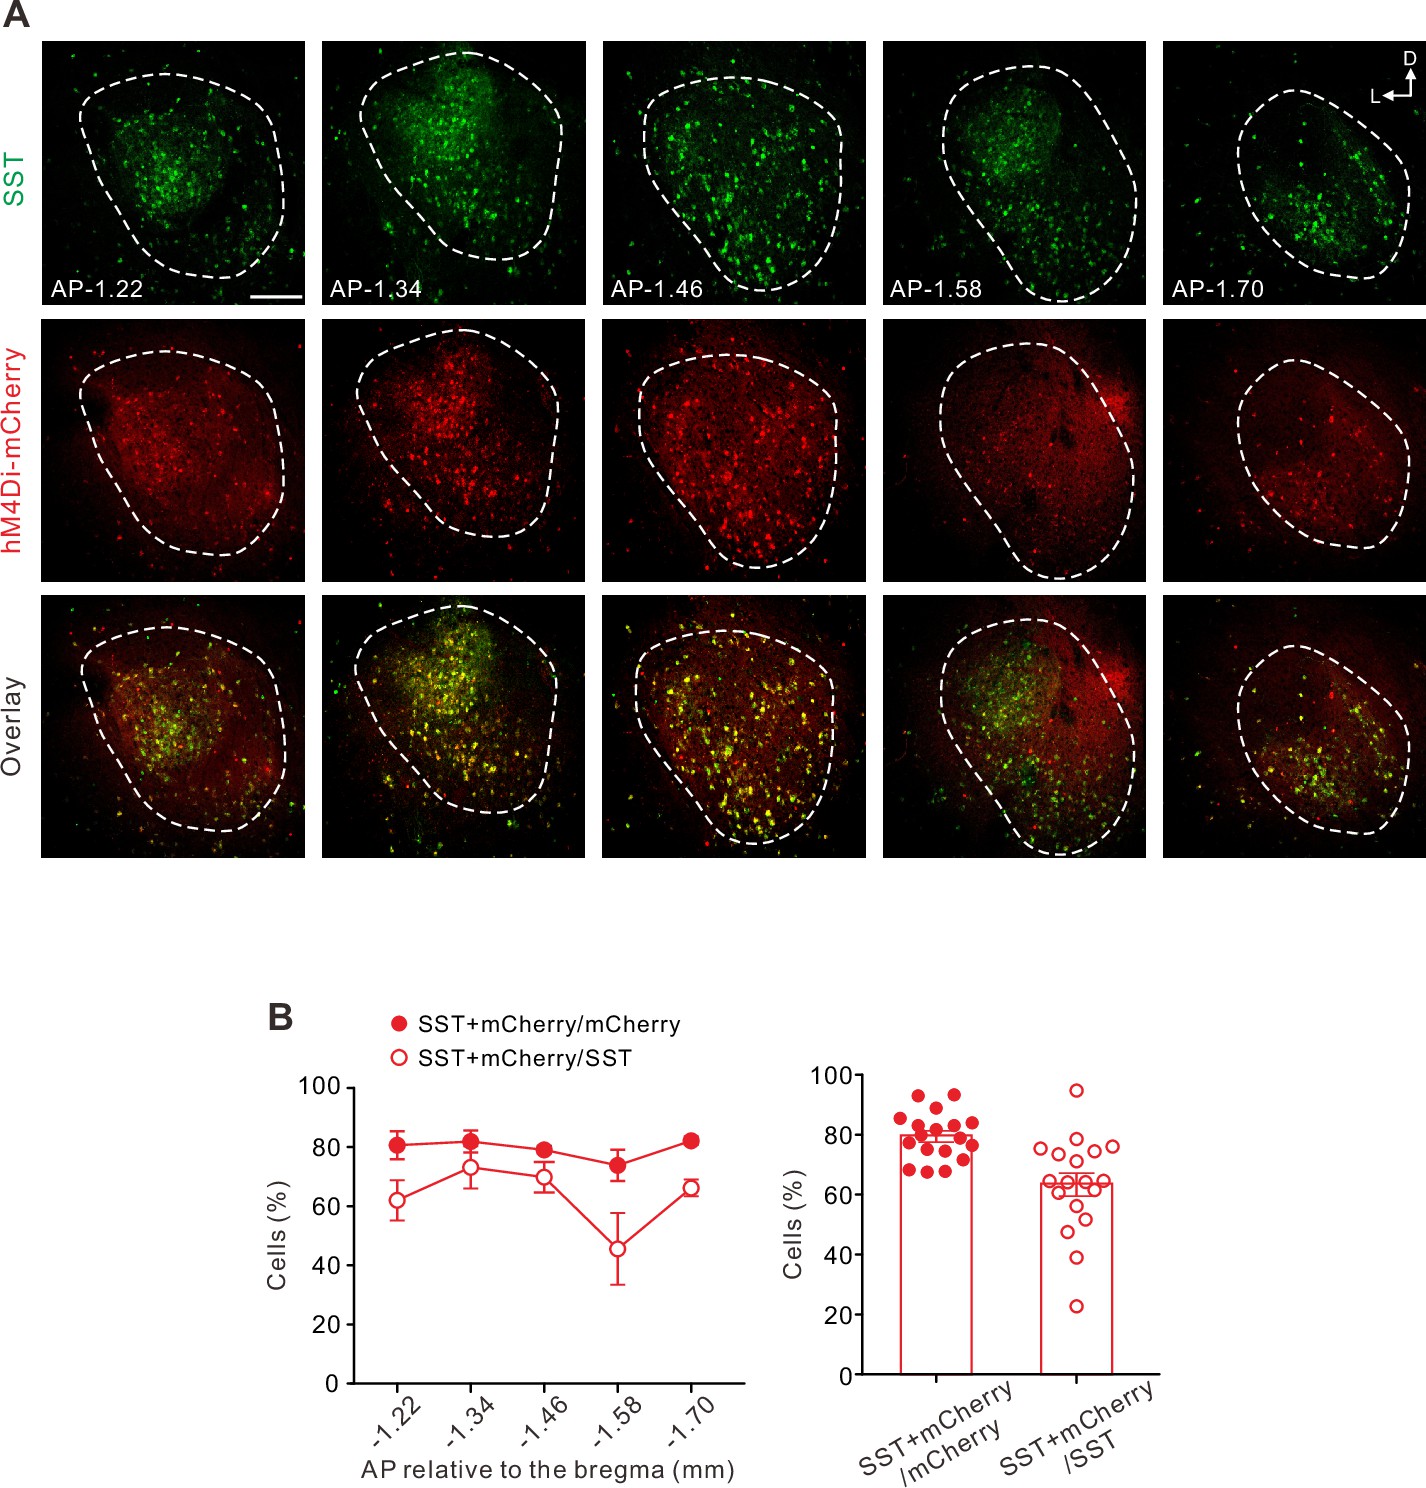
Colocalization of specific somatostatin-expressing (SST) biomarker with virus expression.
(A) Representative images of serial coronal sections. Colocalization of hM4Di-mCherry-expressing (red) and SST-immunoreactive (green) neurons are in yellow. (B) Left, distribution of the SST+mCherry/mCherry and SST+mCherry/SST cells along the anterior-posterior (AP) axis. Right, the summary plot of the percentage of the colocalized cells (SST+mCherry/SST, 63.63 ± 3.83%; SST+mCherry/mCherry, 79.68 ± 1.87%; n=18 slice from two mice).
-
Figure 4—figure supplement 1—source data 1
Numerical data to support the graphs in Figure 4—figure supplement 1.
- https://cdn.elifesciences.org/articles/78610/elife-78610-fig4-figsupp1-data1-v1.xlsx
Figure 4—figure supplement 2
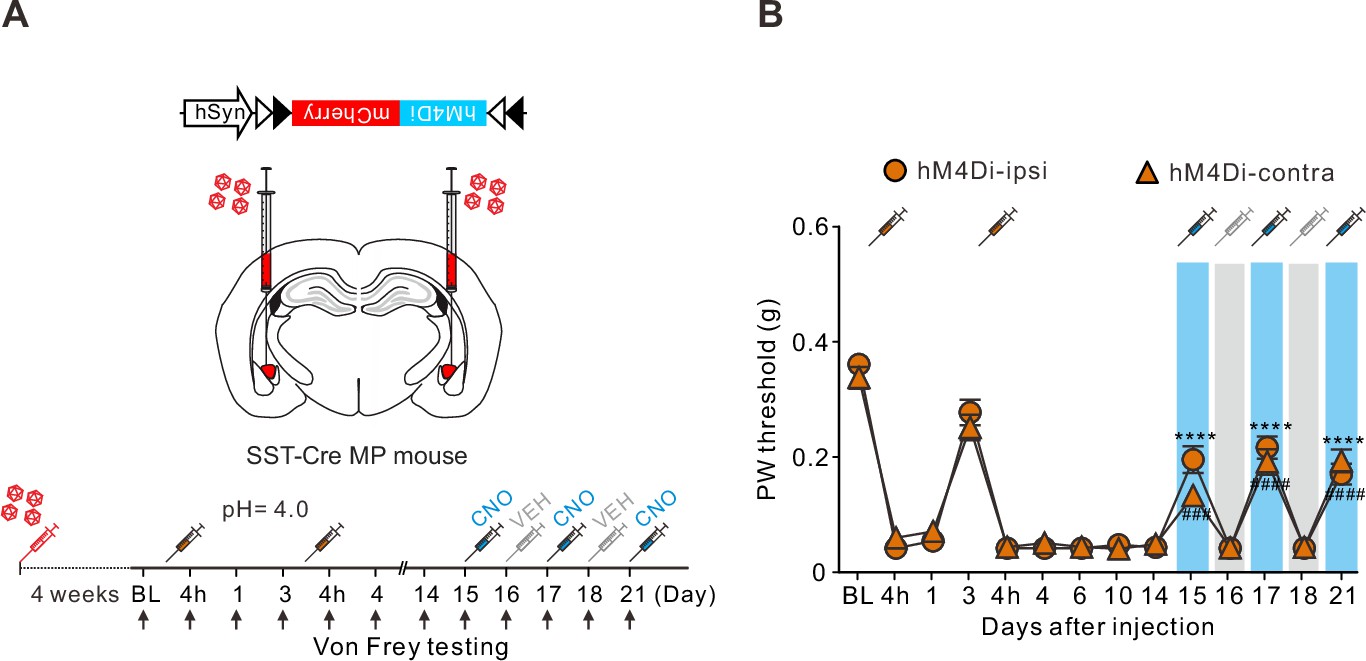
Suppression of the somatostatin-expressing central nucleus of the amygdala (CeA-SST) neurons increased the withdrawal threshold in the muscle pain (MP) mice.
(A) Experimental schematic and timeline. (B) Mice were injected with acidic saline (pH = 4.0) in the left gastrocnemius muscle on the baseline (BL) (day 0) and day 3. Following the pain induction, the withdrawal threshold was continuously monitored for 21 days (MP, n=43, two-way analysis of variance (ANOVA) with Tukey’s post hoc test, F(13,1176)=136.3, ###p<0.05, ****,####p<0.0001 relative to day 14; * indicates the comparison between the ipsilateral hindpaws; # indicates the comparison between the contralateral hindpaws. Blue bars indicated clozapine-N-oxide (CNO) application. Gray bars indicated vehicle application).
-
Figure 4—figure supplement 2—source data 1
Numerical data to support the graphs in Figure 4—figure supplement 2.
- https://cdn.elifesciences.org/articles/78610/elife-78610-fig4-figsupp2-data1-v1.xlsx
Figure 4—figure supplement 3
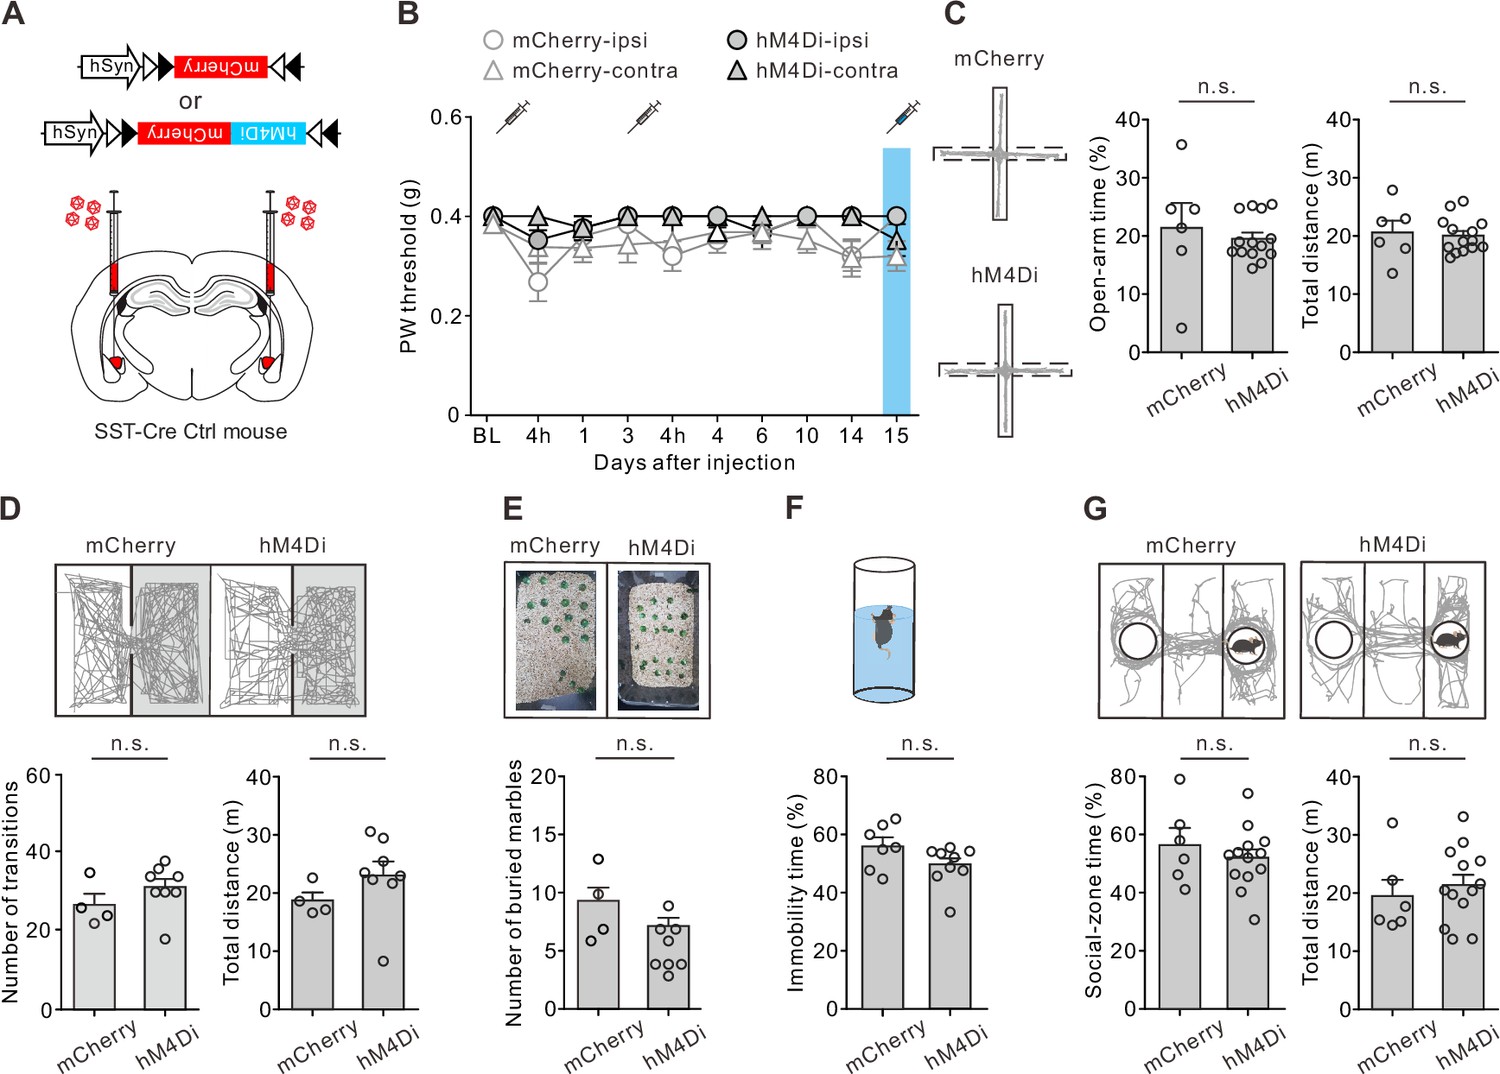
Suppressing somatostatin-expressing central nucleus of the amygdala (CeA-SST) neuron excitability in the Ctrl mice exerted little effect on the nociception and affective behaviors.
(A) Viral constructs and experimental schematic. (B) Effect of clozapine-N-oxide (CNO) treatment on the paw withdrawal (PW) threshold in the Ctrl mice (mCherry, n=10; hM4Di, n=15; two-way analysis of variance (ANOVA) with Tukey’s post hoc test, F(9,460) = 1.742, p=0.08). Blue area indicates the period of CNO treatment. (C) Left, representative trajectories during the elevated plus maze (EPM) test. Right, summary of the effects of CNO treatment on the open-arm time (mCherry, 21.3 ± 4.2%, n=6; hM4Di, 19.5 ± 1.0%, n=14; Mann–Whitney test, U=34, n.s., non-significant, p=0.545) and total distance (mCherry, 20.7±2.0 m, n=6; hM4Di, 20.1±0.8 m, n=14; Mann–Whitney test, U=37, n.s., non-significant, p=0.716). (D) Top, representative travel paths of each Ctrl group during the light/dark (L/D) box test. Bottom, summary of CNO effect on the number of transitions (mCherry, 26.8±2.9, n=4; hM4Di, 31.3±2.2, n=8; Mann–Whitney test, U=9, n.s., non-significant, p=0.259) and total distance (mCherry, 18.7±1.4 m, n=4; hM4Di, 23.0±2.4 m, n=8; Mann–Whitney test, U=6, n.s., non-significant, p=0.105). (E) Top, representative images of the marble burying test. Bottom, summary of the effects of CNO treatment on the number of buried marbles (mCherry, 9.0±1.6, n=4; hM4Di, 5.5±0.7, n=8; Mann–Whitney test, U=5.5, n.s., non-significant, p=0.083). (F) Top, schematic of the forced swim test (FST) setup. Bottom, summary of relative time of immobility (mCherry, 56.1 ± 2.9%, n=7; hM4Di, 49.2 ± 2.3%, n=9; Mann–Whitney test, U=15, n.s., non-significant, p=0.091). (G) Top, representative travel paths during the three-chamber sociability test. Bottom, summary of the effects of CNO treatment on the social-zone time (mCherry, 56.6 ± 5.6%, n=6; hM4Di, 52.0 ± 2.9%, n=13; Mann–Whitney test, U=32, n.s., non-significant, p=0.577) and total distance (mCherry, 19.5±2.7 m, n=6; hM4Di, 21.3±1.8 m, n=13; Mann–Whitney test, U=32, n.s., non-significant, p=0.549).
-
Figure 4—figure supplement 3—source data 1
Numerical data to support the graphs in Figure 4—figure supplement 3.
- https://cdn.elifesciences.org/articles/78610/elife-78610-fig4-figsupp3-data1-v1.xlsx
Figure 4—figure supplement 4
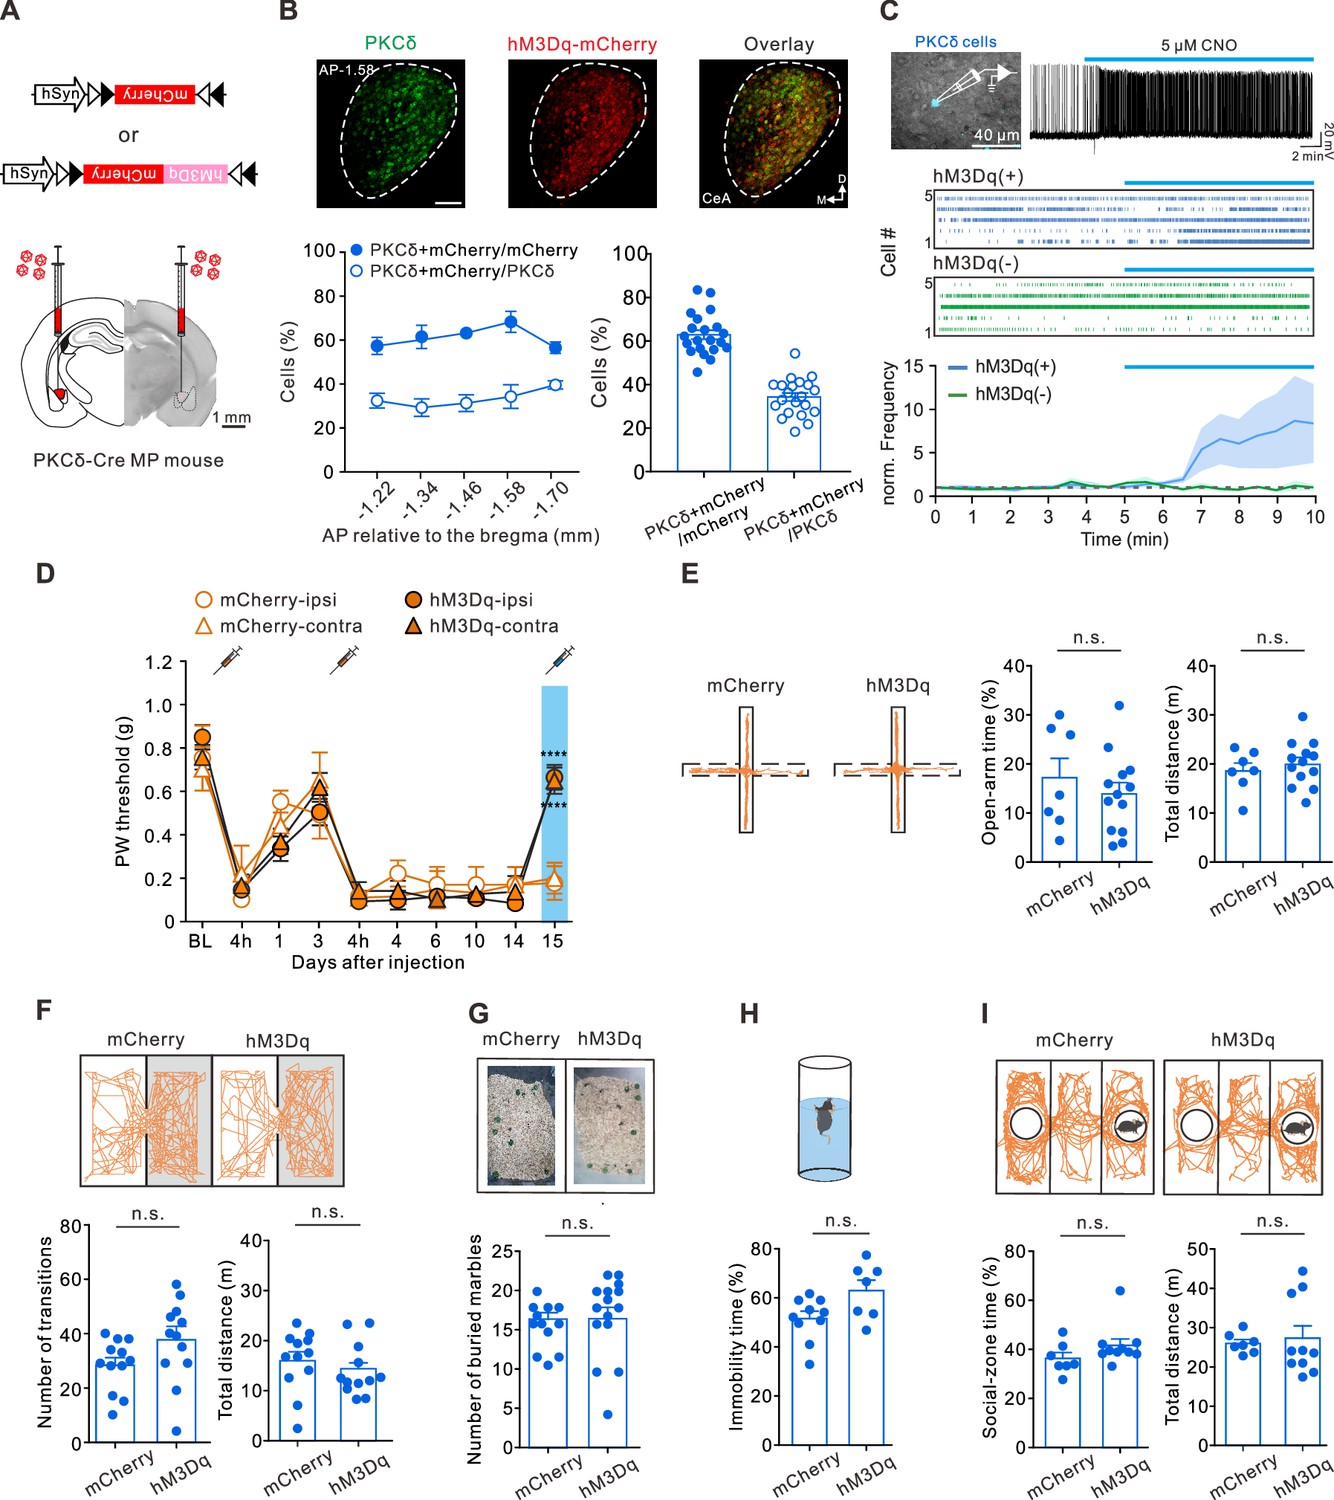
Enhancing central nucleus of the amygdala (CeA)-protein kinase C delta-expressing (PKCδ) neuron excitability reduced pain, but failed to alleviate affective symptoms.
(A) Viral constructs and experimental schematic. Scale bar, 1 mm. (B) Top left, representative image of the CeA-PKCδ neurons (green) recognized by an antibody. Top middle, representative image of expression of the hM3Dq-mCherry (red) virus. Top right, overlapping image of the hM3Dq-mCherry and PKCδ antibody signals. Bottom left, distribution of the PKCδ+mCherry/mCherry and PKCδ+mCherry/PKCδ cells along the anterior-posterior (AP) axis. Bottom right, the summary plot of the percentage of the colocalized cells (PKCδ+mCherry/PKCδ, 34.11 ± 1.86%; PKCδ+mCherry/mCherry, 62.73 ± 2.09%; n=21 slice from two mice). (C) Top left, overlay of epifluorescence and IR-DIC images showing mCherry(+) neurons in the CeA. Top right, membrane firing frequency changes of an hM3Dq-expressing CeA-PKCδ neurons before and after bath application of clozapine-N-oxide (CNO). Middle, raster plots of hM3Dq(+) and hM3Dq(-) neurons. Blue bar indicates 5 µM CNO application. Bottom, normalized firing frequency in both hM3Dq(+) and hM3Dq(-) neurons (hM3Dq(-), n=5; hM3Dq(+), n=6; two-way analysis of variance (ANOVA) with Bonferroni’s multiple comparison test, F(1,189) = 15.23, ***p=0.0001). (D) Effect of CNO on the paw withdrawal (PW) threshold in the hM3Dq-MP mice (mCherry, n=5; hM3Dq, n=13; two-way ANOVA with Tukey’s post hoc test, F(9,320) = 47.72, ****p<0.0001 relative to day 14. The blue area indicates the period of CNO treatment). (E) Left, representative trajectories of each muscle pain (MP) group during the elevated plus maze (EPM) test. Right, summary of the effects of CNO treatment on open-arm time (mCherry, 17.2 ± 3.9%, n=7; hM3Dq, 13.9 ± 2.3%, n=13; Mann–Whitney test, U=39, n.s., non-significant, p=0.639) and total distance (mCherry, 18.8±1.6 m, n=7; hM3Dq, 20.2±1.3 m, n=13; Mann–Whitney test, U=39, n.s., non-significant, p=0.616). (F) Top, representative travel paths of each MP group during the light/dark (L/D) box test. Bottom, summary of CNO effect on the number of transitions (mCherry, 28.3±2.8, n=12; hM3Dq, 37.1±4.4, n=12; Mann–Whitney test, U=38.5, n.s., non-significant, p=0.053) and total distance (mCherry, 16.0±1.8 m, n=12; hM3Dq, 14.0±1.5 m, n=12; Mann–Whitney test, U=51, n.s., non-significant, p=0.239). (G) Top, representative images of the marble burying test. Bottom, summary of the effects of CNO treatment on the number of buried marbles (mCherry, 15.8±0.8, n=12; hM3Dq, 16.1±1.2, n=15; Mann–Whitney test, U=74.5, n.s., non-significant, p=0.461). (H) Top, schematic of the forced swim test (FST) setup. Bottom, summary of relative time of immobility (mCherry, 51.6 ± 2.8%, n=10; hM3Dq, 63.3 ± 4.2%, n=7; Mann–Whitney test, U=16.5, n.s., non-significant, p=0.074). (I) Top, representative travel paths of each MP group during the three-chamber sociability test. Bottom, summary of the effects of CNO treatment on social-zone time (mCherry, 36.1 ± 2.4%, n=7; hM3Dq, 41.6 ± 2.6%, n=10; Mann–Whitney test, U=18, n.s., non-significant, p=0.107) and total distance (mCherry, 26.0±1.0 m, n=7; hM3Dq, 27.3±3.1 m, n=10; Mann–Whitney test, U=26, n.s., non-significant, p=0.414).
-
Figure 4—figure supplement 4—source data 1
Numerical data to support the graphs in Figure 4—figure supplement 4.
- https://cdn.elifesciences.org/articles/78610/elife-78610-fig4-figsupp4-data1-v1.xlsx
Figure 4—figure supplement 5
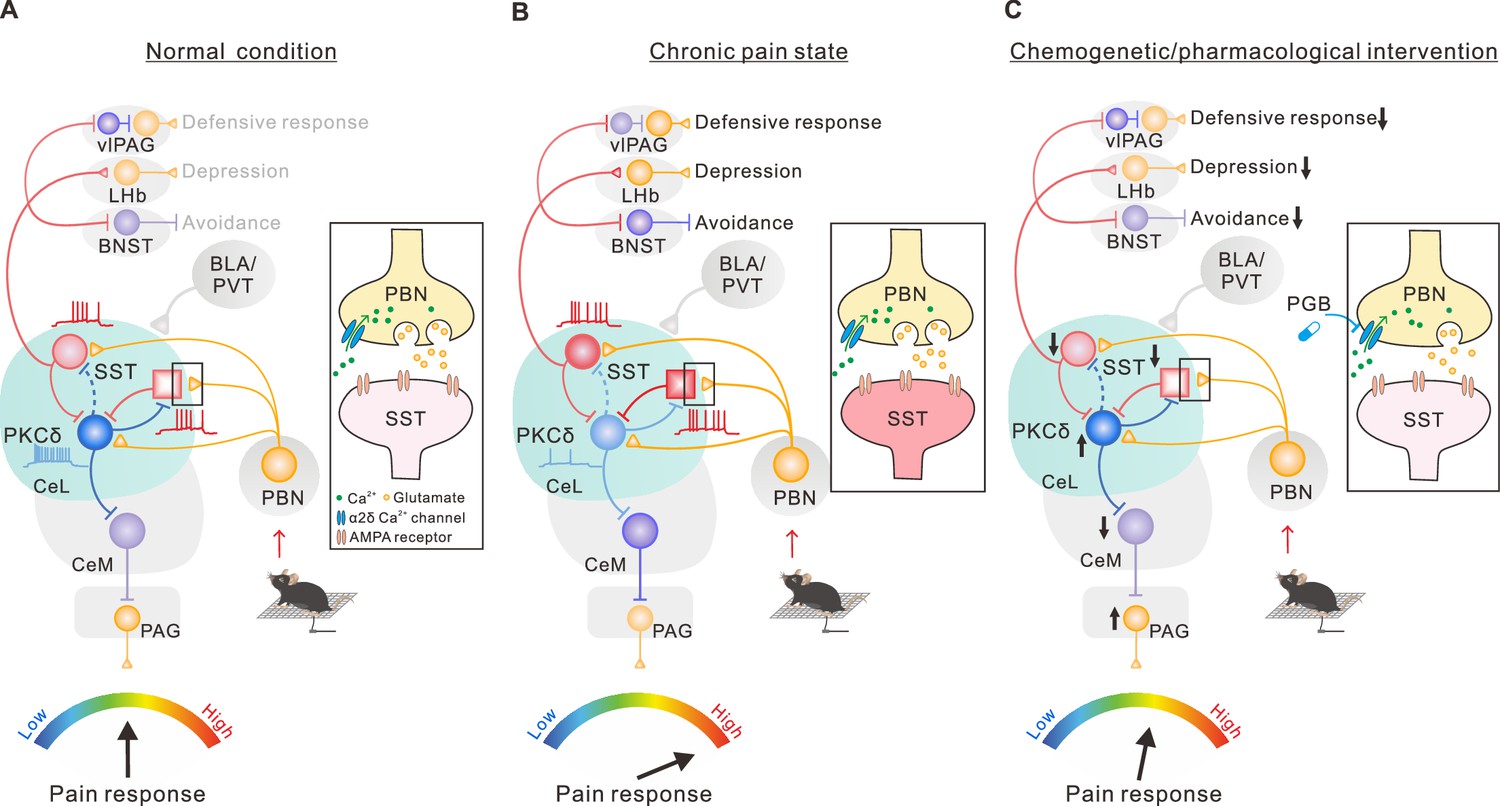
Proposed wiring diagram of central nucleus of the amygdala (CeA) circuits, extrinsic pathways, and behavioral responses.
(A–C) Somatostatin-expressing CeA (CeA-SST) neurons comprise at least two subpopulations. One subpopulation of the CeA-SST neurons (red circle) project to the bed nucleus of the stria terminalis (BNST) for approach-avoidance behaviors, the midbrain ventrolateral periaqueductal gray (vlPAG) for active avoidance behavior, and the lateral habenula (LHb) for depression-like behavior. Furthermore, the CeA-protein kinase C delta-expressing (PKCδ) neurons also establish reciprocal inhibition with another subpopulation of the CeA-SST neurons (red square) and project to the major output of the CeA, which is the medial division of the CeA (CeM) region, and then project to the PAG region for pain behavior. Both CeA-SST and CeA-PKCδ neuron subpopulations receive input from the parabrachial nucleus (PBN), basolateral amygdala (BLA), and paraventricular thalamus (PVT). (A) Normal condition; (B) muscle pain (MP) state; (C) treated state after chemogenetic inactivation of the CeA-SST neurons or activation of the CeA-PKCδ neurons or after pregabalin (PGB) treatment.
Figure 5 with 2 supplements
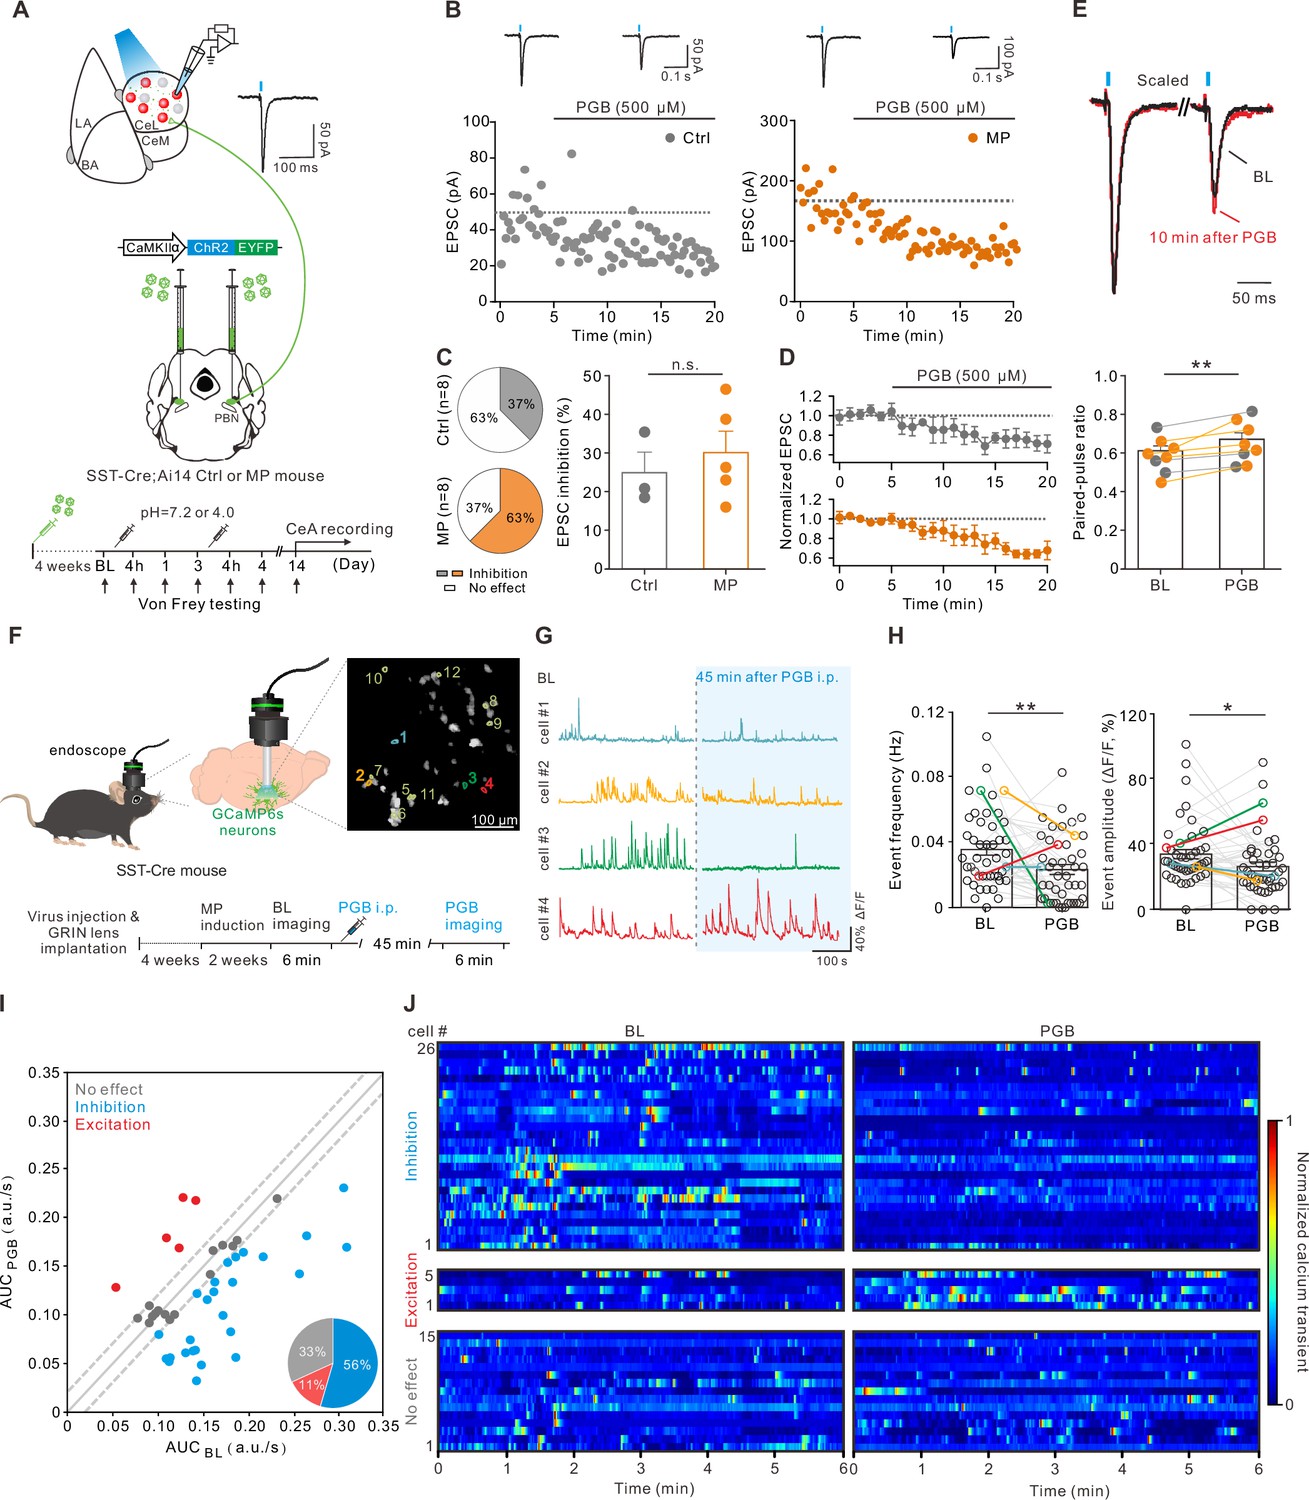
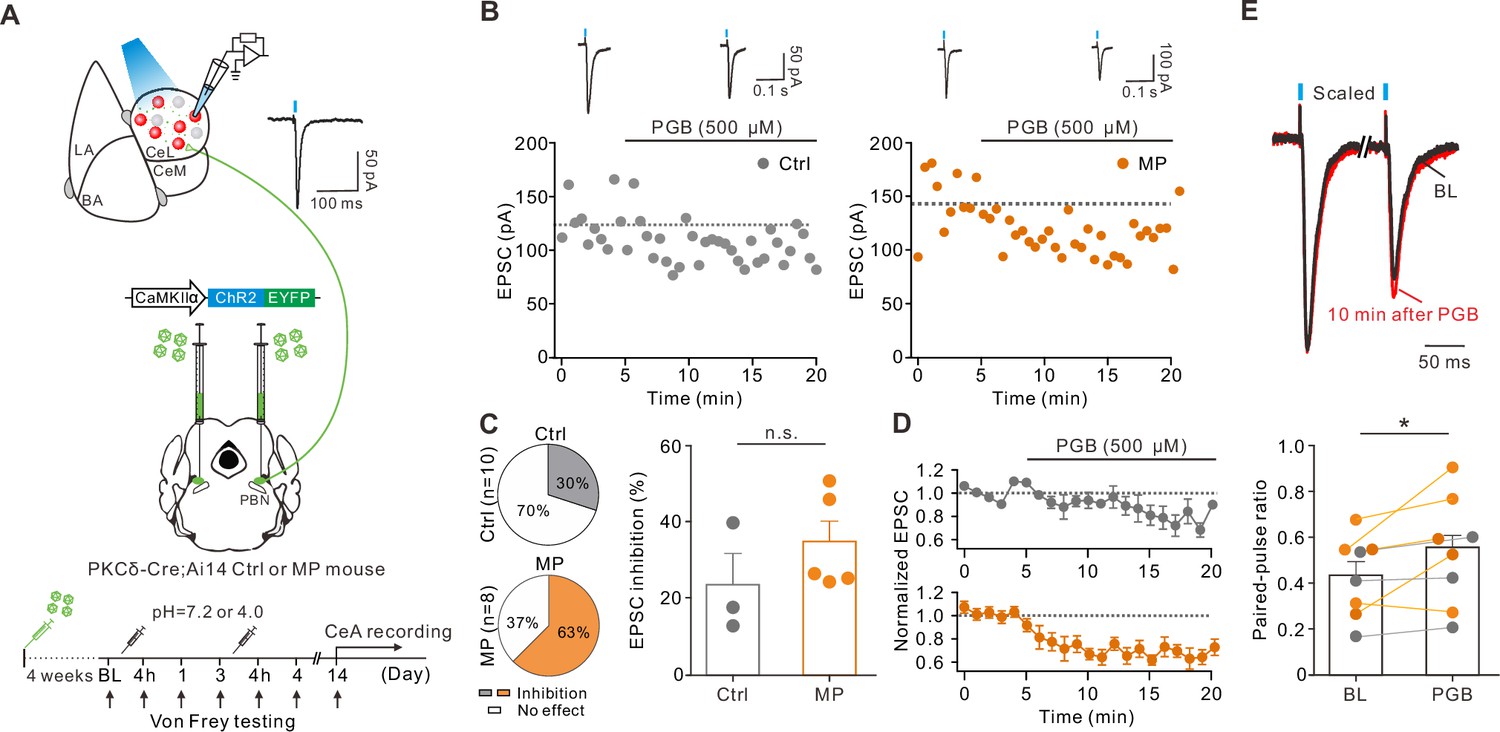
Pregabalin (PGB) suppressed the somatostatin-expressing central nucleus of the amygdala (CeA-SST) neuron excitability and glutamate release from the parabrachial nucleus (PBN) to the CeA-SST neurons.
(A) Experimental schematic and timeline. (B) Left, amplitude of the light-evoked excitatory postsynaptic currents (EPSCs) before and after PGB application of CeA-SST neurons in a representative Ctrl mouse. Right, amplitude of the light-evoked EPSCs before and after PGB application of the CeA-SST neurons in a representative muscle pain (MP) mouse; traces of EPSCs of the cell are shown above. (C) Left, pie chart showing the percentage of inhibition neurons after PGB treatment (Ctrl, 37%, n=8 cells from 5 mice; MP, 63%, n=8 cells from 4 mice; Chi-square test, p=0.317). Right, percentage of EPSC inhibition of PGB-sensitive neurons in the Ctrl and MP groups (Ctrl, 24.9 ± 5.3%, n=3; MP, 30.1 ± 5.5%, n=5; Mann–Whitney test, U=5, n.s., non-significant, p=0.5). (D) Cells with EPSC inhibition >×1 SDBL are pooled and plotted for the normalized EPSCs over time (Ctrl, n=3; MP, n=5). (E) Top, representative EPSC traces before (black) and 10 min after PGB application (red). Average trace after PGB application is normalized to the peak of average EPSC trace during baseline (BL). Paired-pulse interval = 200 ms. Bottom, summary of paired-pulse ratio (PPR) of cells shown in (D) before and after PGB application (BL, 0.58±0.03, n=8; PGB, 0.65±0.04, n=8; gray circle: Ctrl group; orange circle: MP group; Wilcoxon matched-pairs signed rank test, **p=0.008). (F) Left and bottom, experimental schematic and timeline. Right, representative image of CeA-SST neurons labeled with GCaMP6s. Cells with their calcium traces shown in the panel G were labeled. (G) Representative traces from cells of interest (color-matched in the panel F right). (H) The frequency of calcium events for CeA-SST neurons before and after PGB i.p. injection (BL, 0.036±0.003 Hz; PGB, 0.023±0.003 Hz, n=46 cells from three mice; Wilcoxon matched-pairs signed rank test, **p=0.004) and the percentage of ΔF/F before and after PGB i.p. injection (BL, 34.1 ± 2.8%; PGB, 26.4 ± 2.7%, n=46 cells from three mice; Wilcoxon matched-pairs signed rank test, *p=0.045). (I) The area under the curve (AUC) of calcium traces of CeA-SST neurons before and after PGB application. Neurons with ΔAUC < (0.02 a.u./s) were distributed within two dashed lines. Pie chart, the percentage of neuronal responses after PGB treatment (n=46 cells). (J) The heatmaps of normalized calcium activities before and after the PGB treatment. Neurons were grouped based on the classification in (I).
-
Figure 5—source code 1
Related to Figure 5I and J.
- https://cdn.elifesciences.org/articles/78610/elife-78610-fig5-code1-v1.zip
-
Figure 5—source data 1
Numerical data to support the graphs in Figure 5.
- https://cdn.elifesciences.org/articles/78610/elife-78610-fig5-data1-v1.xlsx
Figure 5—figure supplement 1
Effect of pregabalin (PGB) on neurotransmission at the parabrachial nucleus (PBN) to the central nucleus of the amygdala (CeA)-protein kinase C delta-expressing (PKCδ) neuron synapses.
(A) Experimental schematic and timeline. (B) Left, amplitude of light-evoked excitatory postsynaptic currents (EPSCs) before and after PGB application of the CeA-PKCδ neurons in the Ctrl mice. Right, amplitude of light-evoked EPSCs before and after PGB application of the CeA-PKCδ neurons in the muscle pain (MP) mice; traces of EPSCs of the cell are shown above. (C) Left, pie chart showing the percentage of inhibition neurons after PGB treatment (Ctrl, 30%, n=10 cells from five mice; MP, 63%, n=8 cells from four mice; Chi-square test, p=0.1679). Right, percentage of EPSC inhibition of Ctrl and MP groups (Ctrl, 23.5 ± 8.3%, n=3; MP, 34.6 ± 5.7%, n=5; Mann–Whitney test, U=3, n.s., non-significant, p=0.25). (D) Cells with EPSC inhibition >×1 SDBL are pooled and plotted for the normalized EPSCs over time (Ctrl, n=3; MP, n=5). (E) Top, representative EPSC traces before and 10 min after PGB application. Average trace after PGB application is normalized to the peak of average EPSC trace during baseline (BL). Paired-pulse interval = 100 ms. Bottom, summary of paired-pulse ratio (PPR) of cells shown in (D) before and after PGB application (BL, 0.43±0.06, n=8; PGB, 0.53±0.08, n=8; gray circle: Ctrl group; orange circle: MP group; Wilcoxon matched-pairs signed rank test, *p=0.039).
-
Figure 5—figure supplement 1—source data 1
Numerical data to support the graphs in Figure 5—figure supplement 1.
- https://cdn.elifesciences.org/articles/78610/elife-78610-fig5-figsupp1-data1-v1.xlsx
Figure 5—figure supplement 2
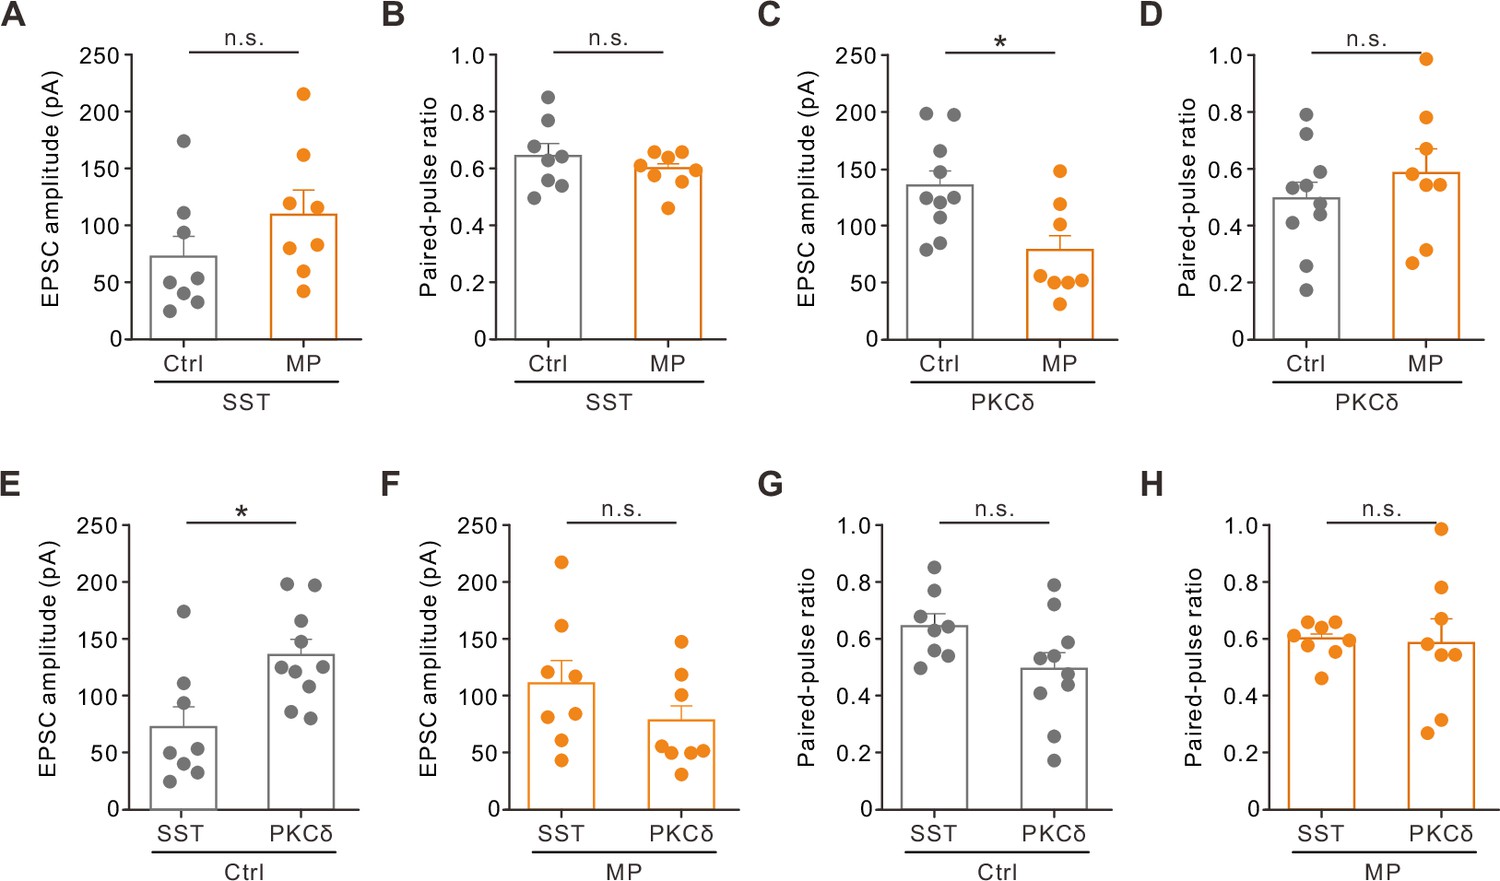
Comparison of light-evoked excitatory postsynaptic current (EPSC) amplitude and paired-pulse ratio (PPR) at the parabrachial nucleus (PBN) to the central nucleus of the amygdala (CeA) neuron synapses.
(A) The amplitude of the light-evoked EPSCs recorded at the PBN-CeA-SST neuron synapses in the Ctrl and muscle pain (MP) groups (Ctrl, 73.9±17.9 pA, n=8; MP, 110.7±20.0 pA, n=8; Mann–Whitney test, U=17, n.s., non-significant, p=0.13). (B) The PPR of the light-evoked EPSCs recorded at the PBN-CeA-SST neuron synapses in the Ctrl and MP groups (Ctrl, 0.65±0.04, n=8; MP, 0.60±0.02, n=8; Mann–Whitney test, U=25, n.s., non-significant, p=0.49). (C) The amplitude of the light-evoked EPSCs recorded at the PBN-CeA-PKCδ neuron synapses in the Ctrl and MP groups (Ctrl, 134.2±13.2 pA, n=10; MP, 75.7±14.5 pA, n=8; Mann–Whitney test, U=12, *p=0.01). (D) The PPR of the light-evoked EPSCs recorded at the PBN-CeA-PKCδ neuron synapses in the Ctrl and MP groups (Ctrl, 0.62±0.06, n=10; MP, 0.52±0.08, n=8; Mann–Whitney test, U=28, n.s., non-significant, p=0.31). (E) The amplitude of the light-evoked EPSCs recorded at the PBN-CeA-PKCδ neuron synapses and PBN-CeA-SST neuron synapses in the Ctrl mice (SST, 73.9±17.9 pA, n=8; PKCδ, 134.2±13.2 pA, n=10; Mann–Whitney test, U=13, *p=0.016). (F) The amplitude of the light-evoked EPSCs recorded at the PBN-CeA-PKCδ neuron synapses and PBN-CeA-SST neuron synapses in the MP mice (SST, 110.7±20.0 pA, n=8; PKCδ, 75.7±14.5 pA, n=8; Mann–Whitney test, U=19, p=0.19). (G) The PPR of the light-evoked EPSCs recorded at the PBN-CeA-PKCδ neuron synapses and PBN-CeA-SST neuron synapses in the Ctrl mice (SST, 0.65±0.04, n=8; PKCδ, 0.62±0.06, n=10; Mann–Whitney test, U=18, n.s., non-significant, p=0.054). (H) The PPR of the light-evoked EPSCs recorded at the PBN-CeA-PKCδ neuron synapses and PBN-CeA-SST neuron synapses in the MP mice (SST, 0.60±0.02, n=8; PKCδ, 0.52±0.08, n=8; Mann–Whitney test, U=28, n.s., non-significant, p=0.7).
-
Figure 5—figure supplement 2—source data 1
Numerical data to support the graphs in Figure 5—figure supplement 2.
- https://cdn.elifesciences.org/articles/78610/elife-78610-fig5-figsupp2-data1-v1.xlsx
Tables
Key resources table
| Reagent type (species) or resource | Designation | Source or reference | Identifiers | Additional information |
|---|---|---|---|---|
| Strain, strain background (mouse, male and female) | Sst tm2.1(cre)Zjh/J | Jackson Laboratory | RRID: IMSR_JAX: 013044 | C57BL/6J genetic background |
| Strain, strain background (mouse, male and female) | Tg(Prkcd-glc-1/CFP,-cre)EH124Gsat/Mmucd | Mutant Mouse Resource and Research Center | RRID: MMRRC_011559-UCD | C57BL/6J genetic background |
| Strain, strain background (mouse, male and female) | B6.Cg-Gt(ROSA)26Sortm14 (CAG-tdTomato)Hze/J | Jackson Laboratory | RRID: IMSR_JAX: 007914 | C57BL/6J genetic background |
| Strain, strain background (mouse, male and female) | C57BL/6JNarl | National Laboratory Animal Center (Taiwan) | RMRC11005 | |
| Antibody | Rabbit anti-RFP (rabbit polyclonal) | Rockland | Cat#: 600-401-379S; RRID: AB_11182807 | 1:300 |
| Antibody | Rabbit anti-PKCδ (rabbit monoclonal) | Abcam | Cat#: ab182126; RRID:AB_2892154 | 1:500 |
| Antibody | Rat anti-SST (rat monoclonal) | Abcam | Cat#: ab30788; RRID:AB_778010 | 1:500 |
| Antibody | Goat anti-rabbit Alexa Fluor 488 (rabbit polyclonal) | Thermo Fisher Scientific | Cat#: A27034; RRID:AB_2536097 | 1:500 |
| Antibody | Goat anti-rabbit Alexa Fluor 594 (rabbit polyclonal) | Thermo Fisher Scientific | Cat#: A-11012; RRID:AB_2534079 | 1:500 |
| Antibody | Goat anti-rat Alexa Fluor 488 (rat polyclonal) | Thermo Fisher Scientific | Cat#: A-11006; RRID:AB_2534074 | 1:500 |
| Recombinant DNA reagent | AAV5-hSyn-DIO-mCherry | Addgene | RRID: Addgene_50459 | |
| Recombinant DNA reagent | AAV5-hSyn-DIO- hM3Dq-mCherry | Addgene | RRID: Addgene_44361 | |
| Recombinant DNA reagent | AAV5-hSyn-DIO-hM4Di-mCherry | Addgene | RRID: Addgene_44362 | |
| Recombinant DNA reagent | AAV5-CaMKIIα-ChR2-eYFP | University of North Carolina Vector Core | N/A | |
| Recombinant DNA reagent | AAV5-Syn-Flex-GCaMP6s-WPRE-SV40 | Addgene | RRID: Addgene_100845 | |
| Chemical compound, drug | MES hydrate | MERCK | M2933 | |
| Chemical compound, drug | Clozapine-N-oxide | MERCK | C0832 | |
| Chemical compound, drug | SR 95531 | Abcam | Ab120042 | |
| Chemical compound, drug | CGP 55845 | Tocris | 1248 | |
| Chemical compound, drug | Kynurenic acid | MERCK | K3375 | |
| Chemical compound, drug | Tetrodotoxin citrate | Tocris | 1069 | |
| Chemical compound, drug | Pregabalin | Pfizer | N/A | |
| Software, algorithm | Tru-scan 2.0 system | Coulbourn instruments | N/A | https://www.coulbourn.com/category_s/262.htm |
| Software, algorithm | EthoVision XT 13 | Noldus Information Technology | RRID:SCR_000441 | https://www.noldus.com/ethovision-xt |
| Software, algorithm | pClamp and Clampfit 10.3 | Molecular Devices | RRID:SCR_011323 | https://www.moleculardevices.com/ |
| Software, algorithm | GraphPad Prism 6 | GraphPad Software | RRID:SCR_002798 | https://www.graphpad.com/ |
| Software, algorithm | MiniAnalysis v6.0.9 | Synaptosoft | RRID:SCR_002184 | http://www.synaptosoft.com/MiniAnalysis/ |
| Software, algorithm | Python | Jupyter notebook | RRID:SCR_008394 | https://jupyter.org/ |
| Software, algorithm | ImageJ (Fiji) | National Institutes of Health (NIH) | RRID:SCR_002285 | https://imagej.net/Fiji/Downloads |
| Software, algorithm | Coreldraw X8 | CorelDRAW | RRID:SCR_014235 | https://www.coreldraw.com/en/?trial-delay=none |
| Software, algorithm | Inscopix data processing v1.6.0 | Inscopix | N/A | https://www.inscopix.com/software-analysis |
| Other | Microsyringe 10 μL | World Precision Instruments | NANOFIL | https://www.wpiinc.com/ |
| Other | 34 G beveled NanoFil needle | World Precision Instruments | NF34BV-2 | https://www.wpiinc.com/ |
| Other | Animal temperature controller | Physitemp Instruments | TCAT-2LV | https://physitemp.com/ |
| Other | Microsyringe pump controller | KD Scientific | KDS310 | https://www.kdscientific.com/ |
| Other | Cryostat | Leica | CM1900; RRID:SCR_020218 | https://www.leicabiosystems.com/zh/ |
| Other | Microslicer | Dosaka | DTK-1000 | http://www.dosaka-em.jp/products/280/ |
| Other | Axopatch 200B patch clamp amplifier | Molecular Devices | Axopatch 200B; RRID:SCR_018866 | https://www.moleculardevices.com/ |
| Other | Digitizer | Molecular Devices | Digidata 1440A; RRID:SCR_021038 | https://www.moleculardevices.com/ |
| Other | Borosilicate glass with filament | Harvard Apparatus | GC150F-7.5 | https://www.warneronline.com/clark-borosilicate-standard-wall-with-filament |
| Other | Cannula | RWD Life Science | Guide cannula: 0.41 mm in diameter and 5 mm long; Dummy cannula: 0.2 mm in diameter and 5.5 mm long | https://www.rwdstco.com/product-item/single-cannula/ |
| Other | ProView integrated lens | Inscopix | Diameter, 0.5 mm; length, 6.1 mm | https://www.inscopix.com/lenses-viruses |
| Other | Miniscope system | Inscopix | nVista 3.0; RRID:SCR_017407 | https://www.inscopix.com/nvista |
Additional files
Download links
A two-part list of links to download the article, or parts of the article, in various formats.
Downloads (link to download the article as PDF)
Open citations (links to open the citations from this article in various online reference manager services)
Cite this article (links to download the citations from this article in formats compatible with various reference manager tools)
Cellular mechanisms underlying central sensitization in a mouse model of chronic muscle pain
eLife 11:e78610.
https://doi.org/10.7554/eLife.78610


