Vaccination decreases the risk of influenza A virus reassortment but not genetic variation in pigs
- College of Veterinary Medicine, University of Minnesota, United States
- Zoetis, United States
Figures
Figure 1
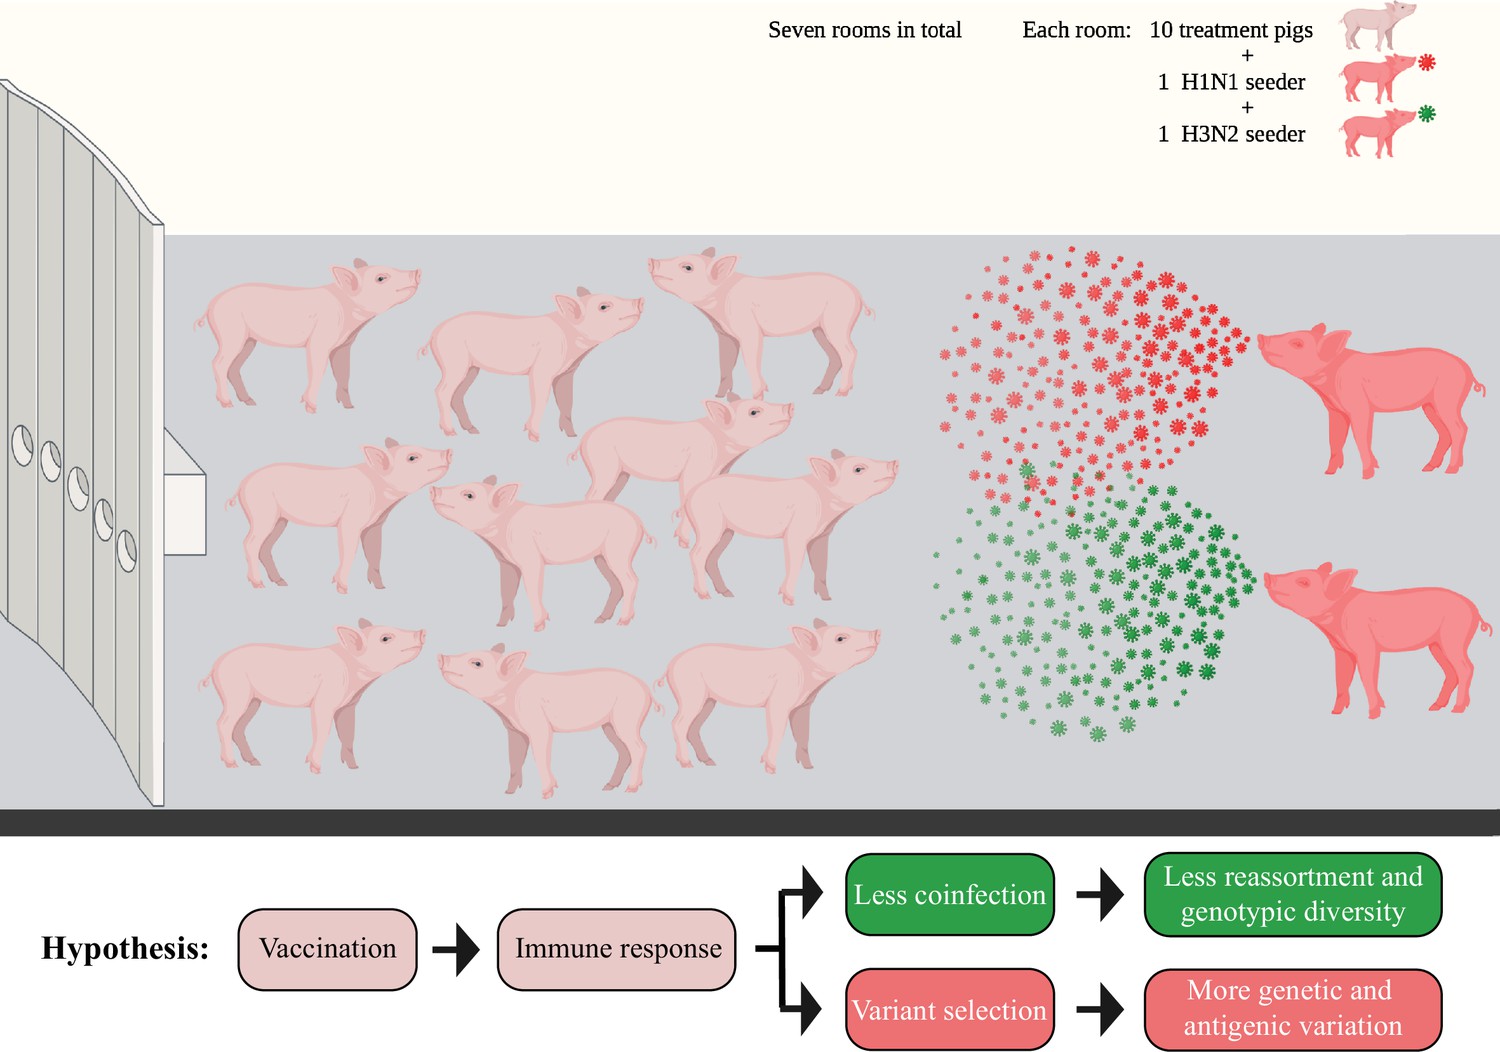
Diagram showing the seeder pig infection model.
Fourteen naïve pigs (seeder pigs) were either challenged using an H1N1 or an H3N2 virus and evenly distributed in pairs into seven rooms at approximately 48 hr post inoculation. Two seeder pigs (one H1N1 seeder and one H3N2 seeder) served as the infection sources and commingled with 10 treatment pigs within each room. The treatment pigs had been vaccinated using different vaccine combinations of a commercial multivalent whole inactivated vaccine (COM), an autogenous multivalent whole inactivated vaccine (AUT), or a bivalent live-attenuated vaccine (LAIV). Bronchoalveolar lavage fluid (BALF) samples from all treatment pigs were collected at necropsy (7 days post contact [DPC] with the seeder pigs). Figure 1 has been adapted from Figure 1 from Li et al., 2020 created by BioRender.com.
Figure 2 with 1 supplement
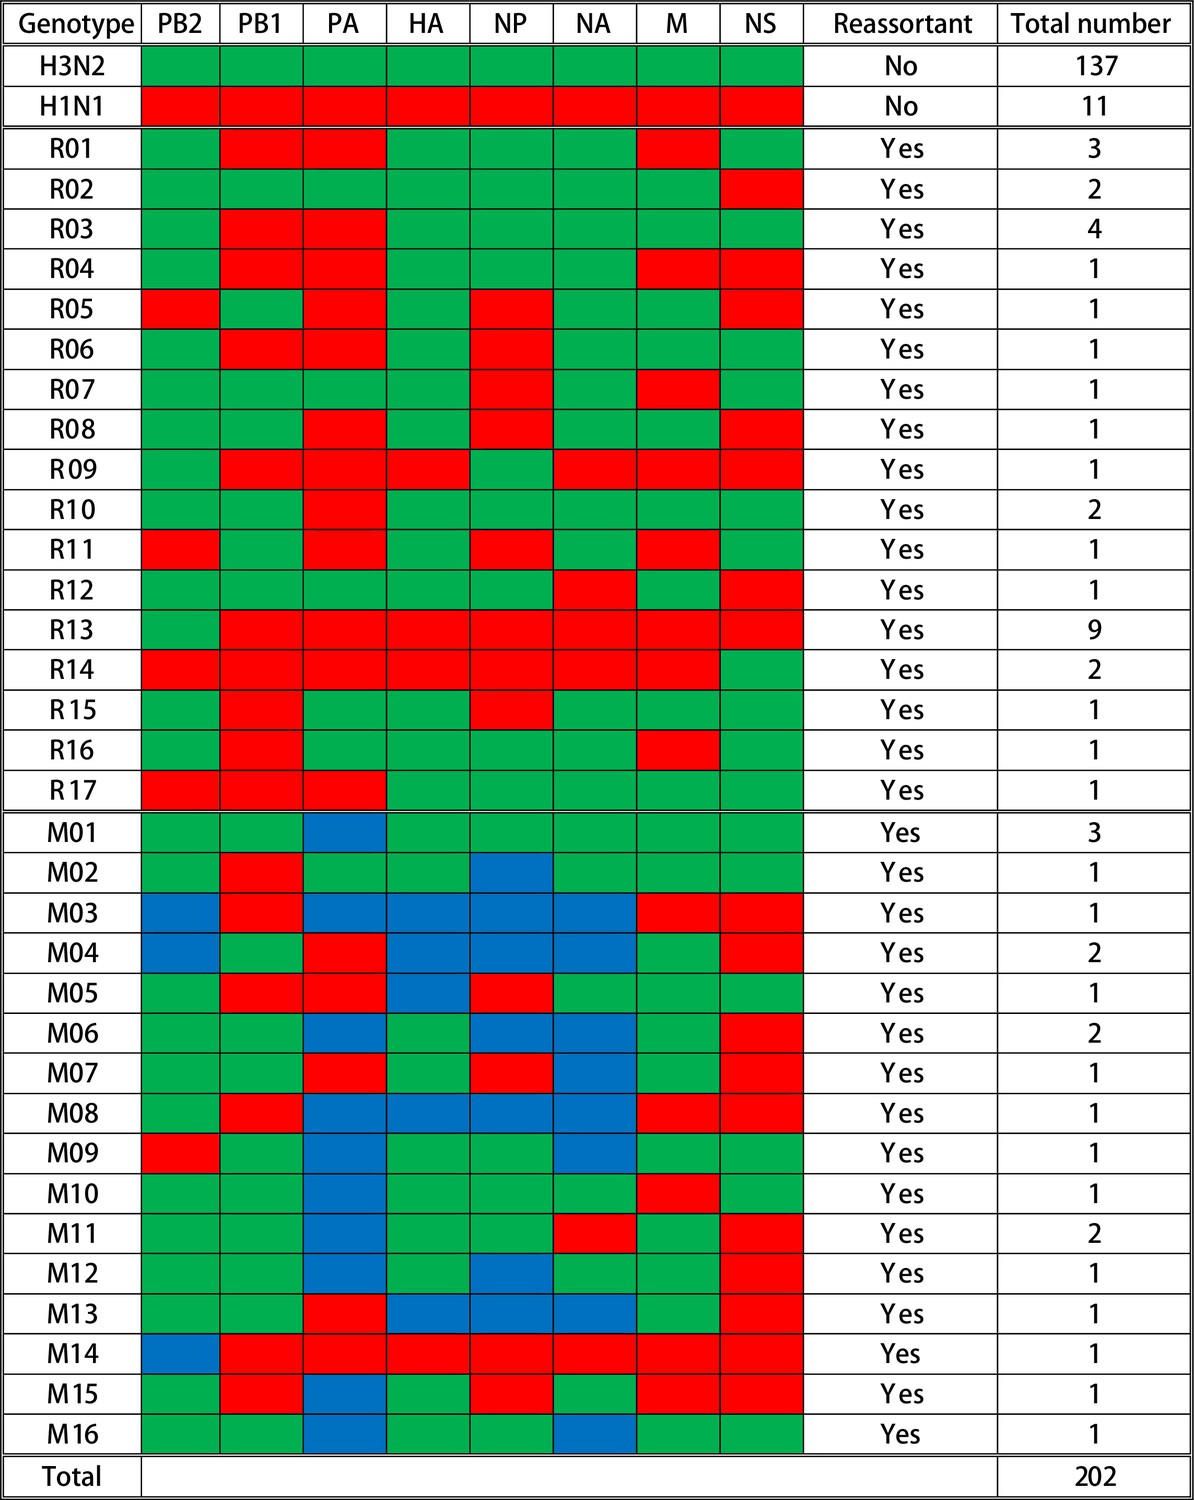
Summary of genotypes detected in the influenza A virus (IAV) plaques.
A total of 202 plaques were whole-genome sequenced and genotyped based on the origins of IAV gene segments in each plaque. Gene segments are shown above the columns. Red blocks represent gene segments that originate from the H1N1 virus; green blocks originate from the H3N2 virus; and blue blocks indicate that complete gene segments were detected from both viruses. The specific genotype number is indicated on the left side of each row, and the quantity of plaques that contain the corresponding gene constellation is shown on the right side of the row. The specific single reassortant genotype number is named after R, and the M-number indicates the specific mixed reassortant genotype number. The quantity and genotypes of influenza plaques isolated from each individual pig are displayed in Figure 2—figure supplement 1. The maximum likelihood trees and the assembled nucleotide sequences of isolated plaques used for constructing the trees can be found in Figure 2—source data 1 and Figure 2—source data 2, respectively.
-
Figure 2—source data 1
Phylogenetic analysis of influenza plaques isolated from pigs with various vaccination statuses.
Phylogenetic trees of eight influenza A virus (IAV) genes from viral plaque isolates were constructed using the maximum likelihood method with 1000 bootstraps and best-fitted nucleotide substitution model. The color of leaf nodes indicates the genetic origin of the IAV segments. The red and green taxa represent the sequences are derived from the H1N1 and H3N2 challenge viruses, respectively. The blue taxa are sequences that originated from the mixed genotype plaques. The genomes of H1N1 and H3N2 challenge viruses are displayed as pink taxa, and the other reference sequences are shown as black taxa. The bootstrap values are proportionally displayed by the circle size of the tree nodes.
- https://cdn.elifesciences.org/articles/78618/elife-78618-fig2-data1-v1.pdf
-
Figure 2—source data 2
Influenza consensus nucleotide sequences from isolated plaques.
- https://cdn.elifesciences.org/articles/78618/elife-78618-fig2-data2-v1.zip
-
Figure 2—source data 3
Source file for Figure 2.
- https://cdn.elifesciences.org/articles/78618/elife-78618-fig2-data3-v1.docx
Figure 2—figure supplement 1
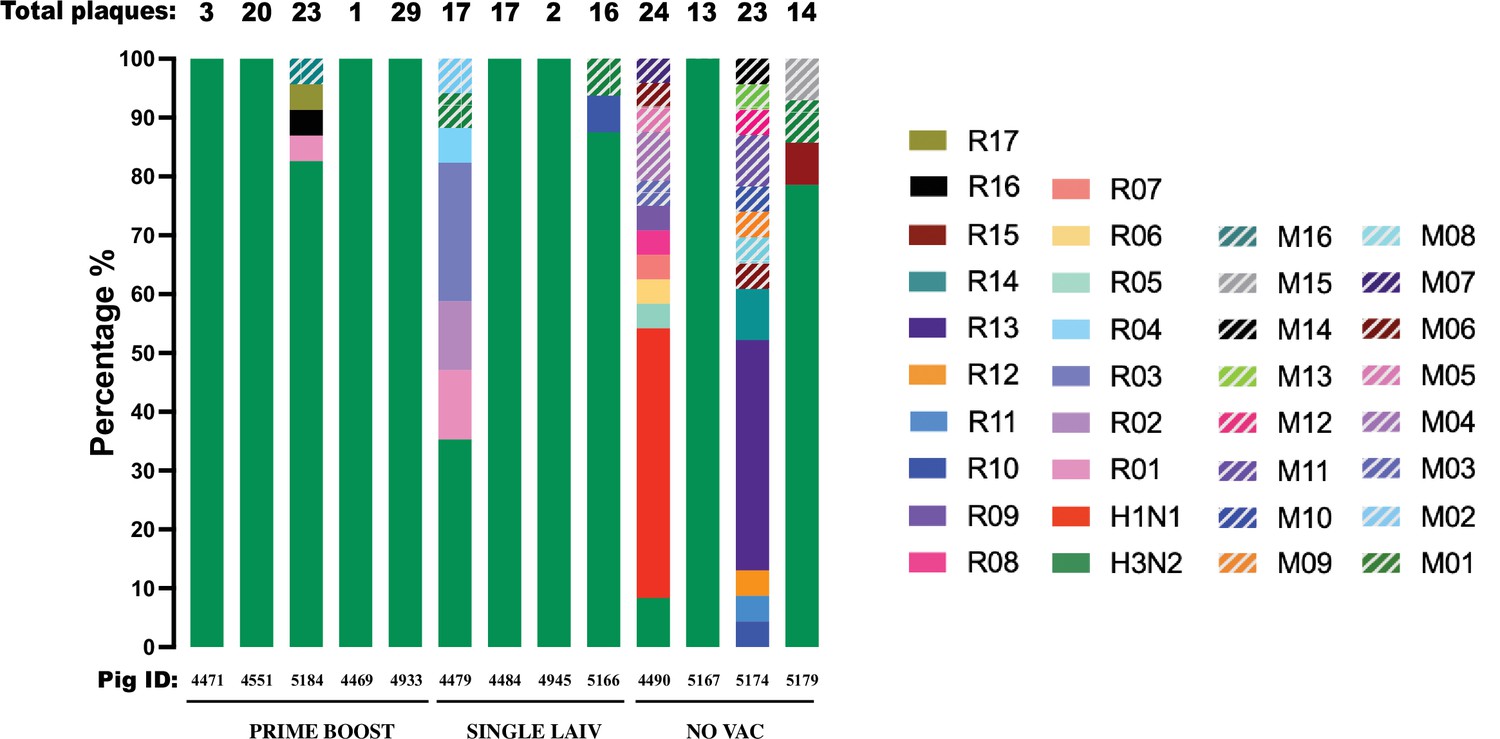
Percentage of reassortant plaques by genotype detected in individual pigs.
Each reassortant genotype is shown in a different color except for red and green that show the H1N1 and H3N2 genotypes from the challenge viruses. The number of plaques isolated from individual pigs is displayed above the bar, and the corresponding pig IDs and treatment groups are indicated below the bar.
Figure 3

Emergence of reassortant influenza A viruses (IAV) is correlated with the number of days that pigs are co-infected with H1 and H3 viruses.
(A) Percentage of reassortant plaques in pigs by genotype and treatment groups. Each genotype is shown in a different color. The total number of plaques for each group is shown above each bar, and the quantity of available bronchoalveolar lavage fluid (BALF) samples for each group (n) is indicated under the treatment names. Both plaques with single (R01–R17) and mixed (M01–M16) genotypes were considered as reassortant viruses. To account for the unequal number of plaques and pigs from different treatment groups, we compared the proportion of IAV reassortants by the binomial logistic regression model, allowing for overdispersion, and tested all pairwise differences between treatments using the chi-squared deviance test, and adjusted the p-values by Bonferroni–Holm method for multiple comparisons. p-value<0.05 was considered significant. (B) Correlation between the proportion of reassortant viruses and the number of days pigs were co-infected with H1 and H3 challenge viruses. The number in the dot represents the number of overlapping points plotted for pigs that had the same proportion of reassortants and co-infection day, and the total number of samples available for this analysis is indicated (n). The number of days pigs were co-infected is shown in Figure 3—source data 1, which is defined as the number of days when both H1 and H3 IAV were detected in the nasal cavities or lungs by a hemagglutinin (HA) subtype-specific multiplex rRT-PCR. Spearman’s rank-order correlation test evaluated the direction and intensity of the correlation between the proportion of reassortant viruses and the number of days pigs were co-infected.
-
Figure 3—source data 1
Infection dynamics of H1N1 and H3N2 challenge viruses assessed by subtype specific rRT-PCR in nasal swabs and bronchoalveolar lavage fluid (BALF) samples.
- https://cdn.elifesciences.org/articles/78618/elife-78618-fig3-data1-v1.docx
Figure 4 with 3 supplements
Summary of single-nucleotide variant (SNV) frequency and hemagglutinin (HA) nucleotide variations of H1N1 and H3N2 virus within pigs from different vaccination statuses.
The frequency distribution of the H1N1 (A) and H3N2 (E) SNVs in pigs regardless of treatment groups. The quantity of SNVs at a given frequency interval (bin width = 0.05) is presented by a stacked histogram based on the mutation types. The SNVs with frequencies above 0.5 were considered as consensus variants. Antigenic variant identification from the total detected H1(B) and H3 (F) SNVs. The HA SNVs are shaped by their mutation types and colored based on whether they fell into the H1 antigenic regions (including the Sa, Sb, Ca1, Ca2, and Cb regions) (Brownlee and Fodor, 2001; Caton et al., 1982) or H3 antigenic regions (including the A, B, C, D, and E regions) (Debbink et al., 2017; Lee and Chen, 2004; Wiley et al., 1981). The Spearman correlation between H1-specific HI titer (C) or H1-specific IFN-γ-secreting cell counts (D) with the H1 nucleotide divergence identified in individual pigs was calculated. The same statistics were also computed for H3 viruses between the H3-specific HI titer (G) or H3-specific IFN-γ-secreting cell counts (H) with the H3 nucleotide divergence identified in individual pigs. HA nucleotide divergence was calculated by summing the frequencies of all the HA SNVs identified in each sample. The HI titers of any individual pigs below the detection limit (1:10) are shown as 1:5. The number in specific dots represents the quantity of overlapping points plotted for pigs that had the same numbers for both variables, and the total quantity of available samples for this analysis is indicated as ‘n.’ All the within-host IAV nucleotide polymorphisms present in at least 1% of H1N1 and H3N2 sequencing reads from BALF samples are shown in Figure 4—figure supplement 1. The detailed information of identified H1N1 and H3N2 SNVs is displayed in Figure 4—source data 1 and Figure 4—source data 2, respectively. The nonsynonymous SNVs that were identified at functional sites in pigs from different groups were summarized in Figure 4—figure supplement 2. The detailed results of permutation test on shared amino acid polymorphic sites in the 70 and 100% genome of H1N1 and H3N2 influenza A viruses (IAVs) can be found in Figure 4—figure supplement 3.
-
Figure 4—source data 1
Summarized information of H1N1 single-nucleotide variants (SNVs) identified in vaccinated and unvaccinated pigs.
- https://cdn.elifesciences.org/articles/78618/elife-78618-fig4-data1-v1.xls
-
Figure 4—source data 2
Summarized information of H3N2 single-nucleotide variants (SNVs) identified in vaccinated and unvaccinated pigs.
- https://cdn.elifesciences.org/articles/78618/elife-78618-fig4-data2-v1.xls
Figure 4—figure supplement 1
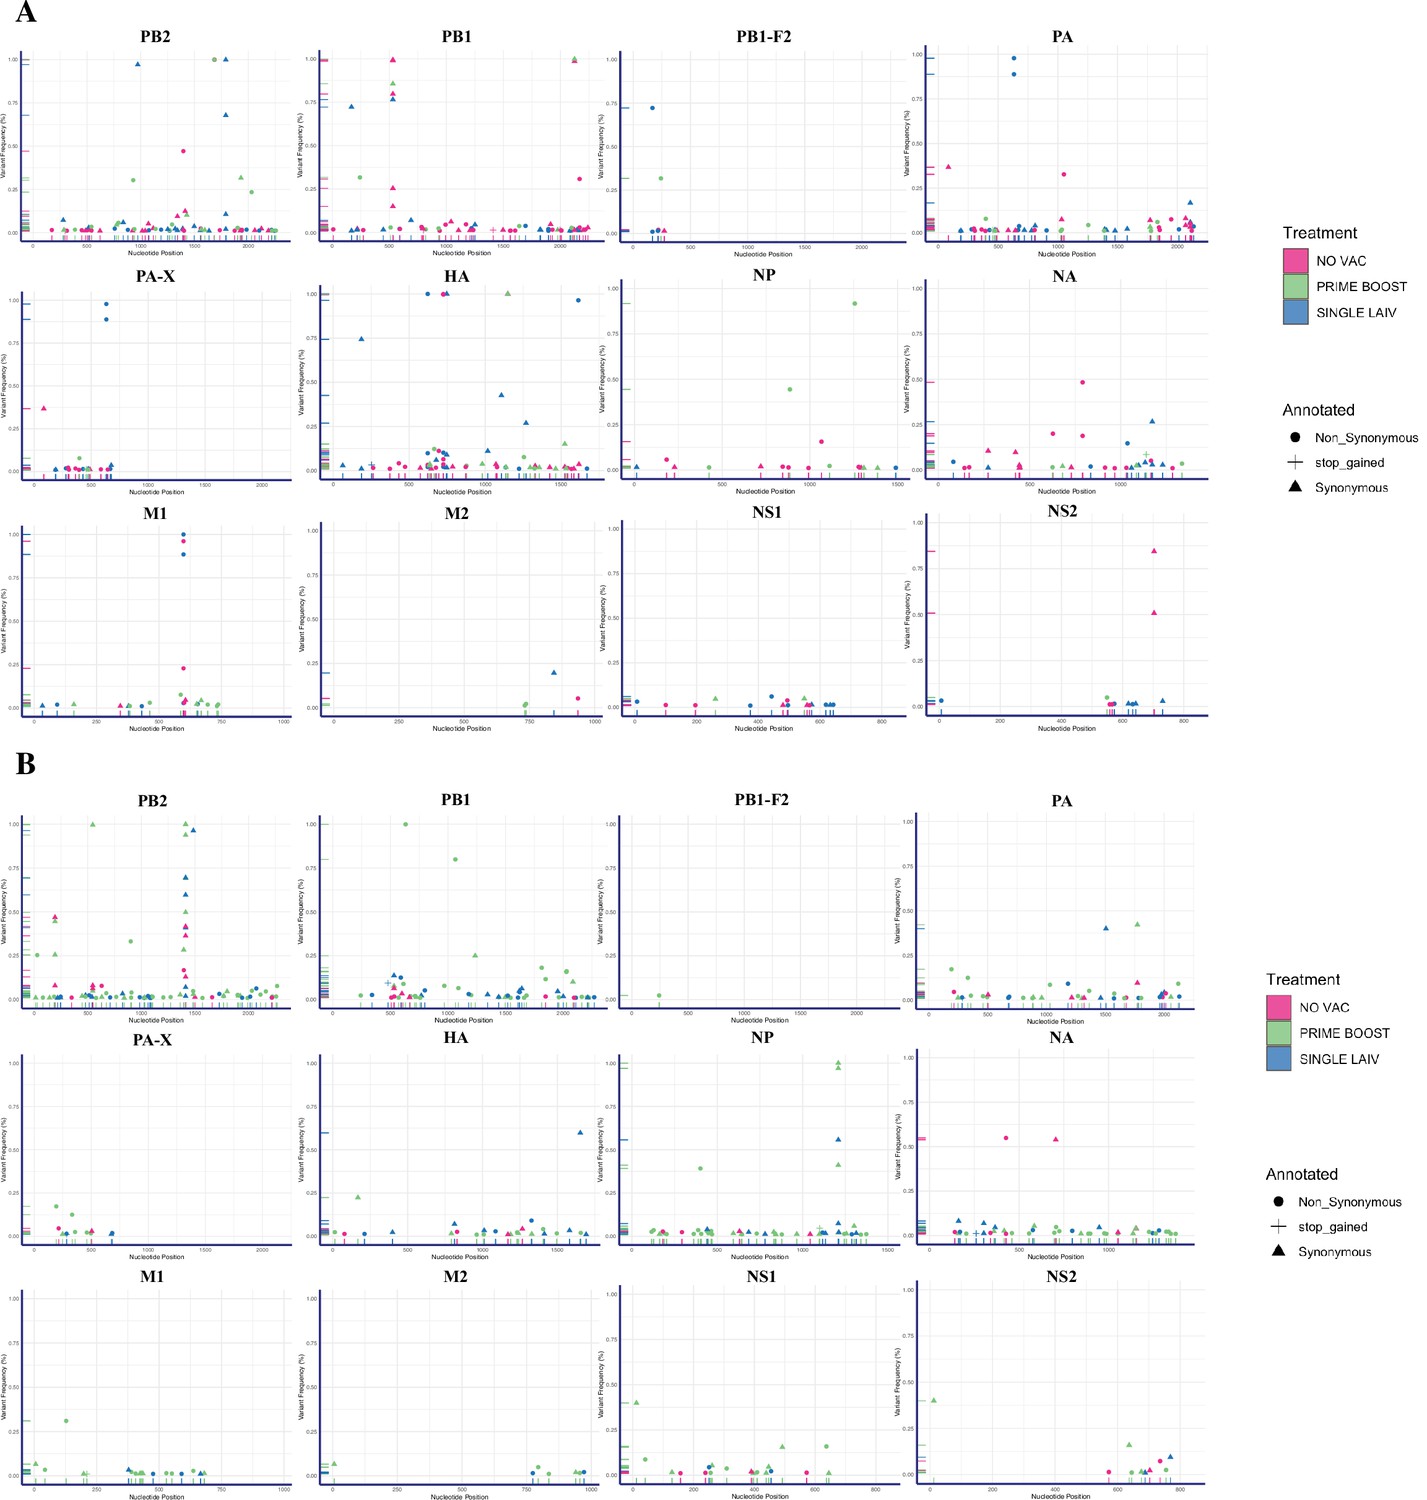
Single-nucleotide variants (SNVs) of H1N1 and H3N2 viruses identified within pigs from different vaccination statuses.
Summary of identified nucleotide polymorphisms of H1N1 (A) and H3N2 (B) virus in bronchoalveolar lavage fluid (BALF) samples from PRIME BOOST (light green), SINGLE LAIV (blue), and NO VAC (pink) pigs. Each unique SNV was annotated in either synonymous (triangle), nonsynonymous (circle), or stop-gained (cross) mutation. The x-axis represents the nucleotide site where the SNV was placed, and the y-axis represents the frequency of the SNV within the virus population.
Figure 4—figure supplement 2
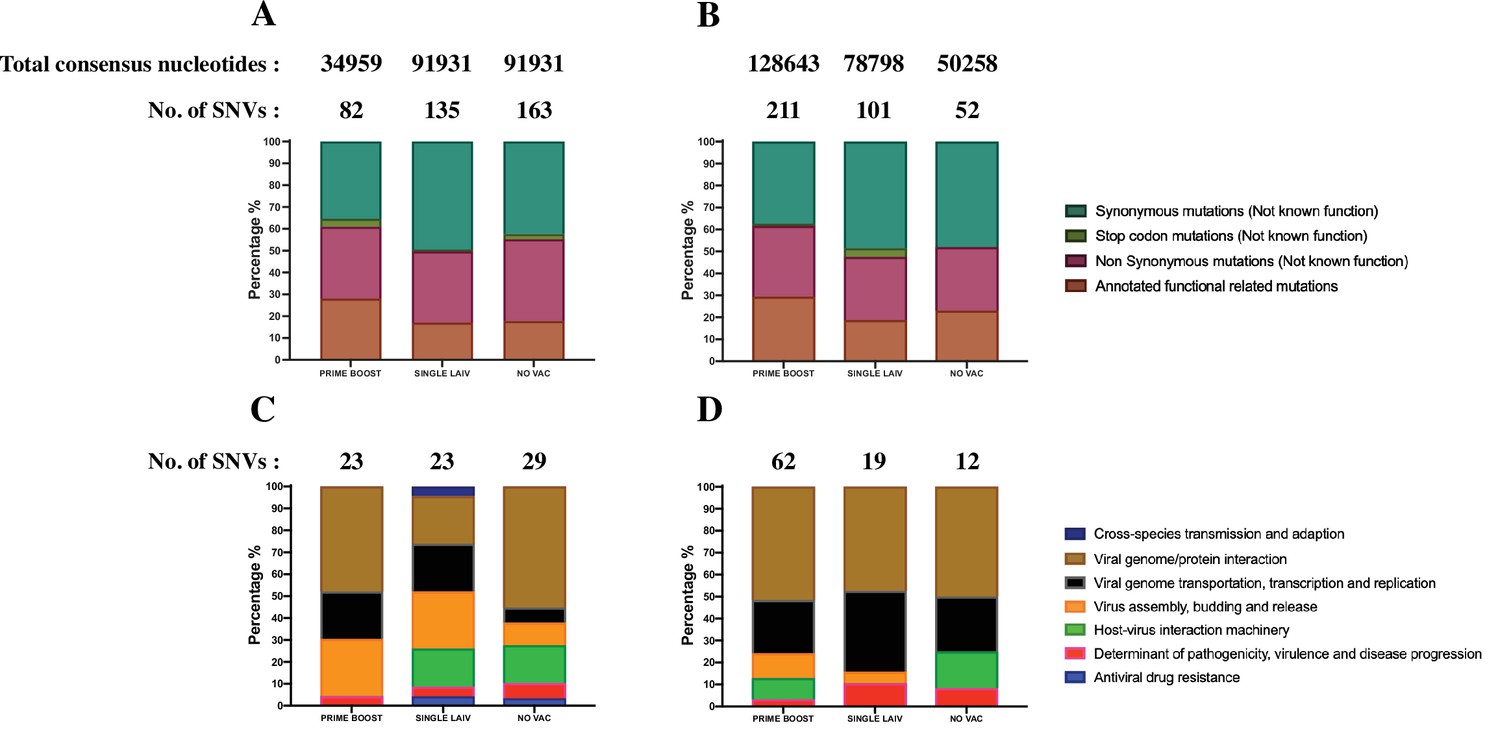
Detection of amino acid changes at functional sites.
The percentage of annotated functional associated single-nucleotide variants (SNVs) from the total identified SNVs in H1N1 (A) and H3N2 (B) virus. The number of identified SNVs and the total number of consensus nucleotides where these SNVs were called by treatment groups are shown above the bars. Only the nonsynonymous mutations in our data were queried against the database of Sequence Feature Variant Types tool in the Influenza Research Database. Phenotypic summary of annotated functional-related mutations in H1N1 (C) and H3N2 (D) virus. The quantity of annotated functional-related mutations detected in pigs by treatment group is shown above each bar, and the mutations are colored based on their putative phenotypic effect on the virus.
Figure 4—figure supplement 3
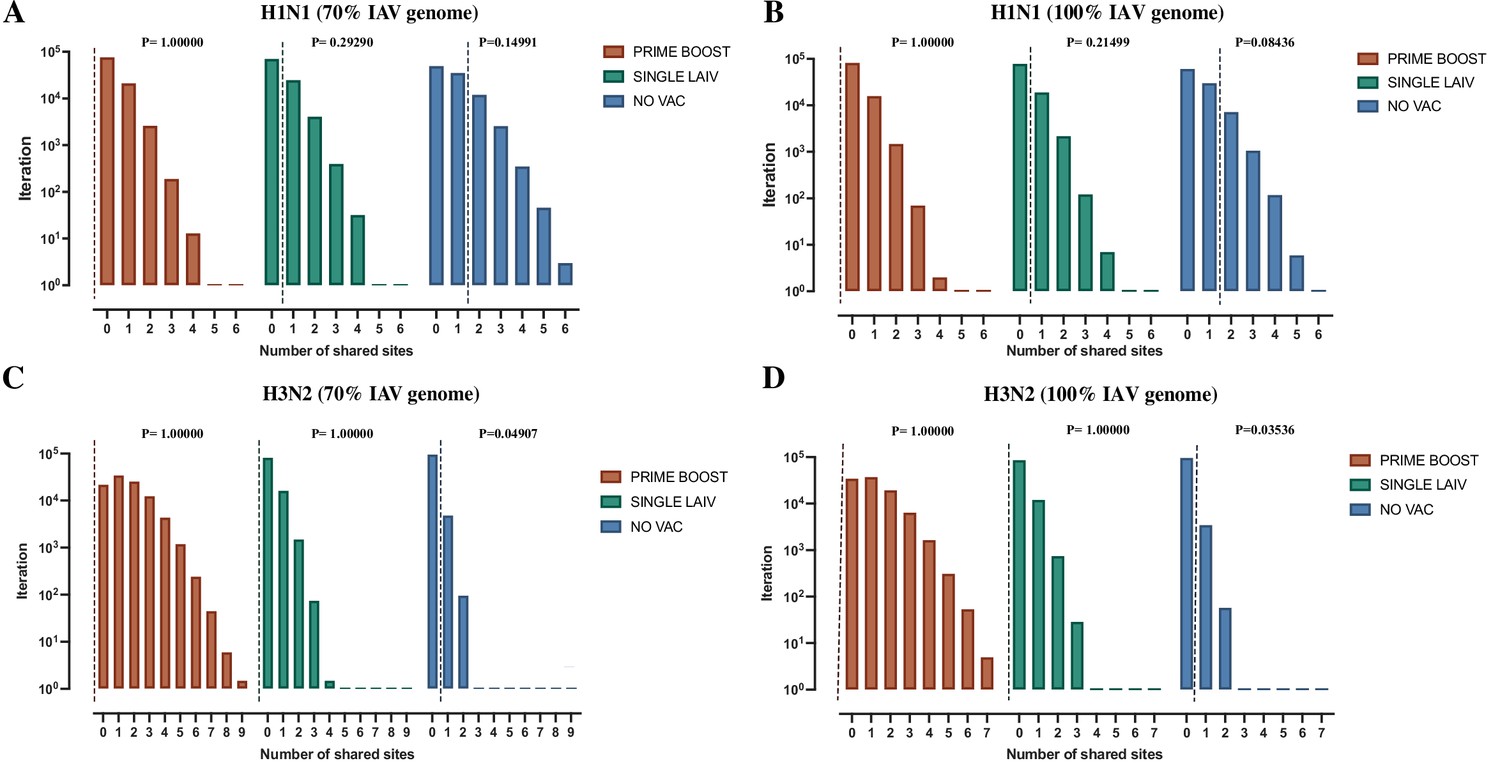
Shared amino acid polymorphisms sites in H1N1 and H3N2 influenza A viruses (IAVs).
The permutation test of shared amino acid polymorphisms in 70% H1N1 (A) and H3N2 (C) IAV genome in pigs is shown by treatment groups. The x-axis indicates the number of shared polymorphic sites present in at least two samples collected from multiple rooms within the same treatment group. The y-axis indicates the number of iterations that have given number of shared polymorphic sites within each treatment group. The dashed lines represent the actual number of shared amino acid polymorphic sites observed in our data from H1N1 or H3N2 viruses in bronchoalveolar lavage fluid (BALF) samples from each group. The same processes of permutation tests on shared amino acid polymorphism sites are also run on the entire genomes of H1N1 (B) and H3N2 (D) IAVs.
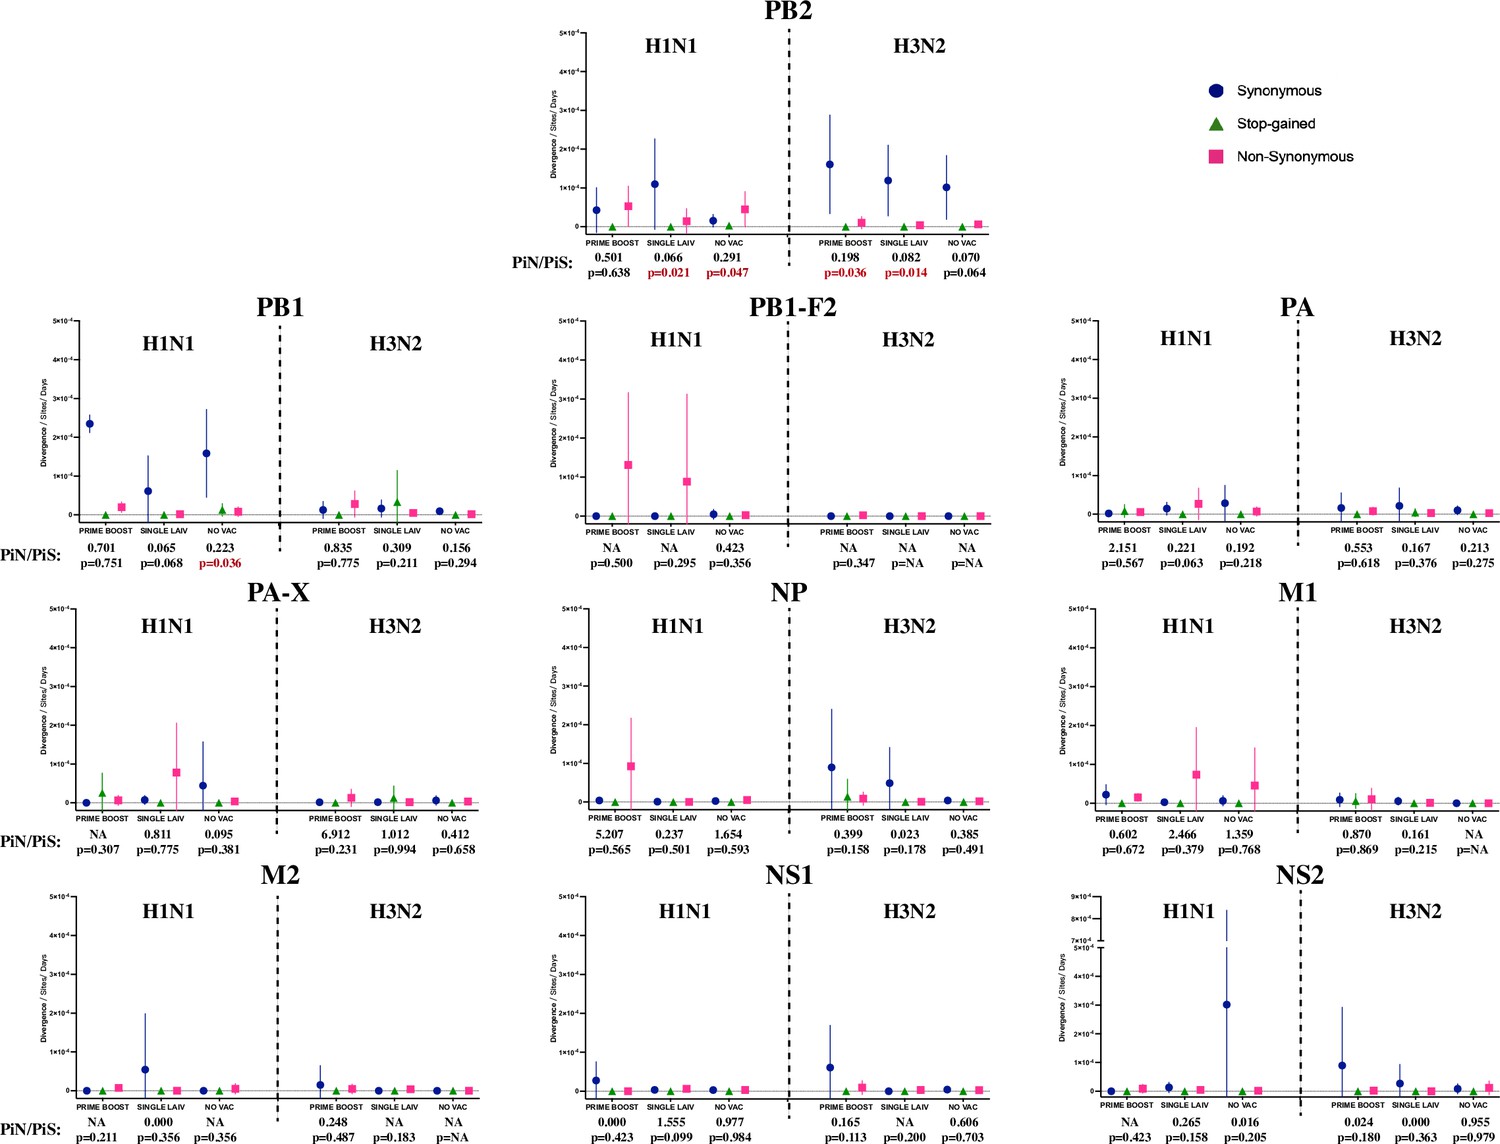
Figure 5 with 1 supplement

Within-host nucleotide diversity and evolutionary rate of H1N1 and H3N2 influenza A virus (IAV) by coding regions.
(A) Nucleotide diversity (Pi) was computed for each coding region of H1N1 and H3N2 viruses for each treatment group. The nucleotide diversity is shown as mean with standard error for PRIME BOOST (brown), SINGLE LAIV (dark green), and NO VAC (dark blue) pigs. The statistical results are noted (*p<0.05) if the nucleotide diversity of any coding region differed significantly between treatment groups, which were compared by Kruskal–Wallis rank-sum test; the Dunn’s test was used for the multiple pairwise comparisons with Benjamini–Hochberg correction. The standard errors were calculated through 10,000 bootstrap resampling with the replacement. (B) The evolutionary rates were calculated separately for H1N1 and H3N2 viruses at synonymous (dark blue circle), nonsynonymous (pink square), and stop-gained (green triangle) sites for each sample on antigenic proteins and whole-genome level. The evolutionary rates are displayed as means with standard deviations and compared by Kruskal–Wallis rank-sum test, followed with the Dunn’s test for the multiple pairwise comparisons; the p-values were corrected by the Benjamini–Hochberg method. The statistical results are noted (*p<0.05) if the evolutionary rate of any coding region and mutational type was significantly different between pigs from any two groups. The nonsynonymous (piN) or synonymous (PiS) nucleotide diversity is the average number of pairwise nonsynonymous or synonymous polymorphism/diversity per nonsynonymous or synonymous site and computed for each coding region and sample by treatment groups. The paired t-test was used to test the null hypothesis that piN = piS, and the significant results (p<0.05) are marked in red font. The p-values are assigned as ‘NA’ if no SNVs were identified in a given coding region in any groups or the number of available samples was not enough to perform the statistical analysis, and the ratios of piN to piS (piN/piS) are displayed as ‘NA’ if there was no synonymous single-nucleotide variant (SNV) found in that coding region for pigs in any treatment groups. The piN/piS = 0 indicates no nonsynonymous SNVs were identified in any coding region from pigs in any treatment groups. The number of samples/sequences used to calculated the nucleotide diversity and evolutionary rates for each H1N1 and H3N2 coding region from different groups can be found in Table 2 and Table 3, respectively. Figure 5—figure supplement 1 shows the evolutionary rates and ratios of nonsynonymous to synonymous nucleotide diversity on protein products from H1N1 and H3N2 internal genes. The detailed values of PiN and PiS for H1N1 and H3N2 viruses by treatment groups and coding regions can be found in Figure 5—source data 1.
-
Figure 5—source data 1
Values of nonsynonymous (PiN) and synonymous (PiS) nucleotide diversity in H1N1 and H3N2 challenge viruses by coding regions and treatment groups.
- https://cdn.elifesciences.org/articles/78618/elife-78618-fig5-data1-v1.docx
Figure 5—figure supplement 1
The evolutionary rate and ratio of nonsynonymous to synonymous nucleotide diversity (PiN/PiS) of H1N1 and H3N2 influenza A virus (IAV) on coding regions located in internal genes.
Figure settings and statistical analysis are the same as in Figure 5B.
Author response image 1
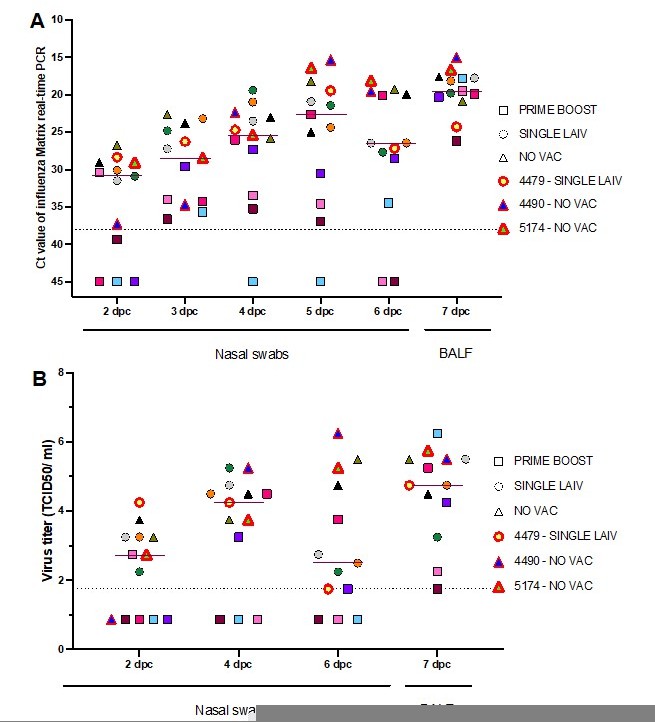
Dynamics of overall influenza shedding in pigs that were part of the reassortant analysis.
The quantity of virus shedding in nasal swabs and BALF samples were measured by influenza matrix gene real-time PCR (A) and virus titrations (B). The individual pigs are represented by different colors and their treatment groups are shown in different shapes. The dark red line indicates the median virus quantity shed by 13 analyzed pigs at each time point. The three super-reassortant pigs are labeled with the red symbol borders and also presented in the figure legends.
Tables
Table 1
Number of bronchoalveolar lavage fluid (BALF) samples available for direct sequencing or plaque purification from each group.
| Group | Vaccination | No. samples sequenced/ total | Average Ct value (range) | Average coverage on H1N1 consensus genome (SD ) * | Average coverage on H3N2 consensus genome (SD) | No. samples assayed to obtain purified plaques/total † | ||
|---|---|---|---|---|---|---|---|---|
| Vaccination protocol ‡ | Prime | Boost | ||||||
| PRIME BOOST | COM/COM | COM | COM | 5/10 pigs | 22.47 (17.83–27.58) | 8397 (722) | 12,897 (1329) | 3/4 pigs |
| AUT/AUT | AUT | AUT | 1/10 pigs | 26.12 (NA ) | 3192 (NA) | 7769 (NA) | 0/4 pigs | |
| COM/AUT | COM | AUT | 2/10 pigs | 31.10 (30.88–31.31) | 18,267 (NA) | 5784 (6318) | 0/4 pigs | |
| LAIV/COM | LAIV | COM | 4/10 pigs | 26.74 (20.30–30.63) | 415 (NA) | 18,209 (12333) | 2/5 pigs | |
| In total | 12/40 pigs | 25.64 (17.83–31.31) | 7733 (6829) | 13,069 (8611) | 5/17 pigs | |||
| SINGLE LAIV | LAIV/NONE | LAIV | Saline | 9/10 pigs | 22.84 (17.76–29.84) | 9322 (4090) | 9009 (5513) | 4/5 pigs |
| NO VAC | NO VAC/CHA | Saline | Saline | 7/10 pigs | 21.17 (14.97–27.73) | 7699 (4406) | 9775 (1057) | 4/4 pigs |
| In total | 28/60 pigs | 23.62 (14.97–31.31) | 8306 (4801) | 11,281 (6972) | 13/26 pigs | |||
-
Ct, cycle threshold; NA, not applicable; SD, standard deviation.
-
*
The genome coverage was computed as the mean depth of the trimmed gene reads covered on the sequenced influenza (IAV) genomes across all sequenced samples. The gene segments whose coverage was below 100 reads were discarded for coverage calculation and SNV identification.
-
†
The samples that yield the purified IAV plaques were also directly sequenced by the next-generation sequencing platform.
-
‡
The vaccines used in this study include a commercial multivalent whole inactivated vaccine (COM), an autogenous multivalent whole inactivated vaccine (AUT), or a bivalent live-attenuated vaccine (LAIV).
Table 2
Average number and frequency of single-nucleotide variants (SNVs) detected on H1N1 sequences of bronchoalveolar lavage fluid (BALF) samples by coding region for each gene segment and treatment groups.
| Segment | PRIME BOOST (n = 12)* | SINGLE LAIV (n = 9) | NO VAC (n = 7) | ||||||
|---|---|---|---|---|---|---|---|---|---|
| No. of sequences† | Mean no. of SNV (SD) | Mean SNV frequency (SD) | No. of sequences | Mean no. of SNV (SD) | Mean SNV frequency (SD) | No. of sequences | Mean no. of SNV (SD) | Mean SNV frequency (SD) | |
| PB2 | 3 | 6.7 (4.0) | 0.117 (0.229) | 7 | 3.7 (2.6) | 0.162 (0.331) | 7 | 4.3 (4.9) | 0.135 (0.305) |
| PB1 | 2 | 4.5 (0.7) | 0.258 (0.393) | 7 | 2.7 (2.5) | 0.097 (0.228) | 7 | 5.3 (3.7) | 0.138 (0.292) |
| PB1-F2 | 2 | 0.5 (0.7) | 0.317 (NA) | 7 | 0.4 (0.5) | 0.249 (0.410) | 7 | 0.3 (0.8) | 0.018 (0.005) |
| PA | 4 | 2.5 (1.7) | 0.029 (0.024) | 7 | 3.0 (3.1) | 0.115 (0.274) | 7 | 2.9 (1.8) | 0.064 (0.100) |
| PA-X | 4 | 0.8 (1.0) | 0.035 (0.038) | 7 | 1.3 (1.1) | 0.221 (0.404) | 7 | 1.1 (1.3) | 0.058 (0.125) |
| HA | 3 | 4.7 (6.4) | 0.113 (0.259) | 7 | 3.0 (2.7) | 0.287 (0.390) | 7 | 3.6 (4.0) | 0.145 (0.323) |
| NP | 2 | 3.0 (1.4) | 0.236 (0.375) | 7 | 0.3 (0.5) | 0.014 (0.002) | 7 | 1.3 (1.4) | 0.035 (0.047) |
| NA | 1 | 5.0 (NA) | 0.036 (0.028) | 7 | 1.6 (1.1) | 0.059 (0.079) | 7 | 2.3 (2.7) | 0.079 (0.125) |
| M1 | 3 | 3.0 (1.0) | 0.029 (0.020) | 7 | 1.1 (1.3) | 0.249 (0.429) | 7 | 0.7 (1.1) | 0.256 (0.406) |
| M2 | 3 | 0.7 (0.6) | 0.017 (0.006) | 7 | 0.1 (0.4) | 0.196 (NA) | 7 | 0.1 (0.4) | 0.052 (NA) |
| NS1 | 3 | 0.7 (1.2) | 0.048 (0.001) | 7 | 1.1 (1.2) | 0.022 (0.017) | 7 | 0.9 (1.2) | 0.017 (0.011) |
| NS2 | 3 | 0.3 (0.6) | 0.049 (NA) | 7 | 0.9 (1.2) | 0.020 (0.008) | 7 | 0.6 (0.5) | 0.344 (0.407) |
-
SD, standard deviation; LAIV, live-attenuated influenza virus; VAC, vaccination; IAV, influenza A virus.
-
*
‘n’ represents the number of BALF samples successfully sequenced by Illumina in each of the treatment groups.
-
†
The ‘No. of sequences’ columns represent the number of sequences from H1N1 IAVs for any given gene product from the total available samples (n) within each treatment group.
Table 3
Average number and frequency of single-nucleotide variants (SNVs) detected on H3N2 sequences of bronchoalveolar lavage fluid (BALF) samples by coding regions and treatment groups.
| Segment | PRIME BOOST (n = 12)* | SINGLE LAIV (n = 9) | NO VAC (n = 7) | ||||||
|---|---|---|---|---|---|---|---|---|---|
| No. of sequences† | Mean no. of SNV (SD) | Mean SNV frequency (SD) | No. of sequences | Mean no. of SNV (SD) | Mean SNV frequency (SD) | No. of sequences | Mean no. of SNV (SD) | Mean SNV frequency (SD) | |
| PB2 | 10 | 4.9 (3.8) | 0.155 (0.287) | 6 | 4.0 (2.9) | 0.130 (0.259) | 4 | 3.3 (0.5) | 0.147 (0.162) |
| PB1 | 9 | 3.1 (2.7) | 0.119 (0.231) | 6 | 3.2 (3.8) | 0.044 (0.038) | 3 | 2.3 (1.2) | 0.024 (0.019) |
| PB1-F2 | 9 | 0.1 (0.3) | 0.024 (NA) | 6 | 0.0 (0.0) | 0.000 (0.000) | 3 | 0.0 (0.0) | 0.000 (0.000) |
| PA | 8 | 2.5 (2.7) | 0.060 (0.096) | 6 | 2.2 (1.8) | 0.054 (0.106) | 4 | 2.0 (0.8) | 0.033 (0.028) |
| PA-X | 8 | 0.8 (0.9) | 0.063 (0.069) | 6 | 0.7 (1.2) | 0.015 (0.003) | 4 | 0.5 (0.6) | 0.038 (0.011) |
| HA | 10 | 1.2 (1.2) | 0.036 (0.060) | 6 | 1.7 (0.8) | 0.092 (0.179) | 4 | 1.0 (0.0) | 0.024 (0.015) |
| NP | 11 | 3.0 (3.1) | 0.102 (0.246) | 6 | 1.7 (1.2) | 0.080 (0.169) | 4 | 1.0 (0.8) | 0.023 (0.008) |
| NA | 11 | 2.3 (1.9) | 0.019 (0.012) | 6 | 1.8 (1.7) | 0.035 (0.023) | 4 | 1.8 (1.5) | 0.170 (0.256) |
| M1 | 11 | 1.3 (1.7) | 0.041 (0.079) | 6 | 0.7 (1.2) | 0.017 (0.011) | 4 | 0.0 (0.0) | 0.000 (0.000) |
| M2 | 11 | 0.5 (0.8) | 0.032 (0.024) | 6 | 0.3 (0.5) | 0.018 (0.004) | 4 | 0.0 (0.0) | 0.000 (0.000) |
| NS1 | 10 | 1.3 (1.4) | 0.078 (0.110) | 6 | 0.3 (0.5) | 0.033 (0.016) | 4 | 1.0 (0.8) | 0.014 (0.003) |
| NS2 | 10 | 0.5 (0.5) | 0.122 (0.167) | 6 | 0.3 (0.8) | 0.052 (0.059) | 4 | 0.8 (1.0) | 0.036 (0.032) |
-
SD, standard deviation; NA, not applicable; LAIV: live-attenuated influenza virus; IAV, influenza A virus.
-
*
‘n’ represents the number of BALF samples successfully sequenced by Illumina by treatment groups.
-
†
The ‘No. of sequences’ columns represent the number of sequences from H3N2 IAVs for any given protein from the total available samples (n) within each treatment group.
Additional files
-
Supplementary file 1
Comparison of humoral immune response in pigs whose bronchoalveolar lavage fluid (BALF) samples are available for direct sequencing or plaque purification between treatment groups.
- https://cdn.elifesciences.org/articles/78618/elife-78618-supp1-v1.docx
-
Supplementary file 2
Number of bronchoalveolar lavage fluid (BALF) samples and number of plaques available for the study.
- https://cdn.elifesciences.org/articles/78618/elife-78618-supp2-v1.docx
-
Supplementary file 3
All identified functional single-nucleotide variants (SNVs) in the H1N1 virus with annotations.
- https://cdn.elifesciences.org/articles/78618/elife-78618-supp3-v1.docx
-
Supplementary file 4
All identified functional single-nucleotide variants (SNVs) in the H3N2 virus with annotations.
- https://cdn.elifesciences.org/articles/78618/elife-78618-supp4-v1.docx
-
Supplementary file 5
Spearman correlation between humoral and cellular immune responses and influenza A virus (IAV) hemagglutinin (HA) nucleotide diversity in individual pigs.
- https://cdn.elifesciences.org/articles/78618/elife-78618-supp5-v1.docx
-
Supplementary file 6
Clade classification and homology of each gene segment between A/swine/Minnesota/PAH-618/2011 (H1N1) and A/swine/Minnesota/080470/2015 (H3N2) viruses.
- https://cdn.elifesciences.org/articles/78618/elife-78618-supp6-v1.docx
-
MDAR checklist
- https://cdn.elifesciences.org/articles/78618/elife-78618-mdarchecklist1-v1.docx
Download links
A two-part list of links to download the article, or parts of the article, in various formats.
Downloads (link to download the article as PDF)
Open citations (links to open the citations from this article in various online reference manager services)
Cite this article (links to download the citations from this article in formats compatible with various reference manager tools)
Vaccination decreases the risk of influenza A virus reassortment but not genetic variation in pigs
eLife 11:e78618.
https://doi.org/10.7554/eLife.78618


