Neuromodulation of striatal D1 cells shapes BOLD fluctuations in anatomically connected thalamic and cortical regions
- Neural Control of Movement Lab, HEST, ETH Zürich, Switzerland
- Neuroscience Center Zurich, University and ETH Zurich, Switzerland
- Department of Radiology and Biomedical Imaging, School of Medicine, Yale University, United States
- Laboratory of Molecular and Behavioral Neuroscience, Institute for Neuroscience, HEST, ETH Zurich, Switzerland
- Institute of Pharmacology and Toxicology, University of Zurich, Switzerland
- Institute for Biomedical Engineering, University and ETH Zurich, Switzerland
- Neuro-X Institute, School of Engineering (STI), EPFL, Switzerland
- CIBM Centre for Biomedical Imaging, Switzerland
- School of Physics, The University of Sydney, Australia
- Future Health Technologies, Singapore-ETH Centre, Campus for Research Excellence and Technological Enterprise (CREATE), Singapore
Figures
Figure 1
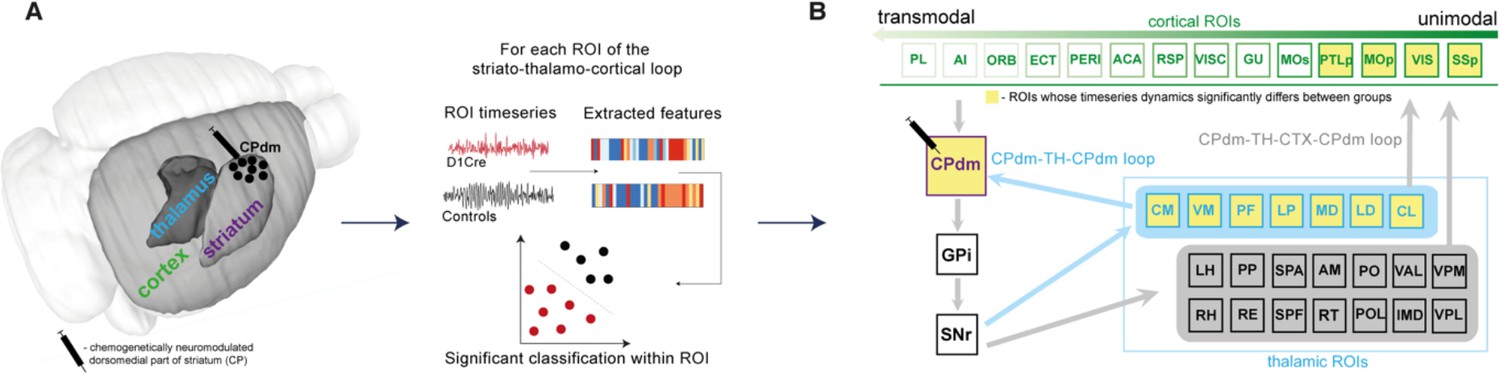
The effect of D1 medium spiny neuron (MSN) neuromodulation within dorsomedial striatum was studied within an anatomically defined striato-thalamo-cortical circuit using blood-oxygen-level-dependent (BOLD) time-series properties.
(A) MSNs of the right dorsomedial striatum (CPdm) were neuromodulated via DREADDs. Time series were extracted from regions of interest (ROIs) in striatum (CP), thalamus (TH), and cortex (CTX) after the DREADDs were activated by clozapine. BOLD time-series properties were computed using the hctsa feature set (Fulcher and Jones, 2017). For each ROI, a linear support vector machine was used to determine whether neuromodulated animals could be distinguished from controls using time-series features extracted from the BOLD signal. (B) ROIs within the striato-thalamo-cortical circuit connected to CPdm were identified using mesoscale anatomical atlases. Thalamic areas were subdivided into ROIs that project back to CPdm (light blue box and light blue arrows) versus thalamic ROIs that do not (light gray box). Cortical ROIs (green) were ranked along a previously described multimodal hierarchy (Fulcher et al., 2019). ROIs marked in yellow indicate that neuromodulated versus control animals could be significantly distinguished based on BOLD time-series properties. In cortex, such ROIs are primarily unimodal, while in thalamus such ROIs project back to the neuromodulated CPdm. Full names of abbreviated ROIs: AI, agranular insular area; PL, prelimbic area; ECT|PERI, ectorhinal and perirhinal area; VISC|GU, visceral and gustatory areas; ORB, orbital area; RSP, retrosplenial area; MOp/s, primary and secondary motor cortex; SSp, primary somatosensory cortex; ACA, anterior cingulate area; PTLp, posterior parietal association area; VIS, visual area; CPdm, caudate putamen dorsomedial; SNr, substantia nigra reticular part; GPi, globus pallidus internal; VPL, ventral posterolateral nucleus of thalamus; RE|LH|RH, nucleus of reuniens|lateral habenula|rhomboid nucleus; PO|POL, posterior complex and posterior limiting nucleus of thalamus; SPF|SPA|PP, subparafascicular nucleus subparafascicular area with peripeduncular nucleus of thalamus; IMD, intermediodorsal nucleus of thalamus; RT, reticular nucleus of thalamus; AM, anteromedial nucleus; CL, central lateral nucleus of thalamus; PF, parafascicular nucleus; VAL|VPM|VPMpc, ventral anterior-lateral complex of the thalamus with ventral posteromedial nucleus of the thalamus and its parvicellular part; MD, mediodorsal nucleus of thalamus; LD, lateral dorsal nucleus of thalamus; LP, lateral posterior nucleus of thalamus; VM|CM, ventral and central medial nuclei of thalamus.
Figure 2 with 1 supplement
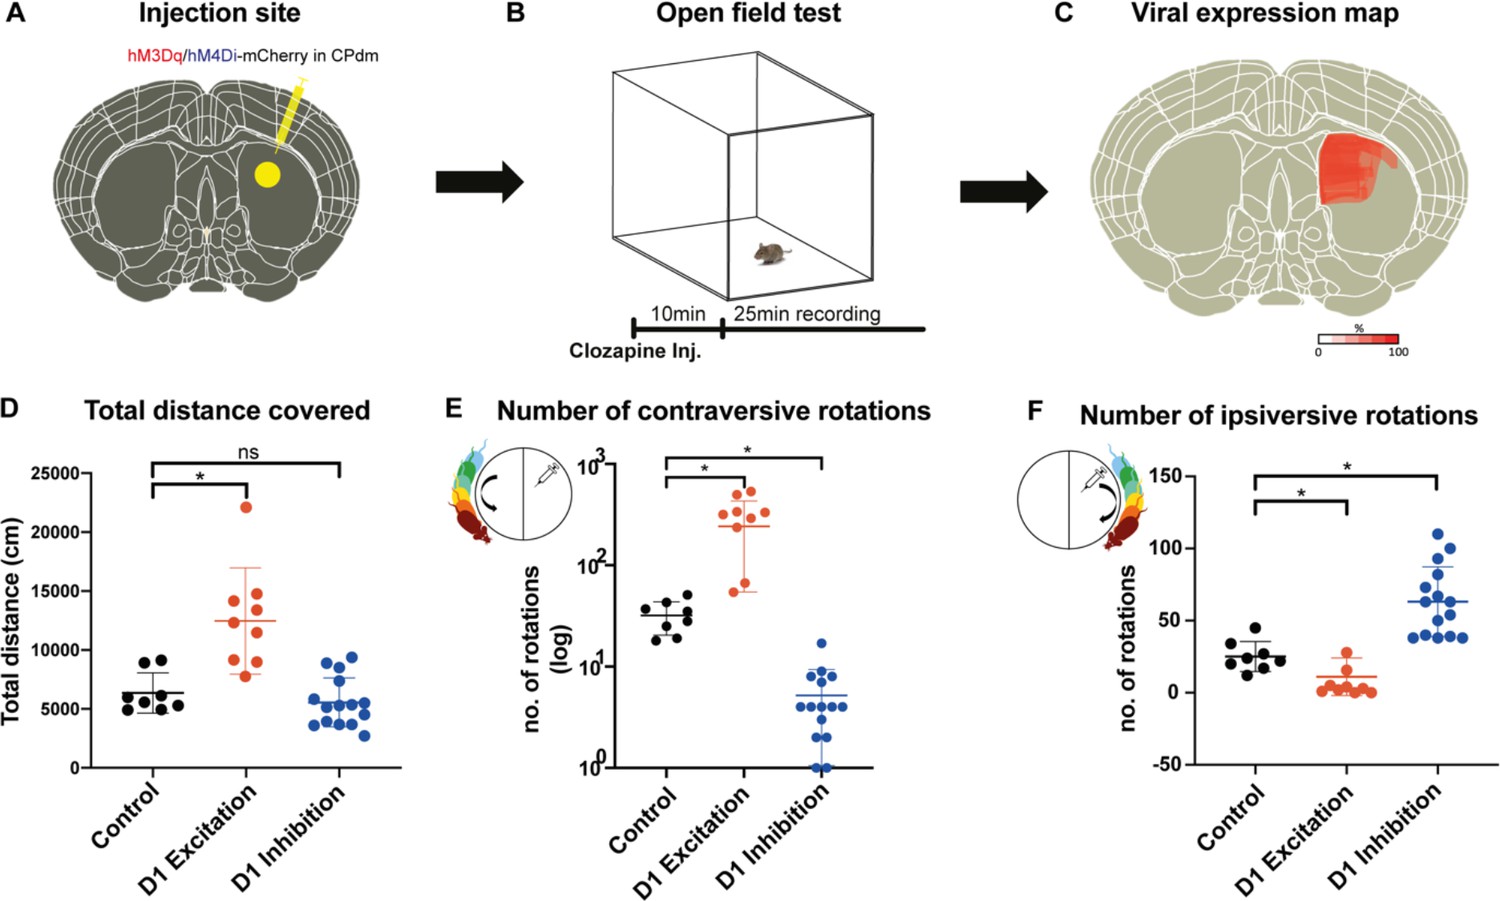
Chemogenetic neuromodulation of D1 medium spiny neurons (MSNs) altered the animals’ motor behavior.
(A) Either DIO-hM3Di-mCherry, DIO-hM4Dq-mCherry, or DIO-mCherry (control) virus was injected in the right dorsomedial striatum (CPdm) of D1Cre mice (marked in yellow). (B) Four weeks after viral injection, an open-field test was performed. A 25 min recording of mouse behavior was commenced 10 min after intraperitoneal clozapine injection. (C) Qualitative viral expression maps were overlaid for all mice included in the experiment (100% on the scale bar indicates the presence of viral expression in all the mice). (D) Mice whose D1 MSNs of CPdm were excited and not inhibited covered significantly more distance when compared to controls (MANOVA, p=0.001). (E) Exciting D1 MSNs of the right CPdm increased the frequency of contraversive rotations (turning in the direction opposite the injection site as illustrated within the small circle, p=0.001) when compared to controls. On the contrary, inhibiting D1 MSNs of the right CPdm decreased contraversive rotations relative to controls (p=0.001). (F) Compared to controls, the number of ipsiversive rotations (turning in the same direction as the injection site, as illustrated within the small circle) significantly decreased when D1 MSNs of the CPdm were excited (p=0.011), while rotations significantly increased when D1 MSNs were inhibited (p=1.3 * 10–5).
Figure 2—figure supplement 1
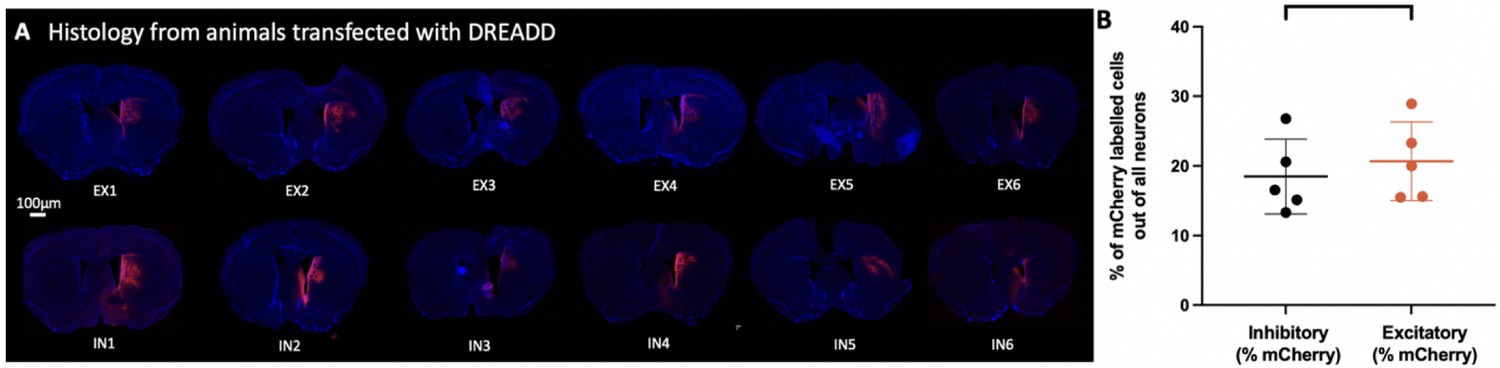
No difference in number of transfected neurons between excitatory and inhibitory DREADD transfected animals.
(A) Whole-brain slices illustrating the viral expression (depicted in red) for a number of animals transfected with either excitatory (EX) or inhibitory (IN) DREADD. (B) Quantified viral expression from randomly chosen mice transfected with either inhibitory or excitatory DREADD. Unpaired t-test indicates that there are no differences in the number of transfected neurons between groups, over identical surface area (t(8) = 0.6275; p=0.5).
Figure 3
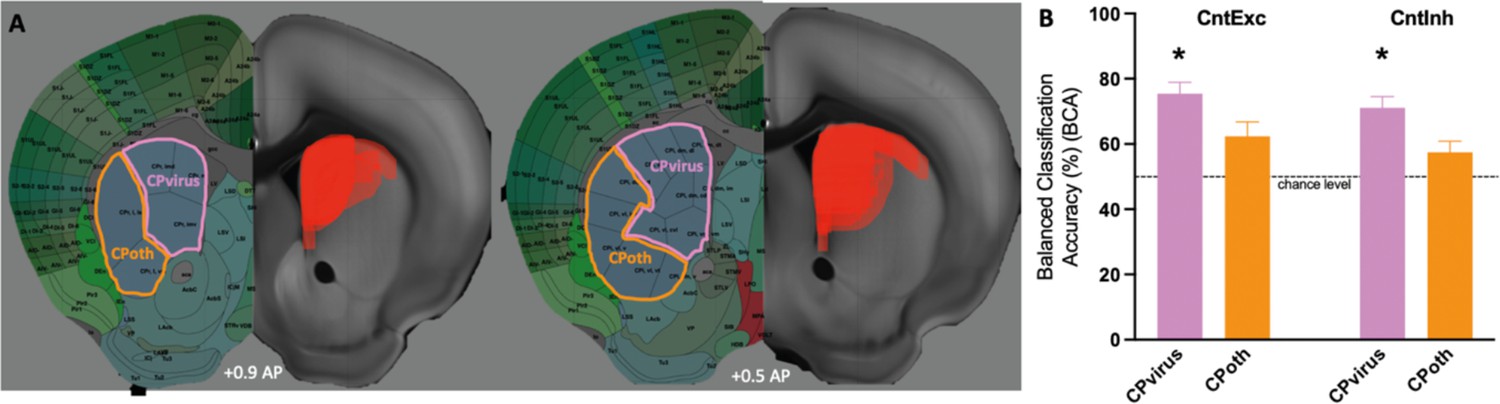
Altered dynamics of virally transfected CP subregions.
(A) Viral spread on the right side of the brain slice. Left side illustrates which CP subregions obtained from Hintiryan atlas were virally transfected by the DREADD virus and form a part of CPvirus region. (B) Classification results for CPvirus region and CPoth (region formed from CP subregions that were not transfected by the virus) for the two group comparisons (Controls vs. D1 excitation and controls vs. D1 inhibition). * refers to significance of CPvirus region from chance obtained using permutation testing.
Figure 4 with 2 supplements
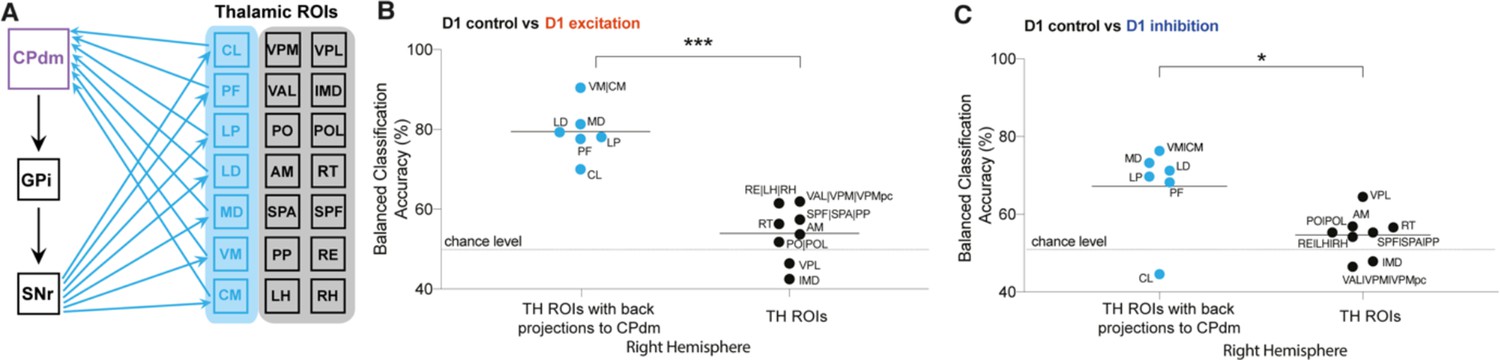
Altered blood-oxygen-level-dependent (BOLD) dynamics in thalamic regions forming anatomical loops with dorsomedial striatum.
(A) Figure illustrating thalamic (TH) subregions (light blue) that project back to dorsomedial striatum. (B) Comparison of balanced classification accuracies for D1 control versus D1 excitation group between thalamic regions projecting back to the modulated site CPdm (blue dots) and the rest of the thalamic regions of interest (ROIs) which constitute striato-thalamo-cortical circuit (two-tailed Mann–Whitney U-test; p=7 × 10⁻⁴). Thalamic regions which project back to CPdm have significantly higher balanced classification accuracies as compared to the other thalamic ROIs. (C) Similar to (B) but for D1 control versus D1 inhibitory group comparison (two-tailed Mann–Whitney U-test; p=0.04). Full names of abbreviated ROIs: CPdm, caudate putamen dorsomedial; SNr, substantia nigra reticular part; GPi, globus pallidus internal; VPL, ventral posterolateral nucleus of thalamus; RE|LH|RH, nucleus of reuniens|lateral habenula|rhomboid nucleus; PO|POL, posterior complex and posterior limiting nucleus of thalamus; SPF|SPA|PP, subparafascicular nucleus subparafascicular area with peripeduncular nucleus of thalamus; IMD, intermediodorsal nucleus of thalamus; RT, reticular nucleus of thalamus; AM, anteromedial nucleus; CL, central lateral nucleus of thalamus; PF, parafascicular nucleus; VAL|VPM|VPMpc, ventral anterior-lateral complex of the thalamus with ventral posteromedial nucleus of the thalamus and its parvicellular part; MD, mediodorsal nucleus of thalamus; LD, lateral dorsal nucleus of thalamus; LP, lateral posterior nucleus of thalamus; VM|CM, ventral and central medial nuclei of thalamus.
Figure 4—figure supplement 1

Characteristic changes observed in blood-oxygen-level-dependent (BOLD) dynamics of regions part of the striato-thalamo-cortical circuit.
Classification results in each brain region are shown for (A) D1 control versus D1 excitation; (B) D1 control versus D1 inhibition. Each region is color coded depending on whether it is a part of CTX, TH, or other regions downstream of basal ganglia. A significant difference in BOLD dynamics between the two groups (permutation test, uncorrected, p<0.05) is depicted with a bolded region of interest (ROI) abbreviation, where * indicates that statistical significance was reached after false discovery rate (FDR) correction for multiple comparison. (C) Balanced classification accuracy for D1 excitation and D1 inhibition obtained following identical methodology as outlined in the ‘Materials and methods’ section. Full names of abbreviated ROIs: AI, agranular insular area; PL, prelimbic area; ECT|PERI, ectorhinal and perirhinal area; VISC|GU, visceral and gustatory areas; ORB, orbital area; RSP, retrosplenial area; MOp/s, primary and secondary motor cortex; SSp, primary somatosensory cortex; ACA, anterior cingulate area; PTLp, posterior parietal association area; VIS, visual area; CPdm, caudate putamen dorsomedial; SNr, substantia nigra reticular part; GPi, globus pallidus internal; VPL, ventral posterolateral nucleus of thalamus; RE|LH|RH, nucleus of reuniens|lateral habenula|rhomboid nucleus; PO|POL, posterior complex and posterior limiting nucleus of thalamus; SPF|SPA|PP, subparafascicular nucleus subparafascicular area with peripeduncular nucleus of thalamus; IMD, intermediodorsal nucleus of thalamus; RT, reticular nucleus of thalamus; AM, anteromedial nucleus; CL, central lateral nucleus of thalamus; PF, parafascicular nucleus; VAL|VPM|VPMpc, ventral anterior-lateral complex of the thalamus with ventral posteromedial nucleus of the thalamus and its parvicellular part; MD, mediodorsal nucleus of thalamus; LD, lateral dorsal nucleus of thalamus; LP, lateral posterior nucleus of thalamus; VM|CM, ventral and central medial nuclei of thalamus.
Figure 4—figure supplement 2
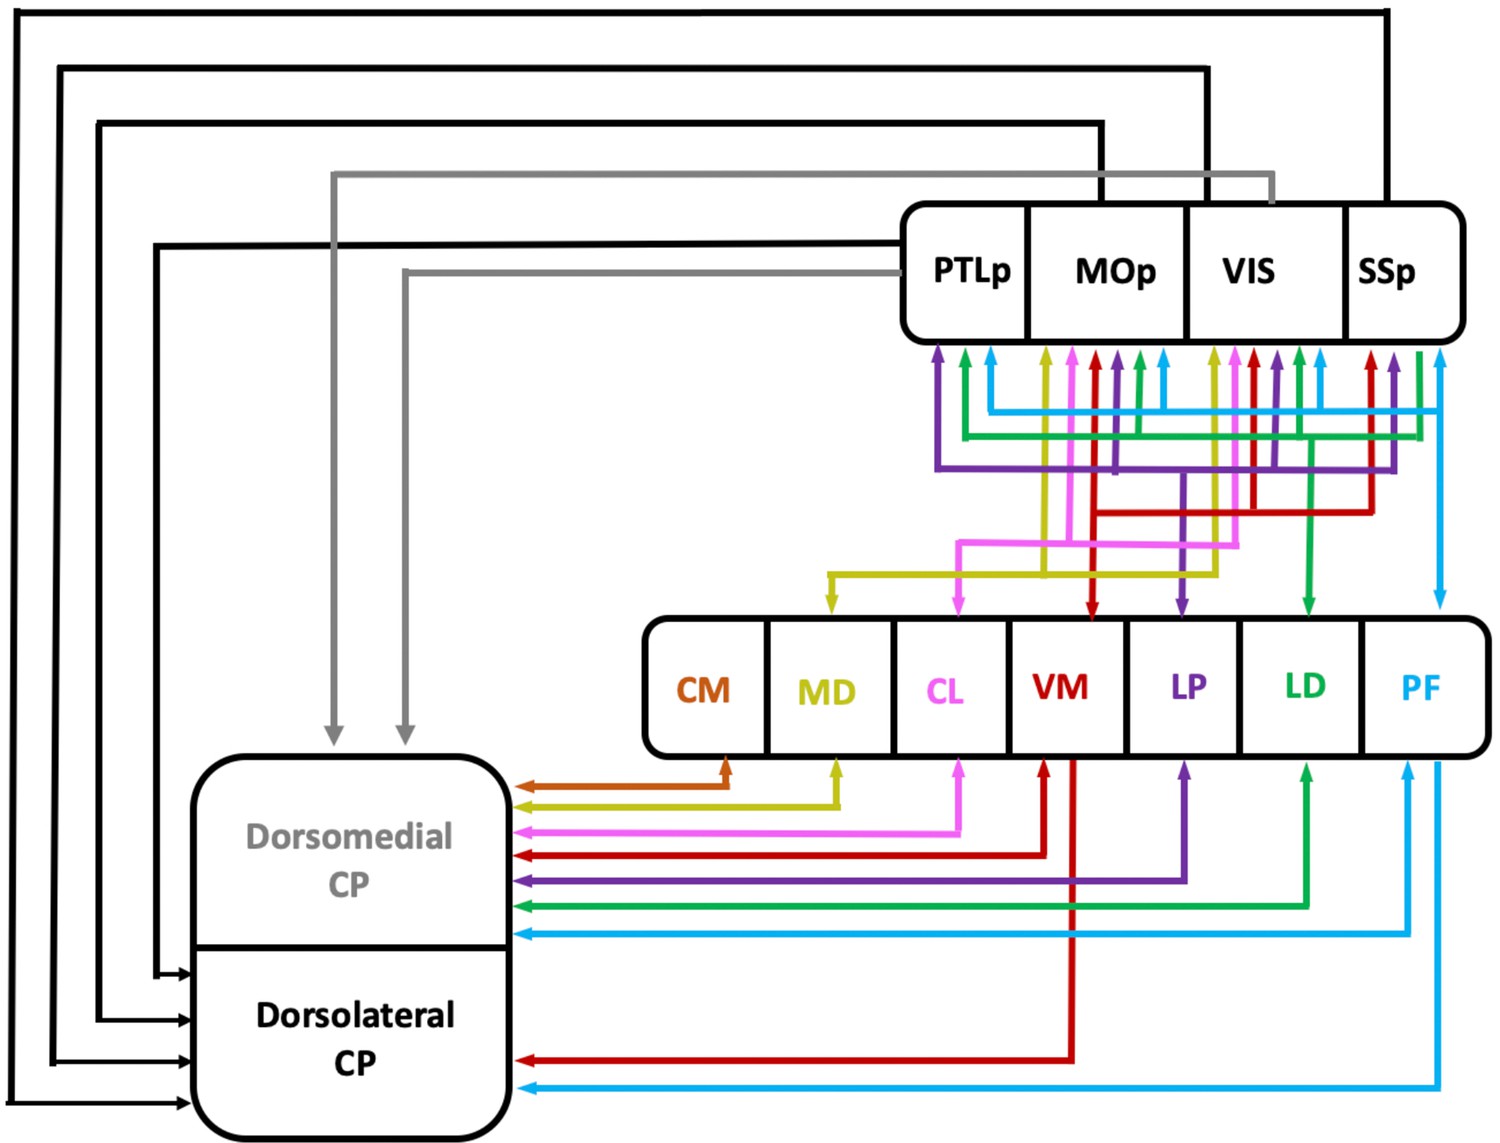
Figure illustrates anatomical projections between dorsolateral (CPdl) and dorsomedial striatum (CPdm) and thalamic and cortical areas that exhibited significantly altered time-series dynamics in response to our experimental manipulation.
It can be seen that the CPdm has dense bilateral projections to the thalamic nuclei which, in turn, are densely connected to all cortical regions. Globus pallidus internal (GPi) and substantia nigra reticular part (SNr) omitted for simplicity. The figure is based on Foster et al., 2021, who demonstrated that thalamic ventral-medial (VM) and parafascicular (PF) regions, which exhibit significantly altered time-series dynamics after D1 neuromodulation, receive dense nigral outputs and have prominent projections to unimodal primary motor (MOp) and somatosensory (SSp) cortices, which are bilateral (Foster et al., 2021). PF also projects to visual (VIS) and posterior parietal cortex (PTLp). Further literature review (Foster et al., 2021; Harris et al., 2019; Hintiryan et al., 2016; Hunnicutt et al., 2016; Hunnicutt et al., 2014; Leow et al., 2022; Lyamzin and Benucci, 2019; Parker et al., 2016; Perry and Mitchell, 2019) indicates that almost all (except CM) thalamic regions that displayed significant perturbations in time-series dynamics after D1 neuromodulation project to ‘unimodal’ cortical regions. Majority of these projections are bilateral, that is, thalamocortical and corticothalamic. One-sided arrow = unilateral projection, two-sided arrow = bilateral projections. Other relevant publications are listed in Supplementary file 1 of the article.
Figure 5
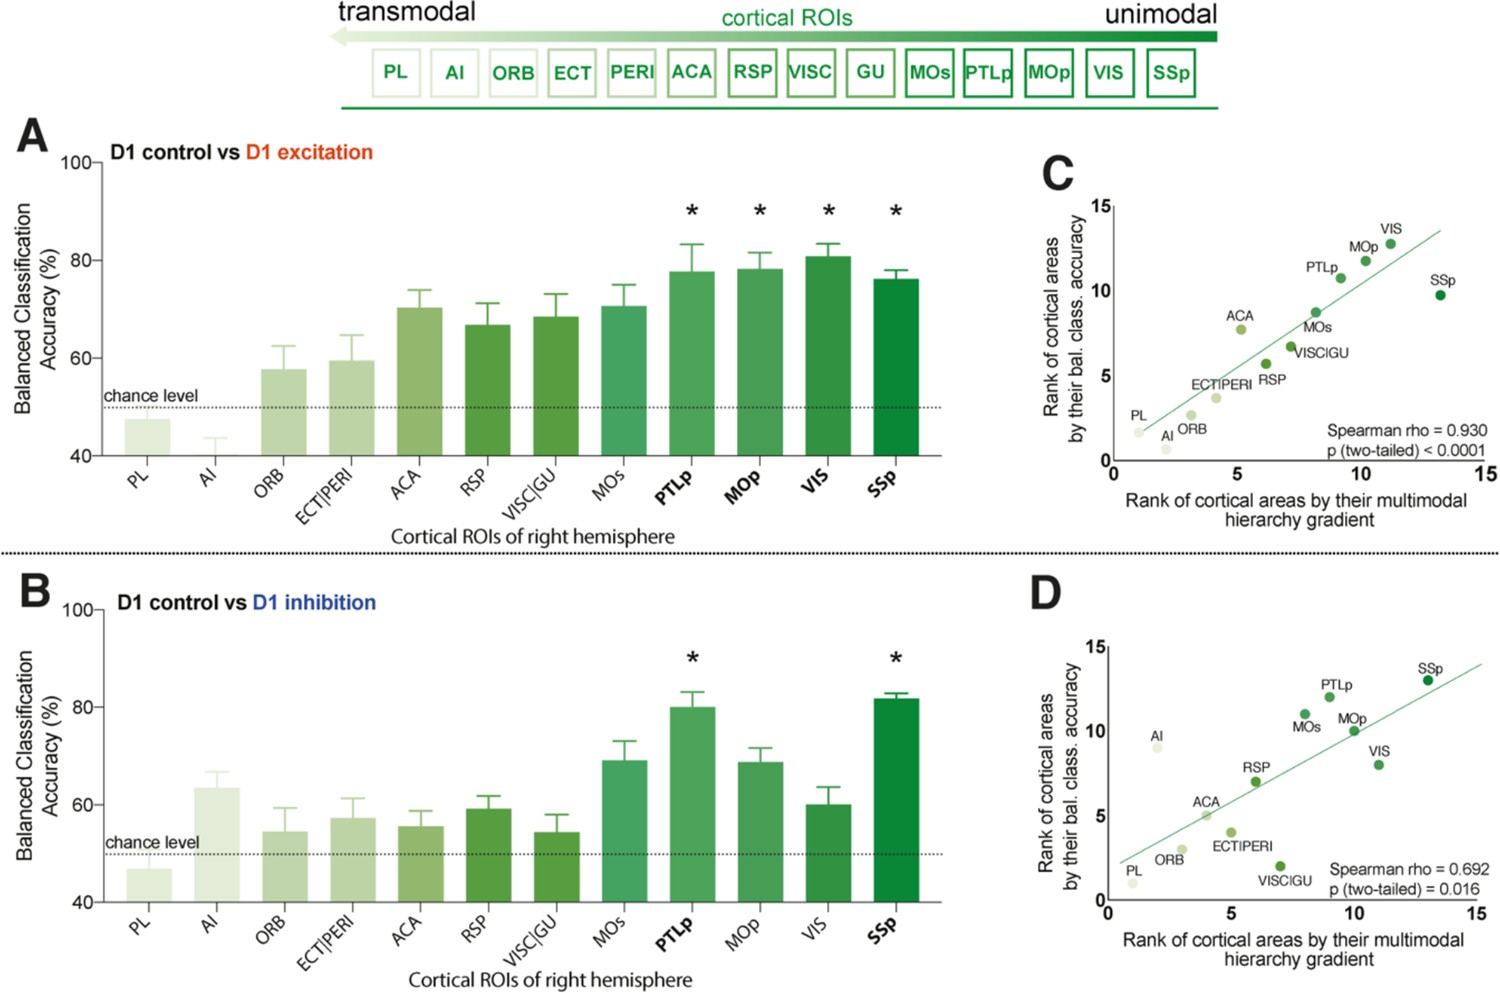
Cortical regions of interest (ROIs) with altered blood-oxygen-level-dependent (BOLD) dynamics after D1 medium spiny neuron (MSN) modulation are primarily unimodal.
(A, B) Balanced classification accuracy (%) results for each cortical brain region shown for: (A) D1 control versus D1 excitation; (B) D1 control versus D1 inhibition. Regions are listed following a previously described hierarchical ordering of cortical areas (Fulcher et al., 2019) that putatively orders regions along a unimodal-to-transmodal axis (illustrated above the two figures). A false discovery rate (FDR)-corrected significant difference in BOLD dynamics between the two groups is depicted with bold ROI abbreviations and an asterisk (*) (pcorr<0.05). (C) Spearman correlation (ρ = 0.93, p=1 × 10⁻⁴) between cortical areas ranked by their balanced classification accuracy and their multimodal hierarchy gradient for D1 control versus D1 excitation group comparison. (D) Same as (C) but for D1 control versus D1 inhibition group comparison (rho = 0.69, p=0.02). Full names of abbreviated ROIs: AI, agranular insular area; PL, prelimbic area; ECT|PERI, ectorhinal and perirhinal area; VISC|GU, visceral and gustatory areas; ORB, orbital area; RSP, retrosplenial area; MOp/s, primary and secondary motor cortex; SSp, primary somatosensory cortex; ACA, anterior cingulate area; PTLp, posterior parietal association area; VIS, visual area.
Figure 6 with 2 supplements
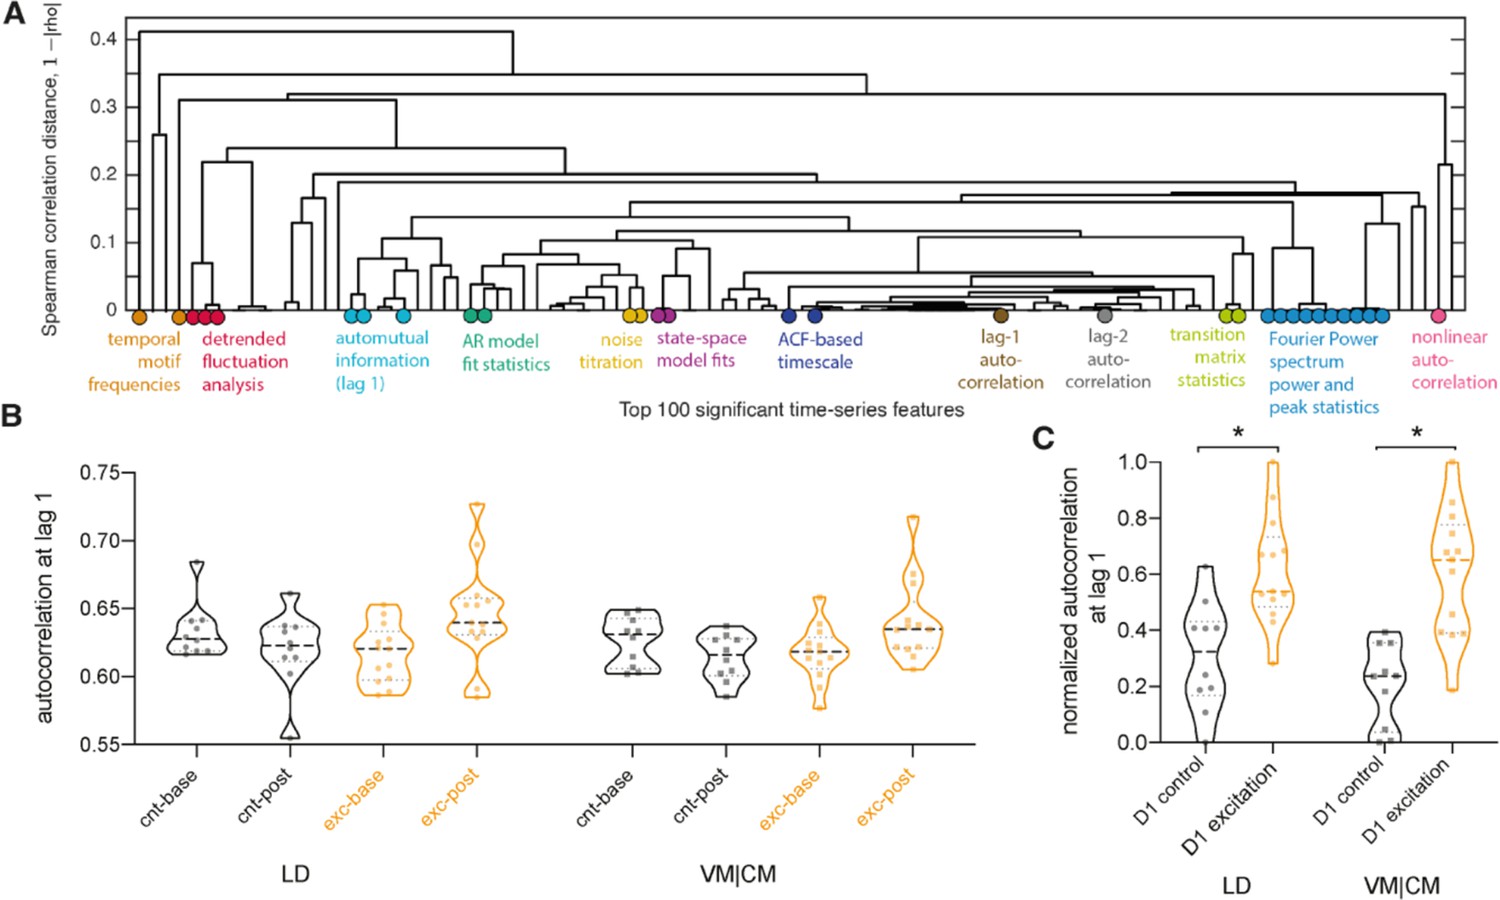
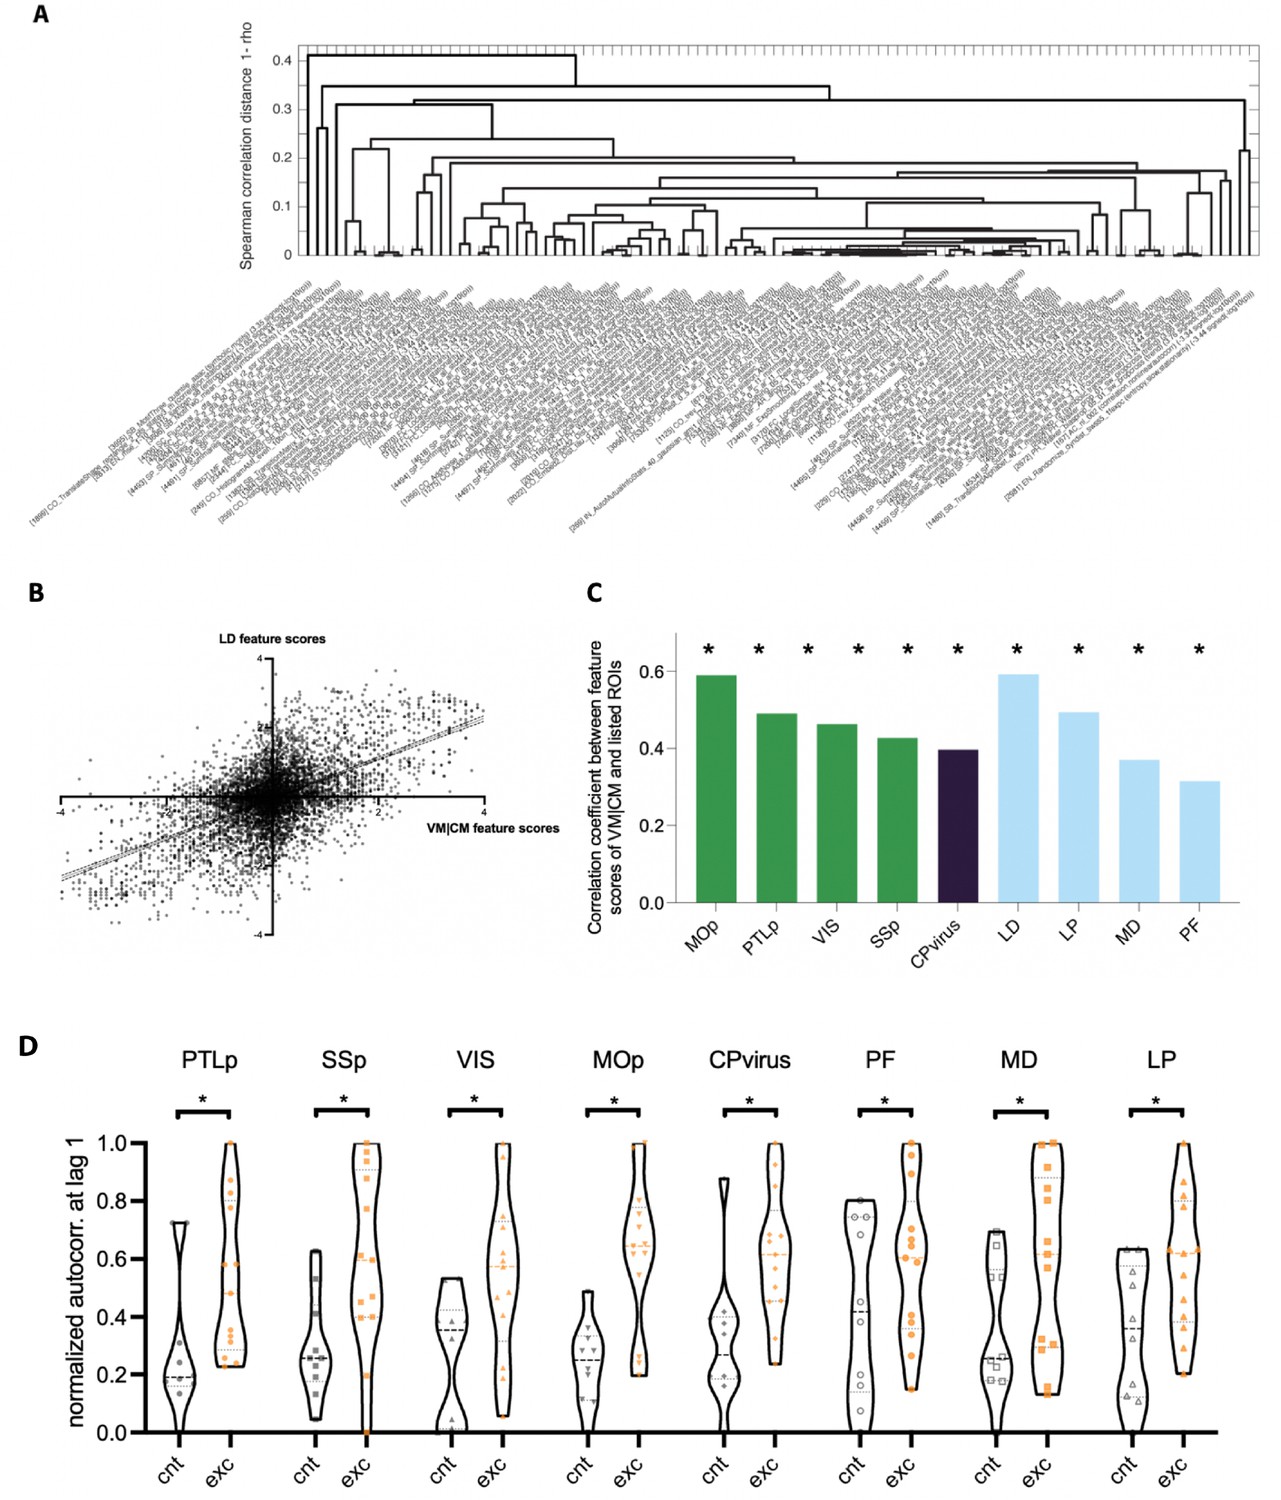
D1 medium spiny neuron (MSN) excitation led to slower and more autocorrelated fluctuations of the time-series signal in thalamic regions.
(A) The dendrogram captures the similarity between the top 100 features at distinguishing the stimulation condition from blood-oxygen-level-dependent (BOLD) dynamics in VM|CM. These top 100 features were selected by those with the strongest difference between stimulation and control conditions according to a Mann–Whitney rank-sum statistic. Feature dissimilarity is measured as Spearman correlation distance (1-|rho|) between all pairs of features which were calculated across all animals and subjected to clustering. The dendrogram organizes features using hierarchical average linkage clustering. Selected features are annotated; refer to Figure 6—figure supplement 2A for a full annotation of all features onto the dendrogram. (B) Autocorrelation at lag 1 shown for baseline and post clozapine controls (cnt-base, cnt-post, respectively) and excitatory groups (exc-base, exc-post) for lateral-dorsal (LD) and ventral-, central-medial (VM|CM) thalamic regions. Increase in autocorrelation is observed during a post clozapine period in the excitatory group, for both brain regions (LD and VM|CM). (C) Increase in autocorrelation is observed in normalized within-group baseline-corrected data. *indicates a between groups false discovery rate (FDR)-corrected significant difference, that is, pLD=0.03; pVM|CM=0.009. Full names of abbreviated regions of interest (ROIs): LP, lateral posterior nucleus of thalamus; VM|CM, ventral and central medial nuclei of thalamus.
Figure 6—figure supplement 1

Verified correct implementation of cross-validation and no overfitting using high-dimentional feature space.
(A, C) Cross-validated accuracies obtained using the full feature space and the low-dimensional space of leading PCs. Two-tailed paired t-test illustrates no significant difference between classification accuracies obtained through full feature space (result reported throughout the article) versus low-dimensional space of leading PCs (A: t(60) = 1.143; p=0.3; C: t(60) = 0.732; p=0.4668). (B, D) Exemplary distribution of 5000 null values obtained during classification for a single randomly chosen region in both groups (D1 control vs. D1 inhibition and D1 control vs. D1 excitation). Similar distributions were observed for all regions within both groups (ranging from 49.56 to 50.4). Total mean of all averaged null values across all regions is for D1 excitation versus D1 control 49.66 ± 11.97 and for D1 inhibition versus D1 control 49.81 ± 11.02.
Figure 6—figure supplement 2
Broadly similar changes in time-series properties after D1 excitation in significant thalamic, cortical, and striatal regions.
(A) The dendrogram captures the similarity between the top 100 features at distinguishing the stimulation condition from blood-oxygen-level-dependent (BOLD) dynamics in VM|CM with full annotation of all features onto the dendrogram.
(B) Pairwise correlation of feature scores between LD and VM|CM (Pearson’s r = 0.592; pperm=0.01) for D1 excitation and D1 control group comparison. (C) Pairwise correlations of feature scores of VM|CM and other thalamic, cortical, and striatal regions that displayed significant balanced classification accuracy after D1 excitation. (D) Normalized (post clozapine minus baseline) autocorrelation at lag 1 for all cortical, striatal, and thalamic regions that displayed significant change in balanced classification accuracies. *indicates significant, uncorrected difference between controls (cnt) and excitatory (exc) groups.
Figure 7 with 2 supplements
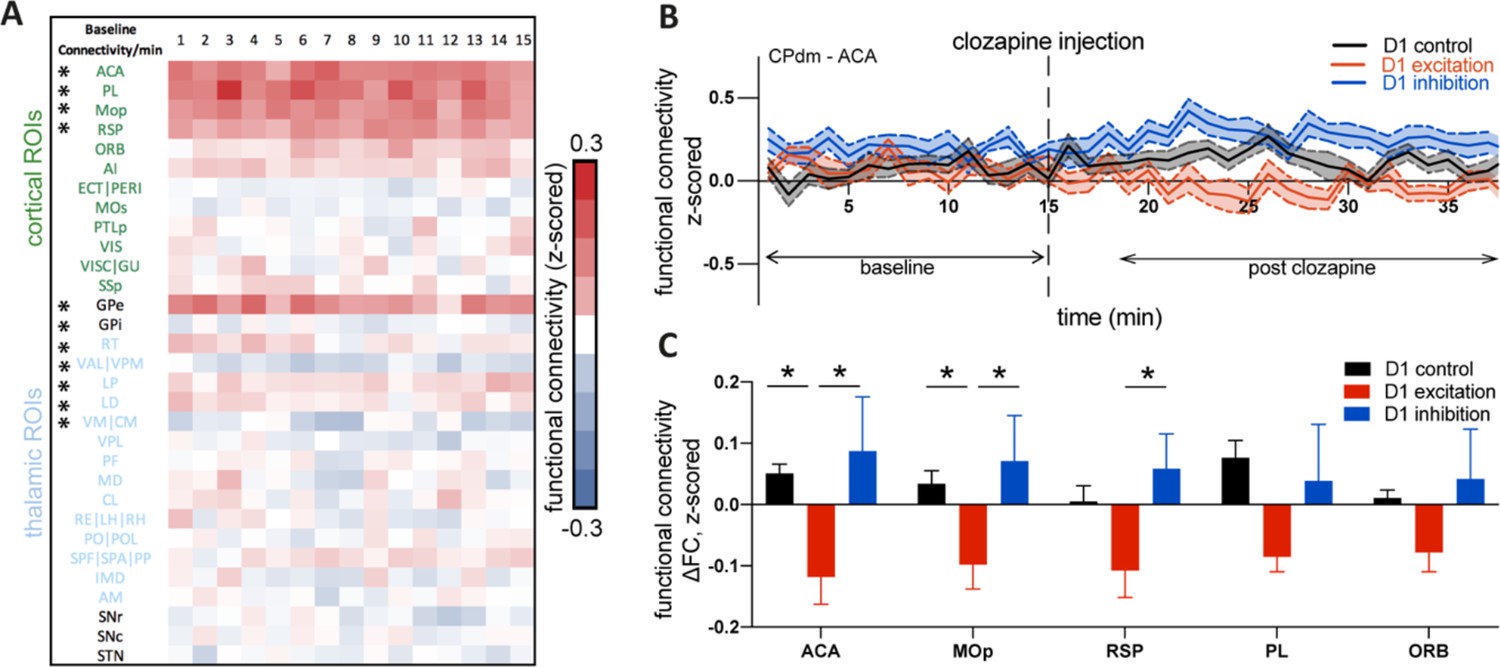
Cortico-striatal changes in functional connectivity (FC) upon D1 medium spiny neuron (MSN) neuromodulation.
(A) Baseline FC calculated per minute between CPdm and the rest of regions of interest (ROIs) that form the striato-thalamo-cortical loop, combining animals from all three groups involved in the experiment. One-sample Wilcoxon test was performed, and * indicates that statistical significance was reached after false discovery rate (FDR) correction for multiple comparisons (p<0.01). (B) FC calculated by minute for D1 controls, D1 excitation, and D1 inhibition groups between CPdm and ACA (an example ROI). Dashed line at 15 min indicates clozapine injection, that is, activation of the DREADD, which is followed by the changes in FC for D1 excitation and D1 inhibition groups. The baseline (first 15 min before clozapine injection) and post clozapine periods (from 19 to 34 min) used for the delta analysis (C) are indicated. (C) Functional connectivity at ∆FC (post clozapine – baseline) for cortical regions that displayed differences during pairwise comparisons (permutation test, puncorr<0.05). * indicates that statistical significance was reached after FDR correction on all pairwise comparisons of all three groups. Full names of abbreviated ROIs: AI, agranular insular area; PL, prelimbic area; ECT|PERI, ectorhinal and perirhinal area; VISC|GU, visceral and gustatory areas; ORB, orbital area; RSP, retrosplenial area; MOp/s, primary and secondary motor cortex; SSp, primary somatosensory cortex; ACA, anterior cingulate area; PTLp, posterior parietal association area; VIS, visual area; CPdm, caudate putamen dorsomedial; SNr, substantia nigra reticular part; GPi, globus pallidus internal; VPL, ventral posterolateral nucleus of thalamus; RE|LH|RH, nucleus of reuniens|lateral habenula|rhomboid nucleus; PO|POL, posterior complex and posterior limiting nucleus of thalamus; SPF|SPA|PP, subparafascicular nucleus subparafascicular area with peripeduncular nucleus of thalamus; IMD, intermediodorsal nucleus of thalamus; RT, reticular nucleus of thalamus; AM, anteromedial nucleus; CL, central lateral nucleus of thalamus; PF, parafascicular nucleus; VAL|VPM|VPMpc, ventral anterior-lateral complex of the thalamus with ventral posteromedial nucleus of the thalamus and its parvicellular part; MD, mediodorsal nucleus of thalamus; LD, lateral dorsal nucleus of thalamus; LP, lateral posterior nucleus of thalamus; VM|CM, ventral and central medial nuclei of thalamus.
Figure 7—figure supplement 1
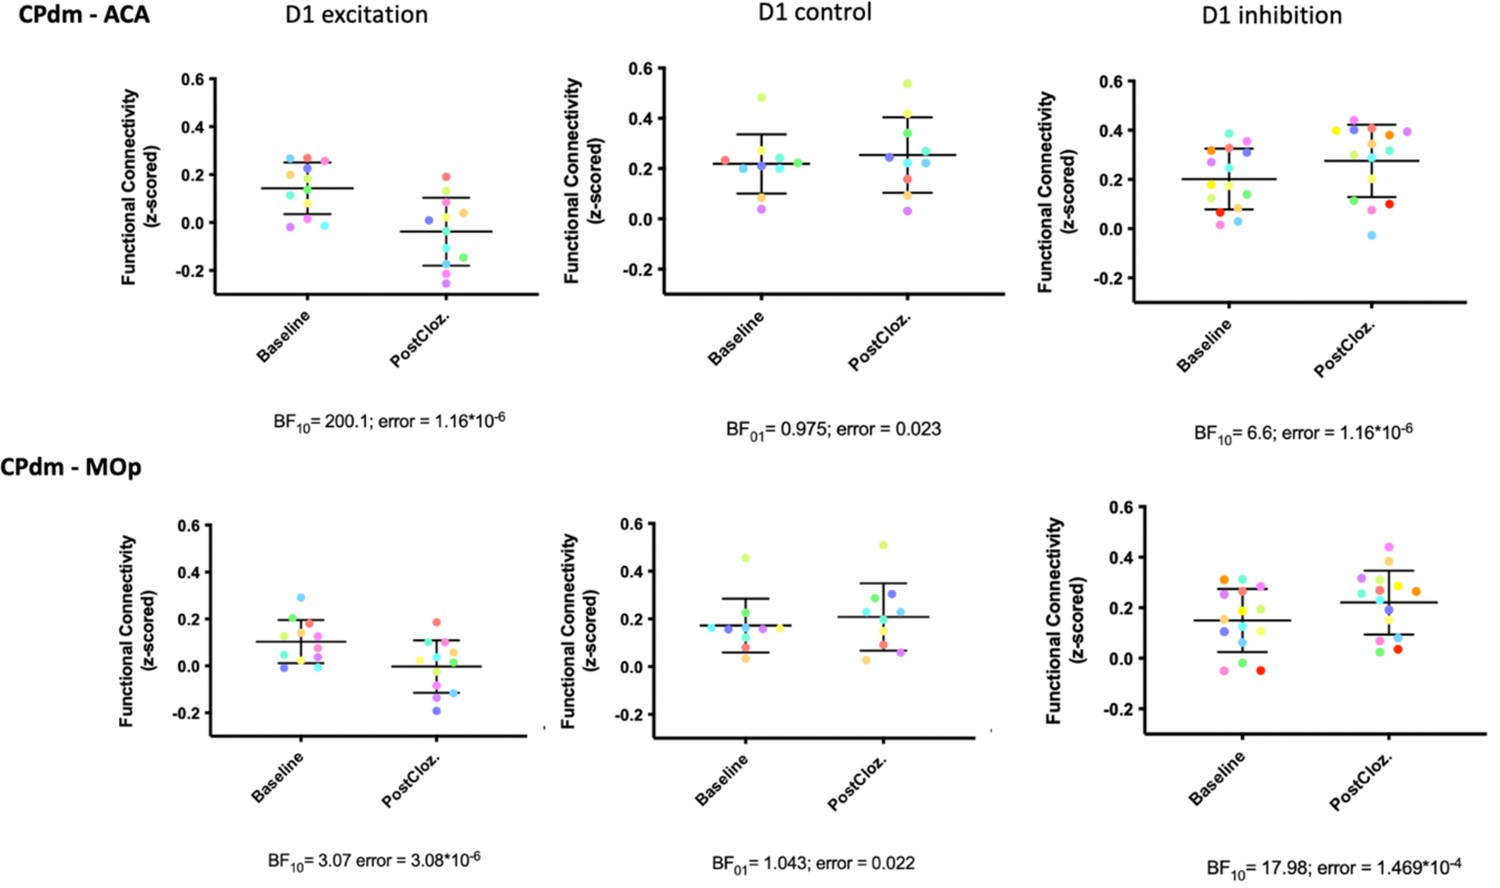
Functional connectivity (FC, corresponding to the z-scored Pearson’s correlation coefficient) between Cpdm-ACA (upper row) and CPdm-MOp (lower row) separately displayed for D1 excitation, control, and inhibition at the baseline level and after clozapine injection for each animal individually (in the same graph the same-colored dots represent the same animal).
We performed separate Bayesian paired t-tests (JASP, the Netherlands) for each of the six panels to capture changes in FC values from pre- to post injection of clozapine. The default settings of JASP yielded robust Bayes factors (BF). For the D1 excitation and D1 inhibition groups, Bayesian t-tests revealed BF10s between 3 and 200, indicating that there is moderate to strong evidence in favor of the hypothesis that activating the DREADDs with clozapine caused FC to change (Jeffreys, 1961). For the control group, by contrast, we tested whether the null hypothesis would hold and obtained BF01 = 0.975 for CPdm-ACA; and BF01 = 1.043 CPdm-MOp, indicating that there is weak evidence in favor for the hypothesis that FC did not change from baseline to post clozapine. CPdm, dorsomedial caudate putamen; ACA, anterior cingulate cortex; SSp, primary somatosensory cortex.
Figure 7—figure supplement 2

Significant correlation between rotational behavior and edges with significantly altered functional connectivity after neuromodulation.
(A–D) Correlation (corrected) between behavior and functional connectivity results for each animal (each dot represents a single animal; red dots – animals with D1 excitation; blue dots – animals with D1 inhibition; black dots – control animals).
CPdm, dorsomedial caudate putamen; ACA, anterior cingulate cortex; MOp, primary motor cortex; PTLp, posterior parietal cortex. Most of the control animals retain identical functional connectivities (FCs) from baseline to post clozapine, while there was a clear change in FC for the D1 excitation and D1 inhibition groups.
Author response image 1

Pairwise correlation of feature scores of PTLp and SSp (Pearson’s r = 0.405; pperm = 0.01).
Author response image 2

(A) Correlation between feature scores of PTLp after D1 excitation and inhibition, shows high significant positive correlation (Pearson’s r =0.713; pperm < 0.01); (B) Similar to A but for SSp (Pearson’s r=0.788; pperm < 0.01).
Additional files
-
MDAR checklist
- https://cdn.elifesciences.org/articles/78620/elife-78620-mdarchecklist1-v1.docx
-
Supplementary file 1
List of thalamic regions of interest (ROIs) and their anatomical projections from/to dorsomedial CP with references to the literature where the information was obtained.
Full names of abbreviated ROIs: CPdm, caudate putamen dorsomedial; SNr, substantia nigra reticular part; GPi, globus pallidus internal; VPL, ventral posterolateral nucleus of thalamus; RE|LH|RH, nucleus of reuniens|lateral habenula|rhomboid nucleus; PO|POL, posterior complex and posterior limiting nucleus of thalamus; SPF|SPA|PP, subparafascicular nucleus subparafascicular area with peripeduncular nucleus of thalamus; IMD, intermediodorsal nucleus of thalamus; RT, reticular nucleus of thalamus; AM, anteromedial nucleus; CL, central lateral nucleus of thalamus; PF, parafascicular nucleus; VAL|VPM|VPMpc, ventral anterior-lateral complex of the thalamus with ventral posteromedial nucleus of the thalamus and its parvicellular part; MD, mediodorsal nucleus of thalamus; LD, lateral dorsal nucleus of thalamus; LP, lateral posterior nucleus of thalamus; VM|CM, ventral and central medial nuclei of thalamus.
- https://cdn.elifesciences.org/articles/78620/elife-78620-supp1-v1.xlsx
-
Supplementary file 2
List of all significant features from VM|CM region listed by their names and feature scores in order of significance.
- https://cdn.elifesciences.org/articles/78620/elife-78620-supp2-v1.xlsx
Download links
A two-part list of links to download the article, or parts of the article, in various formats.
Downloads (link to download the article as PDF)
Open citations (links to open the citations from this article in various online reference manager services)
Cite this article (links to download the citations from this article in formats compatible with various reference manager tools)
Neuromodulation of striatal D1 cells shapes BOLD fluctuations in anatomically connected thalamic and cortical regions
eLife 12:e78620.
https://doi.org/10.7554/eLife.78620


