Regulation of presynaptic Ca2+ channel abundance at active zones through a balance of delivery and turnover
- The Picower Institute for Learning and Memory, Department of Biology, Department of Brain and Cognitive Sciences, Massachusetts Institute of Technology, United States
Figures
Figure 1 with 1 supplement
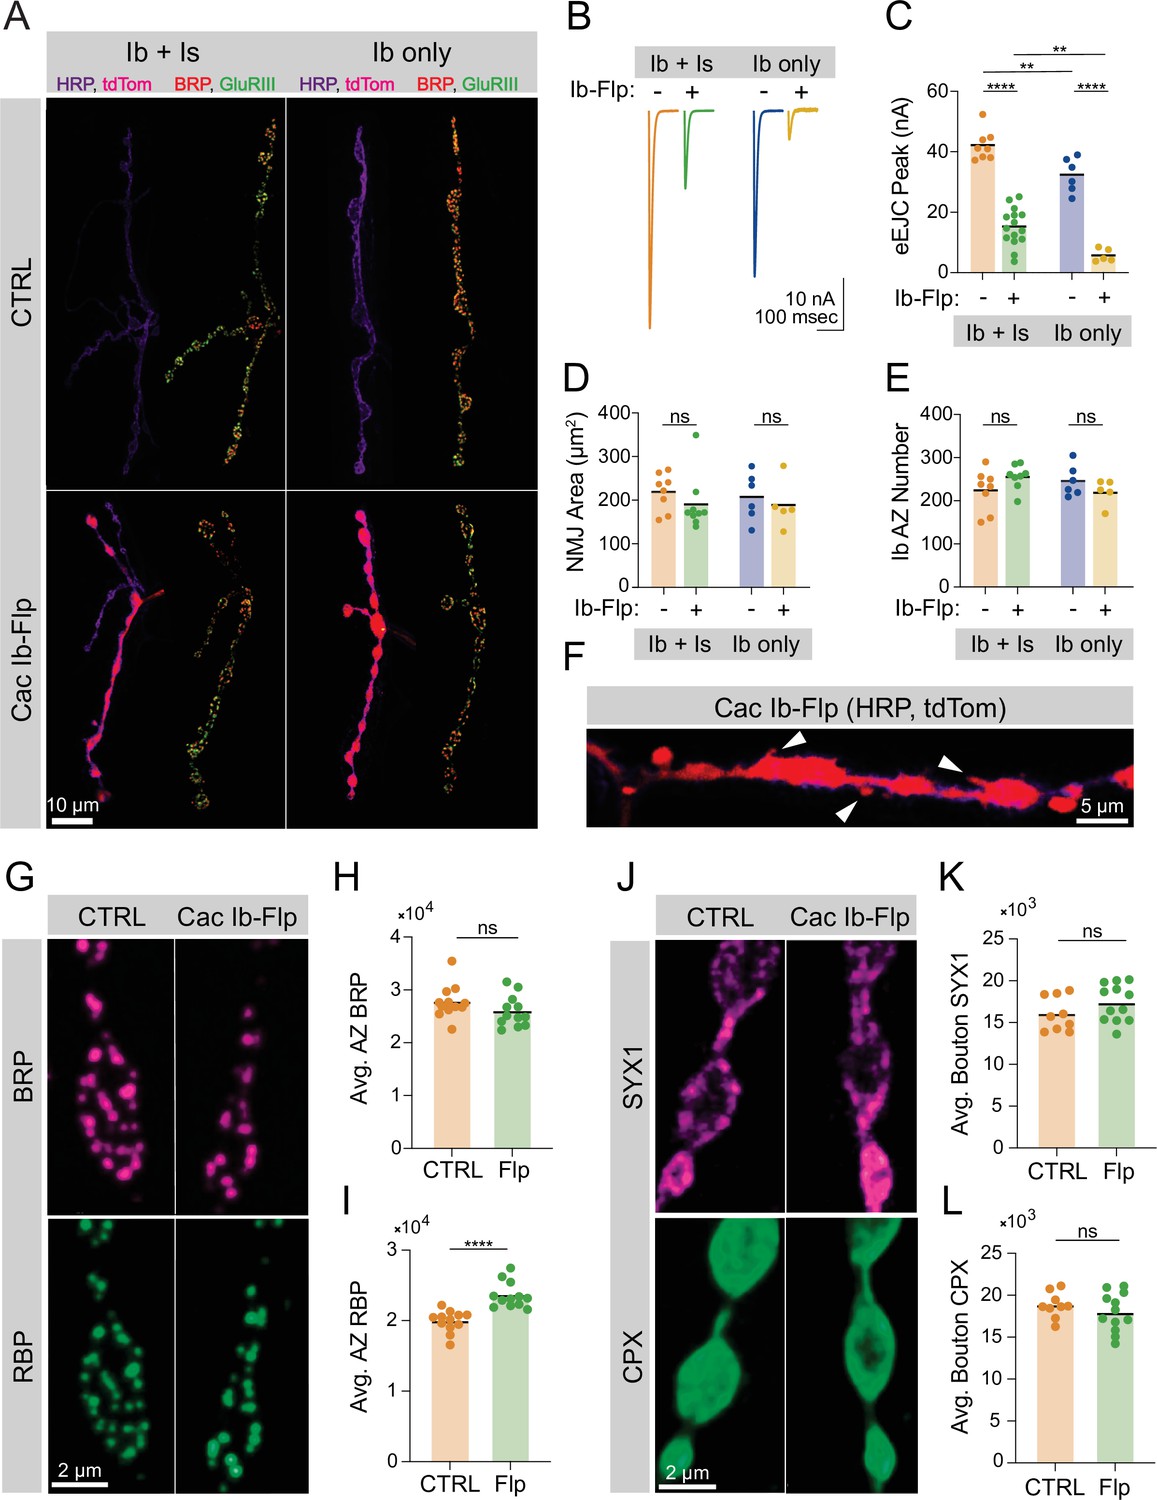
Ca2+ channels are not required for active zone (AZ) seeding or scaffold accumulation.
(A) Representative images of control neuromuscular junctions (NMJs) with both Ib and Is motoneurons co-innervating muscle 1 (top left), or muscle 1 with only Ib innervation (top right), and Is and cac-flipped Ib neurons co-innervating muscle 1 (bottom left) or cac-flipped Ib neurons with no Is present (bottom right). The flip-reporter tdTomato (magenta) and HRP (neuronal membranes; purple) were imaged prior to fixation (left panels). After fixation, NMJs were immunostained for Bruchpilot (BRP) (red) and GluRIII (green) to label AZs and PSDs, respectively (right panels). (B, C) Average traces and evoked amplitudes (peak current, nA) from the indicated genotypes (co-innervated controls: orange, 42.11±1.757, n=8 NMJs from 6 animals; co-innervated CacIb-flp: green, 15.13±1.607, n=15 NMJs from 12 animals, p<0.0001; Ib-only controls: blue, 32.32±2.329, n=6 NMJs from 6 animals; Ib-only CacIb-flp: gold, 5.749±0.9544, n=5 NMJs from 5 animals, p<0.0001). (D) Neuronal (HRP-stained) area of Ib synapses (co-innervated controls: orange, 219.1±15.15, n=8 NMJs from 6 animals; co-innervated CacIb-flp: green, 190.4±21.12, 9 NMJs from 8 animals; Ib-only controls: blue, 207.8±22.4, n=6 NMJs from 6 animals; Ib-only CacIb-flp: gold, 189±24.59, n=5 NMJs from 5 animals). (E) Number of AZs formed by Ib synapses (co-innervated controls: orange, 224.3±16.88; co-innervated CacIb-flp: green, 255.1±10.13; Ib-only controls: blue, 245.8±14.73; Ib-only CacIb-flp: gold, 220.4±13.47). (F) Some NMJs lacking Cac display ectopic filopodia extending from boutons (white arrowheads). (G) Representative images of cac-flipped NMJs stained with anti-BRP (magenta) and anti-RIM-binding protein (RBP) (green). (H) Quantification of BRP abundance. Each point represents the average fluorescence intensity across the AZ population of a single NMJ (CTRL: orange, 27,736±900.2, n=12 NMJs from 6 animals; CacIb-flp: green, 25,943±843.7, n=12 NMJs from 6 animals). (I) Quantification of RBP abundance (CTRL: orange, 19,910±439.2; CacIb-flp: green, 23,593±530.6, p<0.0001). (J) Representative images of cac-flipped animals stained for syntaxin 1 (SYX1) (magenta) and complexin (CPX) (green). (K) Quantification of SYX1 abundance. Each point represents the average fluorescence intensity across the bouton population of a single NMJ (CTRL: orange, 16,028±683.5, n=9 NMJs from 5 animals; CacIb-flp: green, 17365±643.4, n=12 NMJs from 6 animals). (L) Quantification of CPX abundance (CTRL: orange, 18,810±509.4; CacIb-flp: green, 17,961±663.5).
-
Figure 1—source data 1
Source data for Figure 1.
- https://cdn.elifesciences.org/articles/78648/elife-78648-fig1-data1-v2.xlsx
Figure 1—figure supplement 1
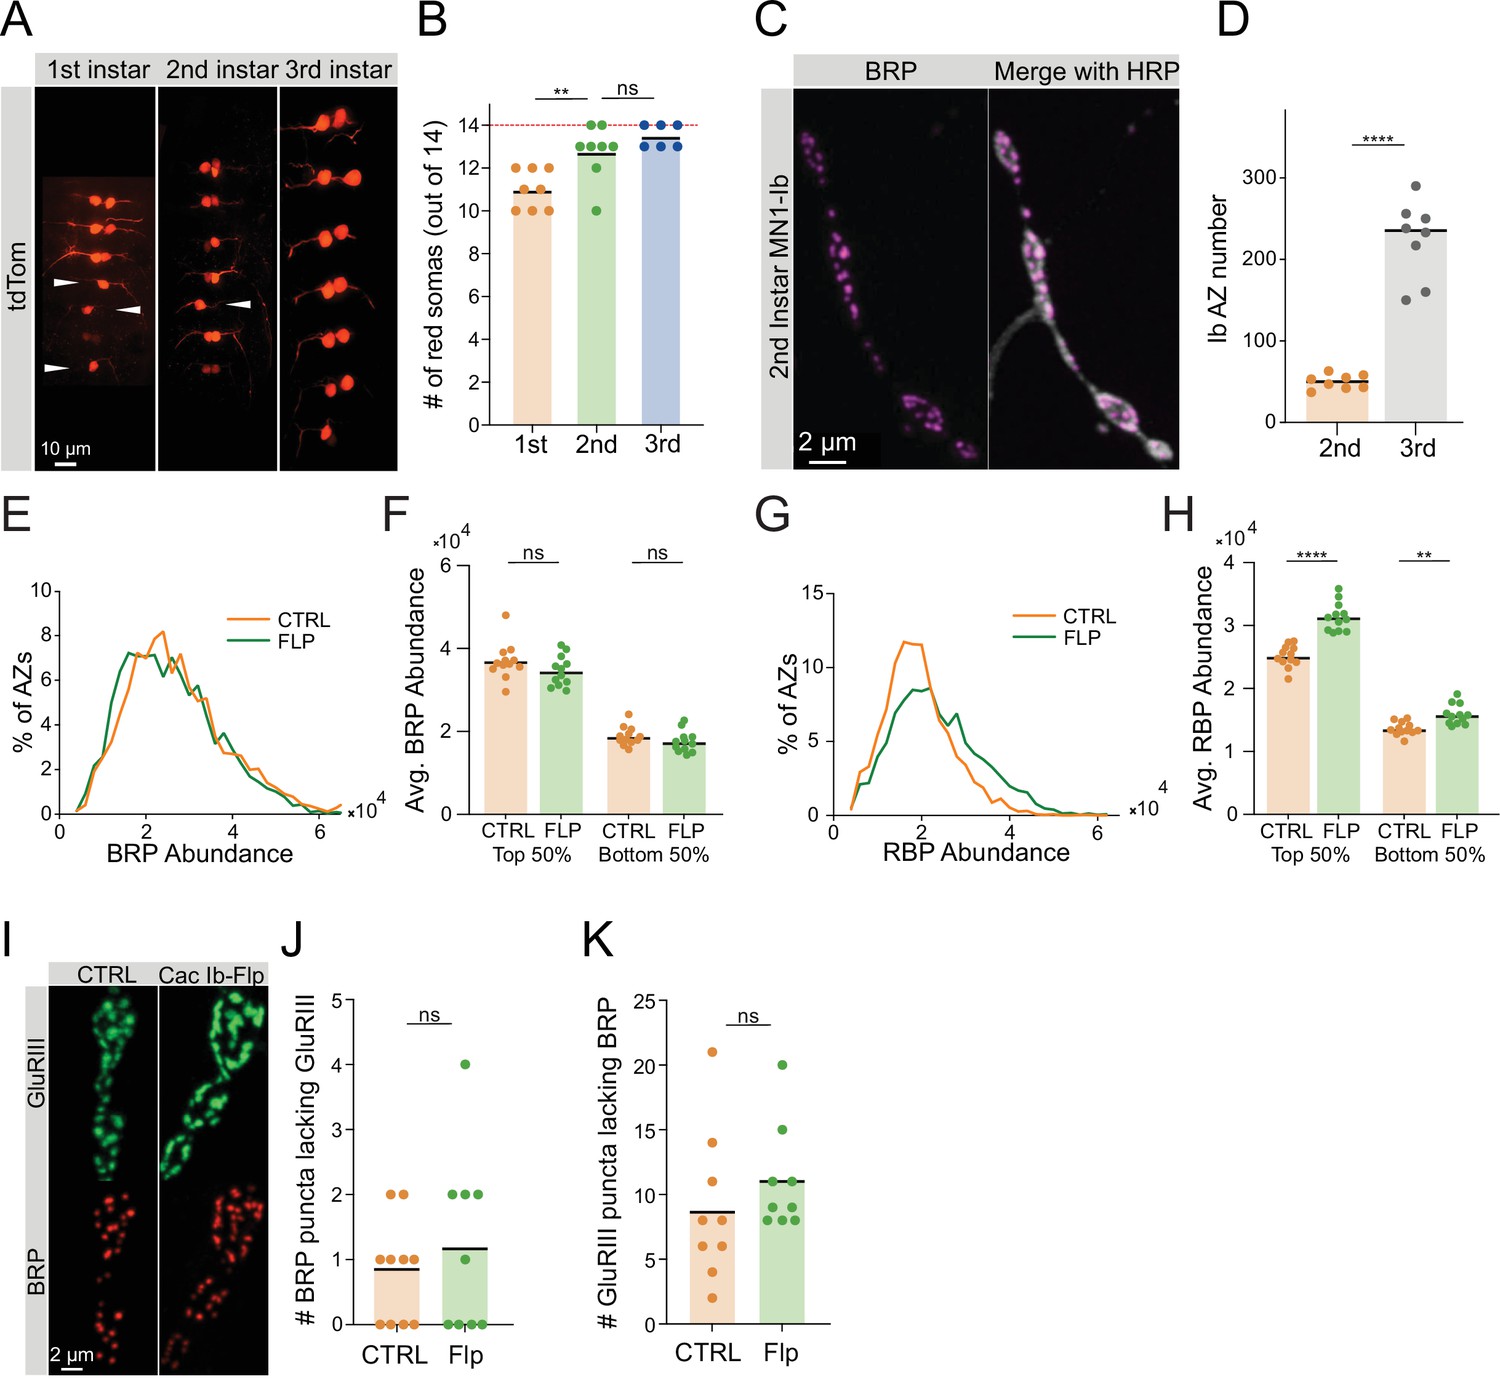
Characterization of Cac-flipping.
(A) Representative ventral nerve cords (VNCs) in 1st, 2nd, and 3rd instar larvae expressing the tdTomato reporter in MN1-Ib cell bodies of neurons that have undergone a cac-flip event in abdominal segments A1-A7. White arrowheads indicate hemisegments that have not flipped. (B) Quantification of the number of MN1-Ib somas (out of 14 total neurons) expressing the tdTomato reporter in 1st, 2nd, and 3rd instar VNCs (1st: 11±0.3273, n=8 VNCs; 2nd: 12.75±0.4532, n=8 VNCs, p<0.01; 3rd: 13.5±0.2236, n=6 VNCs). (C) Representative images of MN1-Ib NMJs in the 2nd instar stage stained with Bruchpilot (BRP) and HRP. (D) Quantification of Ib active zone (AZ) number at the 2nd instar stage (orange) with 3rd instar MN1-Ib AZ number (gray) from Figure 1E for comparison (2nd: 49.75±3.155, n=8 neuromuscular junctions (NMJs); 3rd: 224.3±16.88, N=8 NMJs, p<0.0001). (E) Distribution of BRP abundance (max pixel intensity per AZ) across the AZ population in control and cac-flipped NMJs, quantified from images in Figure 1G. (F) Average AZ BRP abundance (per NMJ) for the highest BRP-enriched 50% of AZs and the least BRP-enriched 50% of AZs in control and cac-flip NMJs, quantified from images in Figure 1G (control top 50%: 36,937±1264; Flp top 50%: 34,615±1056; control bottom 50%: 18,874±647.8; Flp bottom 50%: 17,539±740.6). (G) Distribution of RIM-binding protein (RBP) abundance (max pixel intensity per AZ) across the AZ population in control and cac-flipped NMJs, quantified from images in Figure 1G. (H) Average AZ RBP abundance (per NMJ) for the highest RBP-enriched 50% of AZs and the least RBP-enriched 50% of AZs in control and cac-flipped NMJs, quantified from images in Figure 1G (control top 50%: 25,130±500.2; Flp top 50%: 31,376±654.6, p<0.01; control bottom 50%: 13,630±301.6; Flp bottom 50%: 15,853±464.9, p<0,0001). (I) Representative images of control and cac-flipped AZs stained for GluRIII and BRP, acquired from the dataset in Figure 1A–F. (J) Quantification of the number of BRP-positive AZs per NMJ lacking GluRIII signal in control and cac-flipped neurons (control: 0.8±0.2494, n=10 NMJs; Flp: 1.222±0.4648, n=9 NMJs). (K) Quantification of the number of GluRIII-positive PSDs per NMJ lacking BRP signal in control and cac-flipped neurons (control: 8.889±1.925; Flp: 11±1.354).
-
Figure 1—figure supplement 1—source data 1
Source data for Figure 1—figure supplement 1.
- https://cdn.elifesciences.org/articles/78648/elife-78648-fig1-figsupp1-data1-v2.xlsx
Figure 2

Bruchpilot (BRP) and Cac display distinct active zone (AZ) accumulation trajectories.
(A) Representative muscle 4 neuromuscular junctions (NMJs) (stained with anti-HRP) in long-lived larvae (phm-GAL4 >UAS-torso-RNAi) at 6 and 16 days of larval life. (B) Synaptic (HRP stained) area at muscle 4 NMJs on day 6 and day 16 (D6: orange, 169.5±16.03, n=8 NMJs from 6 animals; D16: green, 316.9±13.64, n=8 NMJs from 6 animals, p<0.0001). (C) BRP-positive AZ number at muscle 4 NMJs on day 6 and day 16 (D6: orange, 261.6±20.02, D16: green, 504.8±25.86, p<0.0001). (D, E) Average EJC traces and representative mEJC traces at muscle 6 NMJs on day 6 and day 16. (F) Average evoked amplitudes (peak current, nA) (D6: orange, 38.27±4.421, n=8 NMJs from 6 animals; D16: green, 78.35±5.476, n=8 NMJs from 6 animals, p<0.0001). (G) Average mEJC peak amplitude (nA) (D6: 0.4862±0.01891; D16: 0.6843±0.9284, p<0.0001). (H) Quantal content (D6: 78.41±8.012; D16: 116.4±10.35, p=0.0116). (I) Average mini frequency (D6: 1.617±0.2448, D16: 2.748±0.3335, p=0.0161). (J) Representative synaptic boutons with endogenously tagged Cac-GFP (green) and BRP (magenta). (K) Sum Cac abundance per NMJ (D6: 30,486,042±2,547,718, n=8 NMJs from 6 animals; D16: 59,296,888±3,909,993, n=8 NMJs from 6 animals, p<0.0001). (L) Average AZ Cac-GFP signal intensity at NMJs on day 6 and day 16 (D6: 15,058±746.1; D16: 16,296±290.9). (M) Histogram showing distribution of Cac-GFP intensities across the AZ population at day 6 and day 16 NMJs. (N) Sum BRP abundance per NMJ (D6: 27,664,071±4,206,865; D16: 87,502,172±6,434,001, p<0.0001). (O) Average AZ BRP abundance per NMJ (D6: 11,132±1350; D16: 17,985±1178, p<0.01). (P) Histogram showing distribution of BRP intensities across the AZ population at day 6 and day 16 NMJs. (Q) Representative images of muscle 4 Ib NMJs showing Cac-GFP (green) and BRP (magenta). The white bracket marks the terminal bouton. (R) AZ Cac abundance at inner boutons versus terminal boutons, with each point representing the maximum fluorescent pixel intensity for one AZ (Inner: 15,879±213, n=1951 AZs; Terminal: 19,617±415.1, n=612 AZs, p<0.0001). (S) Distribution of AZ Cac-GFP intensities across the AZ population in inner boutons versus terminal boutons. (T) Average AZ Cac intensity for inner boutons versus terminal boutons. Inner boutons and terminal boutons from a single NMJ are connected with a line. (U) BRP abundance at AZs of inner versus terminal boutons (Inner: 23,009±262.8, n=1917 AZs; Terminal: 24,210±504.1, n=602 AZs). (V, W) BRP intensity distributions and pairwise comparisons of inner versus terminal boutons.
-
Figure 2—source data 1
Source data for Figure 2.
- https://cdn.elifesciences.org/articles/78648/elife-78648-fig2-data1-v2.xlsx
Figure 3 with 2 supplements
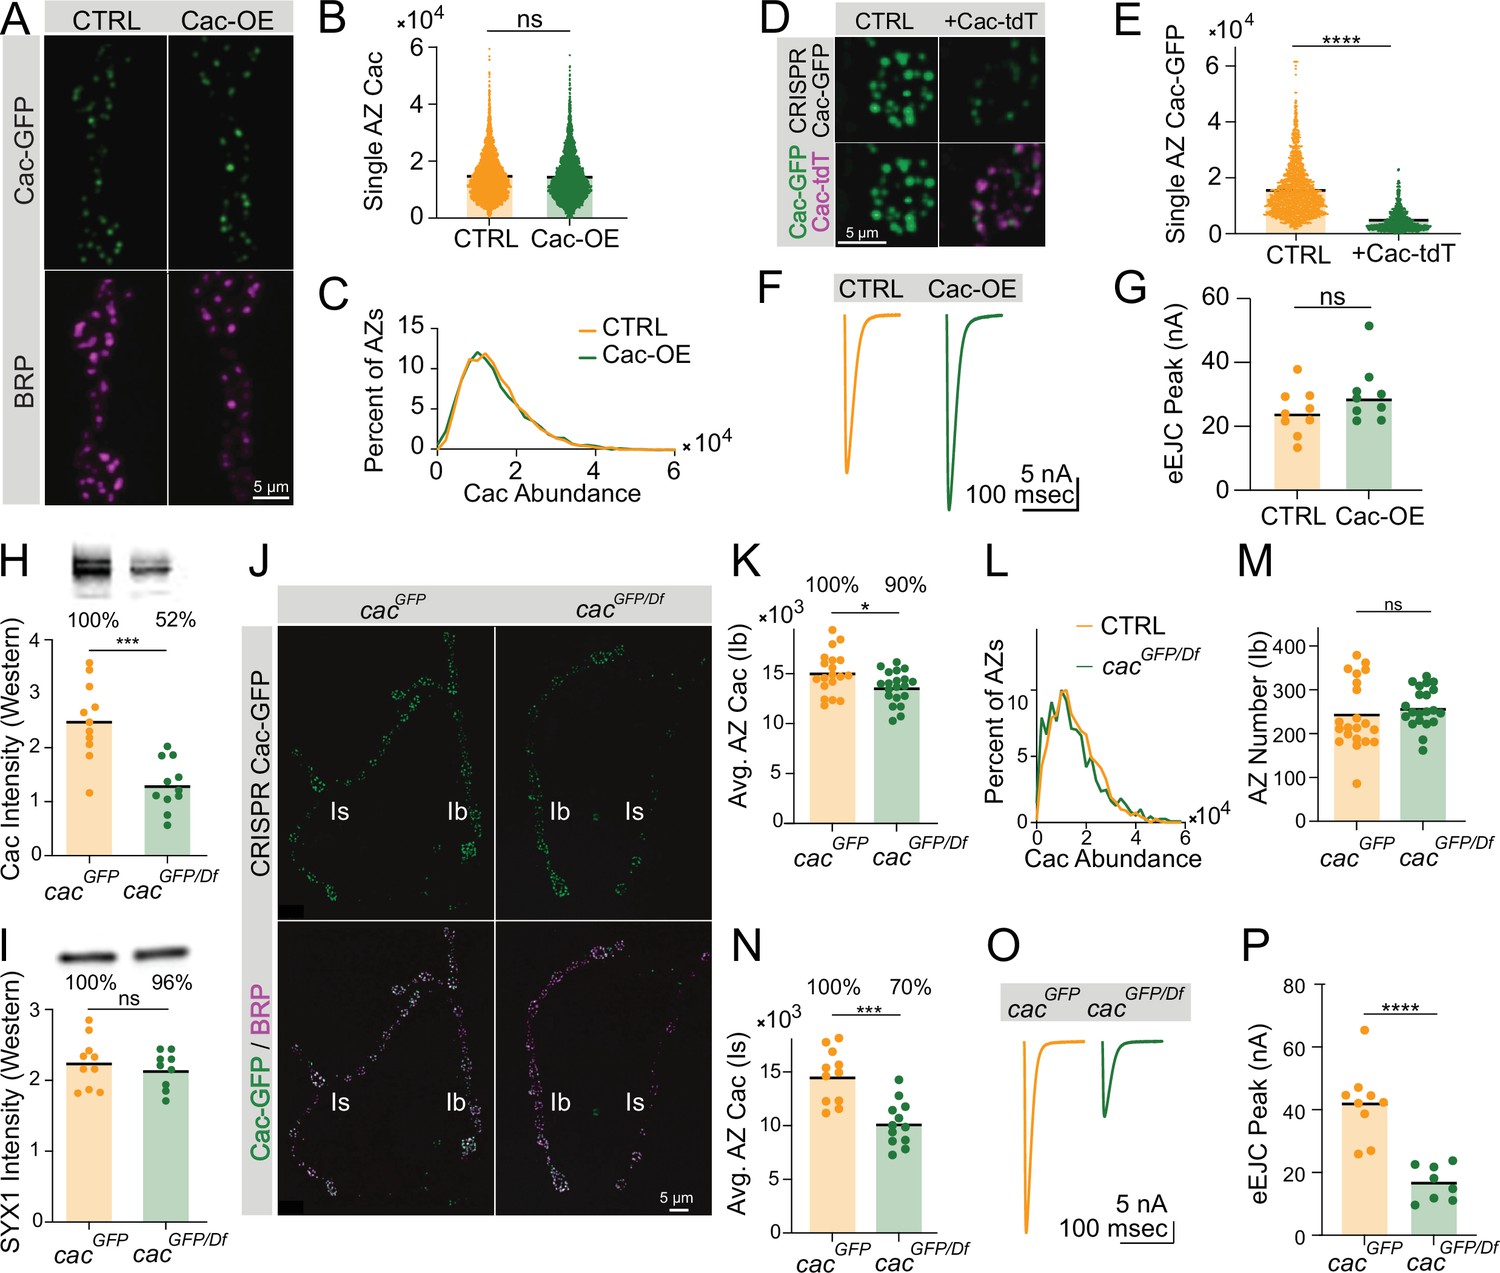
Active zone (AZ) Cac accumulation is regulated downstream of Cac biosynthesis.
(A) Representative images of Cac-GFP (green) and Bruchpilot (BRP) (magenta) at muscle 4 for endogenously C-terminally tagged Cac-GFP controls (cacGFP(C),C155/cacGFP(C)) and Cac overexpression animals (cacGFP(C),C155/cacGFP(C),UAS-Cac-GFP). (B) Quantification of AZ Cac intensity in control versus Cac overexpression neuromuscular junctions (NMJs). Each point represents the maximum Cac-GFP pixel intensity of a single AZ (control: 14617±130.8, n=3663 AZs from 10 NMJs from 6 animals; Cac OE: 14,383±148.2, n=3145 AZs from 10 NMJs from 6 animals). (C) Distribution of AZ Cac-GFP abundance across the AZ population in control versus Cac overexpression NMJs. (D) Representative images of endogenously tagged Cac-GFP (green) and overexpressed Cac-tdTomato (magenta) at AZs in control (cacGFP,C155) versus Cac-tdTomato overexpression (cacGFP,C155;UAS-Cac-tdT). (E) Quantification of AZ Cac-GFP intensity with and without Cac-tdTomato overexpression (control: 15,339±232, n=1613 AZs, Cac-tdT: 4477±123.9, n=850 AZs, p<0.0001). (F, G) Average traces and evoked peak currents (nA) at muscle 6 in Cac overexpression and control animals (control: 24.45±2.433, n=9 NMJs from 5 animals; Cac OE: 30.11±3.046, n=9 NMJs from 5 animals). (H, I) Quantifications and representative images of Western blots of adult head extracts from cacGFP/Df heterozygotes and cacGFP controls (n=11 samples, extracts from 5 adult heads per sample). Each point in H represents Cac intensity in one lane (cacGFP: 25,092±2146; cacGFP/Df: 13,055±1403, p<0.001). Each point in I represents syntaxin 1 (SYX1) intensity in one lane (cacGFP: 224,900±11,239; cacGFP/Df: 214,889±86,96). Representative images for Cac and SYX are shown above each quantification. (J) Representative images of endogenous Cac-GFP (green) and BRP (magenta) at muscle 4 AZs in cacGFP/Df heterozygotes and cacGFP controls. Ib and Is terminals are labeled in white. (K) Quantification of average Cac-GFP AZ abundance per MN4-Ib NMJs (cacGFP: 15,105±486.3, n=19 NMJs from 7 animals; cacGFP/Df: 13,617±365.9, n=21 NMJs from 7 animals, p<0.05). (L) Histogram of Cac-GFP intensity across the AZ population in cacGFP/Df heterozygotes and cacGFP controls at MN4-Ib NMJs. (M) BRP-positive AZ number per MN4-Ib NMJ (cacGFP: 243.4±17.05; cacGFP/Df: 260.3±9.963). (N) Quantification of average AZ Cac-GFP intensity per Is innervation of muscle 4 NMJs (cacGFP: 14,621±747.5, n=11 NMJs from 7 animals; cacGFP/Df: 10,219±601 n=12 NMJs from 7 animals, p<0.001). (O, P) Average traces and evoked peak currents (nA) at muscle 6 in cacGFP/Df heterozygotes and cacGFP controls (cacGFP: 41.96±3.879, n=9 NMJs from 5 animals; cacGFP/Df: 16.7±1.984, n=8 NMJs from 7 animals, p<0.0001).
-
Figure 3—source data 1
Source data for Figure 3.
- https://cdn.elifesciences.org/articles/78648/elife-78648-fig3-data1-v2.xlsx
-
Figure 3—source data 2
Western regions used for Figure 3.
- https://cdn.elifesciences.org/articles/78648/elife-78648-fig3-data2-v2.pdf
-
Figure 3—source data 3
Western for Figure 3.
- https://cdn.elifesciences.org/articles/78648/elife-78648-fig3-data3-v2.pdf
Figure 3—figure supplement 1
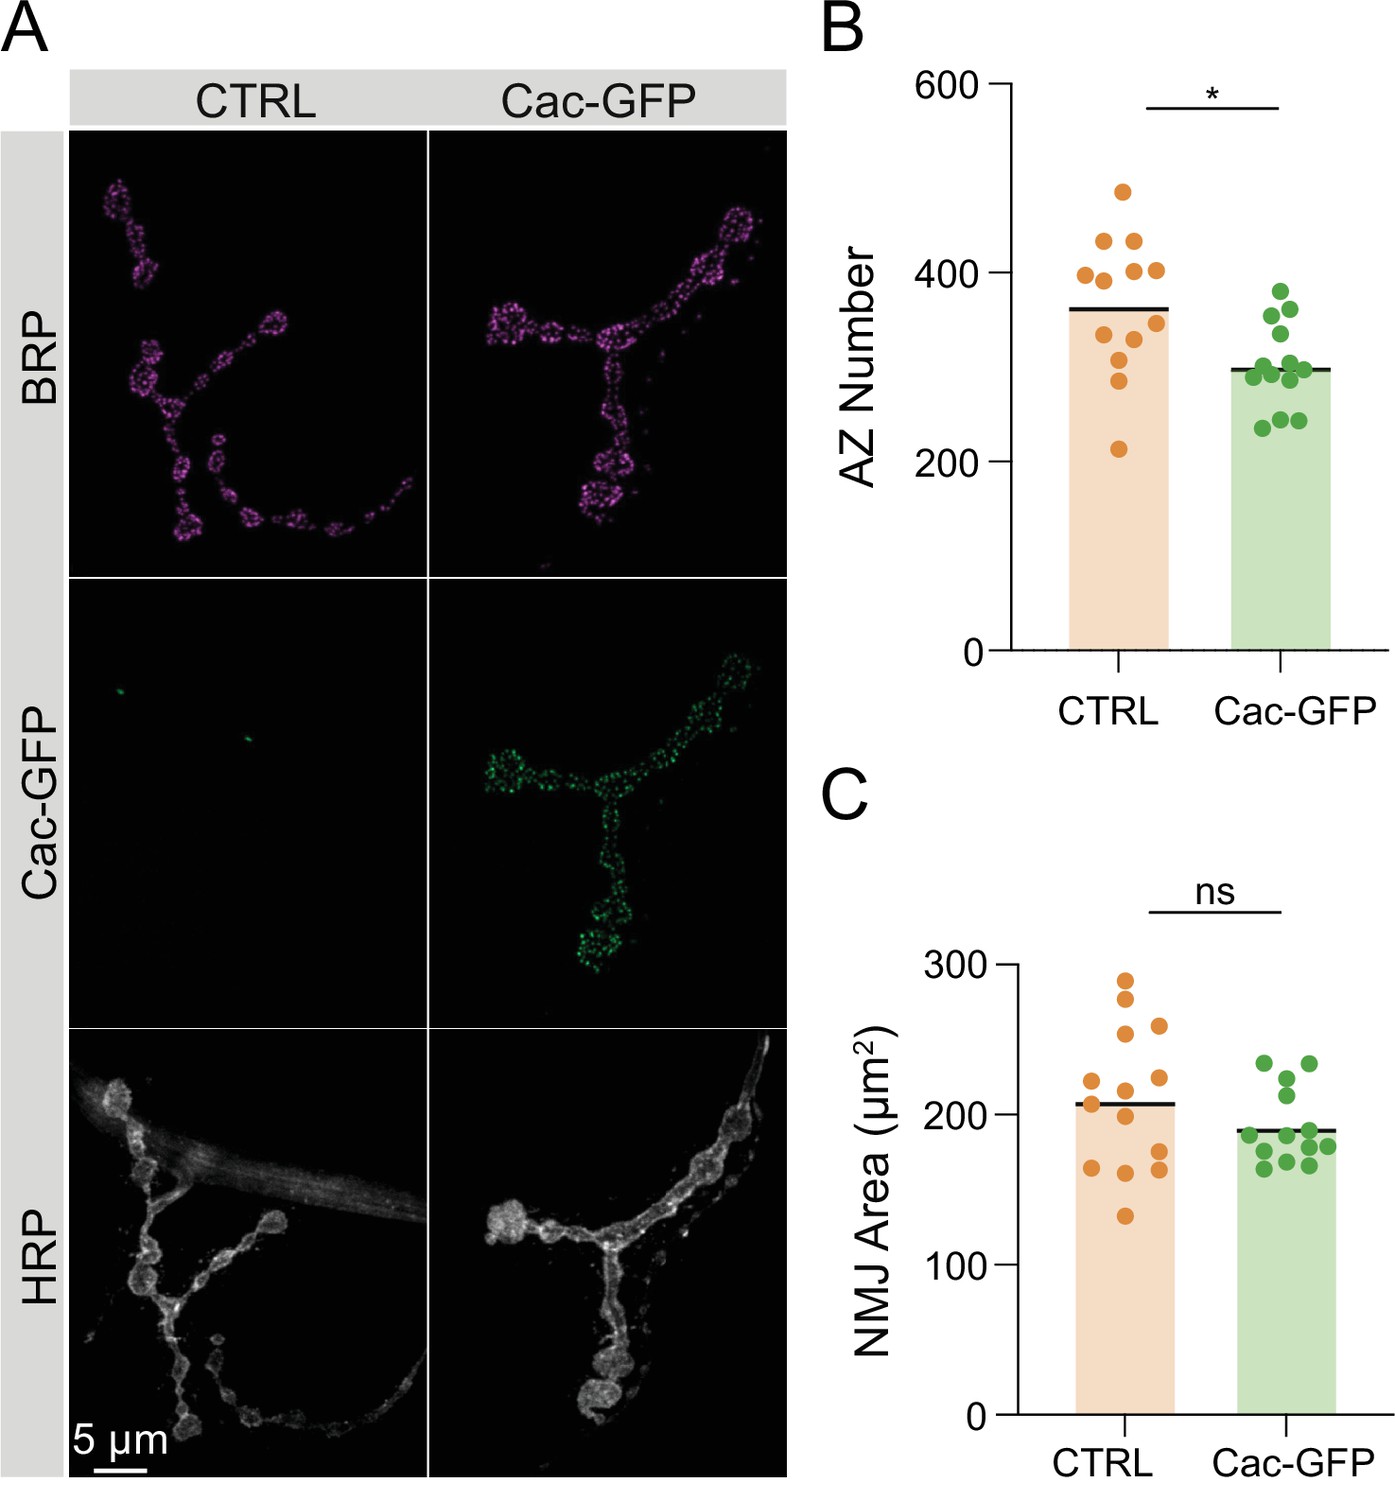
Synaptic morphology of Cac-GFP C-terminal CRISPR-tagged larvae.
(A) Representative images of muscle 4 neuromuscular junctions (NMJs) stained for Bruchpilot (BRP) and HRP in control animals and animals expressing endogenously C-terminally tagged Cac-GFP (cacGFP(C)). (B) Active zone (AZ) number in control and cacGFP(C) muscle 4 NMJs (control: 365.8±20.17, n=13 NMJs; cacGFP(C): 301.6±12.72, n=13 NMJs, p=0.0127). (B) NMJ area at control and cacGFP(C) muscle 4 NMJs (control: 207.1±12.54; cacGFP(C): 189.2±6.94).
-
Figure 3—figure supplement 1—source data 1
Source data for Figure 3—figure supplement 1.
- https://cdn.elifesciences.org/articles/78648/elife-78648-fig3-figsupp1-data1-v2.xlsx
Figure 3—figure supplement 2
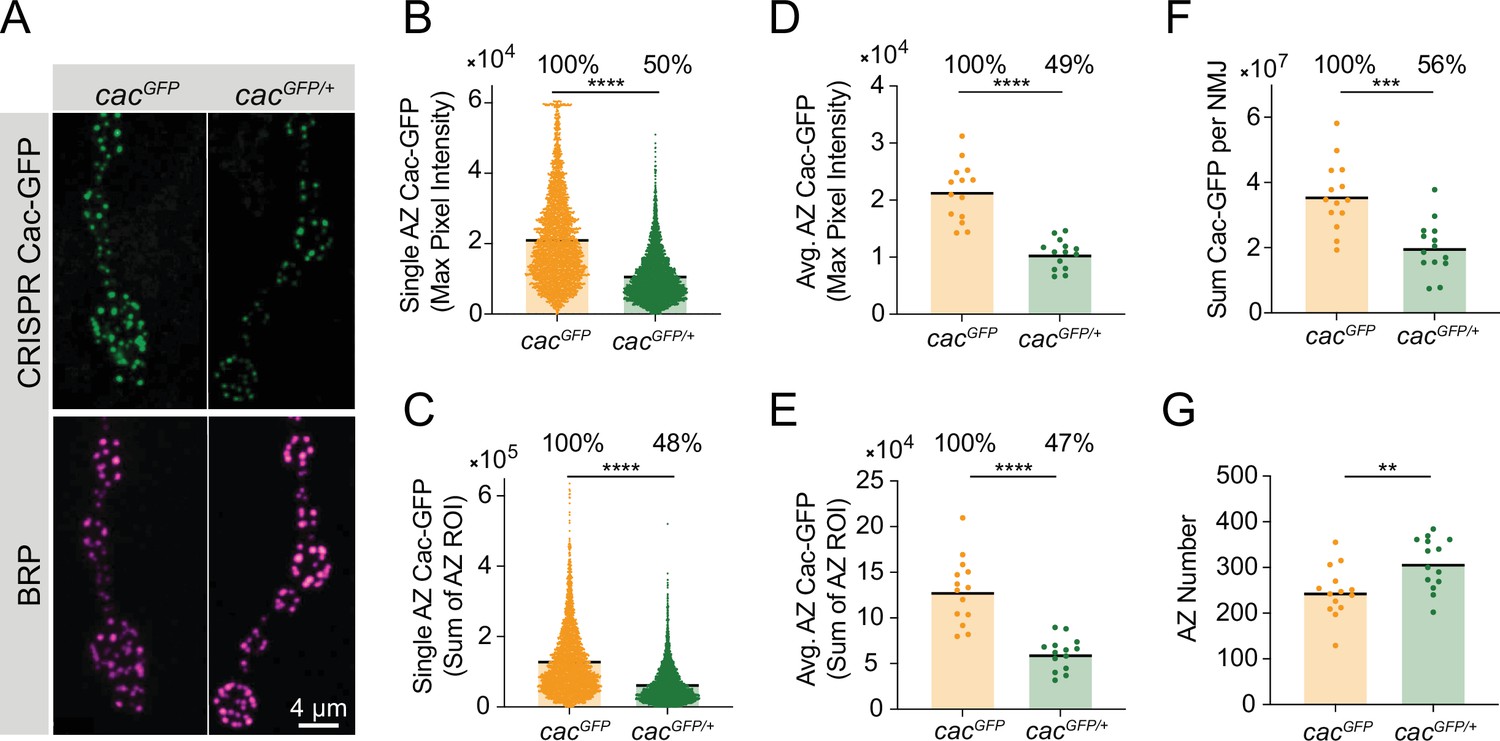
Quantitative imaging control.
(A) Representative images of Cac-GFP at active zones (AZs) in female larvae homozygous for CRISPR-tagged Cac-GFP (cacGFP, left) and heterozygous for CRISPR-tagged Cac-GFP (cacGFP/+, right). Bruchpilot (BRP) immunostaining was used to identify AZs (magenta). (B) Quantification of single AZ Cac abundance using max pixel intensity per AZ (cacGFP: 21,181±218.3, n=3452 AZs; cacGFP/Df: 10,505±111.5, n=3,976 AZs, p<0.0001). (C) Sum AZ Cac abundance, with each point representing the sum of Cac-GFP fluorescence in an ROI encompassing a single AZ (cacGFP: 127,105±172, n=3157 AZs; cacGFP/Df: 60,865±859.1, n=3818 AZs, p<0.0001). (D) Average AZ Cac abundance per NMJ, with each point representing the average of max pixel intensities of the population of AZs at one NMJ (cacGFP: 21,434±1366, n=14 NMJs; cacGFP/Df: 10,552±686.2, n=14 NMJs, p<0.0001). (E) Average AZ Cac per NMJ, with each point representing the average of sum pixel intensities of the population of AZs at a single NMJ (cacGFP: 129,806±9724; cacGFP/Df: 60,724±4723, p<0.0001). (F) Total Cac at each NMJ (cacGFP: 36,003,272±2,818,383; cacGFP/Df: 20,063,946±2175784, p<0.001). (G) AZ number at each NMJ (cacGFP: 246.6±14.82; cacGFP/Df: 309.8±15.02, p<0.006).
-
Figure 3—figure supplement 2—source data 1
Source data for Figure 3—figure supplement 2.
- https://cdn.elifesciences.org/articles/78648/elife-78648-fig3-figsupp2-data1-v2.xlsx
Figure 4 with 1 supplement
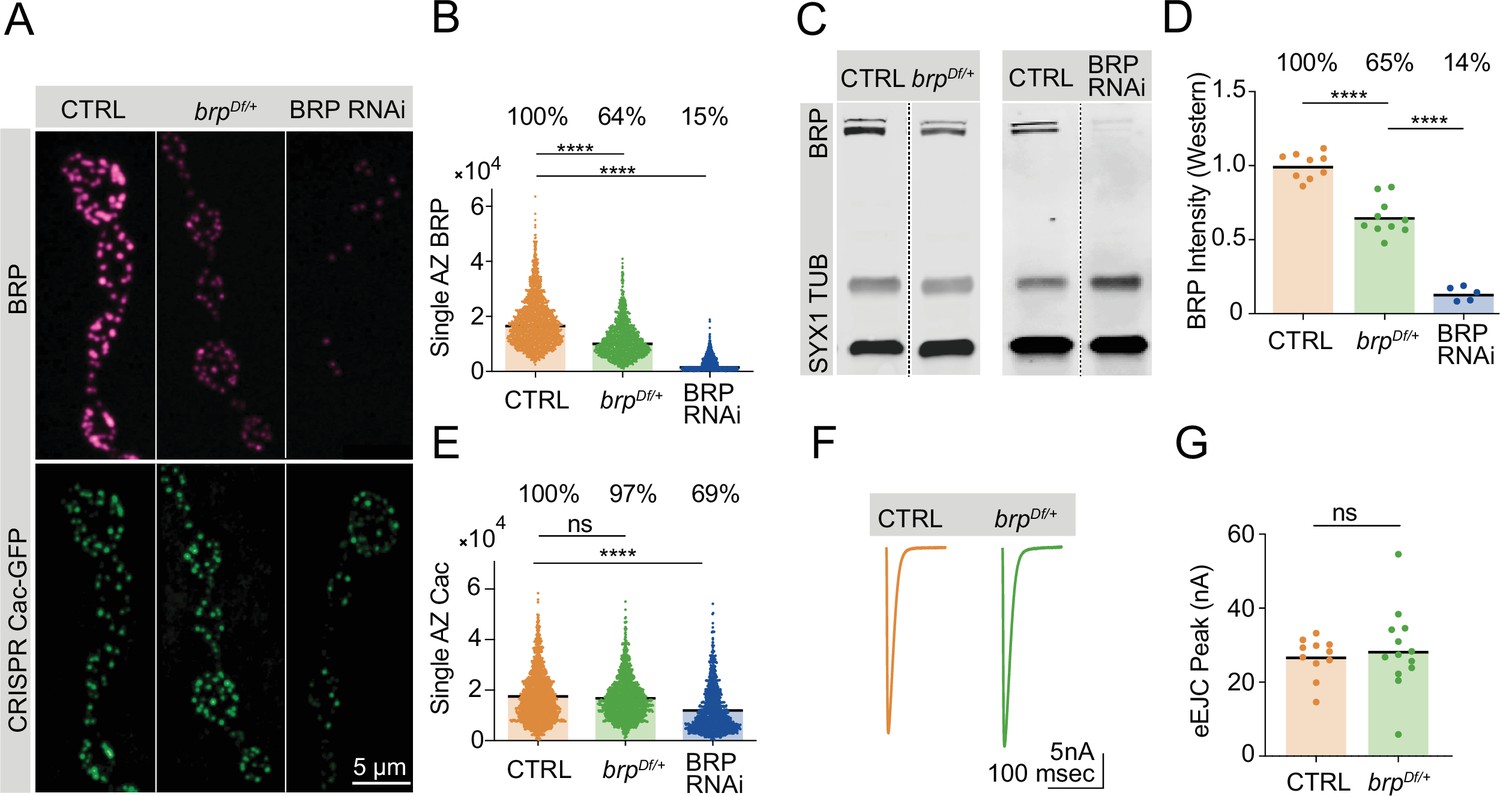
Bruchpilot (BRP) biosynthesis rate-limits active zone (AZ) BRP incorporation.
(A) Representative images of BRP and endogenously tagged Cac-GFP at AZs in controls, brpDf/+ heterozygotes and pan-neuronally (elav-GAL4) expressed BRP RNAi. (B) Quantification of single AZ BRP intensity, with average AZ BRP intensity listed as a percent of control above each genotype (control: 18,161±210.7, n=1779 AZs; brpDf/+: 11,534±176.7, n=1350 AZs, p<0.0001; BRP RNAi: 2806±79.91, n=1140 AZs, p<0.0001). (C) Representative image of Western blots of adult head extracts from control and brpDf/+ heterozygotes (left panel), and control and pan-neuronally expressed BRP RNAi animals (right panel) stained for syntaxin 1 (SYX1) (loading control), Tubulin, and BRP. (D) Quantification of BRP intensity in Western blots of the indicated genotypes. Each point represents BRP intensity in one lane, with BRP intensity normalized to the SYX1 loading control. Percent of protein abundance compared to control (100%) is shown above each genotype (control: 1.0±0.02912, n=9 lanes; brpDf/+: 0.6518±0.03862, n=10 lanes, p<0.0001; BRP RNAi: 0.1366±0.02117, n=5 lanes, p<0.0001). (E) Quantification of endogenously tagged Cac-GFP intensity at single AZs in controls, brpDf/+ heterozygotes, and pan-neuronally expressed BRP RNAi (control: 17,268±232.4, n=1757 AZs; brpDf/+: 16,788±217, n=1403 AZs; BRP RNAi: 11,959±259, n=1140 AZs, p<0.0001). (F, G) Average traces and quantified evoked peak currents (nA) in control and brpDf/+ heterozygotes at muscle 6 (control: 26.78±1.632, n=11 neuromuscular junctions (NMJs); brpDf/+: 28.71±3.105, n=13 NMJs).
-
Figure 4—source data 1
Source data for Figure 4.
- https://cdn.elifesciences.org/articles/78648/elife-78648-fig4-data1-v2.xlsx
-
Figure 4—source data 2
Western for Figure 4 panel C - BRP deficiency heterozygote.
- https://cdn.elifesciences.org/articles/78648/elife-78648-fig4-data2-v2.pdf
-
Figure 4—source data 3
Western regions used for Figure 4 panel C - BRP RNAi.
- https://cdn.elifesciences.org/articles/78648/elife-78648-fig4-data3-v2.pdf
Figure 4—figure supplement 1
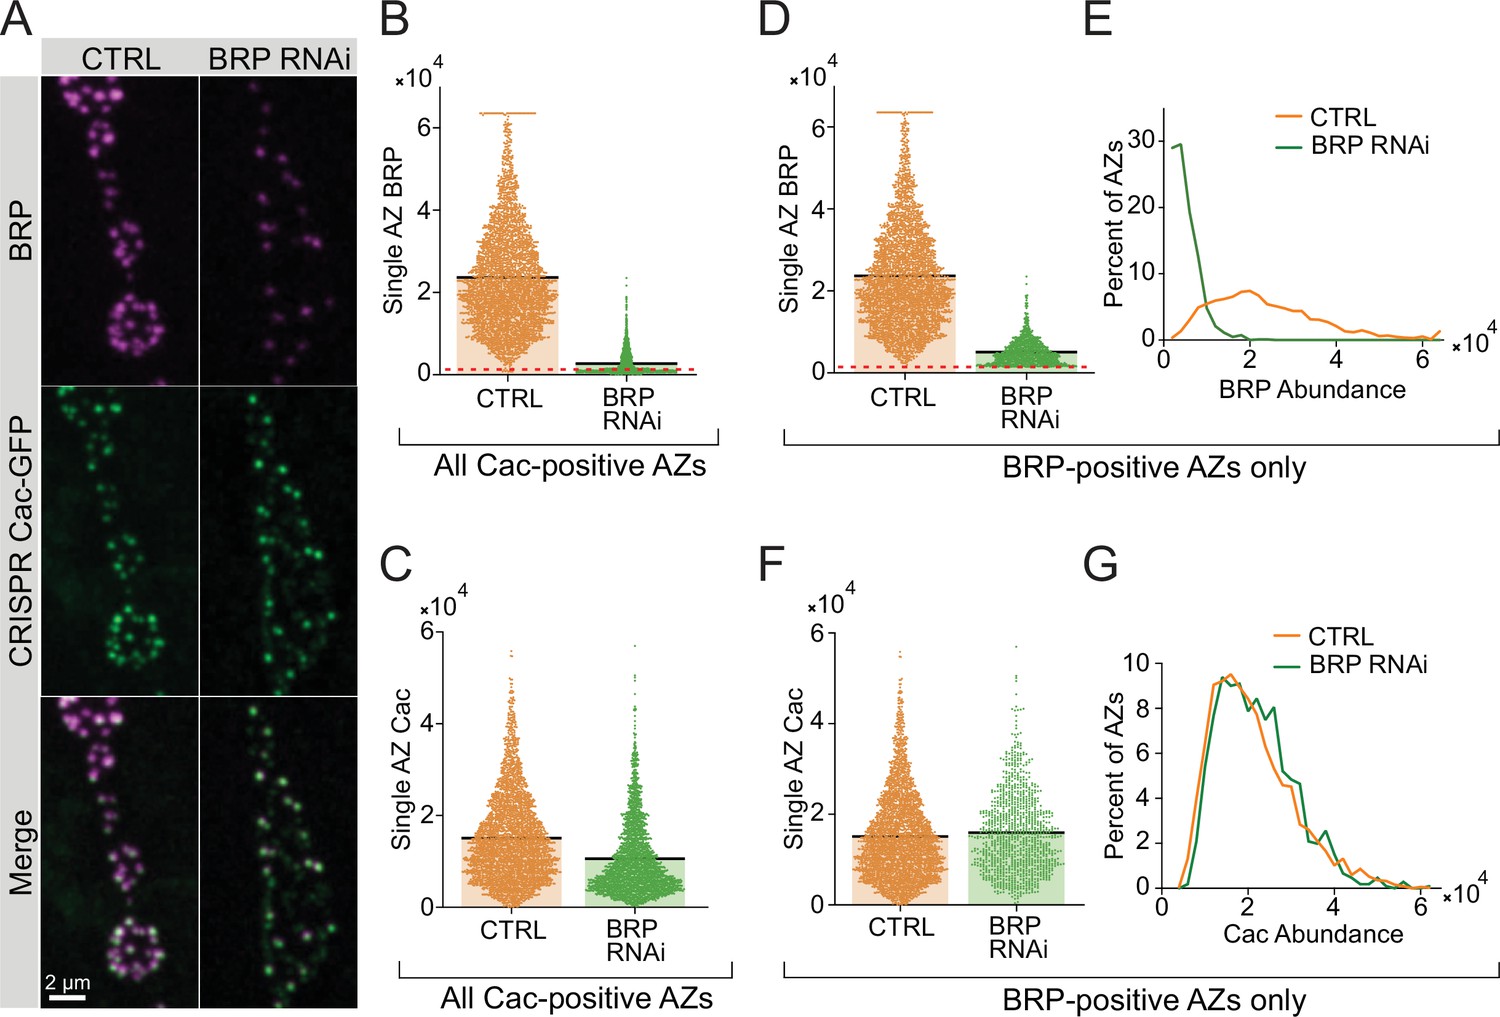
Single active zone (AZ) analysis of Cac and Bruchpilot (BRP) following BRP RNAi knockdown.
(A) Representative images of endogenously tagged Cac-GFP (green) and BRP (magenta) in control (C155, cacGFP) and BRP RNAi (C155, cacGFP; UAS-BRP-RNAi) neuromuscular junctions (NMJs). (B) Quantification of single AZ BRP abundance (max pixel intensity per AZ) at control and BRP RNAi NMJs. AZs are defined by Cac-positive puncta. AZs below the red dotted line have zero measurable BRP (control: 23,623±230.1, n=3037 AZs; BRP RNAi: 2742±61.27, n=2363 AZs). (C) Quantification of single AZ Cac abundance (max pixel intensity per AZ) at all Cac-positive sites at control and BRP RNAi NMJs (control: 15,059±172.6; BRP RNAi: 10,592±165.9). (D, E) Quantification and histogram of single AZ BRP abundance (max pixel intensity) for all BRP-positive AZs (control: 23,691±229.7, n=3028 AZs; BRP RNAi: 5093±96.25, n=1055 AZs). (F,G) Quantification and histogram of single AZ Cac abundance (max pixel intensity) for all BRP-positive AZs (control: 15,090±172.8; BRP RNAi: 15,933±269.8).
-
Figure 4—figure supplement 1—source data 1
Source data for Figure 4—figure supplement 1.
- https://cdn.elifesciences.org/articles/78648/elife-78648-fig4-figsupp1-data1-v2.xlsx
Figure 5 with 1 supplement
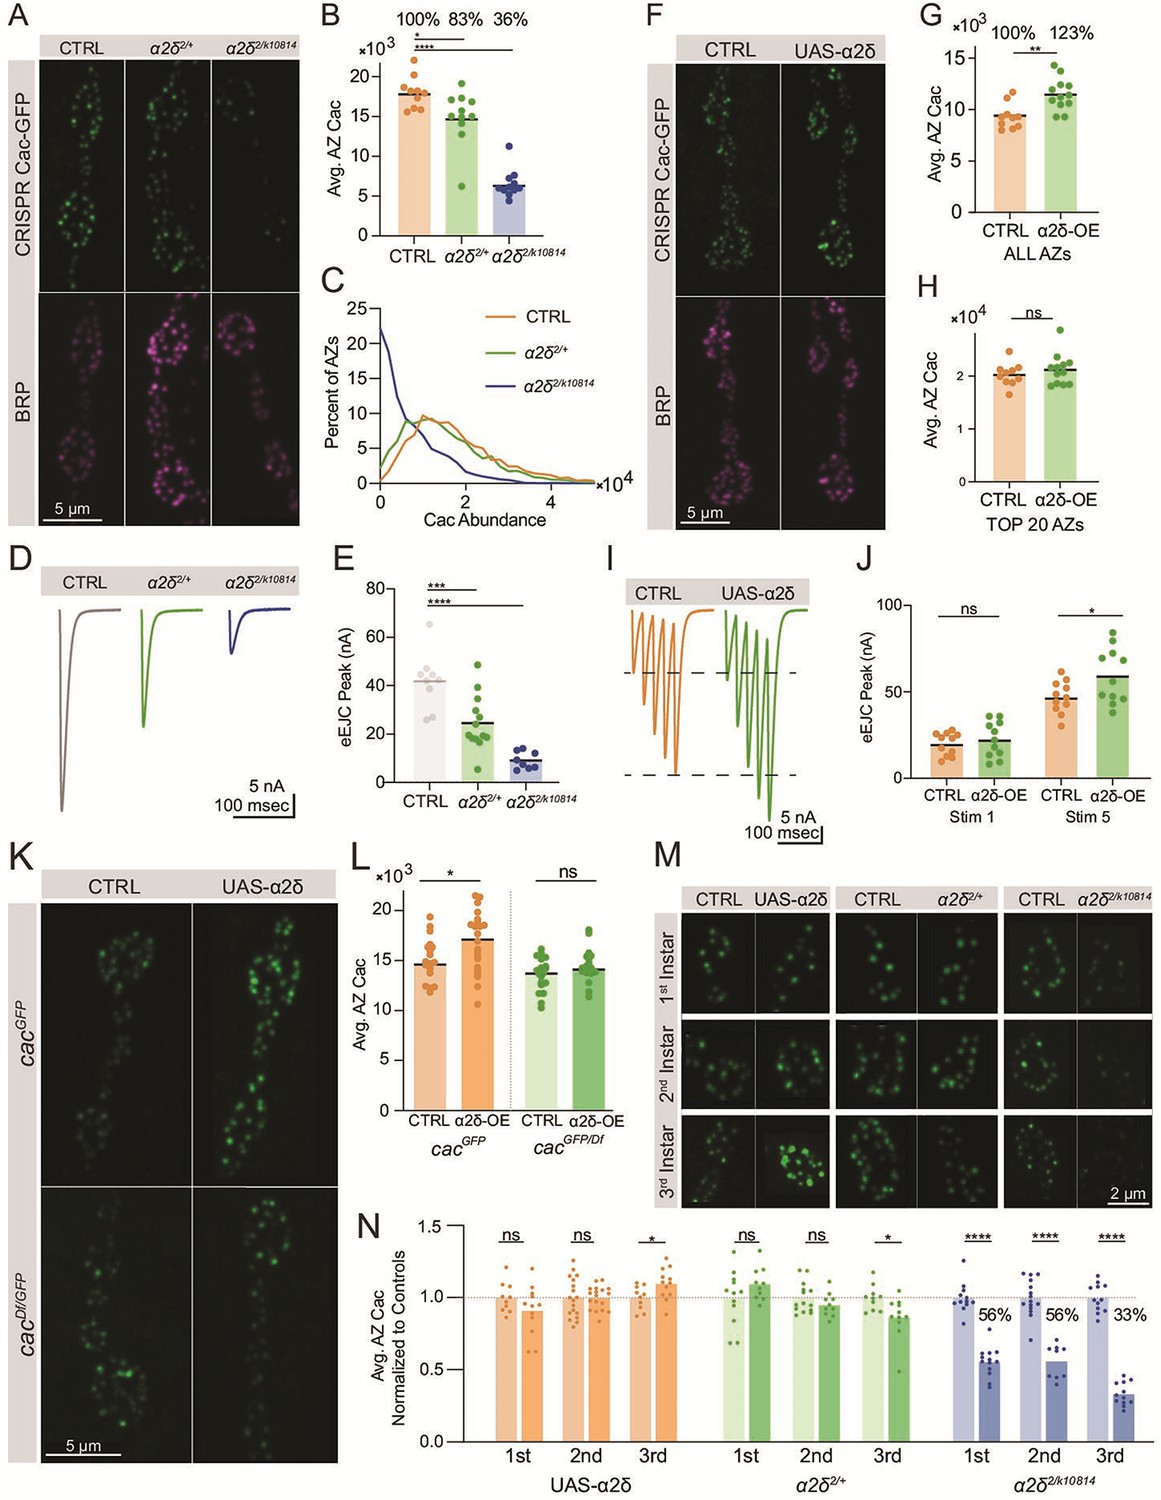
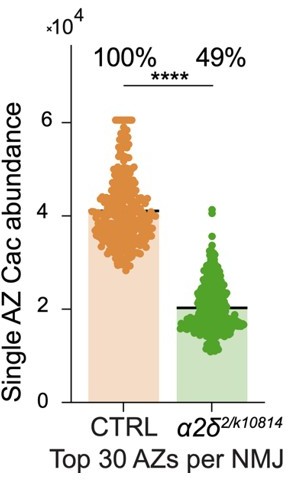
Cac accumulation at active zones (AZs) is dosage sensitive to the α2δ subunit.
(A) Representative images of endogenously tagged Cac-GFP (green) and Bruchpilot (BRP) (magenta) in controls (cacGFP), α2δ null heterozygotes (cacGFP;α2δ2/+) and α2δ2/k10814 transheterozygotes (cacGFP;α2δ2/k10814). (B) Quantification of average AZ Cac-GFP fluorescence of neuromuscular junctions (NMJs) in each genotype. Cac abundance as a percent of control levels is shown above each genotype (control: 18,007±641.1, n=10 NMJs from 5 animals; α2δ2/+: 14,926±1014, n=11 NMJs from 6 animals, p=0.0174; α2δ2/k10814: 6542±541.3, n=11 NMJs from 6 animals, p<0.0001). (C) Frequency distribution of single AZ Cac-GFP intensity across the AZ population in each genotype. (D, E) Average traces and quantified evoked peak current (nA) at muscle 6 for each genotype. Recordings were collected in combination with cacGFP/Df heterozygotes (Figure 3P) and the control is replicated here in gray for ease of comparison (control: 41.96±3.879, n=9 NMJs; α2δ2/+: 24.53±3.133, n=13 NMJs, p<0.001; α2δ2/k10814: 9.161±1.268, n=8 NMJs, p<0.0001). (F) Representative images of endogenously tagged Cac-GFP (green) and BRP (magenta) in control (cacGFP,C155) and α2δ overexpression animals (cacGFP,C155;;UAS-α2δ). (G) Average AZ Cac abundance per NMJ (control: 9332±388.6, n=10 NMJs from 5 animals; α2δ OE: 11497±449.8, n=12 NMJs from 6 animals, p=0.0019). (H) Average of top 20 brightest AZs per NMJ (control: 22,996±752.5; α2δ OE: 24,823±1011). (I, J) Average traces and quantified 1st and 5th stimulus evoked peak current at muscle 6 in 0.25 mM external Ca2+ for controls and α2δ overexpression animals (control 1st: 19.87±1.98, n=11 NMJs; α2δ OE 1st: 22.45±3.127, n=11 NMJs; control 5th: 46.82±2.794; α2δ OE 5th: 59.21±4.839, p=0.0249). (K, L) Representative images and quantification of endogenously tagged Cac-GFP with (right) and without (left) α2δ overexpression in either control (top) or cacGFP/Df heterozygous (bottom) NMJs (cacGFP,C155: 15,105±486.3, n=19 NMJs; cacGFP,C155;UAS-α2δ/+: 17,142±814.4, n=15 NMJs, p<0.0225; cacDf/cacGFP,C155: 13,617±365.9, n=20 NMJs; cacDf/cacGFP,C155;UAS-α2δ/+: 14,895±587, n=12 NMJs). (M, N) Representative images and quantification of average AZ Cac intensity per NMJ of endogenously tagged Cac-GFP in 1st, 2nd, and 3rd instar muscle 4 Ib NMJs in α2δ overexpression, α2δ2/+, and α2δ2/k10814 animals. Each pairwise comparison was normalized so that the control average is 1.0 (α2δ-OE 1st: 0.9125±0.0496, n=12 NMJs; α2δ-OE 2nd: 1±0.019, n=18 NMJs; α2δ-OE 3rd: 1.098±0,03132, n=12 NMJs, p=0.0296; α2δ2/+1st: 1.096±0.0361, n=10 NMJs; α2δ2/+ 2nd: 0.9525±0.02574, n=10 NMJs; α2δ2/+ 3rd, p=0.0213; 0.8661±0.04408, n=11 NMJs; α2δ2/k10814 1st: 0.5569±0.02853, n=15 NMJs, p<0.0001; α2δ2/k10814 2nd: 0.5619±0.03902, n=9 NMJs, p<0.0001; α2δ2/k10814 3rd: 0.3344±0.02298, n=12 NMJs, p<0.0001).
-
Figure 5—source data 1
Source data for Figure 5.
- https://cdn.elifesciences.org/articles/78648/elife-78648-fig5-data1-v2.xlsx
Figure 5—figure supplement 1
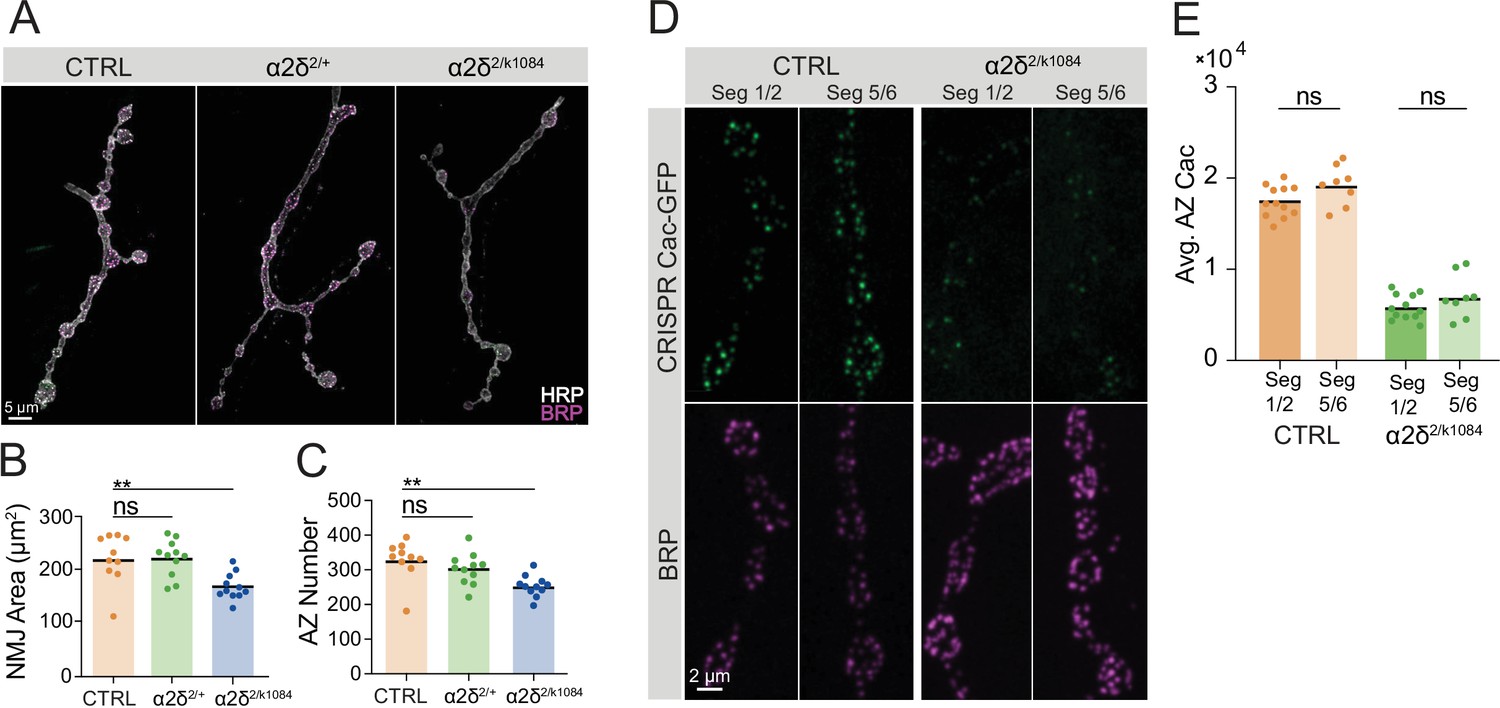
α2δ’s role in regulating neuromuscular junction (NMJ) morphology is not dosage-sensitive and its Cac localization phenotype is independent of axon length.
(A) Representative images of MN4-Ib synapses stained for HRP (white) and Bruchpilot (BRP) (magenta) in control, α2δ2/+ and α2δ2/k10814 NMJs. (B) NMJ area quantified for each genotype (control: 218±14.65, n=10 NMJs from 5 animals; α2δ+/-: 218.6±10.23, n=11 NMJs from 6 animals, α2δ2/k10814: 166±7.378, n=11 NMJs from 6 animals, p<0.01). (C) Active zone (AZ) number quantified for each genotype (control: 328±18.27; α2δ2/+: 302.2±13.68; α2δ2/k10814: 253±9.159, p<0.01). (D) Representative images of muscle 4 NMJs expressing endogenously tagged Cac-GFP and stained for BRP in control and α2δ2/k10814 animals in segment 1 or 2 (left panels) and segment 5 or 6 (right panels). (E) Quantification of average AZ Cac abundance per NMJ (control 1/2: 17,447±492.9, n=12 NMJs; control 5/6: 19,189±767.7, n=8 NMJs; α2δ2/k10814 1/2: 5834±401, n=12 NMJs; α2δ2/k10814 5/6: 6996±844.1, n=8 NMJs).
-
Figure 5—figure supplement 1—source data 1
Source data for Figure 5—figure supplement 1.
- https://cdn.elifesciences.org/articles/78648/elife-78648-fig5-figsupp1-data1-v2.xlsx
Figure 6 with 1 supplement

Cac delivery to active zones (AZs) correlates with AZ size and is regulated by α2δ.
(A) Representative images of FRAP experiments in CTRL (cacGFP) and α2δ mutant (cacGFP;α2δ2/k10814) neuromuscular junctions (NMJs). Fixed and Bruchpilot (BRP)-immunostained (magenta) NMJs are shown 24 hr post-bleaching, with unbleached NMJs as a control. Boutons inside white boxes are enlarged. (B) Percent of BRP-positive AZs with Cac-GFP max pixel intensity greater than 150% of average background fluorescence (pre: 95.56±0.9347; 0H: 90.37±2.347, p=0.0422). (C) Distribution of single AZ Cac-GFP intensity (sum Cac-GFP fluorescence within an ROI encompassing each BRP-positive AZ) in unbleached NMJs (UNBL) and 24 hr after bleaching (pre: 13,6052±3018, n=946 AZs; 24H: 72,261±1389, n=804 AZs). (D, E) Correlations of Cac-GFP and BRP at individual AZs in unbleached controls (D) and NMJs 24 hr post-bleach (E). (F) Pearson r value for the correlation of Cac-GFP and BRP intensity across the AZ population at each NMJ in unbleached control NMJs (UNBL) and 24 hr post-bleach (pre: 0.8801±0.01191; 24H: 0.7913±0.01348, p<0.001). (G) Average AZ Cac-GFP intensity in unbleached segments in cacGFP and α2δ2/k10814 NMJs (cacGFP: 136,462±6346, n=11 NMJs; α2δ2/k10814: 44,340±3252, n=12 NMJs, p<0.0001). (H) Average AZ Cac-GFP intensity 24 hr post-bleach (cacGFP: 70,528±3508, n=9 NMJs; α2δ2/k10814: 31,086±2326, n=8 NMJs, p<0.0001). (I) AZ number at NMJs (cacGFP: 88.26±4.13, n=19 NMJs; α2δ2/k10814: 92.45±3.689, n=20 NMJs). (J, K) Correlation of Cac-GFP and BRP at individual AZs in unbleached α2δ2/k10814 mutants (J) and α2δ2/k10814 NMJs 24 hr post-bleach (K). (L) Pearson r value for the correlation of Cac-GFP and BRP intensity across the AZ population in unbleached NMJs (UNBL) and NMJs 24 hr post-bleach in α2δ2/k10814 mutants (UNBL: 0.7952±0.01635; 24H: 0.7285±0.01955, p=0.018).
-
Figure 6—source data 1
Source data for Figure 6.
- https://cdn.elifesciences.org/articles/78648/elife-78648-fig6-data1-v2.xlsx
Figure 6—figure supplement 1
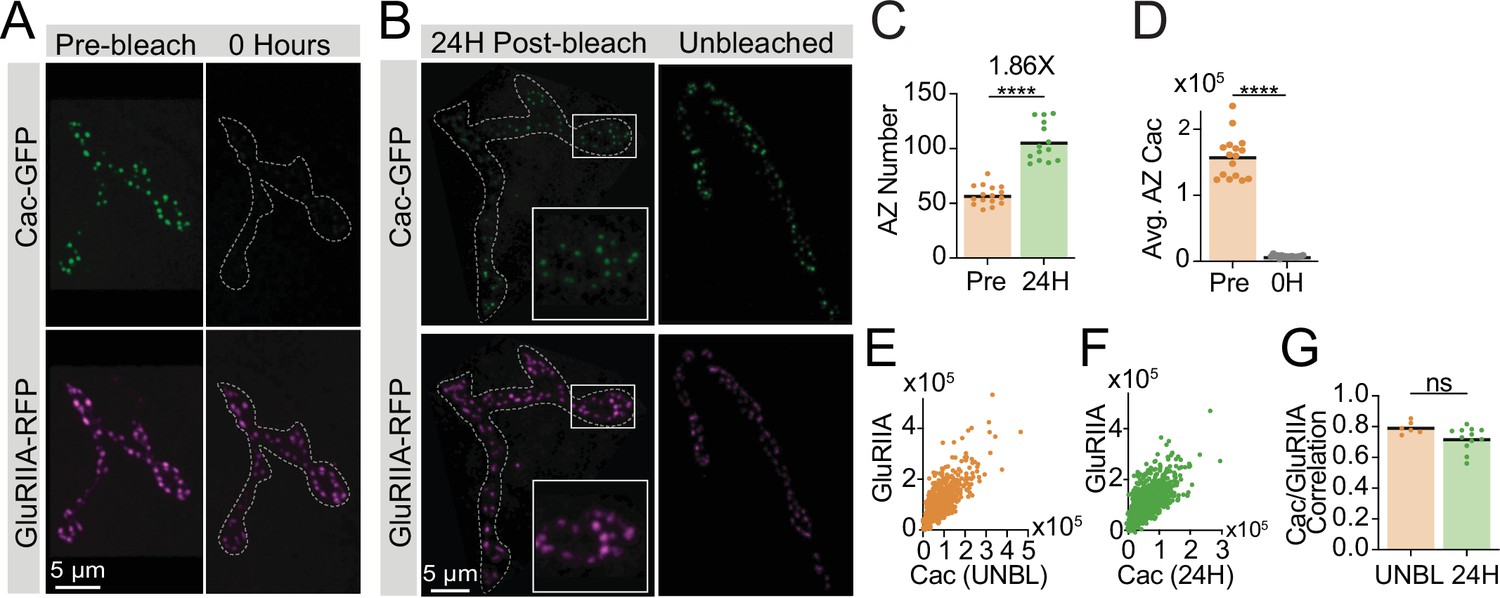
Photobleaching validation and GluRIIA correlations.
(A) Representative images of muscle 26 in intravitally imaged late 2nd instar larvae expressing endogenously tagged Cac-GFP (green) and GluRIIA-RFP (magenta) before (left column; pre-bleach) and immediately after (right column; 0 hr) Cac-GFP photobleaching. In the 0 hr timepoint, the neuromuscular junction (NMJ) is outlined with a white dotted line. (B) Representative images of the NMJ shown in panel A (left column) after fixation – NMJ area outlined in white. Right column is an NMJ from an unbleached segment of the same animal, used as a control. (C) Active zone (AZ) number (number of GluRIIA-RFP puncta) in pre-bleach and 24 hr post-bleach NMJs, with fold-increase in AZ number shown above (pre: 57.31±2.198, n=16 NMJs; 24H: 106±4.716, n=14 NMJs, p<0.0001). (D) Average AZ Cac fluorescence (intravital) for each NMJ pre-bleach and immediately after bleaching (0H), measured as sum pixel intensity of an ROI encompassing each GluRIIA-positive receptor field (pre: 158,514±8197; 0H: 7609±446.8, p<0.0001). (E, F) Correlations of Cac-GFP and GluRIIA-RFP at individual AZs in unbleached controls (E) and 24 hr post-bleach (F). (G) Pearson r value for the correlation of Cac-GFP and GluRIIA intensity across the AZ population at each NMJ in control segments (unbleached; UNBL) and 24 hr post-bleach (UNBL: 0.792±0.01618, n=6 NMJs; 24H: 0.7222±0.02212, n=12 NMJs).
-
Figure 6—figure supplement 1—source data 1
Source data for Figure 6—figure supplement 1.
- https://cdn.elifesciences.org/articles/78648/elife-78648-fig6-figsupp1-data1-v2.xlsx
Figure 7 with 1 supplement
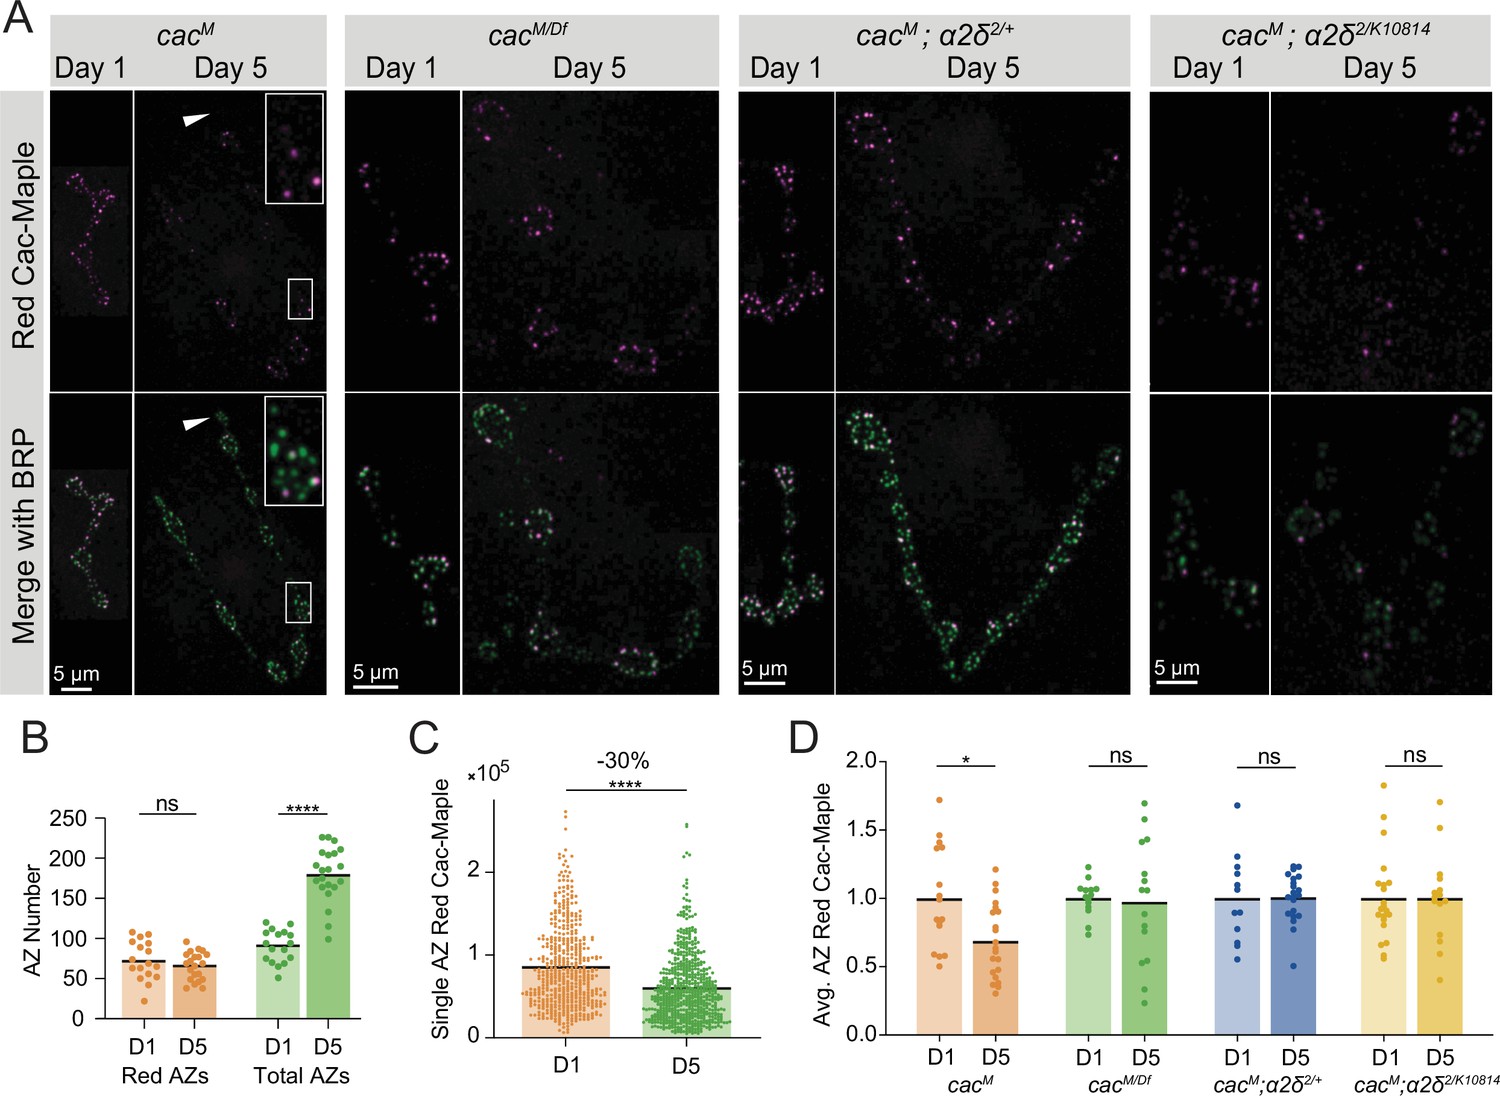
Cac turnover at active zones (AZs) is abolished by reductions in either Cac or α2δ expression.
(A) Representative images of endogenously tagged photoconverted Cac-Maple (magenta) and Bruchpilot (BRP) (green, overlapping with green unconverted Cac-Maple for reliable AZ identification) in controls (cacM), cacM/Df heterozygotes, α2δ2/+ heterozygotes (cacM;α2δ2/+), and α2δ2/k10814 mutants (cacM;α2δ2/k10814) at 1 and 5 days after photoconversion.
Boutons in white box are enlarged in control panel, and white arrows mark a bouton with no red Cac-Maple fluorescence.
(B) Number of red-marked AZs (photoconverted Cac-Maple) and total AZs (identified using BRP immunostain) quantified 1 and 5 days post-conversion (red D1: 72.59±5.921, n=17 NMJs; red D5: 65.57±3.789, n=21 NMJs; total D1: 90.65±4.948; total D5: 179.5±7.502, p<0.0001). (C) Red Cac-Maple fluorescence at individual AZs (30 brightest AZs per NMJ pooled from 16 to 21 NMJs) at 1 and 5 days post-photoconversion. Percent reduction in brightness at day 5 compared to day 1 is shown above (day 1: 84,672±2258, n=502 AZs; day 5: 59,383±1598, n=630 AZs, p<0.0001). (D) Average Cac-Maple fluorescence of the 30 brightest AZs per NMJ at indicated genotypes at 1 and 5 days post-conversion. For each genotype, average Cac-Maple intensity at day 1 was normalized to 1.0 (CacM D5: 0.6868±0.05975, p=0.0103; cacM/Df D5: 0.9746±0.1154; CacM;α2δ2/+ D5: 1.006±0.03891; CacM;α2δ2/k10814 D5: 1±0.08489).
-
Figure 7—source data 1
Source data for Figure 7.
- https://cdn.elifesciences.org/articles/78648/elife-78648-fig7-data1-v2.xlsx
Figure 7—figure supplement 1
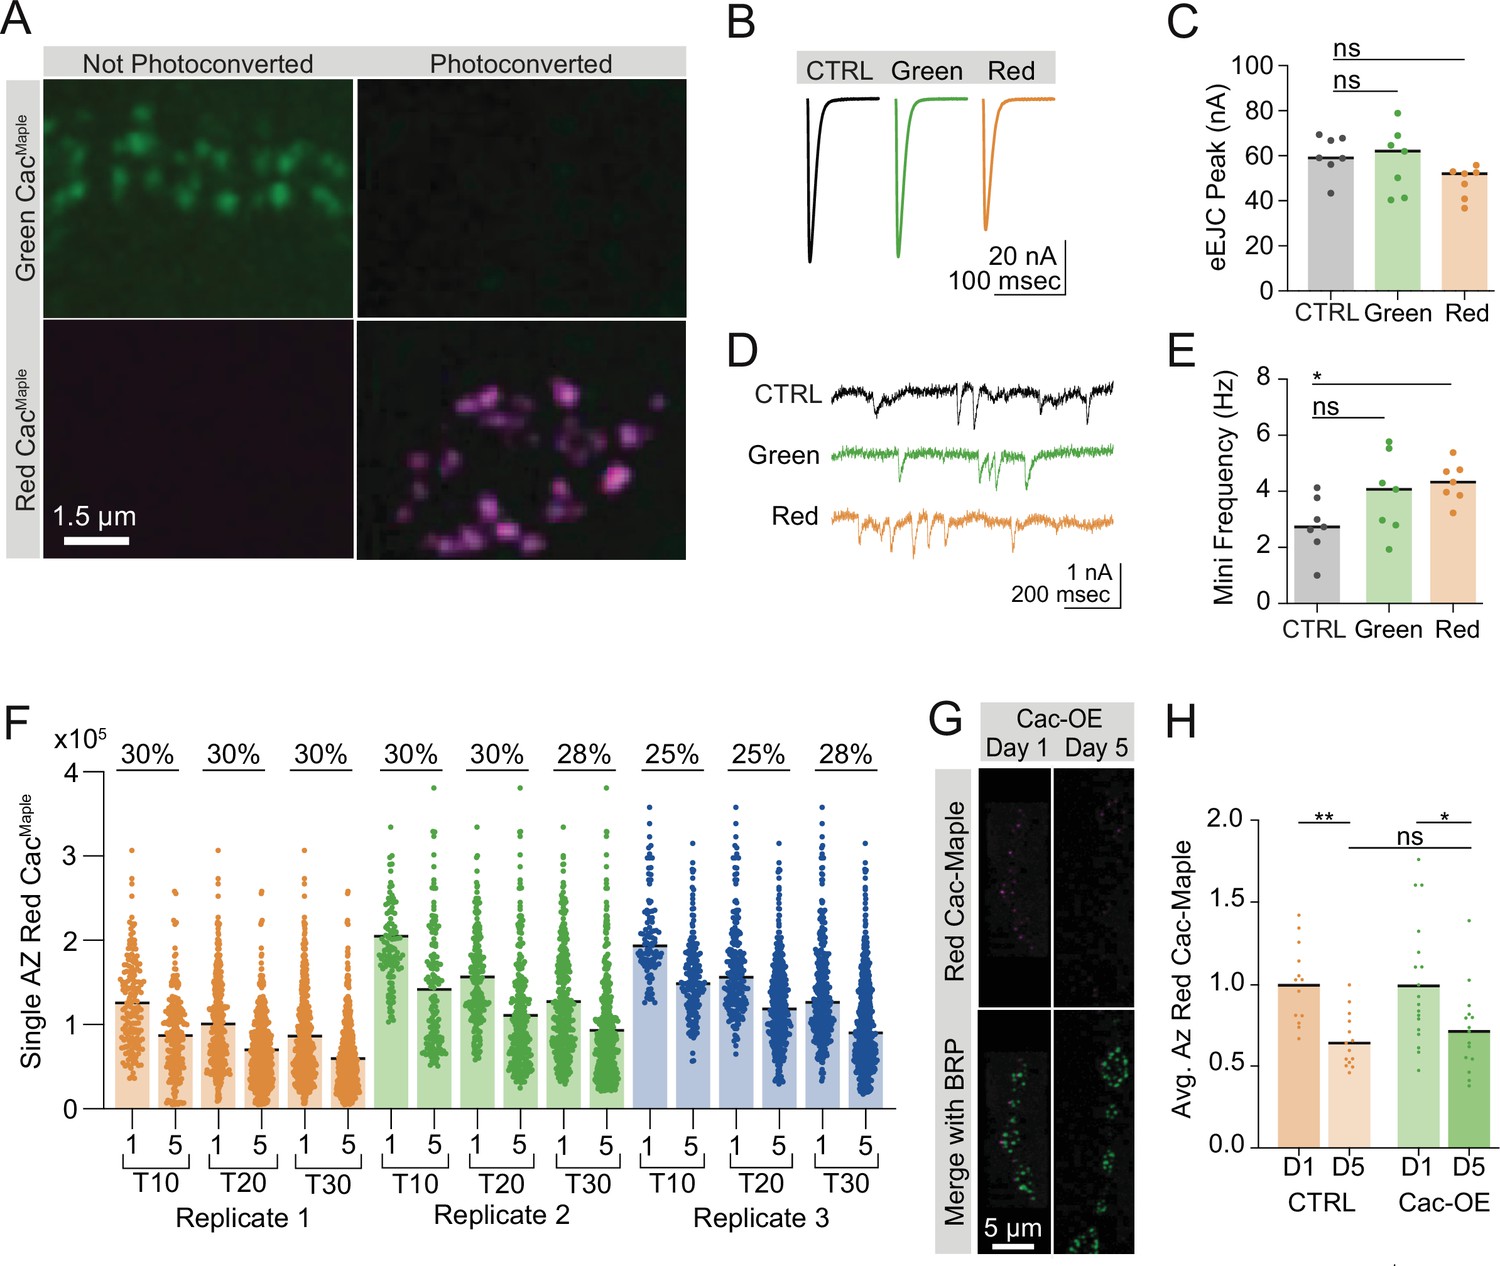
Cac-Maple localizes to active zones (AZs), photoconverts fully, and has normal function.
(A) Representative images of green (unconverted) and red (fully photoconverted, magenta) Cac-Maple at AZs. (B, C) Average traces and quantified evoked peak current from control, unconverted Cac-Maple (green), and converted Cac-Maple (red) neuromuscular junctions (NMJs) at muscle 6 (control: 60.21±3.413, n=7 NMJs; Maple [green]: 58.04±5.489, n=7 NMJs; Maple [red]: 48.32±2.674, n=7 NMJs). (D, E) Representative traces and quantified mini frequencies (control: 2.781±30.3898; Maple [green]: 3.91±0.5409; Maple [red]: 4.32±0.2671, p=0.0316). (F) Red Cac-Maple fluorescence quantified for three separate experimental replicates at control NMJs on day 1 versus day 5 post-conversion, with three analysis protocols performed for each replicate (top 10 AZs analyzed, top 20 analyzed, and top 30 analyzed). Percent reduction in average red Cac-Maple intensity on day 5 compared to day 1 is shown above for each analysis pair. Replicate 1: (D1 [top 10]: 12,6178±4049, n=170 AZs; D5 [top 10]: 88,135±3325, n=210 AZs; D1 [top 20]: 99,885±2834, n=340 AZs; D5 [top 20]: 69,939±2076, n=420 AZs; D1 [top 30]: 84,672±2258, n=502 AZs; D5 [top 30]: 59,383±1598, n=630 AZs). Replicate 2: (D1 [top 10]: 203,159±7377, n=110 AZs; D5 [top 10]: 141,260±5687, n=150 AZs; D1 [top 20]: 15,7051±4935, n=217 AZs; D5 [top 20]: 110,796±3637, n=300 AZs; D1 [top 30]: 128,356±4122, n=330 AZs; D5 [top 30]: 93,117±2806, n=450 AZs). Replicate 3: (D1 [top 10]: 204,651±5068, n=100 AZs; D5 [top 10]: 154,834±3370, n=190 AZs; D1 [top 20]: 165,709±3918, n=200 AZs; D5 [Top 20]: 124,524±2715, n=359 AZs; D1 [top 30]: 139,113±3466, n=300 AZs; D5 [top 30]: 99,899±2261, n=570 AZs). (G, H) Representative images and quantifications of red Cac-Maple on day 1 versus day 5 post-conversion in control (cacM,C155) and Cac overexpression (cacM,C155;UAS-Cac-GFP) NMJs (n=13–18 NMJs). Bruchpilot (BRP) immunostaining was used to label AZs and red fluorescence in each genotype was normalized to day 1 (cacM,C155 D5: 0.6533±0.0.04386, p<0.01; cacM,C155;UAS-Cac-GFP D5: 0.0.7159±0.06665, p=0.0152).
-
Figure 7—figure supplement 1—source data 1
Source data for Figure 7—figure supplement 1.
- https://cdn.elifesciences.org/articles/78648/elife-78648-fig7-figsupp1-data1-v2.xlsx
Figure 8
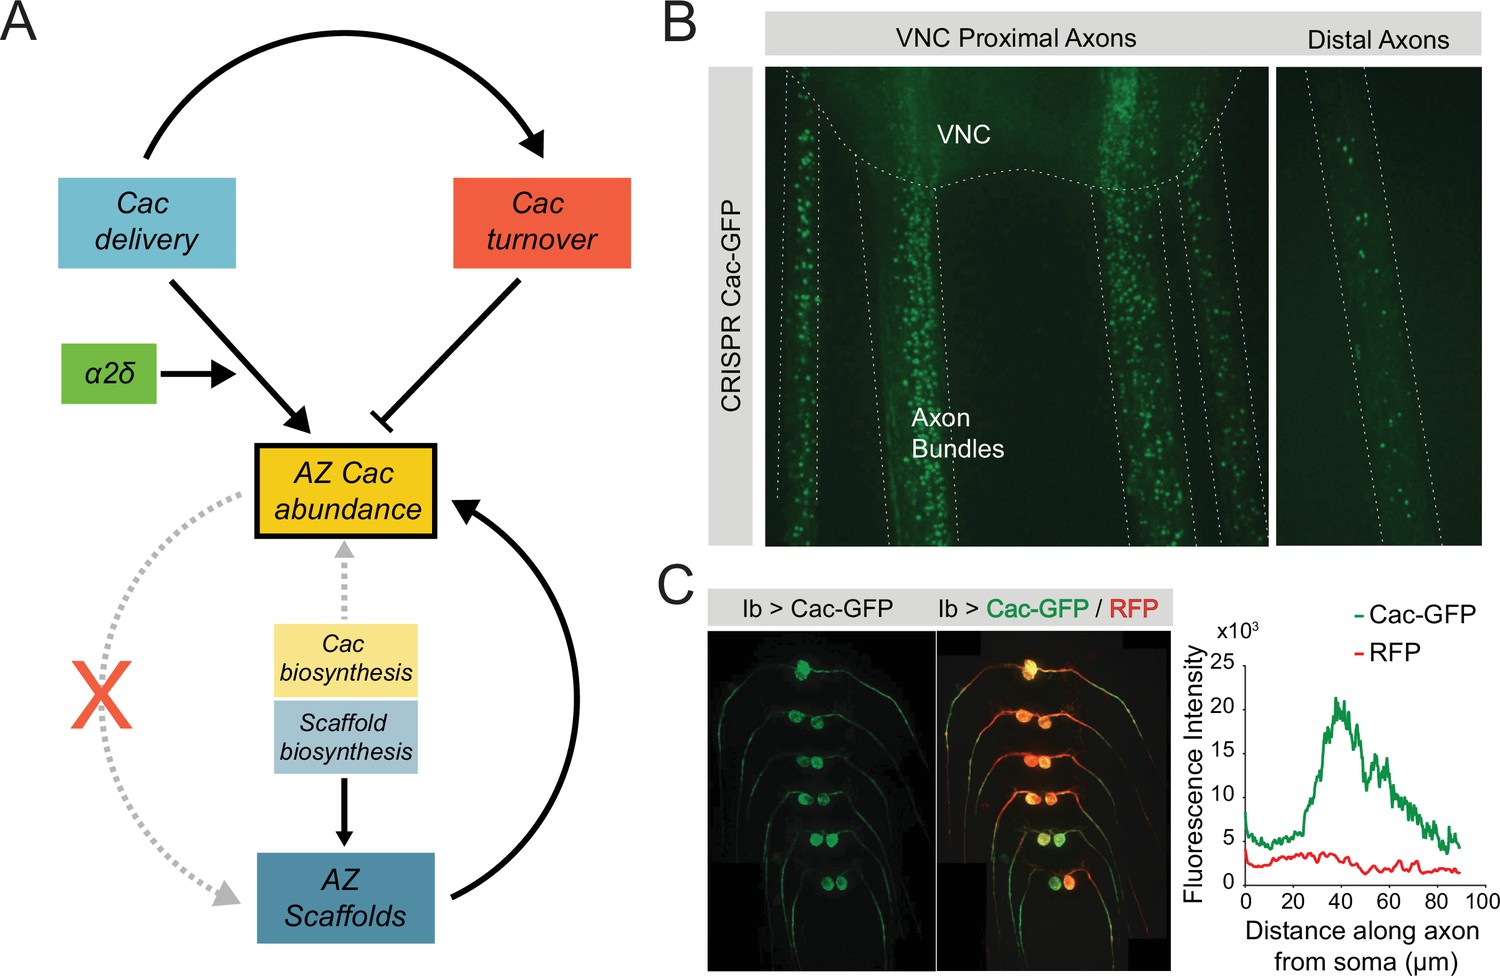
Model of Cac and active zone (AZ) scaffold regulation at the Drosophila neuromuscular junction (NMJ).
(A) AZ Cac abundance (yellow box) is regulated by both new Cac delivery (blue box) and Cac turnover from AZs (red box). Cac delivery is positively regulated by α2δ, and new delivery promotes turnover of existing channels. Cac biosynthesis (light yellow box) weakly regulates AZ Cac abundance, as AZ abundance is buffered against moderate changes in biosynthesis. In contrast, scaffold biosynthesis is a strong regulator of AZ scaffold abundance. The dependence relationship between AZ Cac abundance and AZ scaffold abundance is unidirectional: AZ scaffolds regulate Cac accumulation, but Cac is dispensable for AZ scaffold formation. (B) Left – representative image of endogenously tagged Cac-GFP puncta in axon bundles proximal to the ventral nerve cord (VNC). Right – representative image of Cac-GFP in distal axons. These axon puncta are immobile over a period of 30 min. (C) Left – representative image of a VNC with Cac-GFP (green) and RFP (red) expressed exclusively in MN1-Ib neurons. Right – quantification of Cac-GFP and RFP signal intensity as a function of distance along the axon from the soma. Plotted signal intensity was averaged across eight axons. RFP intensity is constant throughout the first 100 µm, while Cac-GFP intensity is elevated in the 30–60 µm range.
Author response image 1
Author response image 2
Additional files
Download links
A two-part list of links to download the article, or parts of the article, in various formats.
Downloads (link to download the article as PDF)
Open citations (links to open the citations from this article in various online reference manager services)
Cite this article (links to download the citations from this article in formats compatible with various reference manager tools)
Regulation of presynaptic Ca2+ channel abundance at active zones through a balance of delivery and turnover
eLife 11:e78648.
https://doi.org/10.7554/eLife.78648


