Targeted anatomical and functional identification of antinociceptive and pronociceptive serotonergic neurons that project to the spinal dorsal horn
- Institute for Pharmacology and Toxicology, University of Zurich, Switzerland
- Institute of Pharmaceutical Sciences, Swiss Federal Institute of Technology, Switzerland
Figures
Figure 1 with 4 supplements
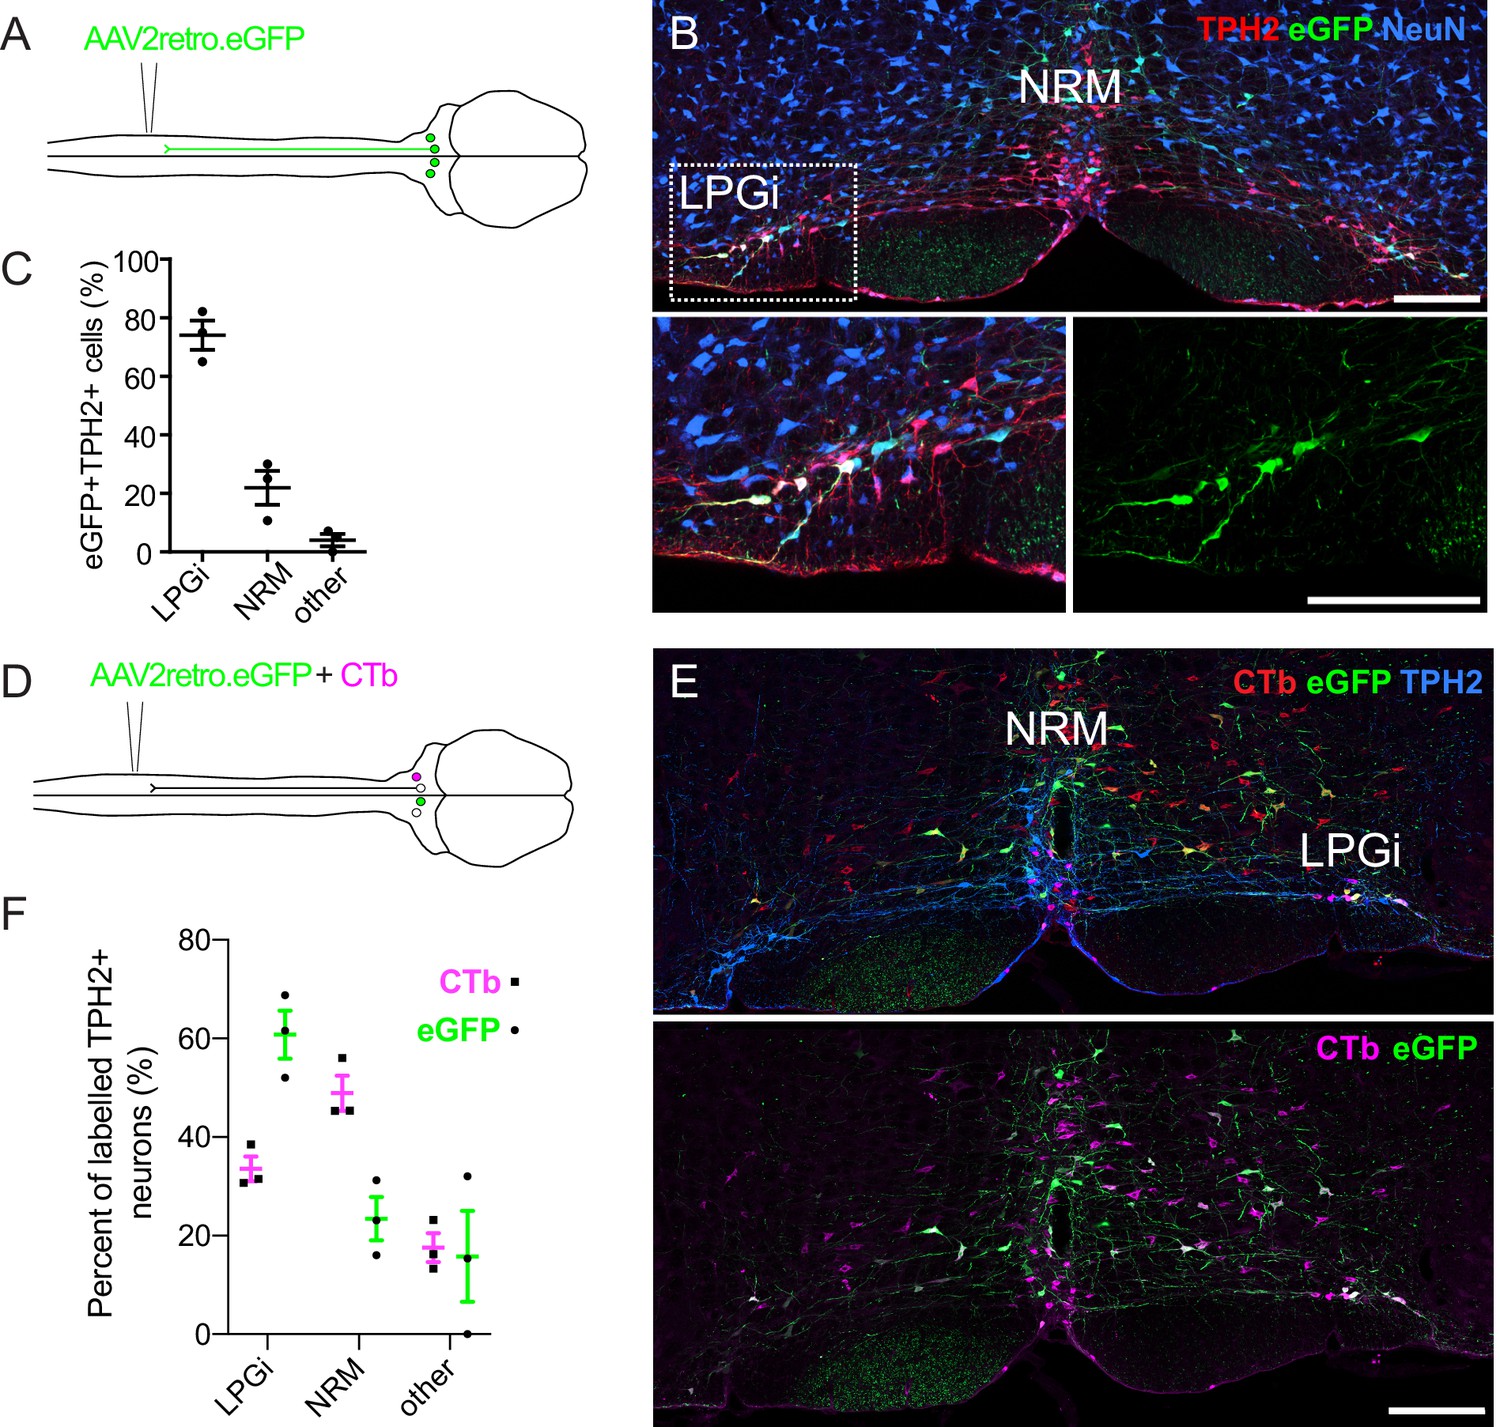
Retrograde labeling of spinally projecting serotonergic neurons with AAV2retro vectors and Cholera toxin b subunit.
(A). Injection scheme for retrograde labeling of spinally projecting neurons with AAV2retro.eGFP. (B) Image of the ventral hindbrain containing eGFP-labeled neurons (scale bar = 200 μm). Inset shows enlargement of the LPGi to reveal eGFP neurons that also express TPH2 (scale bar = 200 μm). (C). Quantification of cell location for eGFP-labeled neurons that express TPH2, each datapoint is a count per animal (n=3) (D). Injection scheme for retrograde tracing from the spinal dorsal horn with AAV2retro.eGFP and CTb. (E). Representative image of the ventral hindbrain containing CTb-labeled and AAV2retro-transduced projection neurons (scale bar = 200 μm). (F). Anatomical locations of retrogradely labeled TPH2 +hindbrain neurons labeled with CTb or AAV2retro (n=3 animals).
Figure 1—figure supplement 1
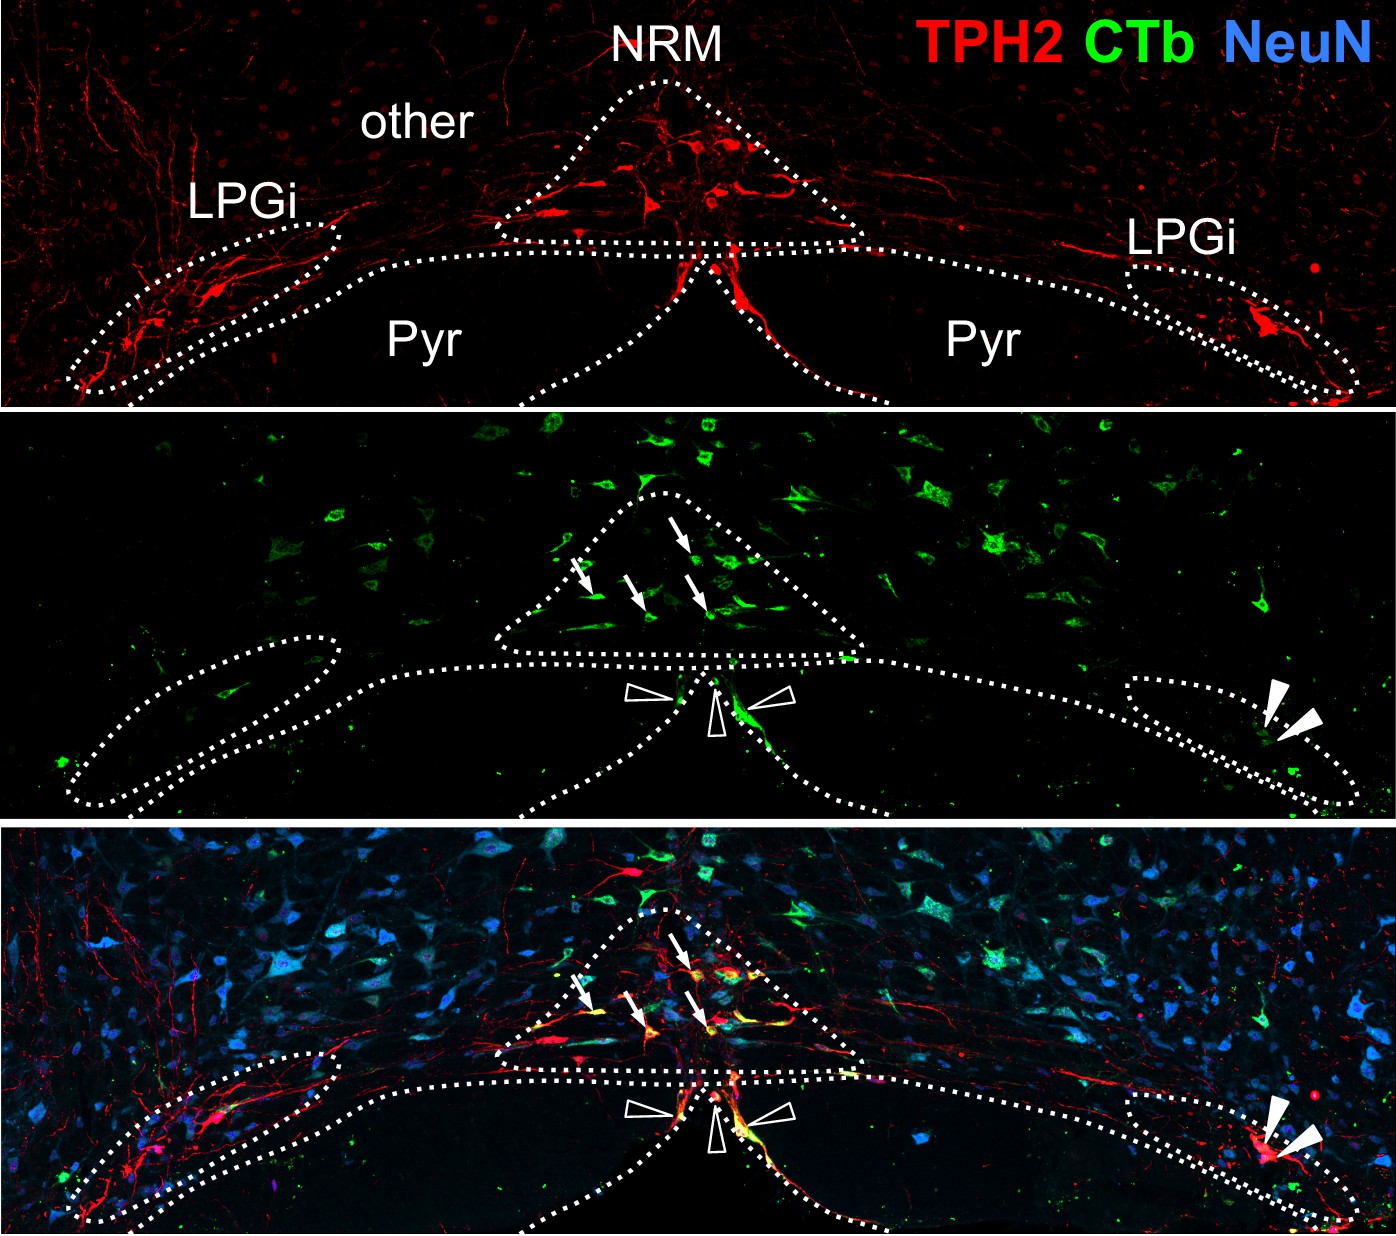
Defined areas in the RVM used for quantifying the location of retrogradely labeled neurons.
The NRM was identified as a dense cluster of TPH2-expressing neurons around the midline in a triangular shape, whereas the LPGi were distinguished by their lateral location and separation from the midline structures. All other regions were defined as ‘other’. Examples of retrogradely labeled TPH2 +neurons in the NRM are indicated with arrows, the LPGi with filled arrowheads, and other with empty arrowheads, NRM = nucleus raphe magnus, LPGi = lateral paragigantocellularis, Pyr = Pyramids, (scale bar = 200 μm).
Figure 1—figure supplement 2
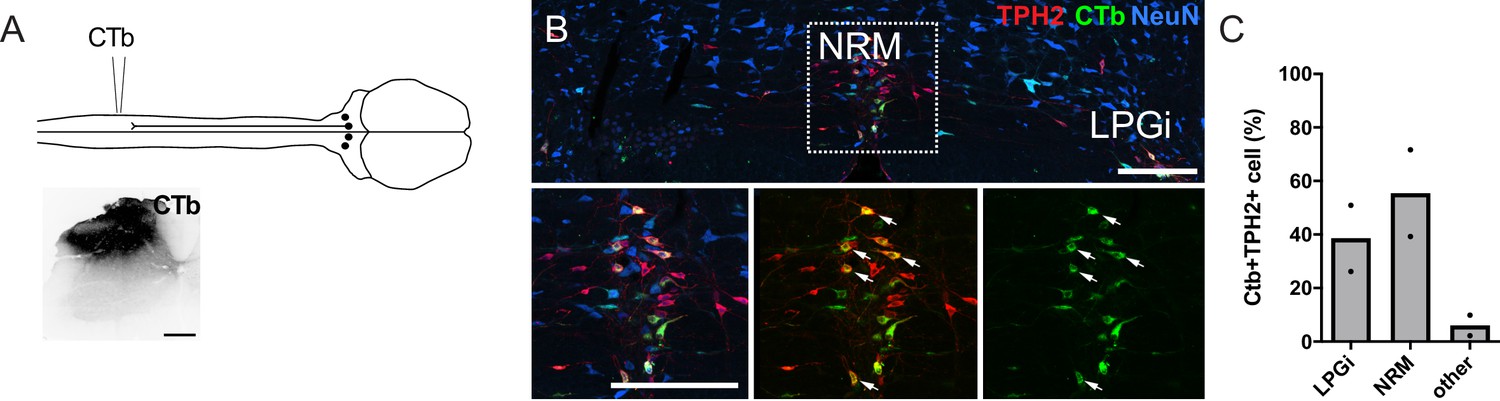
Retrograde labeling of serotonergic hindbrain neurons with CTb.
(A). injection scheme for CTb tracing from the lumbar dorsal horn and an example of the injection site in the lumbar spinal cord (scale bar = 200 μm). (B). Example of a hindbrain section from the injection site shown in A (scale bar = 200 μm). The inset shows that many CTb-labeled neurons that express TPH2 are found in the nucleus raphe magnus (indicated by arrows). (C). Location of CTb-labeled cells in the RVM that express TPH2, each datapoint is a count per animal (n=2).
Figure 1—figure supplement 3
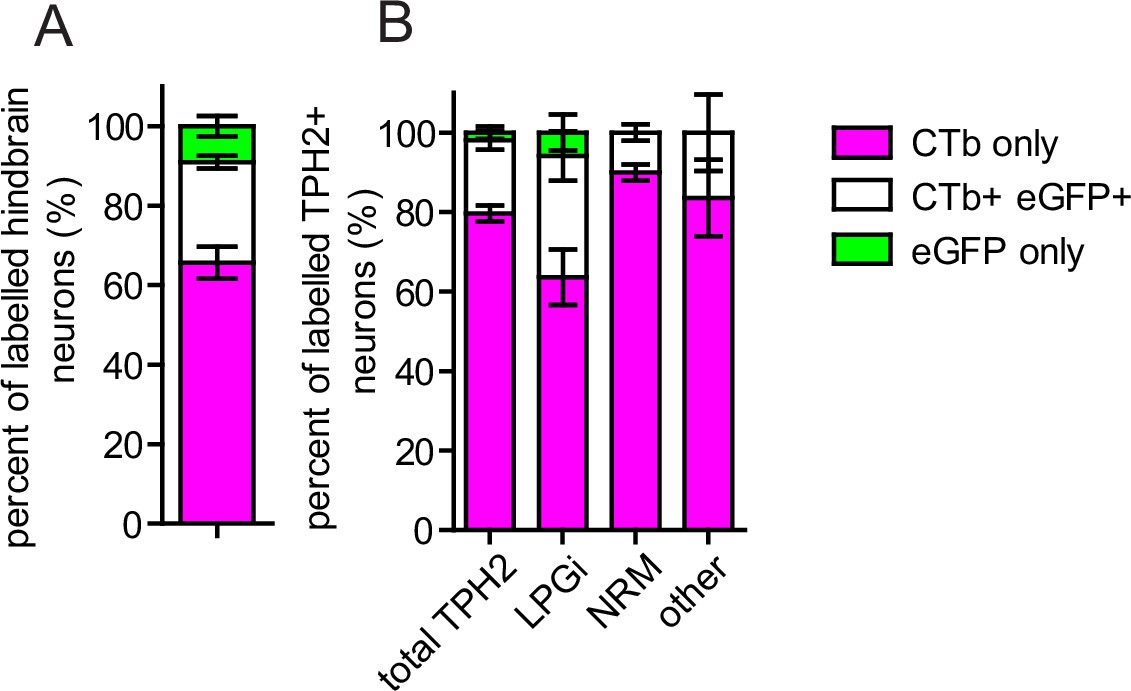
Proportion of neurons retrogradely labeled with CTb and AAV2retro in different RVM areas.
(A). Injection scheme for labeling descending projection neurons with AAV2retro and CTb. (B). Quantification of coexpression of CTb and eGFP in all retrogradely labeled RVM neurons, and (C). Quantification of coexpression of CTb and eGFP in retrogradely traced RVM neurons that contain TPH2. The proportion of retrogradely cells in each area expressing CTb, eGFP, or both eGFP and CTb are illustrated. The cell counts used to generate these charts are given in Table 1 (n=3 animals).
Figure 1—figure supplement 4
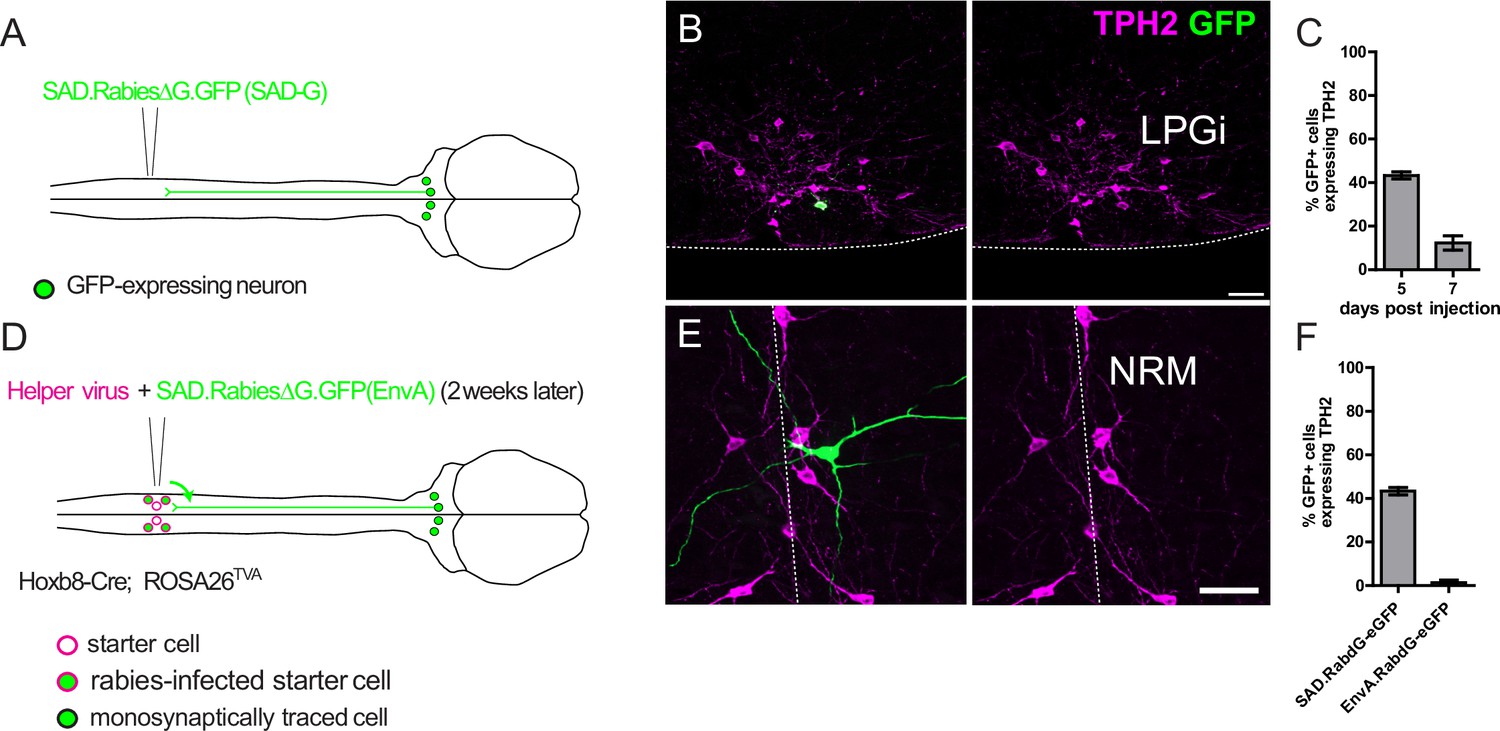
labeling of spinally projecting serotonergic neurons with direct rabies infection and transsynaptic rabies tracing.
(A). Injection strategy for the direct labeling of spinally projecting hindbrain neurons with a SAD pseudotyped and G-protein deficient rabies virus. (B). Example of a cell body of a labeled hindbrain neuron that is immunoreactive for TPH2 (scale bar = 50 μm), the ventral border of the hindbrain is indicated by the dotted line. (C). Quantification of the GFP-labeled hindbrain neurons that express detectable levels of TPH2. Note that 7 days after rabies virus injection there are fewer labeled neurons that express TPH2. N=3 animals. (D). Injection strategy for the transsynaptic tracing of neurons from spinal dorsal horn neurons. Hoxb8-Cre is transiently expressed in all lumbar dorsal horn neurons and is crossed with ROSA26TVA to induce TVA expression in all spinal neurons. E. Example of an RVM neuron traced transsynaptically from the spinal dorsal horn (scale bar = 50 μm) (F). Quantification of GFP-labeled neurons in the hindbrain that express detectable TPH2. Data from C. ‘5 days post injection’ is included to allow comparison between directly labeled and transsynaptically traced neurons. N=4 animals for transsynaptic tracing experiment.
Figure 2
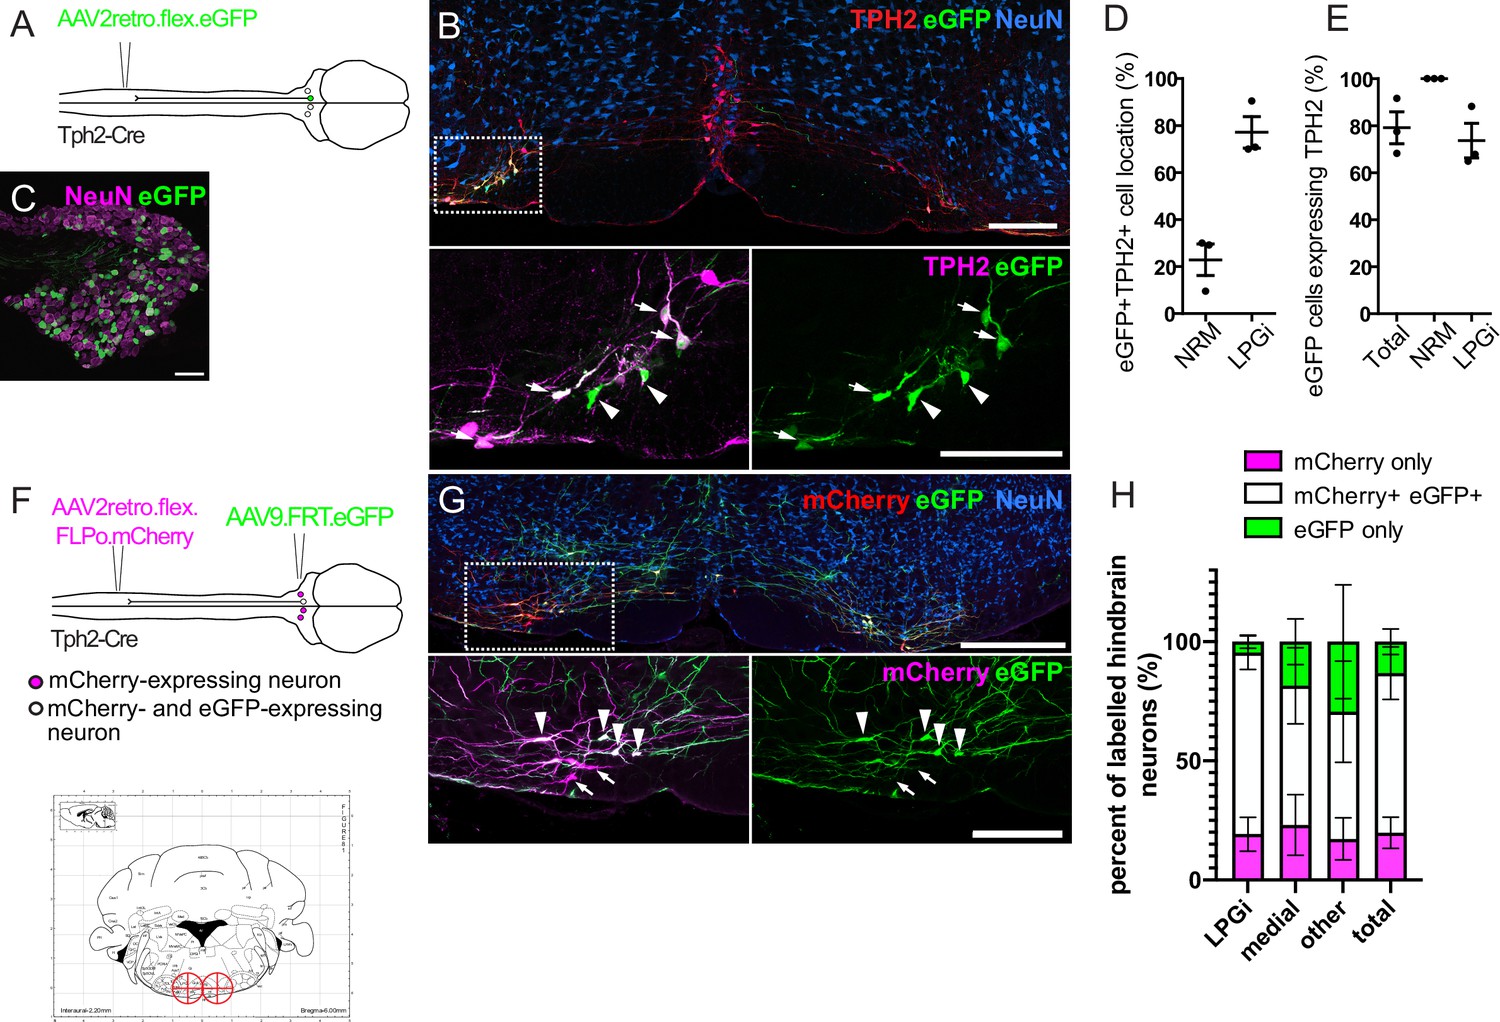
Labeling of spinally projecting neurons in the Tph2-Cre mouse with AAV2retro vectors.
(A). Injection scheme for labeling spinally projecting Tph2-Cre neurons. (B). An example of a hindbrain section containing neurons labeled with eGFP (scale bar = 200 μm). Inset is an enlargement of the area indicated in the dashed box, with many eGFP-labeled cells found to express detectable TPH2 that are indicated with arrows. Cells that were labelled with eGFP not containing detectable TPH2 are indicated with arrowheads (scale bar = 200 μm). (C). Image of an ipsilateral DRG from a Tph2-Cre mouse that received a spinal injection of AAV2retro.flex.eGFP, showing many eGFP-expressing neurons (scale bar = 100 μm). (D). Quantification of the location of eGFP-labeled cells in the hindbrain. (E). Quantification of the hindbrain neurons labeled with eGFP that also contain TPH2. For D. and E. each datapoint is a count per animal (n=3 animals). (F). Injection scheme for the intersectional labeling of spinally projecting Tph2-Cre neurons. Brain injection coordinates (−6,+/-0.5, 5.9) from bregma, for the labeling of spinally projecting Tph2-Cre neurons in the LPGi, according to the mouse brain atlas. Target injection sites are indicated in red crosshairs. (G). Example of a hindbrain section from a Tph2-Cre mouse that received the injections illustrated in F (scale bar = 500 μm). Inset is an enlargement of the boxed area and highlights neurons that were captured with the brain injection and express eGFP (arrowheads) as well as neurons that were directly labeled from the spinal cord injection (mCherry+) that were not transduced from the hindbrain injection (arrows),(scale bar = 200 μm). H. Quantification of the mCherry-expressing cells that are labeled with eGFP, which indicated that they were captured with the hindbrain injection. The percentages of mCherry-only and eGFP-only cells are also quantified for each hindbrain area that contains serotonergic neurons, and areas that could not be assigned as either medial or LPGi were classified as ‘other’ (n=4 animals).
Figure 3 with 1 supplement
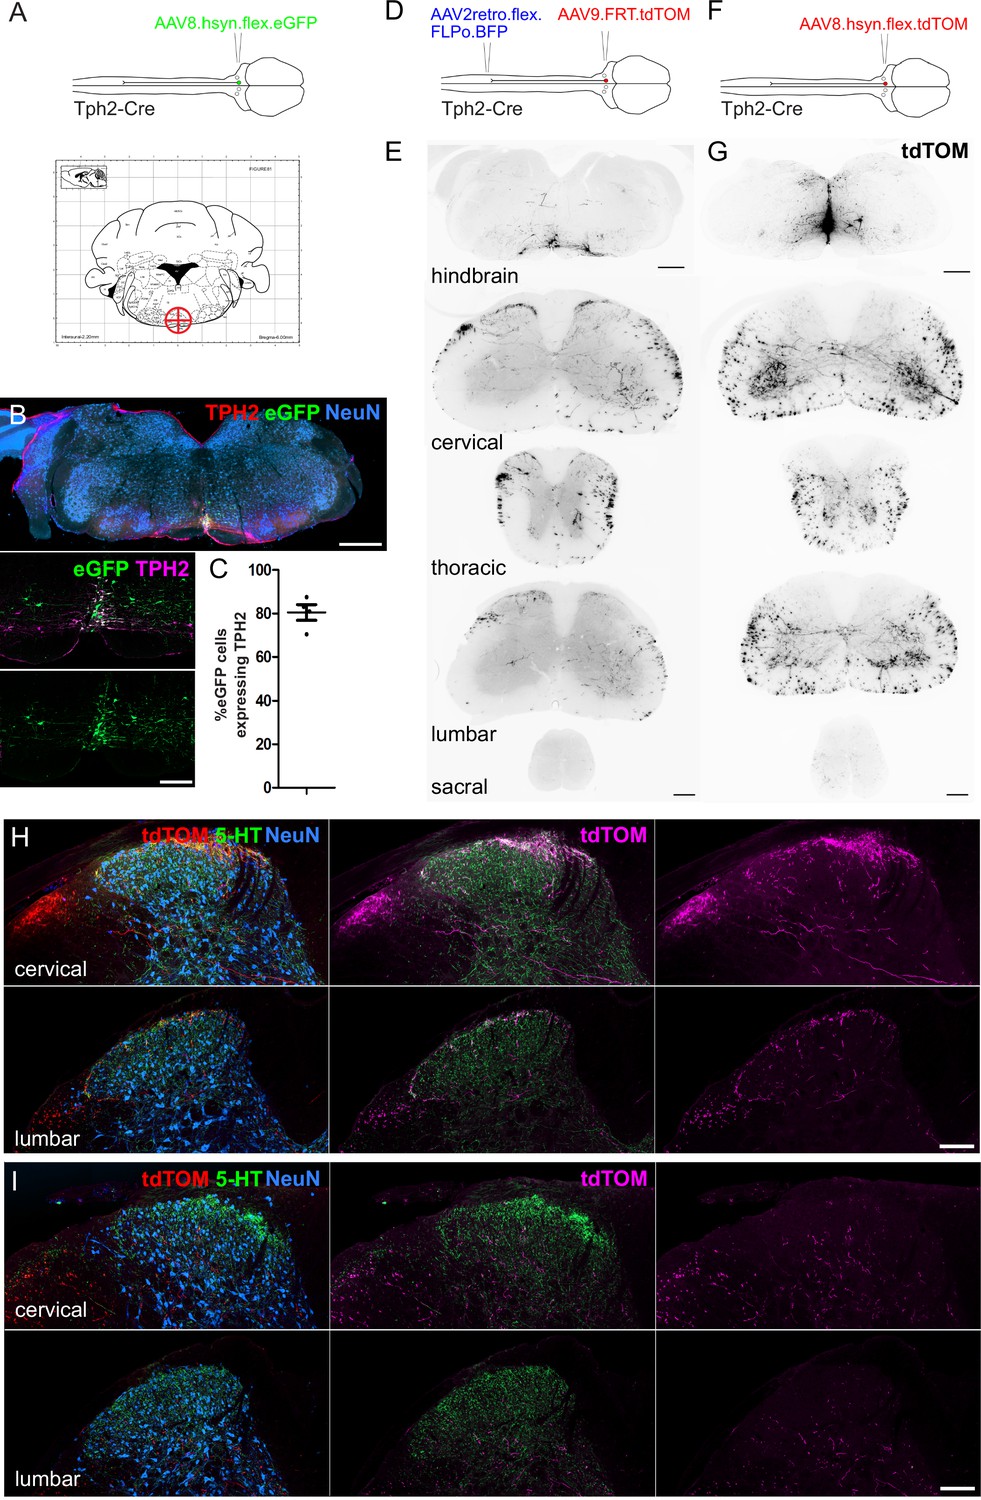
Spinal cord regions innervated by serotonergic hindbrain neurons.
(A). Injection scheme for labeling medially located serotonergic neurons of the hindbrain with AAVs. Stereotaxic injection coordinates for the hindbrain injection of AAVs to label midline neurons without transducing LPGi serotonergic neurons (–6, 0, 5.9). (B). Representative brain injection site from the hindbrain of a Tph2-Cre mouse that received a single 300 nl injection of AAV8.hSyn.flex.eGFP (Scale bar = 500 μm). A higher magnification image of the injection site is also shown (scale bar = 100 μm). (C). Quantification of the proportion of eGFP-labeled neurons in the injection site that were immunoreactive for TPH2. (D). Intersectional strategy to preferentially label the spinal axon terminals of descending serotonergic neurons that originate in the LPGi. (E). Representative images of the hindbrain injection site and the axon termination pattern in the spinal cord of a Tph2-Cre animal that received the injections depicted in D (scale bars = 500 μm and 100 μm for hindbrain and spinal cord sections respectively). (F). Injection scheme for labeling medially located serotonergic neurons with tdTOM. (G). Representative images of the hindbrain injection site and spinal cord axon termination pattern of a Tph2-Cre animal that received a single 300 nl injection of AAV8.hSyn.flex.tdTOM depicted in F (scale bars = 500 μm and 100 μm for hindbrain and spinal cord sections respectively). (H). Higher magnification images of the cervical and lumbar dorsal horns of a Tph2-Cre animal that received the injections depicted in D (scale bar = 100 μm). (I). Representative images from cervical and lumbar spinal cord segments of animals that received an injection with AAV8.hSyn.flex.tdTOM into the NRM (scale bar = 100 μm).
Figure 3—figure supplement 1
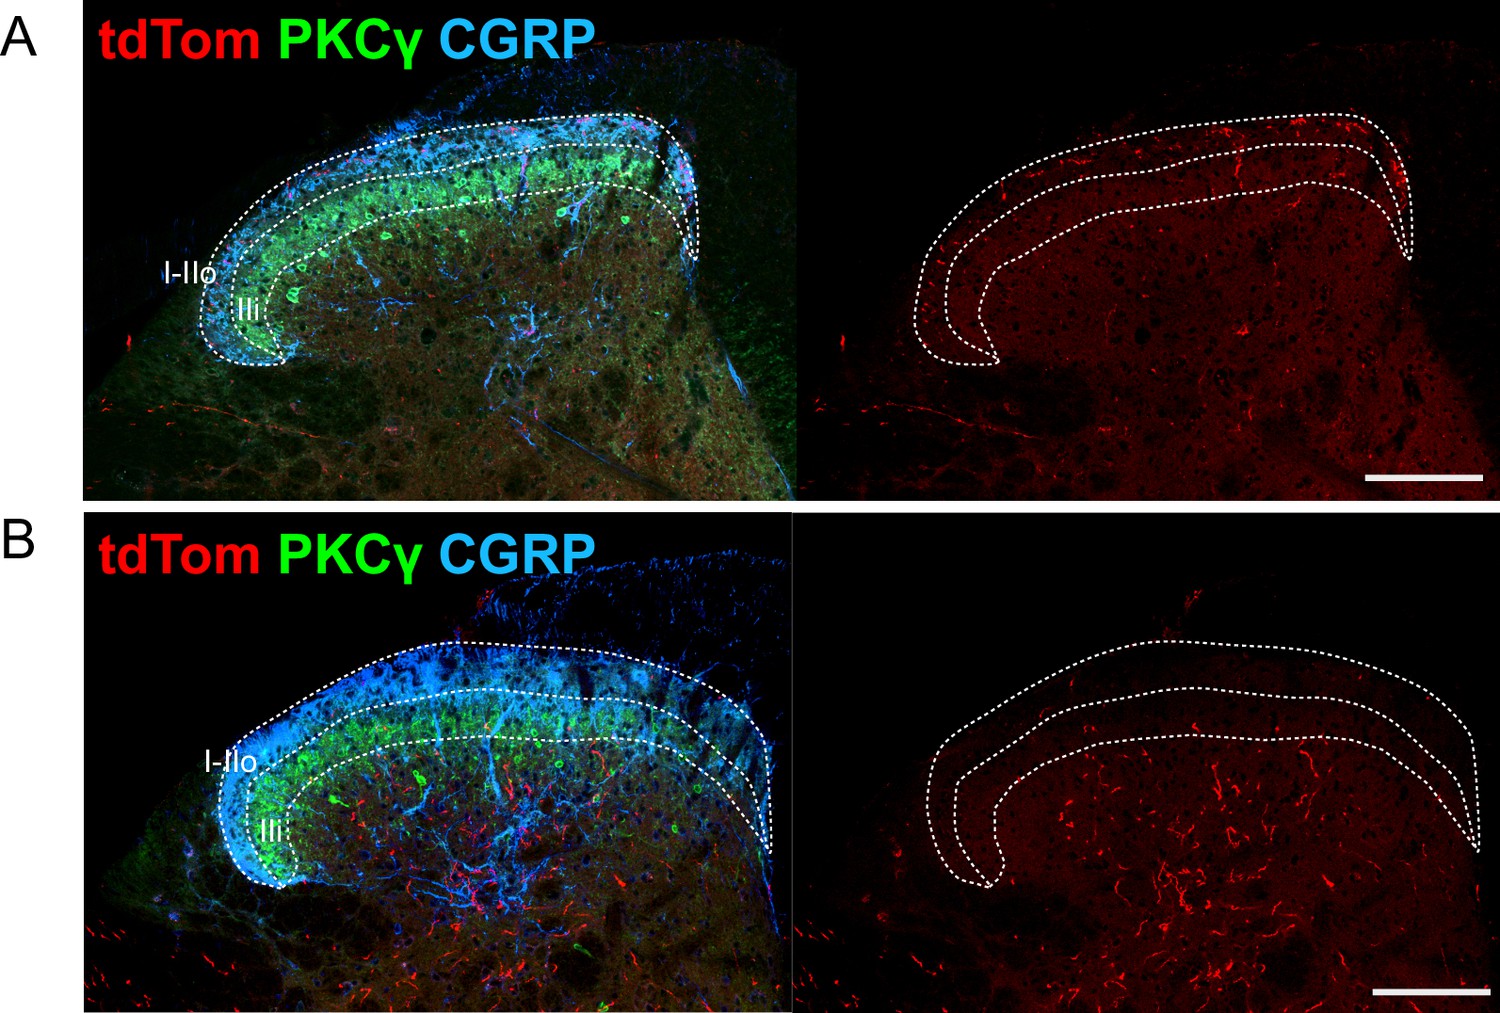
Laminar location of axons originating from descending LPGi and midline serotonergic neurons of the hindbrain.
(A). Intersectional labeling of Tph2-Cre hindbrain neurons in the LPGi, axons and terminals are found within laminae I-IIo, highlighted by CGRP immunostaining. (B). Direct labeling of medial serotonergic hindbrain neurons with AAV vectors, most labeled axons are found ventral to the lamina II-III border delineated by PKCγ immunoreactivity. Scale bars = 100 μm, laminae I-IIo and IIi are indicated by the dotted lines.
Figure 4
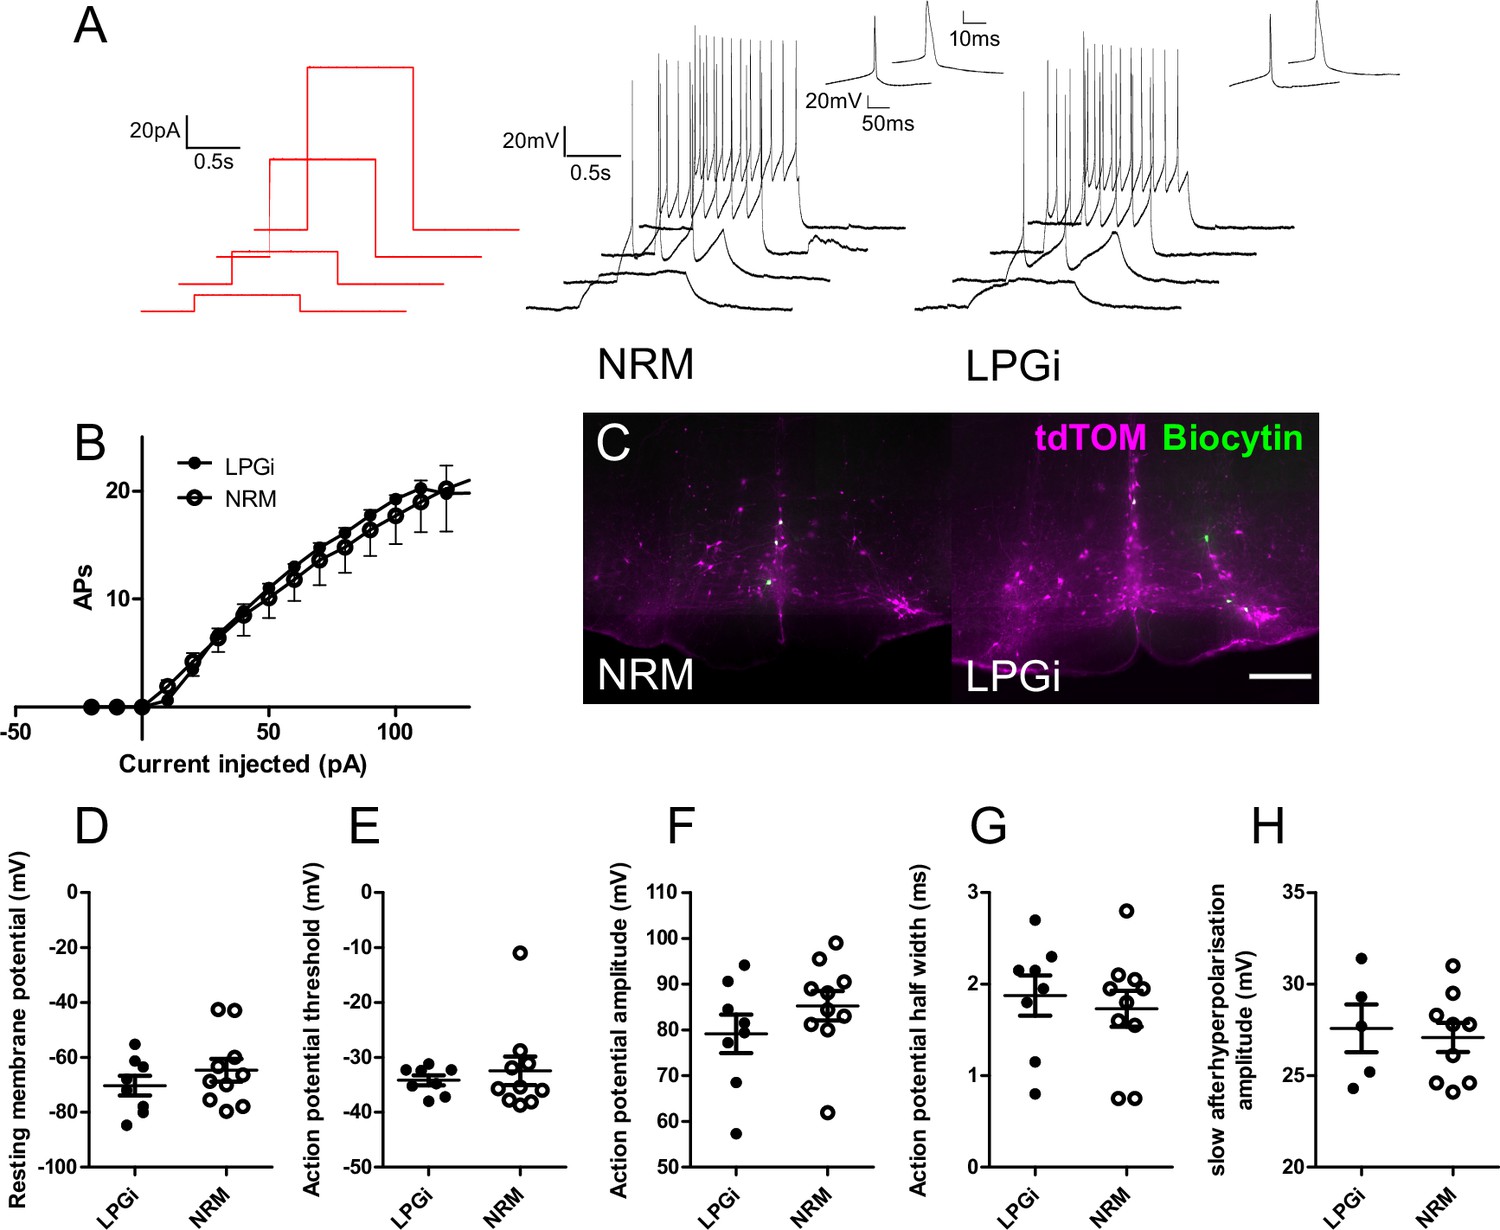
Electrophysiological characterization of serotonergic neurons of the NRM and the LPGi.
(A). Current step protocol (red) and resulting AP firing (black) from representative serotonergic NRM and LPGi neurons recorded in current clamp. (B). Current/frequency plot for the AP firing frequency of NRM and LPGi neurons resulting from increasing 1 s depolarizing current injections. (C). Representative images of biocytin filled neurons within the NRM and LPGi of hindbrain slices revealed following recording (scale bar = 200 μm). (D – H) comparison of active and passive membrane properties between NRM and LPGi serotonergic neurons. (D – G). n=10 NRM (from 4 animals) n=8 LPGi (from 3 animals). (H). n=9 NRM n=5 LPGi.
Figure 5 with 5 supplements

Chemogenetic activation of descending serotonergic LPGi neurons.
(A). Injection scheme for expressing the excitatory DREADD hM3Dq in spinally projecting Tph2-Cre neurons. Brain injection coordinates according to the mouse brain atlas (−6,+/-0.5, 5.9 from bregma). (B). Example of the injection site from the hindbrain of a mouse that received a spinal dorsal horn injection of AAV2retro.flex.FLPo.BFP followed by a bilateral hindbrain injection of AAV1.FRT.hM3Dq.mCherry 1 week later (scale bar = 200 μm). (C). Example of the ipsilateral spinal dorsal horn form an animal that had received the injections indicated in A. Note that most 5-HT-containing terminals are not labeled, but the majority of labeled terminals contain a detectable level of 5-HT (scale bar = 200 μm). (D). Sensory tests of the ipsilateral hindpaw: Hargreaves plantar assay; repeated measures one-way ANOVA, (F(3, 42)=16.93, p<0.0001), post hoc tests with Bonferroni’s correction detected differences between post-vehicle and post CNO, as well as pre-CNO and post-CNO (adjusted p values are p=0.007 and p<0.0001 respectively). Cold plantar assay; repeated measures one-way ANOVA, (F(3, 39)=12.41, p<0.0001) post hoc tests with Bonferroni’s correction detected differences between post-vehicle and post CNO, as well as pre-CNO and post-CNO (adjusted p values are p=0.0122 and p=0.0103, respectively). von Frey test; repeated measures one-way ANOVA, (F(3, 39)=0.5013 p=0.6836). Rotarod test for sensorimotor coordination/sedation; repeated measures one-way ANOVA, (F(3, 30)=0.8684, p=0.4683). Significance: *p<0.05, **p<0.01, ***p<0.001.
Figure 5—figure supplement 1
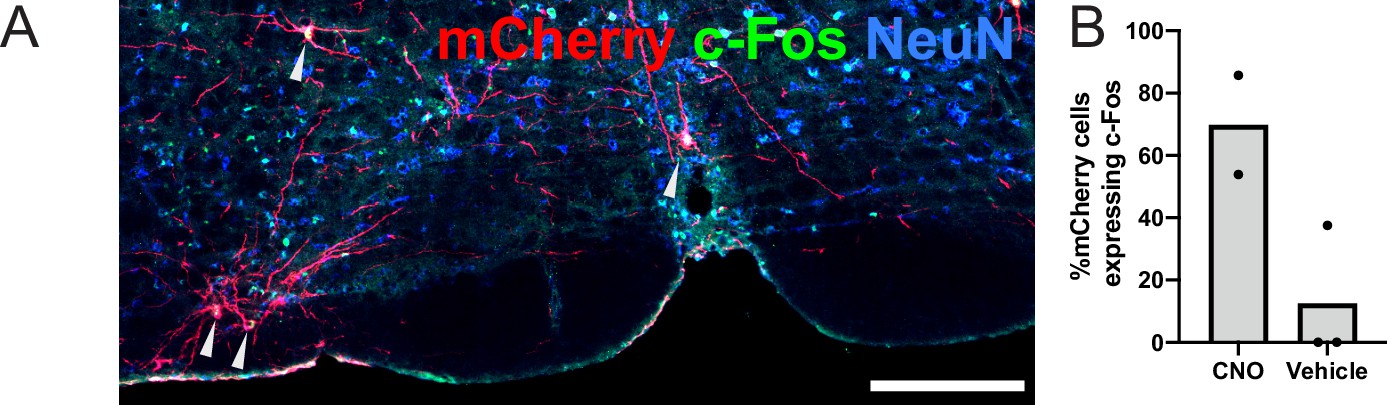
Chemogenetic activation of hM3Dq-labeled neurons.
(A). Hindbrain containing hM3Dq-mCherry-labeled neurons that upregulated c-Fos following intraperitoneal injection of CNO (scale bar = 200 μm). (B). Quantification of the proportion of hM3Dq-mCherry neurons that upregulated c-Fos after CNO or vehicle injection (CNO n=2, vehicle n=3).
Figure 5—figure supplement 2
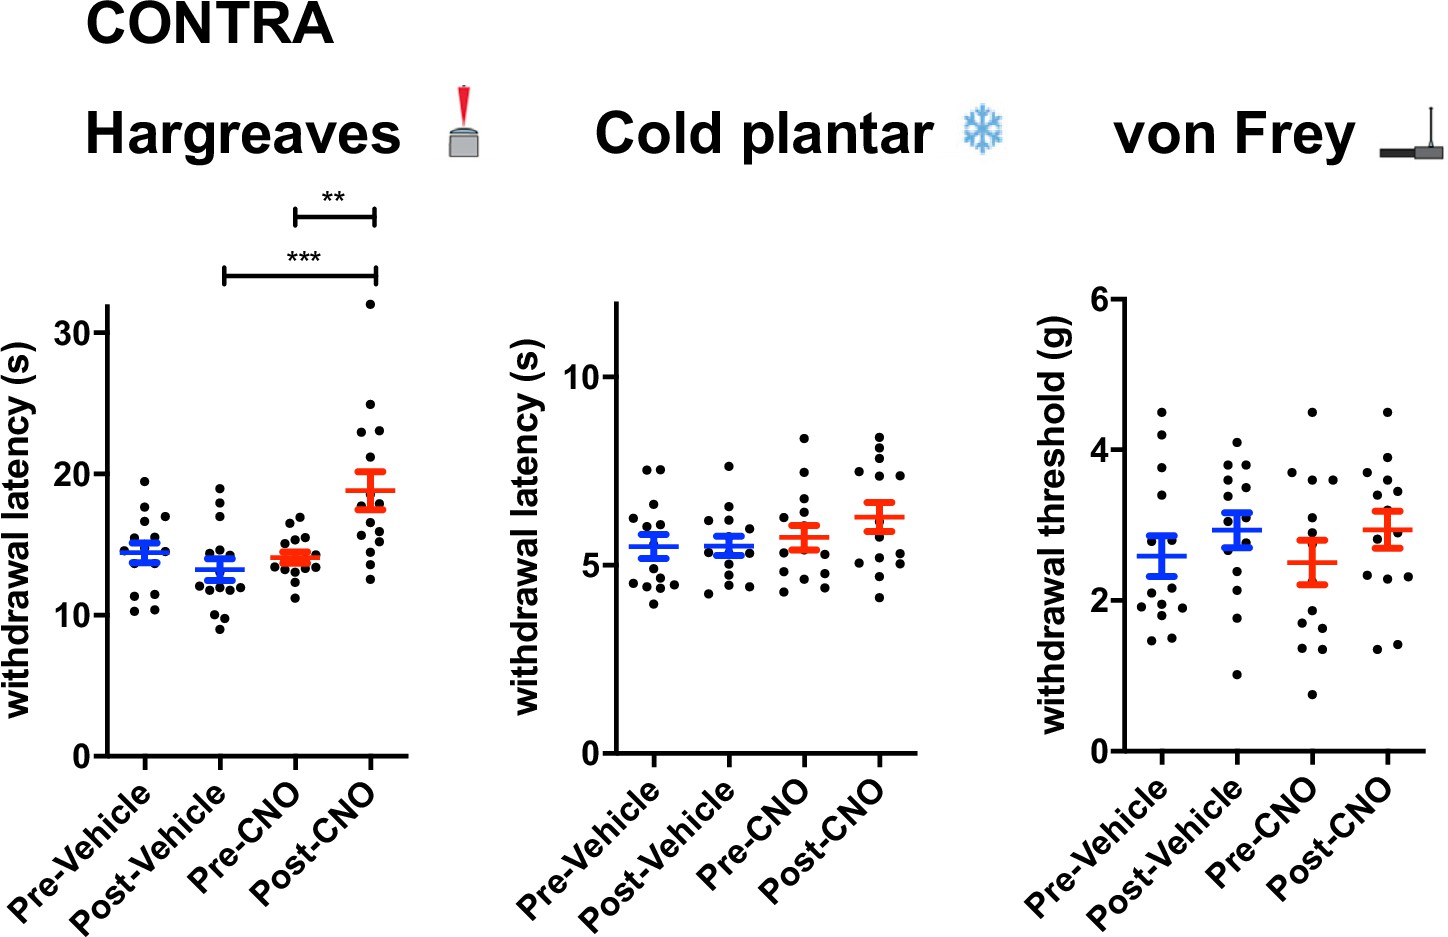
Altered sensitivity of the contralateral paw following LPGi activation.
Sensory tests of the contralateral hindpaw: Hargreaves plantar assay; repeated measures one-way ANOVA, (F(3, 9)=4.833, p=0.0081). Post-hoc tests with Bonferroni correction detect differences between pre and post CNO injection, and between post-vehicle and post-CNO injection in the Hargreaves plantar assay. Significance: **p<0.01, ***p<0.001. (n=15 animals).
Figure 5—figure supplement 3
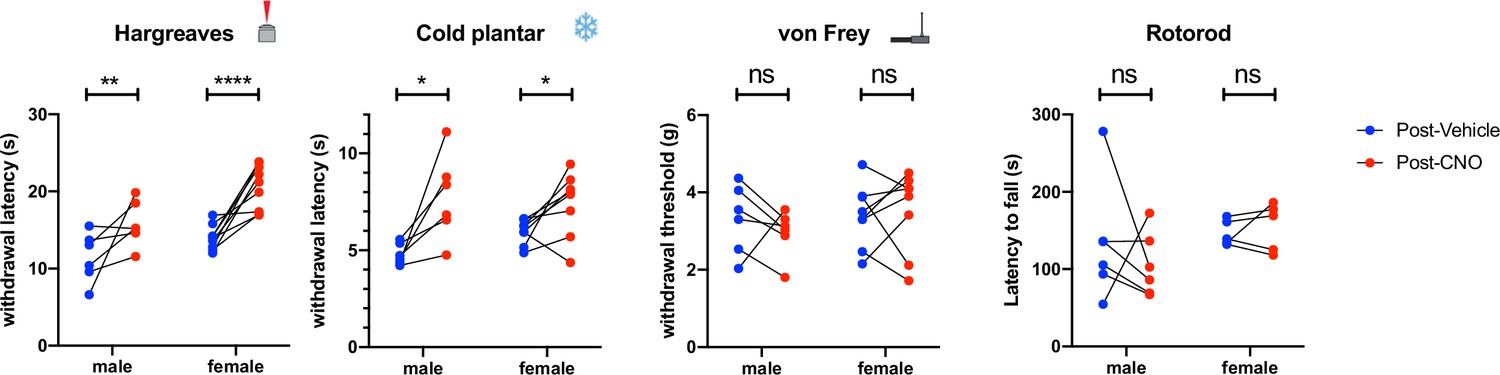
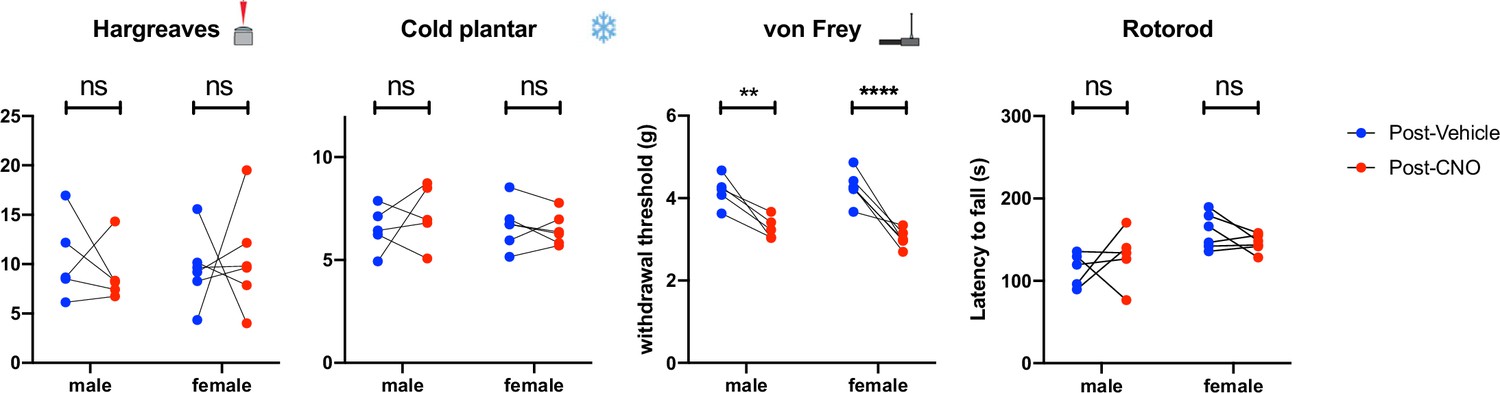
Both male and female mice show alterations in thermal thresholds following chemogenetic activation of LPGi serotonergic neurons.
Sensory and motor tests with groups divided into male and female animals. Increases in withdrawal latencies are seen in the Hargreaves and cold plantar assay in both male and female animals (paired t-tests post vehicle vs post CNO with Holm-Sidak correction). N=6 male and 9 female animals Hargreaves, 6 male and 8 female for Cold plantar assay and von Frey, and 6 male and 5 female for Rotarod. Significance: *p<0.05, **p<0.01, **p<0.001.
Figure 5—figure supplement 4
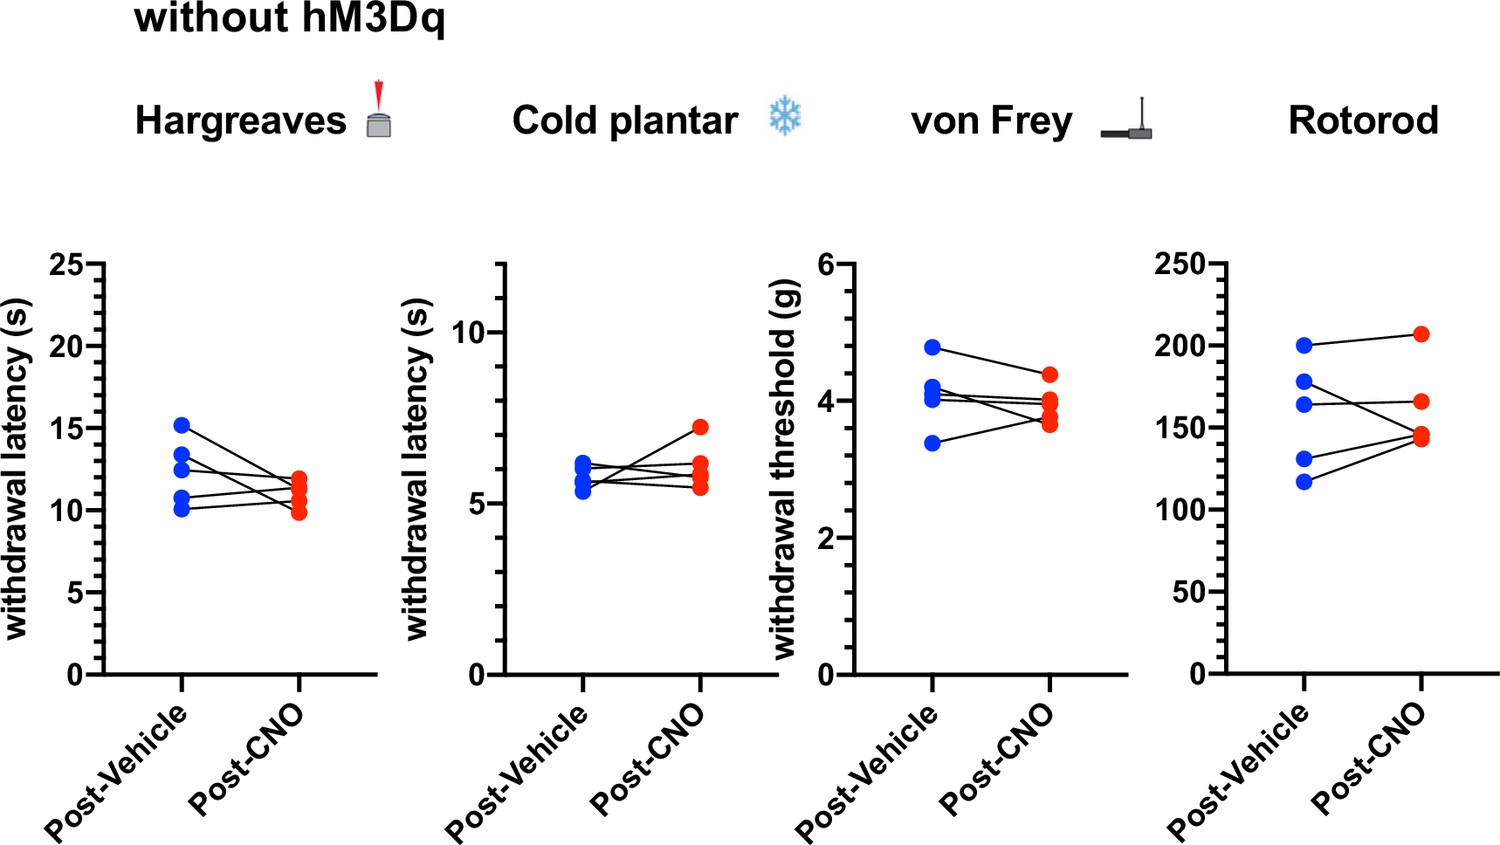
CNO does not alter response latencies, thresholds or sensorimotor coordination in the absence of hM3Dq.
Sensory tests before and after the injection of either CNO or vehicle (n=5 animals). post-vehicle vs post-CNO paired t-test, Hargreaves p=0.239, Cold plantar p=0.461, von Frey p=0.424, Rotarod p=0.732.
Figure 5—figure supplement 5
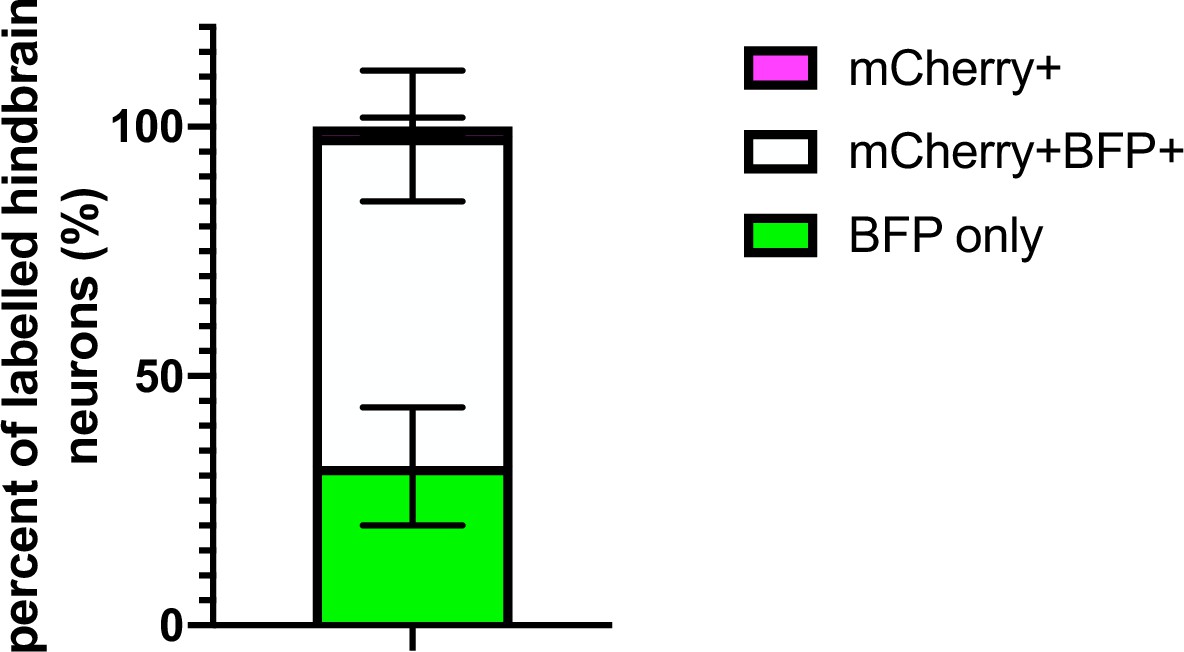
Proportion of AAV2retro-traced neurons labeled with hM3Dq-mCherry for behavioral experiments.
Quantification of the hindbrain neurons labeled from the injection scheme depicted in Figure 5A. n=4 animals.
Figure 6 with 3 supplements

Chemogenetic activation of medial serotonergic hindbrain neurons.
(A). Injection scheme for chemogenetic activation of medial serotonergic hindbrain neurons. Stereotaxic coordinates used for activating midline serotonergic neurons of Tph2-Cre animals with hM3D(q)-containing AAVs (–6, 0, 5.9). (B). Example of an injection site from an experiment to activate midline serotonergic neurons with hM3D(q) (scale bar = 500 μm). (C). Lumbar spinal cord from the injection site shown in B. showing mCherry-expressing terminals located ventral to the dense 5-HT innervation of the superficial dorsal horn (scale bar = 200 μm). (D). Sensory and sensorimotor coordination assays of animals following CNO or vehicle injections. Repeated one-way ANOVA, followed by Bonferroni’s post-hoc tests for von Frey (F(3, 6)=13.84, p<0.0001) show significant decreases between post-vehicle and post-CNO injections (P=0.0005) as well as pre-CNO and post-CNO (p<0.0001). Significance: *p<0.05, **p<0.01, **p<0.001.
Figure 6—figure supplement 1
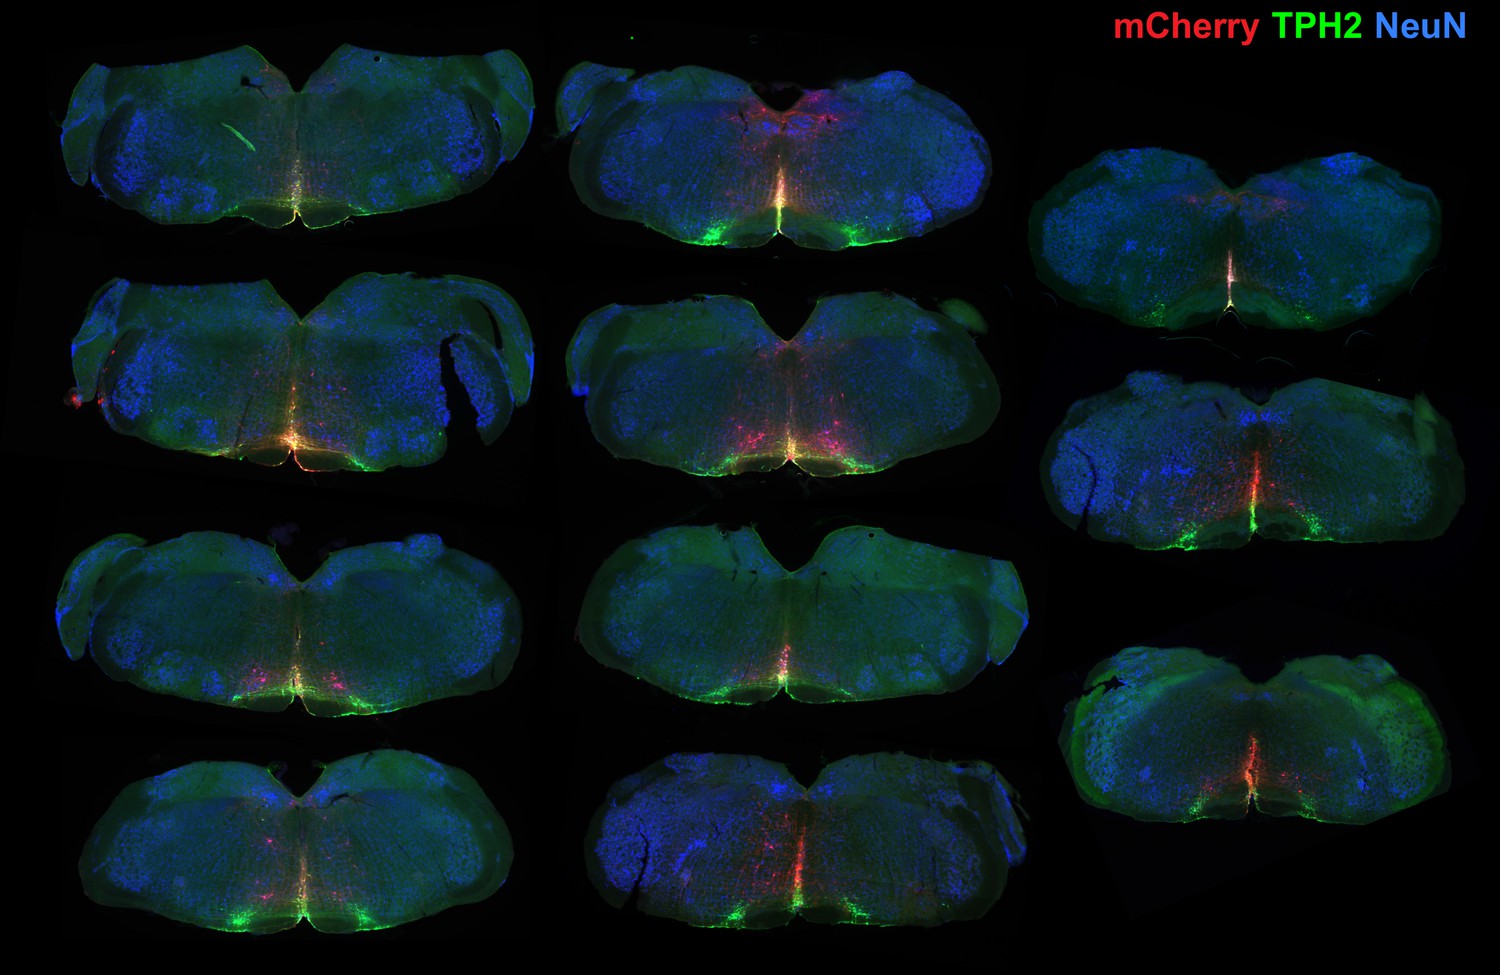
Injection sites for chemogenetic activation of medial serotonergic neurons of the hindbrain.
In all cases, spread is restricted to the medial neurons with limited spread to the LPGi serotonergic neurons. The targeted region of the hindbrain was the NRM at (–6, 0, 5.9) relative to Bregma according to the mouse brain atlas. In many cases, hM3Dq-mCherry-expressing neurons are also seen in the Raphe Obscuris (ROb), and the Raphe Pallidus (RPa) (scale bar = 500 μm).
Figure 6—figure supplement 2
Both male and female animals show increase in mechanical hypersensivity during chemogenetic activation of medial serotonergic hindbrain neurons.
Sensory and motor tests of male and female animals 1–3 hr after CNO or vehicle injection. A decrease in withdrawal threshold is seen in both male and female animals for the von Frey test (paired t-tests post vehicle vs post CNO with Holm-Sidak correction). N=5 male and 6 female animals for all tests. Significance: *p<0.05, **p<0.01, **p<0.001.
Figure 6—figure supplement 3
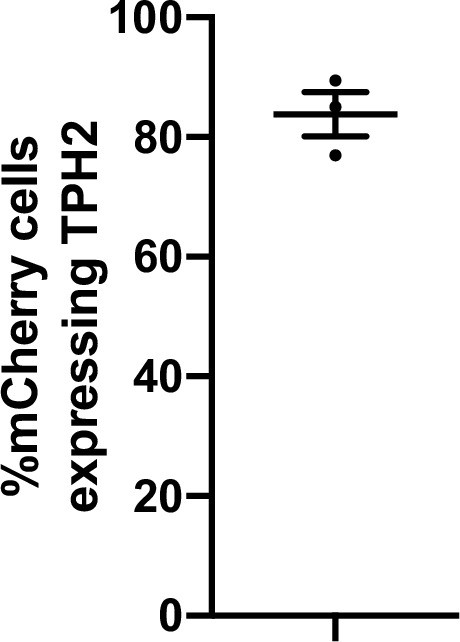
Proportion of neurons labeled in chemogenetic experiments that express TPH2.
Summary of the proportion of hM3Dq-mCherry neurons labeled in the medial hindbrain that also express detectable TPH2 (n=3 animals).
Tables
Table 1
Quantification of hindbrain neurons traced from the spinal dorsal horn with AAV2retro.eGFP and CTb.
The number in each column is the total number of cells counted for each group, with the range of cells counted for each animal in parentheses. For percentages, the average value is presented with the range for each animal given in parentheses.
| Brain region | Subset | GFP only | Ctb only | GFP +Ctb + | %GFP only | %Ctb only | %GFP +Ctb + |
|---|---|---|---|---|---|---|---|
| RVM (all neurons) | - | 99 (11–57) | 679 (149–319) | 279 (65–134) | 9.1 (4.0–12.1) | 65.6 (59.7–73.3) | 25.3 (22.7–28.1) |
| RVM (TPH2 +neurons) | All | 5 (0–4) | 269 (63–123) | 62 (12–25) | 1.5 (0–5.1) | 80.1 (76.1–83.1) | 18.5 (15.2–22.9) |
| LPGi | 5 (0–4) | 79 (16–44) | 35 (7–15) | 4.2 (0–14.8) | 66.4 (54.3–77.2) | 29.4 (22.8–42.9) | |
| NRM | 0 (0–0) | 143 (37–63) | 15 (4–6) | 0 (0–0) | 90.5 (87.8–94.0) | 9.5 (6.0–12.2) | |
| Other | 0 (0–0) | 47 (10–21) | 12 (0–8) | 0 (0–0) | 79.7 (66.7–100) | 20.3 (0–33.3) |
Table 2
Neurons in the ventral hindbrain traced from the spinal cord with modified rabies viruses.
Number represents the total number of cells counted with the range of cells counted for each animal in parentheses. Percentages of labeled neurons expressing TPH2 are the average for all cells counted per group, with the range for each animal given in parentheses.
| Labeling strategy | Rabies virus | Animals | Total GFP + cells counted in RVM | GFP neurons expressing TPH2 | GFP neurons not expressing TPH2 | % GFP +neurons that are TPH2+ |
|---|---|---|---|---|---|---|
| Direct infection (5d) | SAD.RabiesΔG-eGFP (SAD-G) | 3 | 25 (5–11) | 11 (2–5) | 14 (3–6) | 44 (40–45) |
| Direct infection (7d) | SAD.RabiesΔG-eGFP (SAD-G) | 3 | 36 (7–17) | 4 (1-2) | 32 (6–16) | 11 (6–16) |
| Monosynaptic tracing | SAD.RabiesΔG-eGFP (EnvA) | 4 | 33 (3–20) | 1 (0–1) | 32 (3–19) | 3 (0–5) |
Table 3
Cell counts for eGFP-labeled cells in the hindbrain from injection of AAV2retro.flex.eGFP into the spinal cord of Tph2-Cre animals (n=3) the total number of cells counted is indicated and the range of cells counted per animal is indicated in parentheses.
| GFP (all) | GFP (NRM) | GFP (LPGi) | GFP +TPH2+ (all) | GFP +TPH2+ (NRM) | GFP +TPH2+ (LPGi) |
|---|---|---|---|---|---|
| 127 (24–63) | 25 (7–12) | 102 (17–57) | 96 (22–43) | 25 (7–12) | 71 (15–37) |
Table 4
Cell counts for neurons labeled in the hindbrain from intersectional labeling experiments, from spinal cord injection of AAV2retro.flex.FLPo.mCherry and hindbrain injection of AAV9.FRT.eGFP (n=4 animals).
Total number of cells counted is given with the range of cells counted in parentheses.
| Fluorophore | Total | LPGi | medial | Other |
|---|---|---|---|---|
| eGFP only | 94 (19–29) | 18 (1–8) | 38 (6–16) | 38 (5–20) |
| eGFP +mCherry + | 558 (72–224) | 298 (50–96) | 156 (13–69) | 104 (6–59) |
| mCherry only | 153 (22–65) | 71 (11–23) | 55 (4–29) | 27 (3–13) |
Table 5
Comparison of active and passive membrane properties between serotonergic neurons in the NRM and the LPGi.
Data are shown as mean ± SEM (n=10 cells from 4 animals NRM, n=8 cells from 3 animals LPGi).
| Parameter | NRM | LPGi |
|---|---|---|
| Membrane resistance (MΩ) | 1643±240.1 | 1857±316.9 |
| Resting membrane potential (mV) | –64.69±4.145 | –70.32±3.592 |
| Rheobase current (pA) | 18.75±2.236 | 15.00±2.266 |
| Action potential threshold (mV) | –32.45±2.597 | –34.18±0.8890 |
| Action potential amplitude (mV) | 85.26±3.230 | 79.14±4.194 |
| Action potential half width (ms) | 1.730±0.1960 | 1.875±0.2198 |
| Slow Afterhyperpolarisation (with AHP / total) | 9/10 | 5/8 |
| Slow Afterhyperpolarisation Amplitude (mV) | 27.09±0.7983 | 27.58±1.304 |
Table 6
Transgenic mouse lines used in this study.
| Mouse line | Supplier/source | Reference |
|---|---|---|
| Tg(Tph2-Cre)RH35Gsat (Tph2-Cre) | The Jackson Laboratory | MGI: 5435520 |
| Tg(Hoxb8-cre)1403Uze (Hoxb8-Cre) | Pawel Pelczar | (Witschi et al., 2010) MGI:4881836 |
| Gt(ROSA)26Sortm1(Tva)Das (ROSA26TVA) | Dieter Sauer | (Seidler et al., 2008) MGI:3814188 |
Table 7
AAVs, rabies viruses, and retrograde tracers used in the study.
| Virus/tracer name | Full name | Supplier/Source | Cat# |
|---|---|---|---|
| AAV2retro.eGFP | ssAAV-retro/2-CAG-EGFP-WPRE-SV40p(A) | Viral Vector facility UZH/ETHZ | V24-retro |
| AAV2retro.flex.eGFP | ssAAV-retro/2-shortCAG-dlox-EGFP(rev)-dlox-WPRE-SV40p(A) | Viral Vector facility UZH/ETHZ | V158-retro |
| AAV2retro.flex.tdTomato | ssAAV-retro/2-shortCAG-dlox-tdTomato(rev)-dlox-WPRE- hGHp(A) | Viral Vector facility UZH/ETHZ | V167-retro |
| AAV2retro.flex.FLPo.BFP | ssAAV-retro/2-hSyn1-chI-dlox-EBFP2_2 A_FLPo(rev)-dlox-WPRE-SV40p(A) | Viral Vector facility UZH/ETHZ | V175-retro |
| AAV2retro.flex.FLPo.mCherry | ssAAV-retro/2-hSyn1-chI-mCherry_2 A_FLPo-WPRE-SV40p(A) | Viral Vector facility UZH/ETHZ | V173-retro |
| AAV9.flex.ChR2-YFP | ssAAV-9/2-hEF1a-dlox-hChR2(H134R)_EYFP(rev)-dlox-WPRE-hGHp(A) | Viral Vector facility UZH/ETHZ | v214-9 |
| AAV8.FRT.tdTomato | ssAAV-8/2-hSyn1-dlox-tdTomato(rev)-dlox-WPRE-bGHp(A) | Viral Vector facility UZH/ETHZ | v284-8 |
| AAV9.FRT.eGFP | ssAAV-9/2-hSyn1-chI-dFRT-EGFP(rev)-dFRT-WPRE-hGHp(A) | Viral Vector facility UZH/ETHZ | V335-9 |
| AAV9.FRT.hM3D(q).mCherry | ssAAV-9-hSyn1-dFRT-hM3D(Gq)-mCherry | Viral Vector facility UZH/ETHZ | V189-9 |
| AAV9.FRT.hM4D(i).mCherry | ssAAV-9/2-hSyn1-dFRT-hM4D(Gi)_mCherry(rev)-dFRT-WPRE-hGHp(A) | Viral Vector facility UZH/ETHZ | V190-9 |
| AAV9.FRT.ChR2-YFP | ssAAV-9/2-hSyn1-dFRT-hM4D(Gi)_mCherry(rev)-dFRT-WPRE-hGHp(A) | Viral Vector facility UZH/ETHZ | V190-9 |
| AAV9/2.FRT.eGFP.TeTxLC | ssAAV-9/2-hSyn1.chl-dFRT-EGFP-2A-FLAG:TeTxLC(rev)-dFRT-WPRE-hGHp(A) | Viral Vector facility UZH/ETHZ | v450-9 |
| SAD pseudotyped rabies | SAD.RabiesDG-eGFP (SAD-G) | Karl-Klaus Conzelmann | N/A |
| EnvA pseudotyped rabies | SAD.RabiesDG-GFP (EnvA) | Karen Haenraets | N/A |
| CTb | Cholera Toxin b subunit | Sigma Aldrich | C9903-.5MG/ |
Table 8
Antibodies used in the study.
| Antibody | Host | Supplier/Source | Cat#/RRID | Dilution |
|---|---|---|---|---|
| GFP | Chicken | LifeTech | A10262/ AB_2619988 | 1:1000 |
| TPH2 | Rabbit | Novus Biologicals | NB100-74555/AB_572263 | 1:1000 |
| Ctb | Goat | LIST biological laboratories inc. | #703/AB_2314252 | 1:1000 |
| mCherry | Goat | Sicgen | AB0081-200/AB_2333094 | 1:500 |
| tdTomato | Goat | Sicgen | AB8181−200/AB_2722750 | 1:500 |
| 5-HT | Rabbit | ImmunoStar | 20080/AB_572263 | 1:1000 |
| NeuN | Guinea pig | Synaptic systems | 266004/AB_2619988 | 1:1000 |
| Chicken-Alexa 488 | Donkey | Jackson ImmunoResearch | 703-546-155/AB_2340376 | 1:500 |
| Goat-Cy3 | Donkey | Jackson ImmunoResearch | 705-166-147/AB_2340413 | 1:500 |
| Goat-Alexa 488 | Donkey | Jackson ImmunoResearch | 795-546-147/ - | 1:500 |
| Guinea pig-Alexa 647 | Donkey | Jackson ImmunoResearch | 706-496-148/ - | 1:500 |
| Rabbit-Alexa 647 | Donkey | Jackson ImmunoResearch | 711-607-003/AB_2340626 | 1:500 |
| Rabbit-Cy3 | Donkey | Jackson ImmunoResearch | 711-165-152/AB_2307443 | 1:500 |
Additional files
Download links
A two-part list of links to download the article, or parts of the article, in various formats.
Downloads (link to download the article as PDF)
Open citations (links to open the citations from this article in various online reference manager services)
Cite this article (links to download the citations from this article in formats compatible with various reference manager tools)
Targeted anatomical and functional identification of antinociceptive and pronociceptive serotonergic neurons that project to the spinal dorsal horn
eLife 12:e78689.
https://doi.org/10.7554/eLife.78689


