Nuclear receptor corepressor 1 controls regulatory T cell subset differentiation and effector function
- Medical University of Vienna, Center for Pathophysiology, Infectiology and Immunology, Institute of Immunology, Austria
- Medical University of Vienna, Vienna, Department of Medicine I, Laboratory of Infection Biology, Austria
- CeMM Research Centre for Molecular Medicine of the Austrian Academy of Sciences, Austria
- Medical University of Vienna, Department of Laboratory Medicine, Austria
- Medical University of Vienna, Center for Medical Statistics, Informatics, and Intelligent Systems, Institute of Artificial Intelligence, Austria
- Medical University of Vienna, Department of Internal Medicine III, Division of Gastroenterology and Hepatology, Hans Popper Laboratory of Molecular Hepatology, Austria
- Medical University of Vienna, Vienna, Center for Pathophysiology, Infectiology and Immunology, Institute for Hygiene and Applied Immunology, Austria
Figures
Figure 1 with 3 supplements
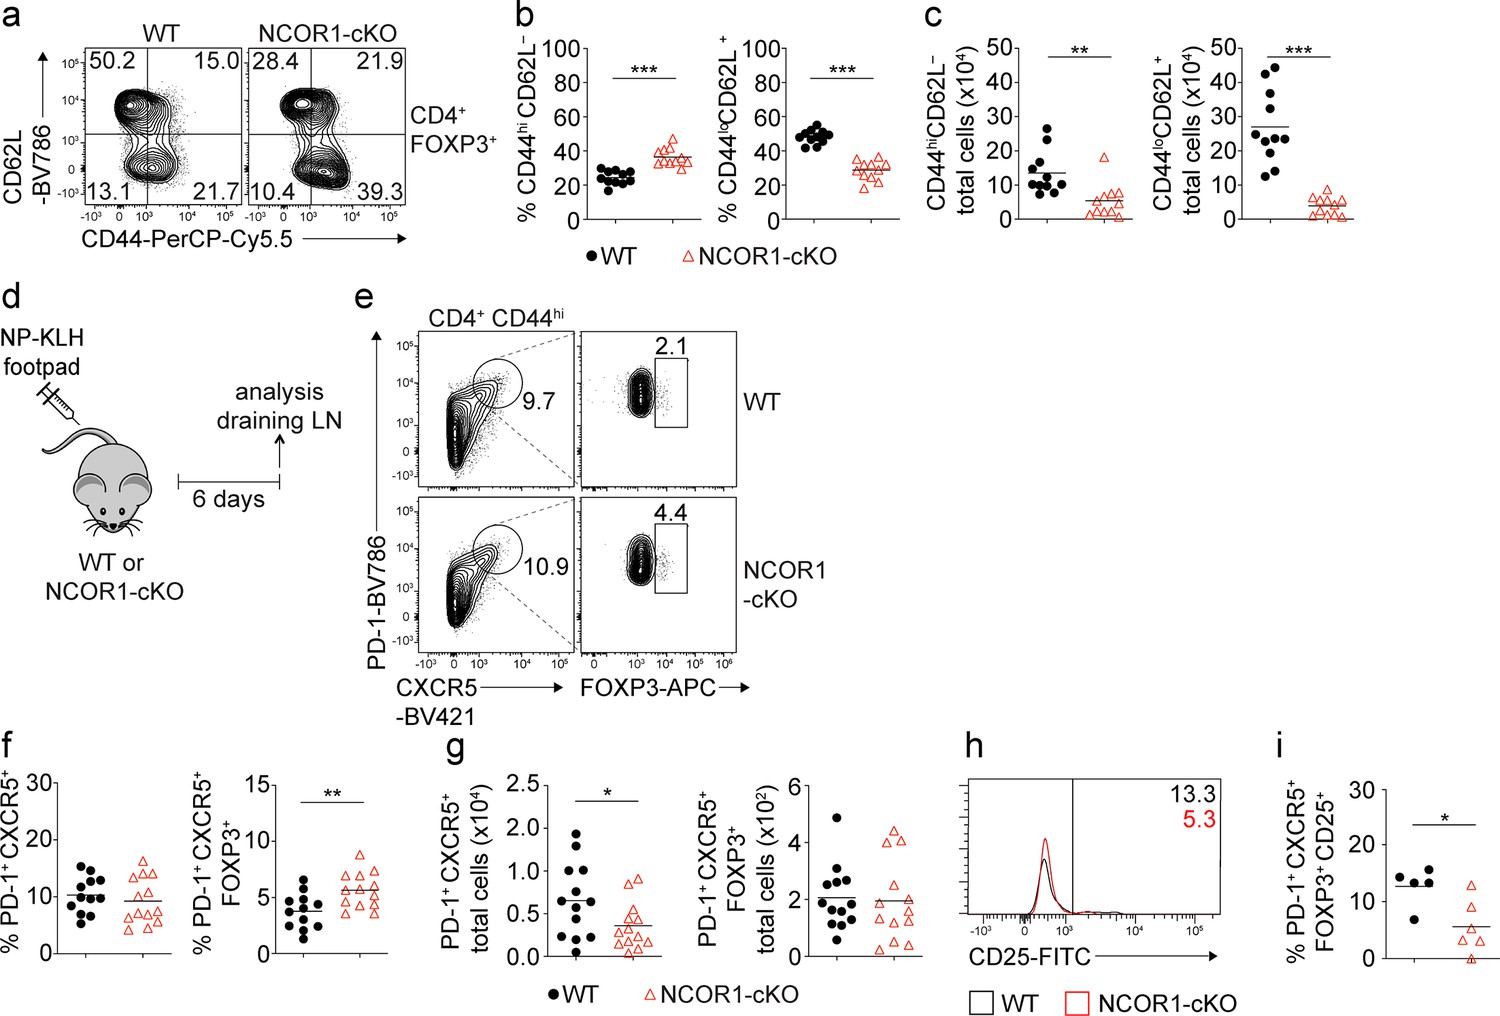
Loss of NCOR1 leads to a relative increase in CD44hiCD62L– effector Treg cells.
(a) Flow cytometric analysis of splenocytes isolated from wild-type (WT) and NCOR1-cKO mice showing CD44 and CD62L expression in CD4+FOXP3+ cells at steady-state. (b) Diagrams showing the percentage of CD44hiCD62L– (left) and CD44loCD62L+ (right) CD4+FOXP3+ cells of all mice analyzed as described in (a). (c) Total cell numbers of CD44hiCD62L– (left) and CD44loCD62L+ (right) CD4+FOXP3+ cells of all mice analyzed are described in (a). (d) Experimental immunization strategy: mice were injected s.c. with nitrophenol keyhole limpet hemocyanin (NP-KLH) and draining lymph nodes (LNs) analyzed six days later. (e) Flow cytometric analysis of cells isolated from draining LN of NP-KLH-immunized WT and NCOR1-cKO mice showing the expression of PD-1, CXCR5, and FOXP3 on CD4+CD44hi cells. (f) Diagrams showing the percentage of T follicular helper (Tfh) cells (CD4+CD44hiPD1+) (left) and T follicular regulatory (Tfr) cells (CD4+CD44hiPD1+CXCR5+FOXP3+) (right) of all mice analyzed as described in (d,e). (g) Total cell numbers of Tfh cells (CD4+CD44hiPD1+CXCR5+) (left) and Tfr cells (CD4+CD44hiPD1+CXCR5+FOXP3+) (right) of all mice analyzed as described in (d,e). (h) Flow cytometric analysis of cells isolated from draining LN of NP-KLH-immunized WT and NCOR1-cKO mice showing the expression CD25 in CD4+CD44hiPD1+CXCR5+FOXP3+ Tfr cells. (i) Percentage of CD25 expressing CD4+CD44hiPD1+CXCR5+FOXP3+ Tfr cells of all mice analyzed as described in (h). (a,e,h) Numbers indicate the percentages of cells in the respective quadrants or gates. (a–c) Cells were pre-gated on CD4 and FOXP3. (b,c,f,g,i) Each symbol indicates one mouse. Horizontal bars indicate the mean. *p<0.05, **p<0.01, and ***p<0.001; Unpaired two-tailed Student’s t-test. Data are representative (a,e,h) or show the summary (b,c,f,g,i) of at least eleven (b,c), twelve (f,g) or five (i) mice that were analyzed in at least two independent experiments.
Figure 1—figure supplement 1
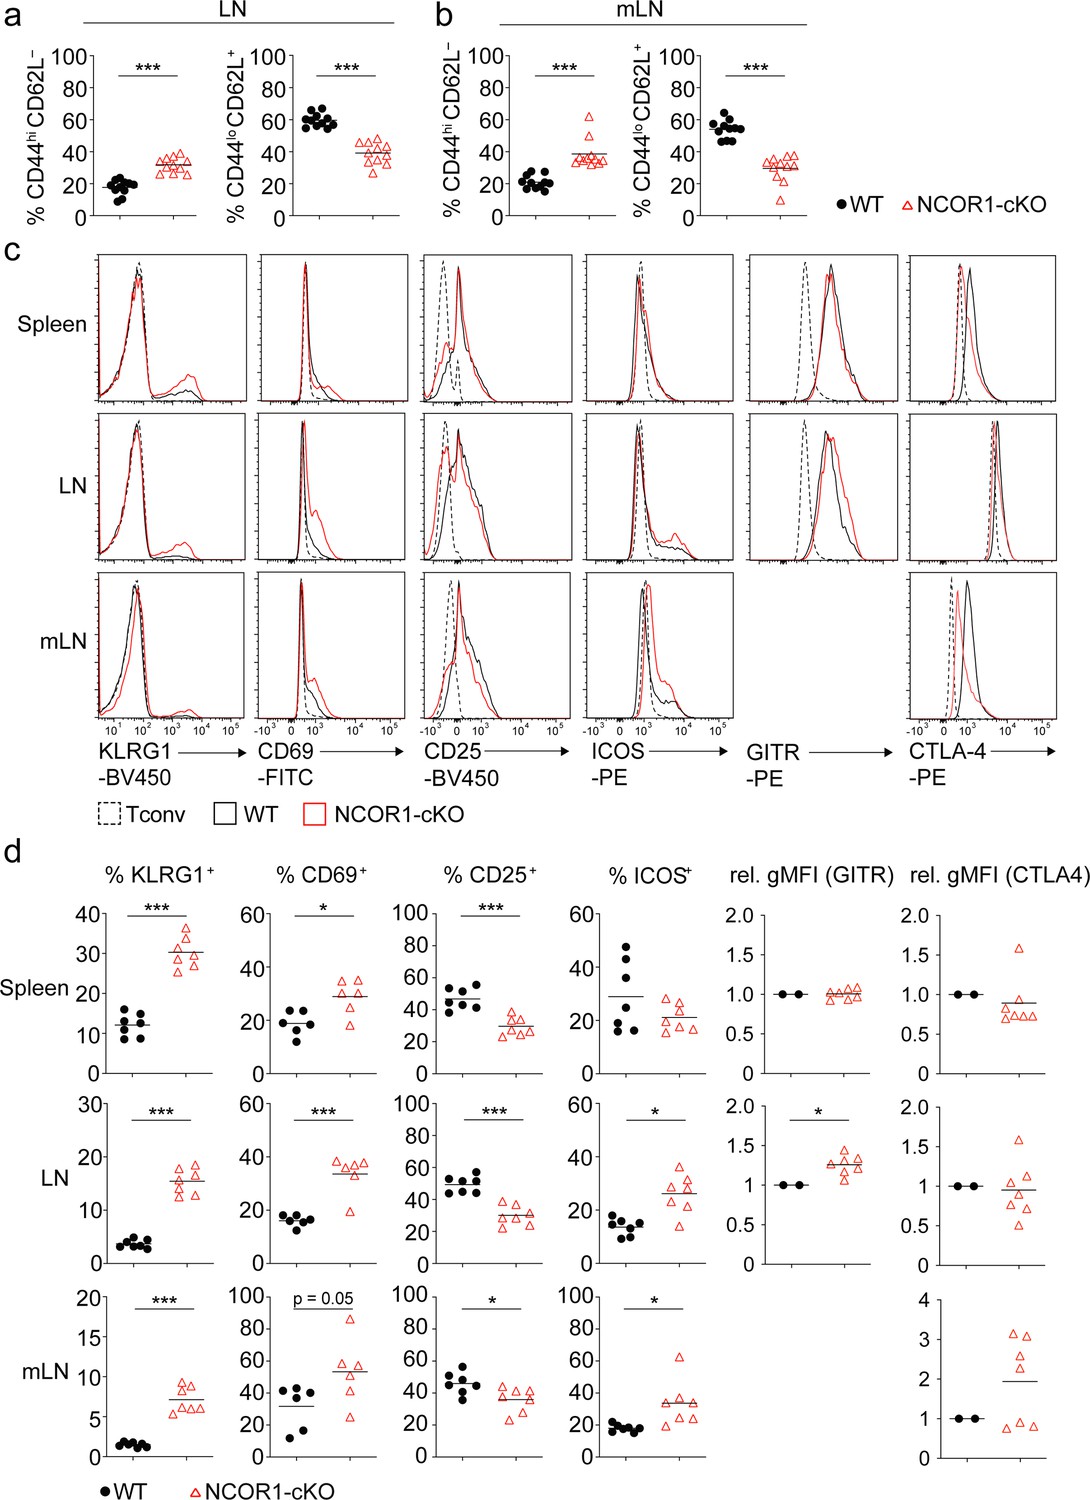
Effector markers are upregulated in NCOR1-deficient Treg cells.
(a) Diagrams showing a summary of the percentage of CD44hiCD62L– (left) and CD44loCD62L+ (right) CD4+FOXP3+ cells from lymph nodes (LNs) of wild-type (WT) and NCOR1-cKO mice. (b) Diagrams showing a summary of the percentage of CD44hiCD62L– (left) and CD44loCD62L+ (right) CD4+FOXP3+ cells from mesenteric LNs (mLNs) of WT and NCOR1-cKO mice. (c) Histograms displaying expression of KLRG1, CD69, CD25, ICOS, GITR, and CTLA4 in WT and NCOR1-cKO Treg cells from spleen, LNs and mLNs. The dotted lines indicate expression on conventional CD4+ T cells (Tconv). (d) Diagrams showing the summary of all experiments performed as described in (c). For the calculation of GITR and CTLA4 relative gMFI levels, the average expression levels in WT cells (n=4 in experiment 1 and n=3 in experiment 2) were set as 1 and relative gMFI on individual NCOR1-cKO Treg samples (n=4, and n=3) was calculated. (a,b,d) Each symbol indicates one mouse. Horizontal bars indicate the mean. *p<0.05, **p<0.01, and ***p<0.001; unpaired two-tailed Student’s t-test. Data are representative (c) or show a summary (a,b,d) of at least seven mice analyzed in at least two independent experiments.
Figure 1—figure supplement 2
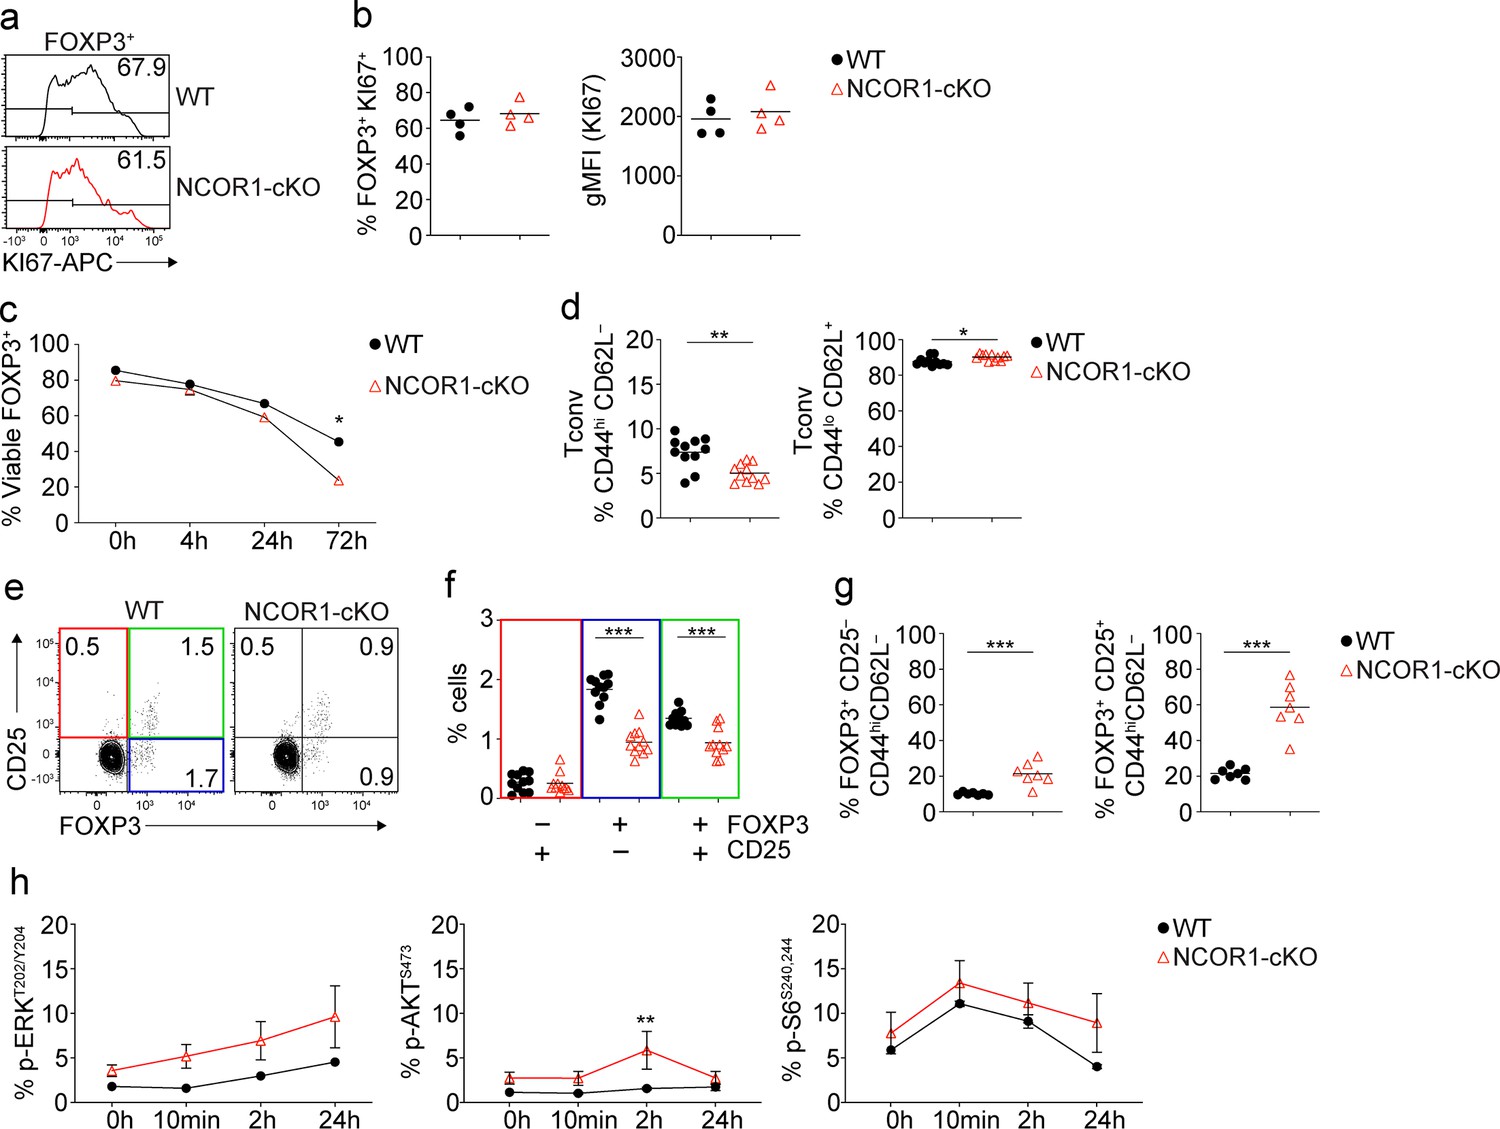
Characterization of FOXP3+ Treg cells isolated from NCOR1-cKO mice.
(a) Flow cytometric analysis of wild-type (WT) and NCOR1-cKO splenocytes showing expression of Ki67 in CD4+ FOXP3+ cells at steady state. (b) Summary showing percentage (left) and expression (gMFI) (right) of Ki67 in CD4+FOXP3+ cells of all mice analyzed as described in (a). (c) Summary showing the percentage of viable FOXP3+ splenocytes cultured in the presence of anti-CD3/anti-CD28 over the course of 3 days. (d) Diagrams showing the percentages of CD44hiCD62L– (left) and CD44loCD62L+ (right) conventional CD4+ T cells (FOXP3–) (Tconv) isolated from the spleens of WT and NCOR1-cKO mice. (e) Flow cytometric analysis showing FOXP3 and CD25 expression in WT and NCOR1-cKO CD4SP thymocytes. (f) Diagram showing the percentage of FOXP3–CD25+, FOXP3+CD25– and FOXP3+CD25+ CD4SP thymocytes of all mice analyzed as described in (e). (g) Diagrams showing the percentages of thymic CD25–CD44hiCD62L– and CD25+CD44hiCD62L– subsets on FOXP3+ CD4SP cells from WT and NCOR1-cKO mice. (h) Summary showing the percentage of phospho-ERKT202/Y204, phospho-AKTS473 and phospho-S6S240/244 expression in FOXP3+ splenocytes cultured in the presence of anti-CD3/anti-CD28 over the course of 24hr. (a) Numbers indicate the percentages of cells positive for Ki67. (e) Numbers indicate the percentages of cells in the respective quadrants. (b,d,f,g) Each symbol indicates one mouse. Horizontal bars indicate the mean. *p<0.05, **p<0.01, and ***p<0.001. (b,d,f,g) Unpaired two-tailed Student’s t-test. (c,h) Two-way ANOVA analysis followed by Tukey’s multiple-comparisons test. Data are representative (a,e) or show a summary (c,d,f,g,h) of at least two independent samples (c,h) or at least seven (f,g) or eleven (d) mice that were analyzed in one (c,h) or at least two (d) or three (f, g) independent experiments.
Figure 1—figure supplement 3

Gating strategies for flow cytometric analysis.
(a) Gating strategy for identification of effector (CD44hiCD62L–) and naïve (CD44loCD62L+) Treg cells: After exclusion of debris (FSC-A/ SSC-A), doublets (FSC-H/ FSC-W) and dead cells (using Viability Dye eFluor 506 or 780), cells were distinguished via their expression of CD19 (BV605) and TCRβ (BV711), CD4 (PE-Cy7) and CD8 (AF700) and FOXP3 (APC). Cells were further gated based on their expression of CD44 (PerCP-Cy5.5) and CD62L (APC-Cy7). (b) Gating strategies for identification of Tfh (CXCR5+PD1+CD44hi) and Tfr (CXCR5+PD1+CD44hiFOXP3+) cells: Debris, doublets, and dead cells were excluded as described in (a). Cells were distinguished via their expression of CD19 (BV605) and TCRβ (BV711), CD4 (PE-Cy7) and CD8 (AF700), CD44 (PerCP-Cy5.5), CXCR5 (BV421) and PD-1 (BV786) and FOXP3 (APC). (c) Gating strategy for the adoptive transfer colitis experiment: After exclusion of debris (FSC-A/ SSC-A) and doublets (FSC-H/ FSC-W) cells were distinguished via their expression of CD4 (PE-Cy7) and their viability using the Viability Dye eFluor 506. Cells were further gated based on their expression of CD45.1 (PE/ Dazzle) and FOXP3 (APC). (d) Gating strategy for the CRISPR-Cas9 mediated knockout experiment: After exclusion of debris (FSC-A/ SSC-A) and doublets (FSC-H/FSC-W) cells were distinguished via their expression of FOXP3 (eFluor 450) and MYC (AF647) or via their expression of the markers CD45RA (PE), CD45RO (APC-Cy7), and CD27 (AmCyan).
Figure 2
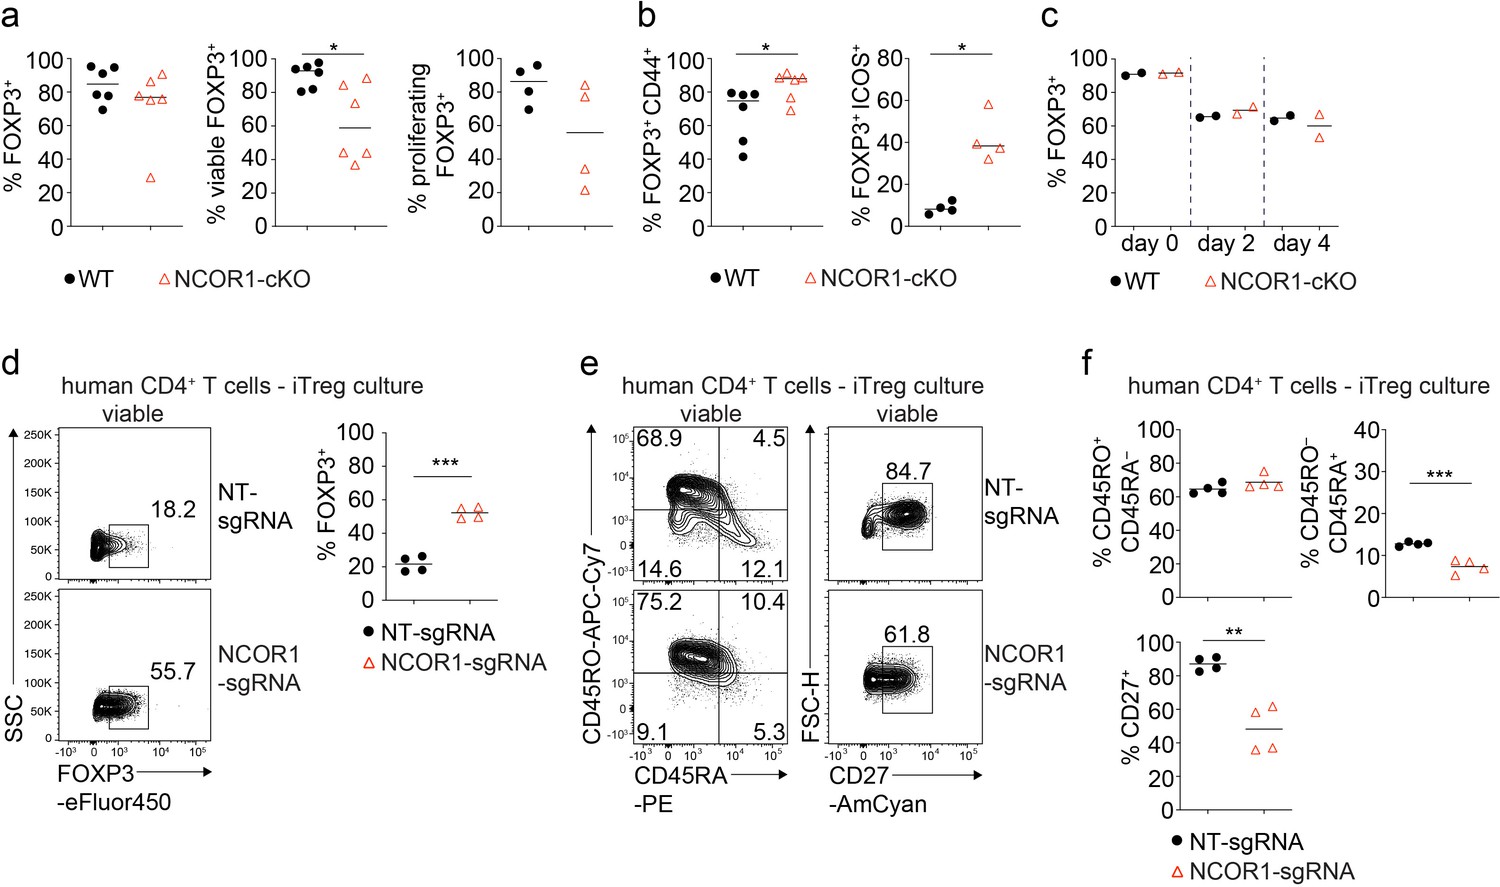
NCOR1 controls effector features in murine and human iTreg cells.
(a,b) Naïve wild-type (WT) and NCOR1-cKO CD4+ T cells were activated with anti-CD3/anti-CD28 for 3 days in the presence of TGFβ and IL2. (a) Diagrams show the summary of the percentages of WT and NCOR1-cKO FOXP3+ (left), of viable FOXP3+ (middle) and of proliferating FOXP3+ (right) iTreg cells at day 3. (b) Summaries of the percentages of CD44hi FOXP3+ (left) and ICOS+ FOXP3+ (right) cells. (c) Maintenance of FOXP3 expression in iTreg cells differentiated from WT and NCOR1-cKO naive CD4+ T cells over the course of 3 days upon restimulation with anti-CD3/anti-CD28 in the absence of TGFβ. (d) Flow cytometric analysis showing FOXP3 expression in human CD4+ T cells cultured under iTreg conditions after CRISPR-Cas9-mediated knockout of NCOR1 (NCOR1-sgRNA) or in non-targeting control samples (NT-sgRNA). Diagram at the right shows the summary of all experiments. (e) Flow cytometric analysis showing CD45RA, CD45RO, and CD27 expression on human iTreg cells after CRISPR-Cas9-mediated NCOR1 knockout as described in (d). (f) Summaries of the experiments as described in (e). (d,e) Cells were pre-gated on the total viable cell population. (a,b,c) Each symbol indicates one mouse. Horizontal bars indicate the mean. *p<0.05, **p<0.01, and ***p<0.001. (a,b,c) Unpaired two-tailed Student’s t-test. Data show a summary (a,b,c) of two to six mice that were analyzed in one to three experiments. (d,f) Each symbol indicates one sample. Horizontal bars indicate the mean. *p<0.05, **p<0.01, and ***p<0.001; unpaired two-tailed Student’s t-test (d,f). Data are representative (d,e) or show the summary (d,f) of CD4+ T cells from four individual healthy donors which were analyzed in one experiment.
Figure 3 with 1 supplement
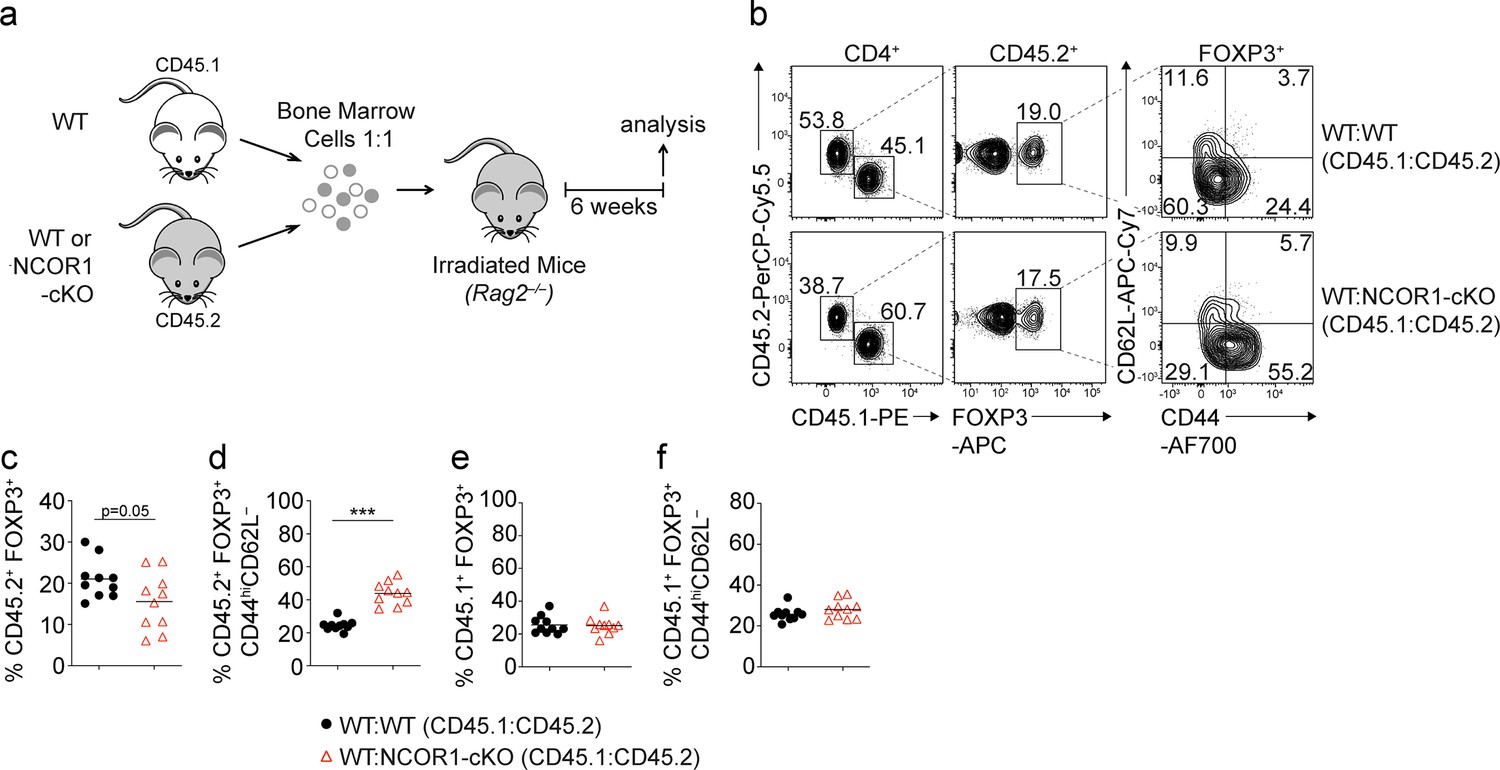
NCOR1 regulates the ratio of naive to effector Treg cells in a Treg cell-intrinsic manner.
(a) Experimental strategy for generating bone marrow (BM) chimeric mice. (b) Flow cytometric analysis showing the distribution of CD45.1+ and CD45.2+ cells as well as the expression of FOXP3, CD44 and CD62L in recipient mice injected with a mix of either WT:WT or WT:NCOR1-cKO BM cells. (c–f) Summary of all experiments as described in (b) showing the percentages of FOXP3+ cells (c,e) and CD44hiCD62L– cells (d,f) within the CD45.2+ (c,d) and CD45.1+ (e, f) subsets in the spleens of recipient Rag2–/– mice injected with a mix of either WT:WT or WT:NCOR1-cKO BM cells. (b) Numbers indicate the percentages of cells in the respective gates or quadrants. (c–f) Cells were pre-gated on CD4+ T cells. Each symbol indicates one mouse. Horizontal bars indicate the mean. *p<0.05, **p<0.01, and ***p<0.001; unpaired two-tailed Student’s t-test. Data are representative (b) or show a summary (c–f) of ten mice that were analyzed in two independent experiments.
Figure 3—figure supplement 1
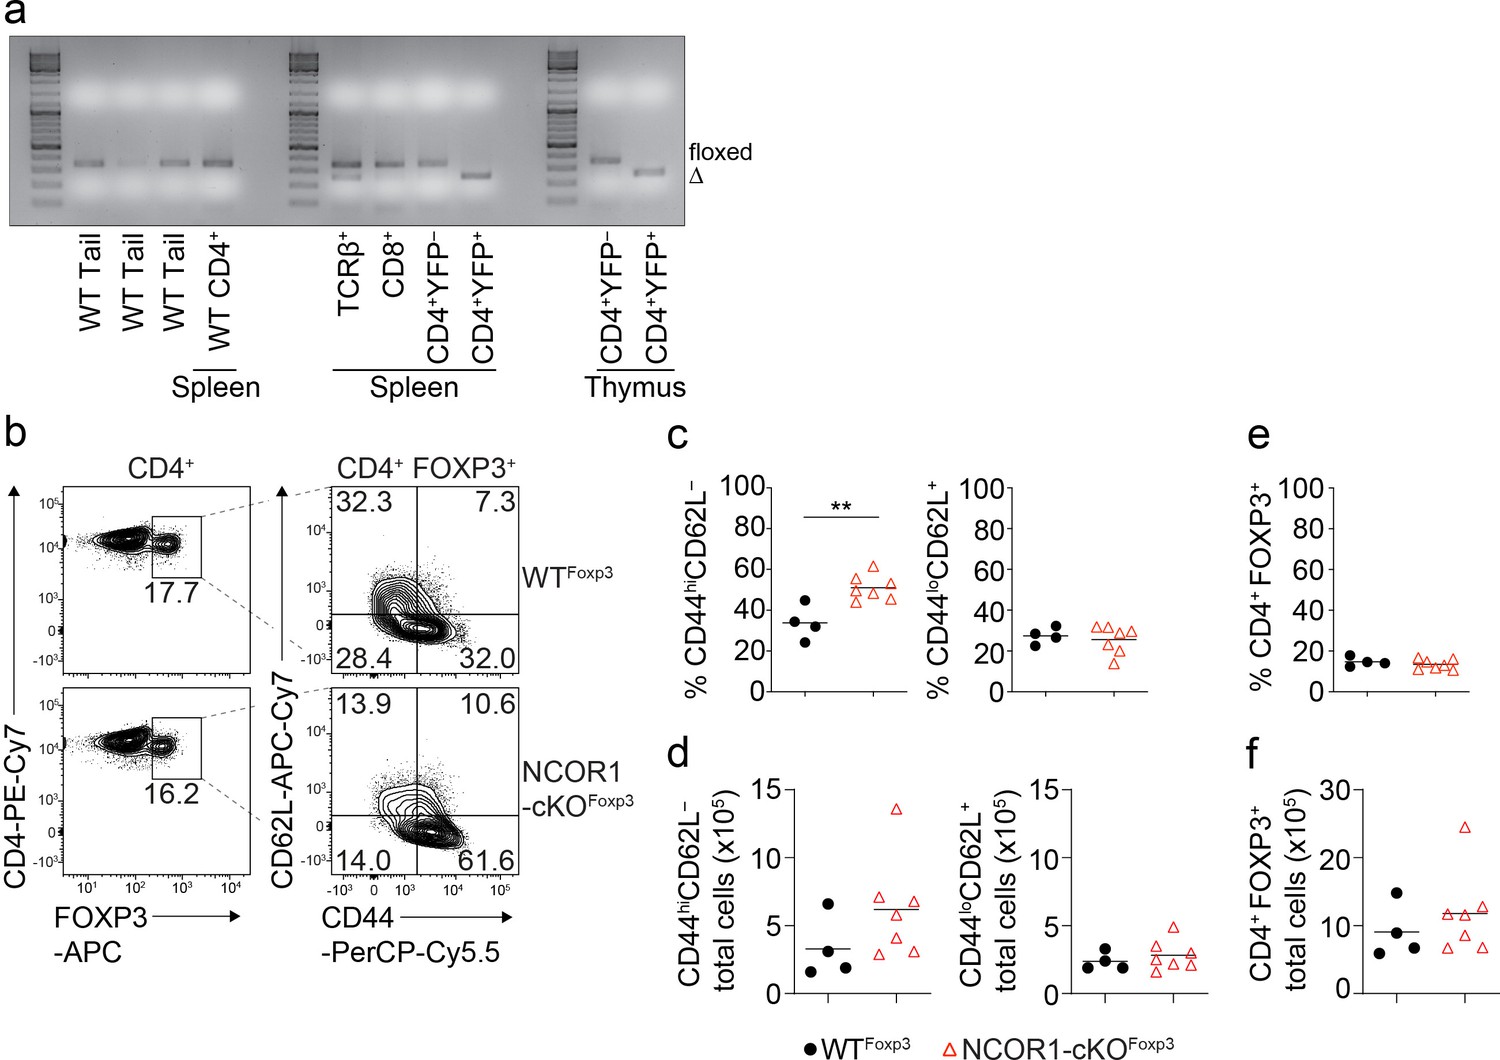
Treg cell-specific deletion of NCOR1 results in enhanced CD44hiCD62L– effector Treg cell subsets.
(a) Representative agarose gel picture showing Ncor1 deletion PCR in WT tail samples and FACS-sorted WT CD4+ splenocytes (left panel), TCRß+, CD8+, CD4+YFP–, and CD4+YFP+ cells isolated from the spleen of NCOR1-cKOFoxp3 mice (middle panel) and CD4+YFP– and CD4+YFP+ cells isolated from the thymus (right panel) of NCOR1-cKOFoxp3 mice. Two mice were pooled for sorting. Size of floxed PCR fragment: 346bp. Size Δ fragment: 246bp. (b) Flow cytometric analysis of FOXP3, CD44 and CD62L expression on splenic CD4+ T cells from WTFoxp3 and NCOR1-cKOFoxp3 mice. (c) Diagrams show the summary of the percentages of splenic CD44hiCD62L– (left) and CD44loCD62L+ (right) cells from WTFoxp3 and NCOR1-cKOFoxp3 mice as described in (b). (d) Summary diagrams of total cell numbers of splenic CD44hiCD62L– (left) and CD44loCD62L+ (right) cells from WTFoxp3 and NCOR1-cKOFoxp3 mice. (e) Summary diagram showing the percentages of splenic CD4+FOXP3+ cells from WTFoxp3 and NCOR1-cKOFoxp3 mice. (f) Summary diagram showing total cell numbers of splenic CD4+FOXP3+ cells from WTFoxp3 and NCOR1-cKOFoxp3 mice. (c–f) Each symbol indicates one mouse. Horizontal bars indicate the mean. **p<0.01; unpaired two-tailed Student’s t-test. Data are representative (b) or show a summary (c–f) of four to seven mice that were analyzed in two independent experiments.
-
Figure 3—figure supplement 1—source data 1
Raw, uncropped agarose gel picture showing Ncor1 deletion PCR indicating Ncor1 deletion.
Representative agarose gel picture showing Ncor1 deletion PCR results in WT tail samples and FACS-sorted WT CD4+ splenocytes (left panel), TCRß+, CD8+, CD4+YFP–, and CD4+YFP+ cells isolated from the spleen of NCOR1-cKOFoxp3 mice (middle panel) and CD4+YFP– and CD4+YFP+ cells isolated from the thymus (right panel) of NCOR1-cKOFoxp3 mice. Two mice were pooled for sorting. Size of floxed PCR fragment: 346bp. Size Δ fragment: 246bp.
- https://cdn.elifesciences.org/articles/78738/elife-78738-fig3-figsupp1-data1-v1.tiff
-
Figure 3—figure supplement 1—source data 2
Raw, uncropped agarose gel picture showing Ncor1 deletion PCR indicating Ncor1 deletion.
Representative agarose gel picture showing Ncor1 deletion PCR results in wild-type (WT) tail samples and FACS-sorted WT CD4+ splenocytes (left panel), TCRß+, CD8+, CD4+YFP–, and CD4+YFP+ cells isolated from the spleen of NCOR1-cKOFoxp3 mice (middle panel) and CD4+YFP– and CD4+YFP+ cells isolated from the thymus (right panel) of NCOR1-cKOFoxp3 mice. Two mice were pooled for sorting. Size of floxed PCR fragment: 346bp. Size Δ fragment: 246bp. The black rectangle framed section in the blot shows the cropped area of the final picture in Figure 3—figure supplement 1. Band sizes are indicated on the left side of the picture. Floxed/ delta fragments are indicated on the right side of the picture. The samples are indicated in the lower part of the picture.
- https://cdn.elifesciences.org/articles/78738/elife-78738-fig3-figsupp1-data2-v1.pdf
Figure 4 with 1 supplement
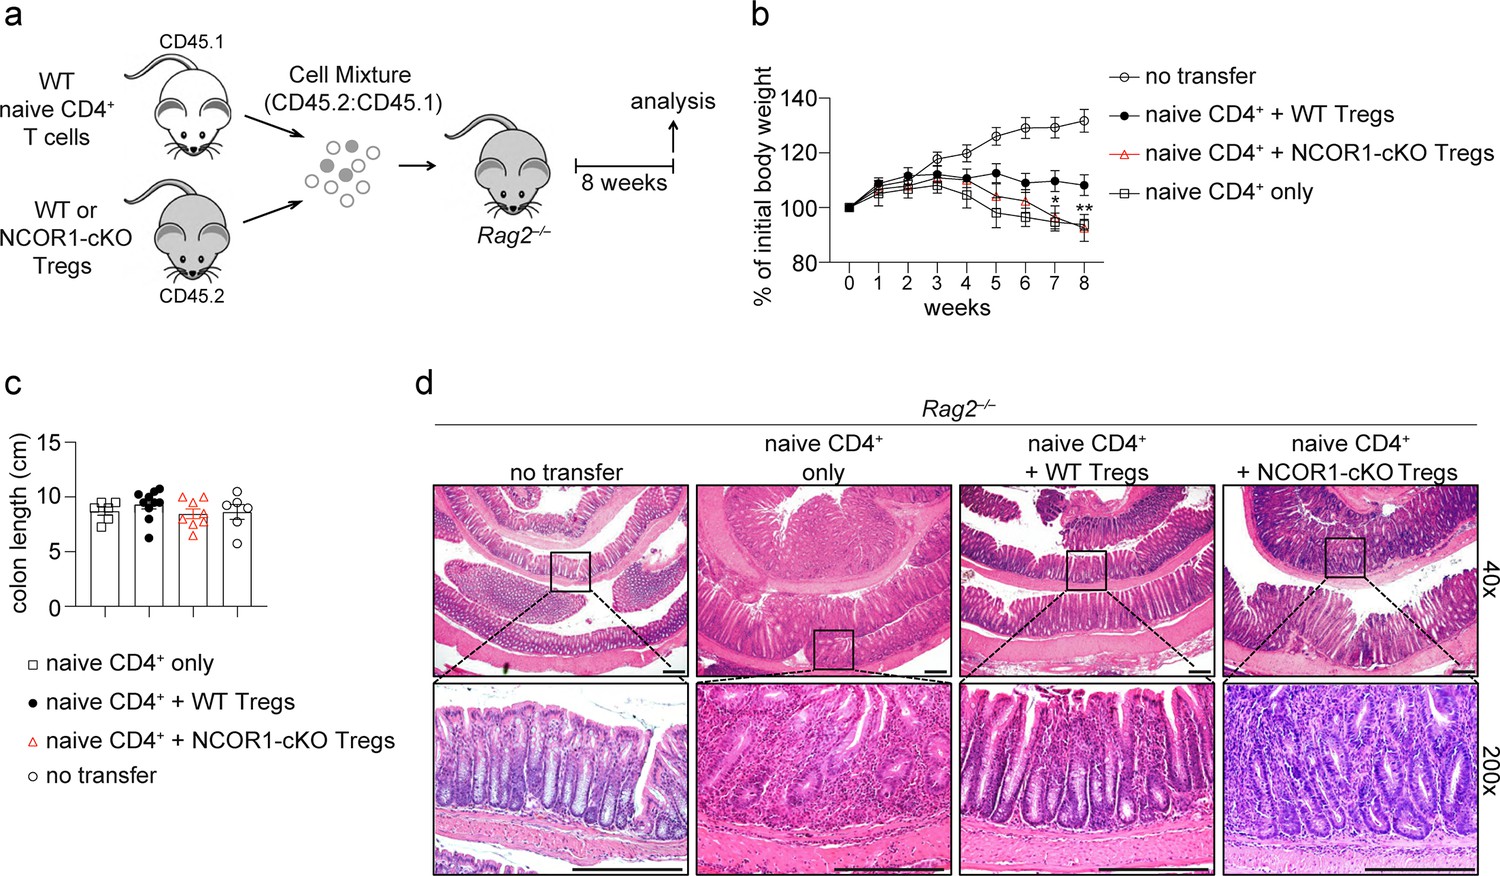
NCOR1 is essential for Treg cell-mediated protection in adoptive CD4+ T cell transfer colitis.
(a) Experimental protocol for adoptive transfer colitis. Control groups received naïve CD4+ T cells only or no cells at all (not shown). (b) Weight scores in percentages of initial body weight during the course of colitis in Rag2−/− recipient mice are shown. Data show the summary of at least eight mice (except control groups with six mice) of three independent experiments. *p<0.05, **p<0.01, and ***p<0.001 (two-way ANOVA analysis followed by Tukey’s multiple-comparisons test). For simplicity, significant differences are shown only between mice that received wild-type (WT) and NCOR1-cKO Treg cells. Of note, non-injected control mice gained significantly more weight (starting from around week 5) compared to all other groups. (c) Summary showing colon length from the various Rag2−/− recipient mice. (d) Colon swiss rolls were processed for hematoxylin and eosin (H&E) staining. The pictures in the bottom represent a 5x magnification of the black rectangle framed section in the top pictures. Magnification: 40x and 200x. Scale bar = 100µm. One representative picture is shown per condition.
Figure 4—figure supplement 1
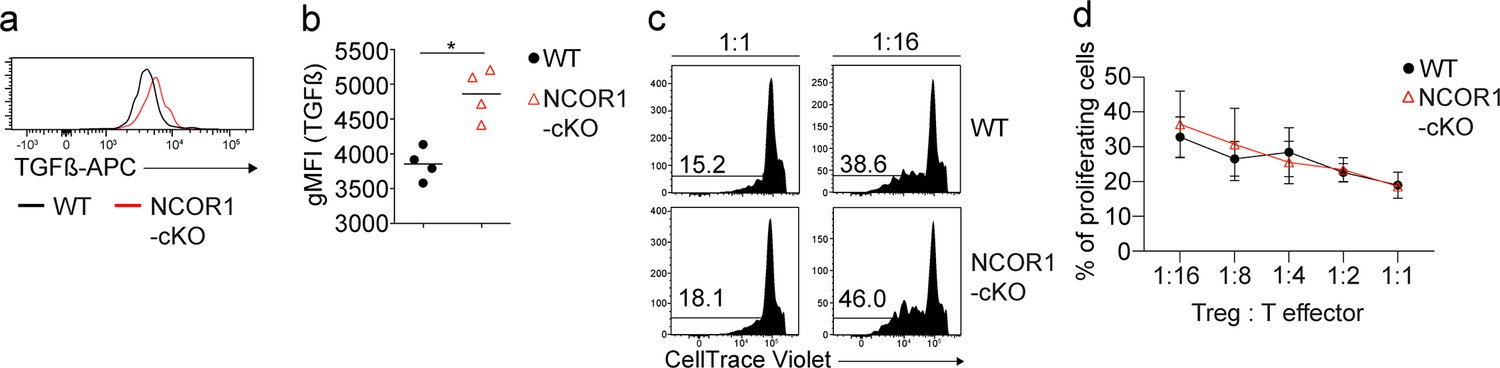
In vitro characterization of wild-type (WT) and NCOR1-cKO Treg cells.
(a) Flow cytometric analysis of splenocytes isolated from WT and NCOR1-cKO mice showing expression of TGFβ in CD4+FOXP3+ Treg cells after stimulation with PMA/ ionomycin for 4hr. (b) Summary showing TGFβ expression (gMFI) in FOXP3+ Treg cells of all mice analyzed as described in (a). (c) Histograms showing the proliferation of naïve CD4+ T cells co-cultured at different ratios with either WT or NCOR1-cKO Treg cells. (d) Summary showing the percentage of proliferating CD4+ T cells that have been cultured at different ratios with either WT or NCOR1-cKO Treg cells as described in (c). (c) Numbers indicate the percentages of cells in the respective gates. (b,d) Each symbol indicates one mouse or sample. (b) Horizontal bars indicate the mean. *p<0.05. Unpaired two-tailed Student’s t-test. Data are representative (a,c) or show a summary (b,d) of four (a) or at least two independent samples (c,d) that were analyzed in one experiment (a,b) or in two (c,d) independent experiments.
Figure 5 with 1 supplement
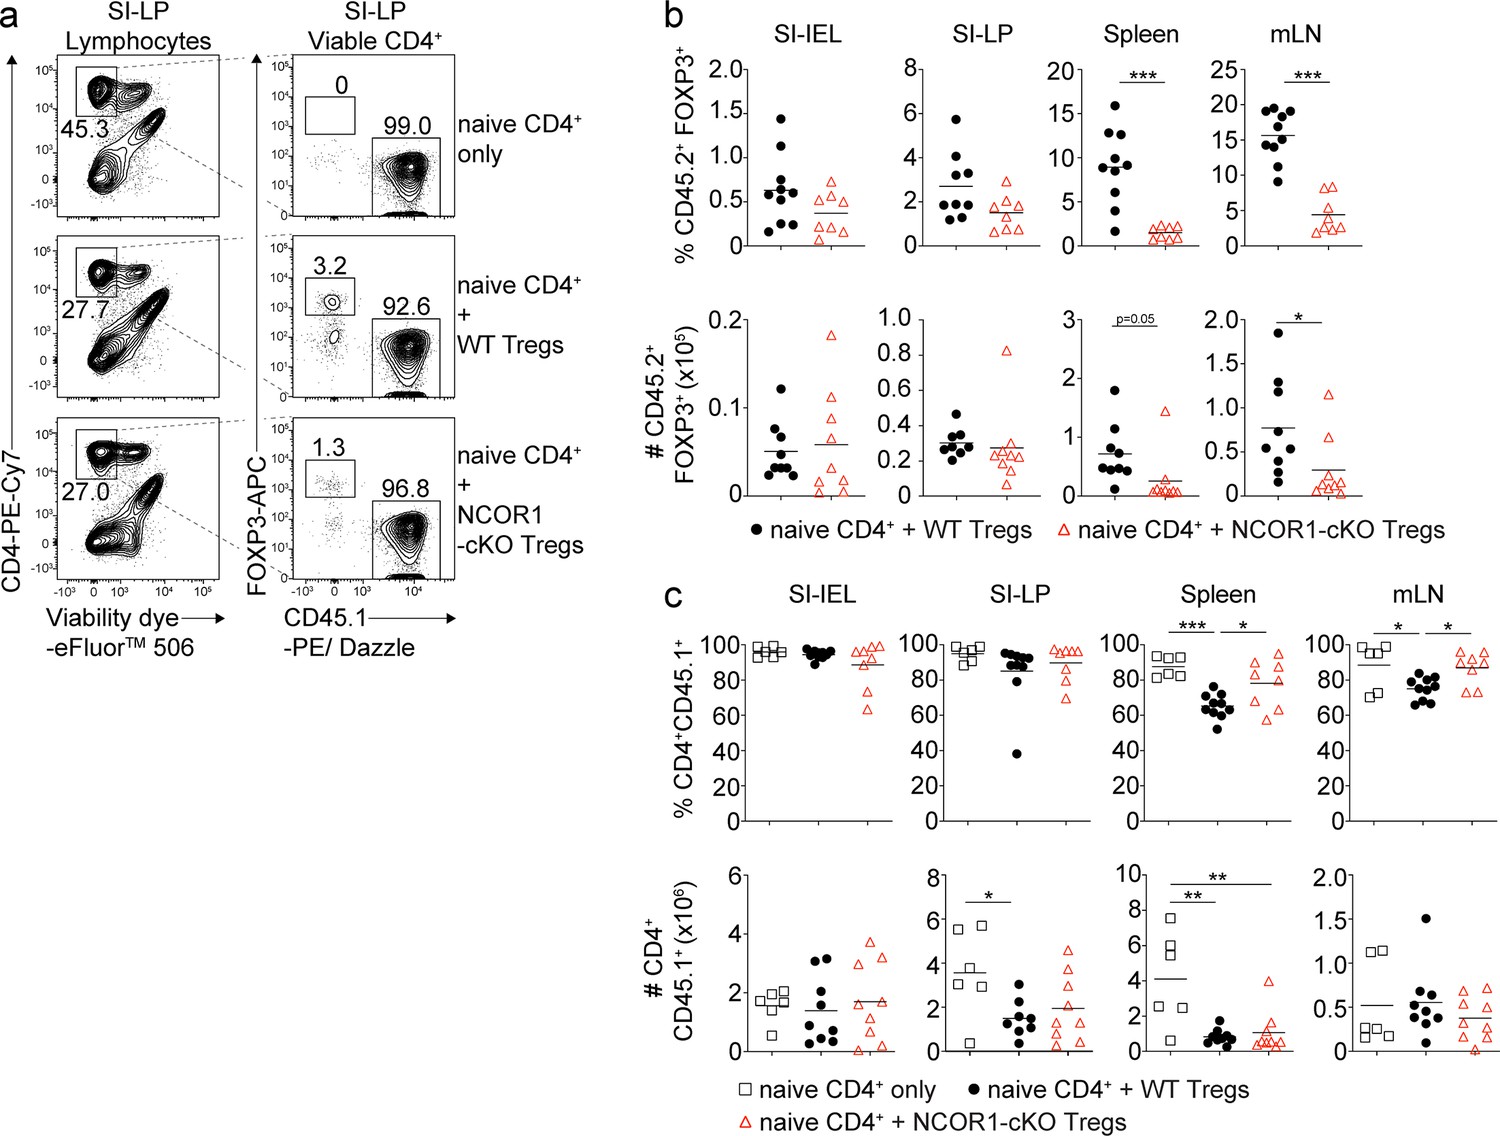
Similar frequencies and numbers of wild-type (WT) and NCOR1-cKO Treg cells within small intestinal intraepithelial lymphocyte (SI-IEL) and lamina propria cell (SI-LP) populations in adoptive CD4+ T cell transfer colitis.
(a) Flow cytometric analysis of SI-LP cells isolated from recipient Rag2–/– mice injected with WT CD45.1+CD4+ T cells only (top panel) or with WT CD45.1+CD4+ T cells together with either WT (middle panel) or NCOR1-cKO Treg cells (lower panel). Plots shows the percentage of viable CD4+, CD45.1+FOXP3– and CD45.1–FOXP3+ cells. (b) Percentages (upper panel) and numbers (lower panel) of CD45.2+FOXP3+ cells from SI-IEL, SI-LP, spleen, and mLNs of recipient Rag2–/– mice injected with WT CD45.1+CD4+ T cells together with either CD45.2+ WT or NCOR1-cKO Treg cells. (c) Percentages (upper panel) and numbers (lower panel) of CD4+CD45.1+ cells from SI-IEL, SI-LP, spleen, and mLNs of Rag2–/– mice injected with either WT Treg cells, NCOR1-cKO Treg cells, or injected with naïve CD4+ T cells only. (a) Numbers indicate the percentages of cells in the respective gate. (b,c) Each symbol indicates one mouse. Horizontal bars indicate the mean. *p<0.05, **p<0.01, and ***p<0.001. (b) Unpaired two-tailed Student’s t-test or (c) one-way ANOVA analysis followed by Tukey’s multiple-comparisons test. Data are representative (a) or show a summary (b,c) of at least eight mice (except control groups with six mice) that were analyzed in three independent experiments.
Figure 5—figure supplement 1
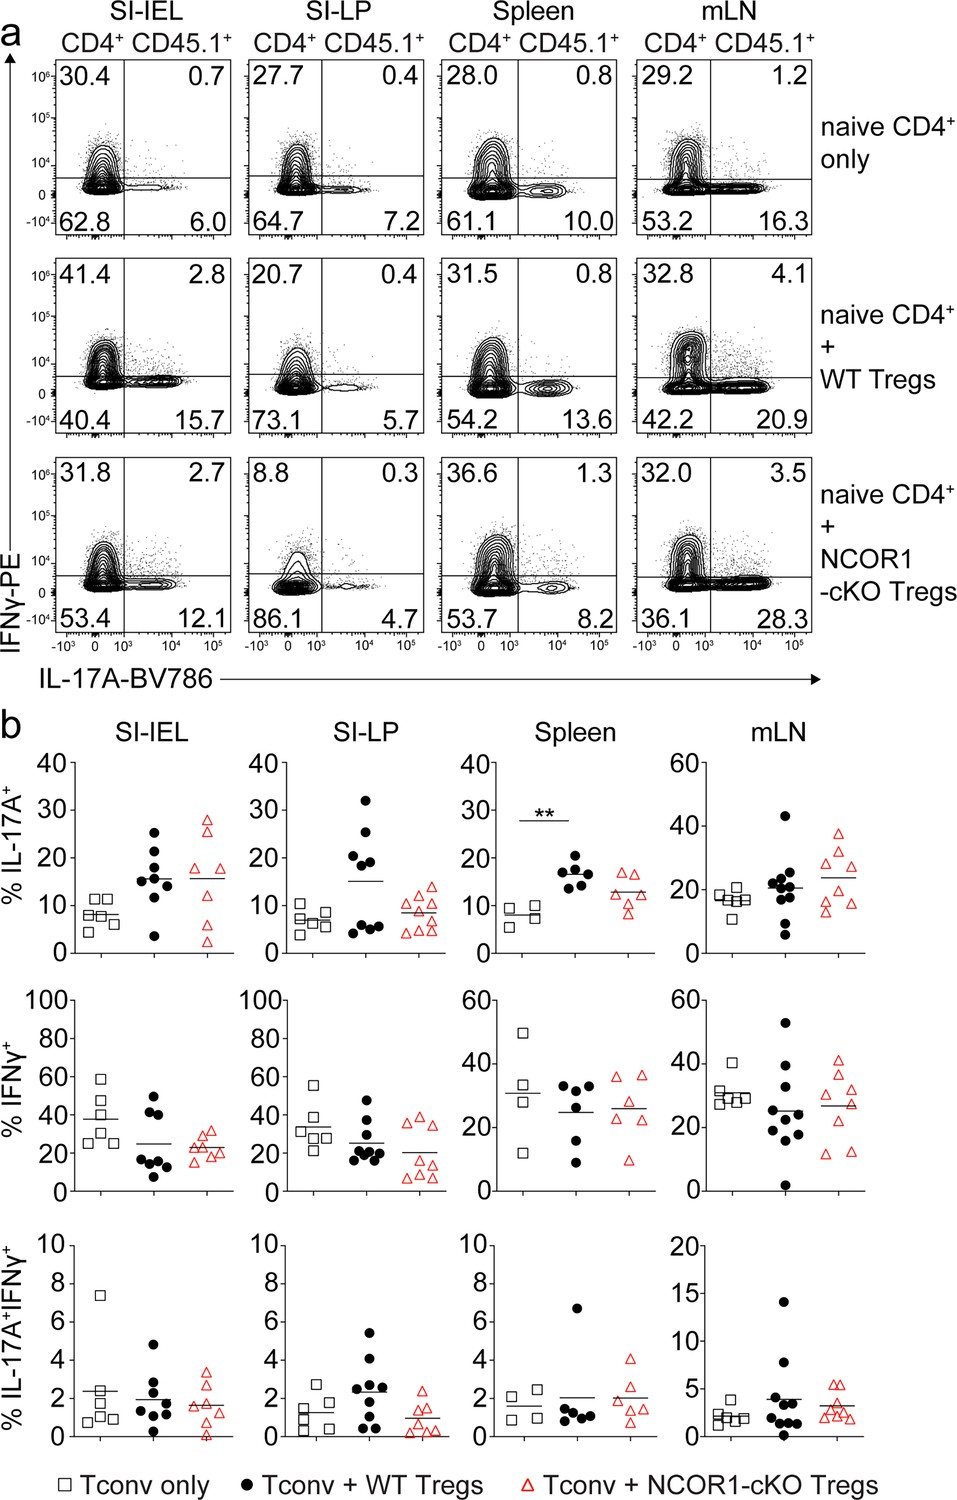
IFNγ and IL17A expression in CD4+ T cells co-transferred with either wild-type (WT) of NCOR1-cKO Treg cells.
(a) Flow cytometric analysis showing IFNγ and IL17A expression in CD45.1+ CD4+ T cells isolated from small intestinal intraepithelial lymphocytes (SI-IEL), small intestinal lamina propria cells (SI-LP), spleen and mLNs. (b) Summary of all experiments as described in (a). (a,b) Cells were pre-gated on CD4+ T cells. (a) Numbers indicate the percentages of cells in the respective quadrants. (b) Each symbol indicates one mouse. Horizontal bars indicate the mean. *p<0.05, **p<0.01, and ***p<0.001; one-way ANOVA analysis followed by Tukey’s multiple-comparisons test. Data are representative (a) or show the summary (b) of at least six mice (except CD4+ T cells only controls with at least four mice) that were analyzed in three independent experiments.
Figure 6 with 1 supplement
NCOR1 controls transcriptional states in naïve and effector Treg cells.
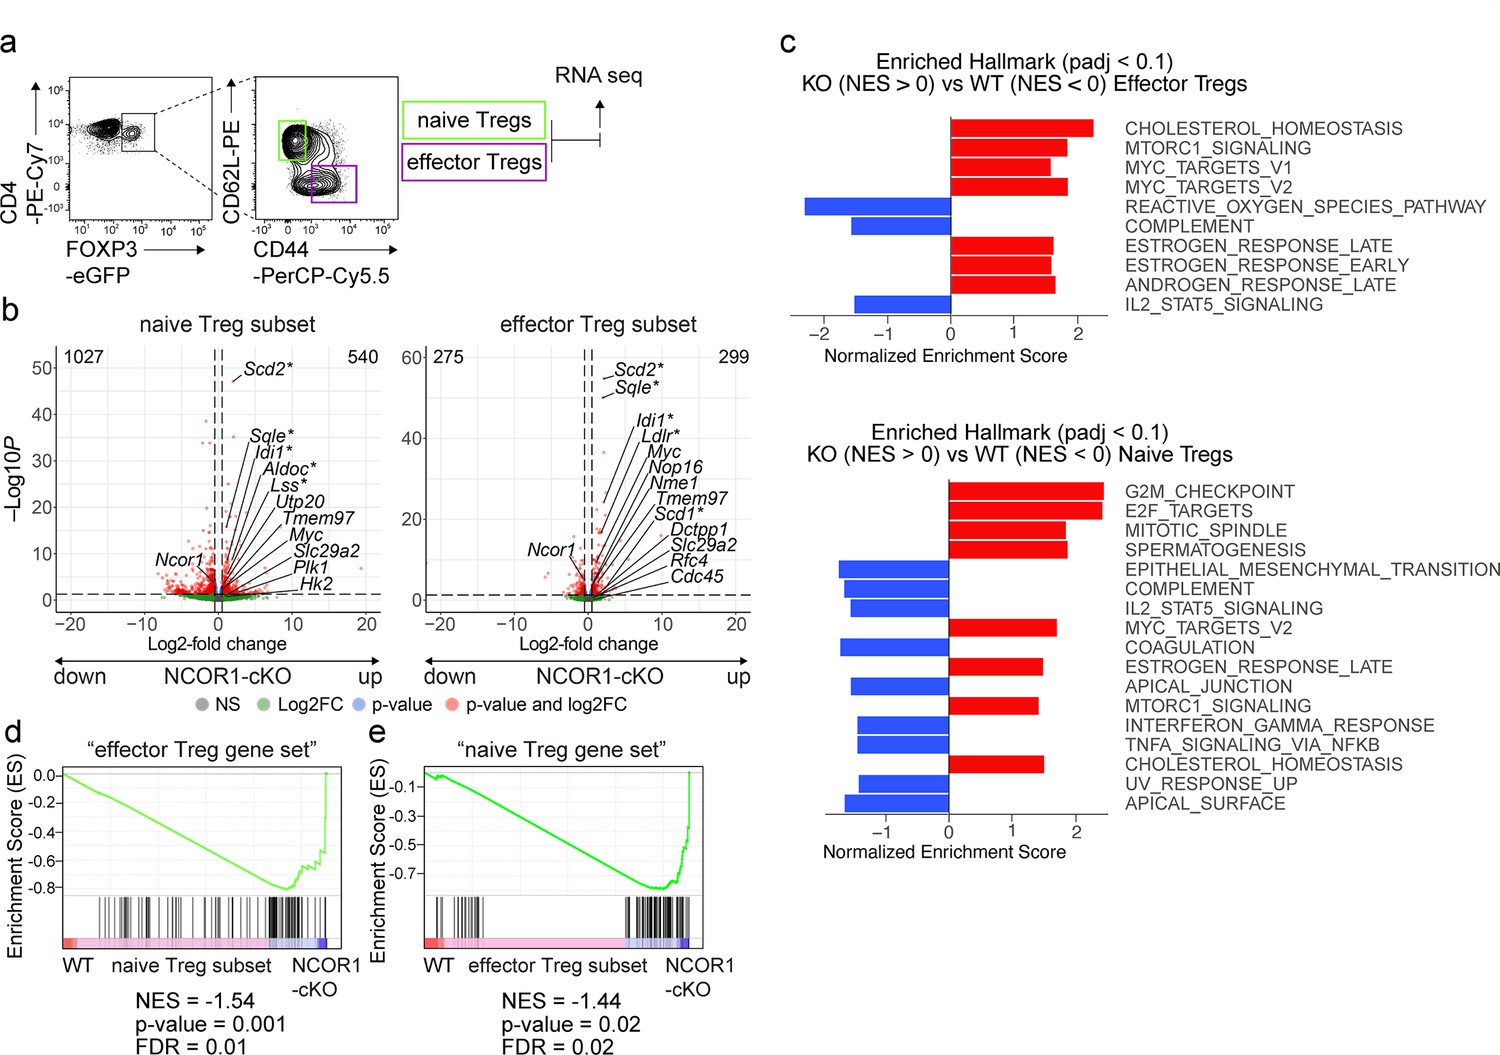
(a) Contour plots show the gating strategy for the isolation of Treg cells for RNA-sequencing. Cells from spleen and lymph nodes of WT.DEREG and NCOR1-cKO.DEREG mice were isolated and EGFP+ (i.e. FOXP3+) CD44hiCD62L– and CD44loCD62L+ cells were sorted and sequenced using the Illumina HiSeq 3000 platform. (b) Volcano plots depict a comparison of global gene expression profiles between naïve (CD44loCD62L+) WT and NCOR1-cKO Treg cells (left plot) and effector (CD44hiCD62L–) WT and NCOR1-cKO Treg cells (right plot). On the x-axis log2-fold change is plotted, while the y-axis indicates adjusted p-values (-log10). 1027 genes were downregulated and 540 genes were upregulated in naïve NCOR1-cKO Treg cells. 275 and 299 genes were down- and upregulated, respectively, in effector NCOR1-cKO Treg cells. In addition to Ncor1 and Myc, the top five genes leading to enrichment of cholesterol homeostasis (*) and of Myc targets v2 hallmark gene signatures are shown. (c) Diagram showing the top hits of enriched hallmark gene signatures in WT (NES<0) and NCOR1-cKO (NES>0) naïve (top) and effector (bottom) Treg cells. The x axis indicates the Z score. (d) Gene set enrichment analysis (GSEA) plots of an ‘effector Treg gene set’ (containing a list of 100 genes) in naïve NCOR1-cKO Treg cells compared to naïve WT Treg cells. (e) Gene set enrichment analysis (GSEA) plots of a ‘naïve Treg gene set’ (containing a list of 100 genes) in effector NCOR1-cKO Treg cells compared to effector WT Treg cells. (d,e) Barcodes indicate the location of the members of the gene set in the ranked list of all genes. NES, normalized enrichment score. The lists of the ‘naïve Treg gene set’ and the ‘effector Treg gene set’ are provided in Supplementary file 1g.
Figure 6—figure supplement 1
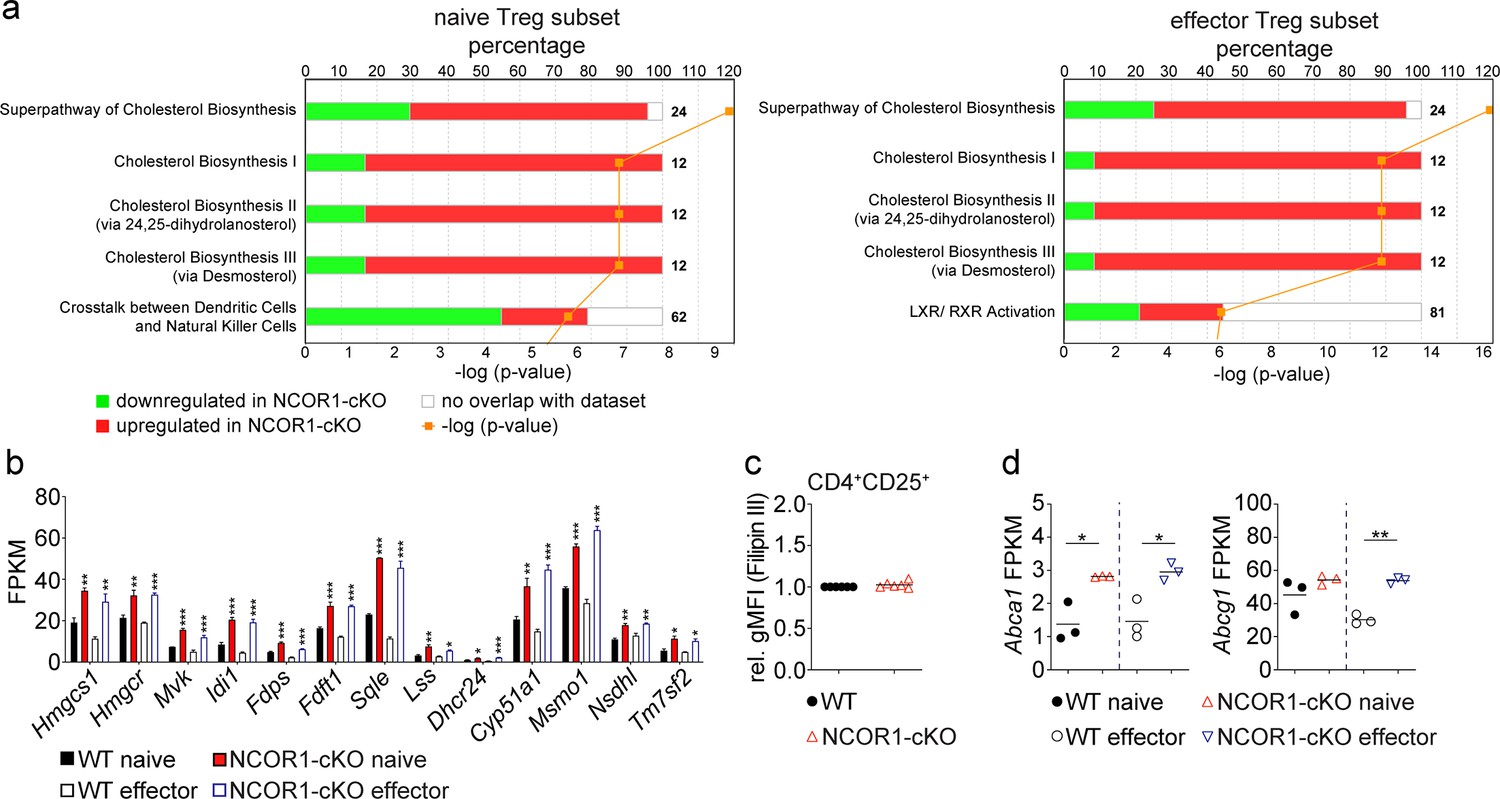
Deletion of NCOR1 leads to an upregulation of cholesterol pathways.
(a) Diagram showing top five pathways which are up- or downregulated in naïve (left) and effector (right) NCOR1-cKO Treg cells, as revealed by Ingenuity Pathway Analysis (QIAGEN Inc). The lower x-axis indicates the p-value. The upper x-axis indicates the percentage of genes dysregulated in this particular pathway. The number next to the bar indicates the number of genes in this pathway. A list of all pathways identified by Ingenuity Pathway Analysis is provided in Supplementary file 1e and f. (b) Summary showing the expression levels (fragments per kilobase of transcript per million mapped reads; FPKM) of genes controlling cholesterol biosynthesis in naïve and effector WT and NCOR1-cKO Treg cells as determined by RNA-seq. (c) Summary showing Filipin III staining (rel. gMFI) in WT and NCOR1-cKO Treg cells pre-gated on cells expressing CD4 and CD25. WT gMFI levels were set as 1 and relative gMFI of Filipin III on NCOR1-cKO Treg cells was calculated. (d) Summary showing FPKM values of Abca1 and Abcg1 in naïve and effector WT and NCOR1-cKO Treg cells as determined by RNA-seq. (b,d) Each bar shows the average of three biological replicates (three mice per replicate). (c) Each symbol indicates one mouse. (c,d) Horizontal bars indicate the mean. (b,d) *p<0.05, **p<0.01, and ***p<0.001. Unpaired two-tailed Student’s t-test.
Figure 7 with 4 supplements
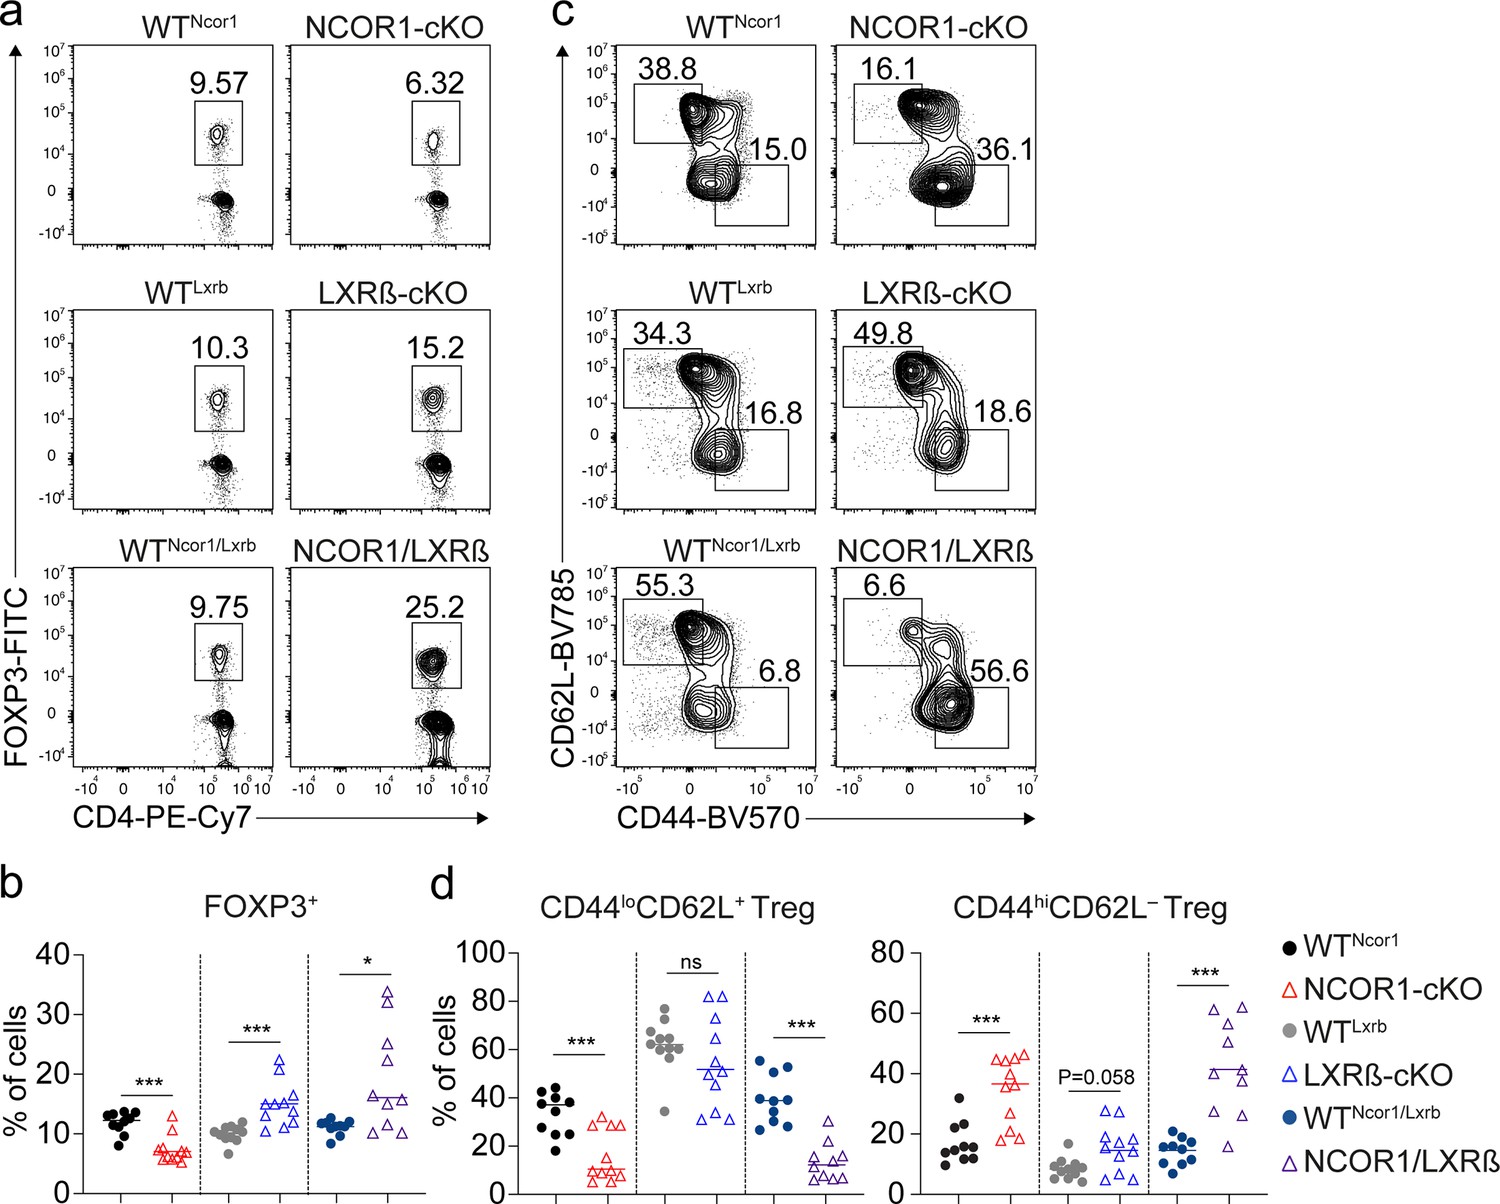
NCOR1 controls the ratio of naïve to effector Treg cells in an LXRß-independent manner.
(a) Contour plots show FOXP3 and CD4 expression in splenic TCRβ+CD4+ cells of mice of the indicated genotype. (b) Percentages of FOXP3+ CD4+ T cells of all mice analyzed as described in (a). (c) Flow cytometric analysis of splenic FOXP3+ CD4+ T cells from mice of the indicated genotype showing CD44 and CD62L expression at steady-state. (d) Percentage of CD44loCD62L+ (left) and CD44hiCD62L– (right) Treg cells of all mice analyzed as described in (c). (a,c) Numbers next to the regions indicate cell frequencies. (b,d) Each symbol indicates one mouse. Horizontal bars indicate the mean. *p<0.05, **p<0.01, and ***p<0.001. (b,d) Unpaired two-tailed Student’s t-test comparing the respective WT and knockout groups. Data are representative (a,c) or show the summary (b,d) of at least ten mice that were analyzed in at least eight independent experiments.
Figure 7—figure supplement 1
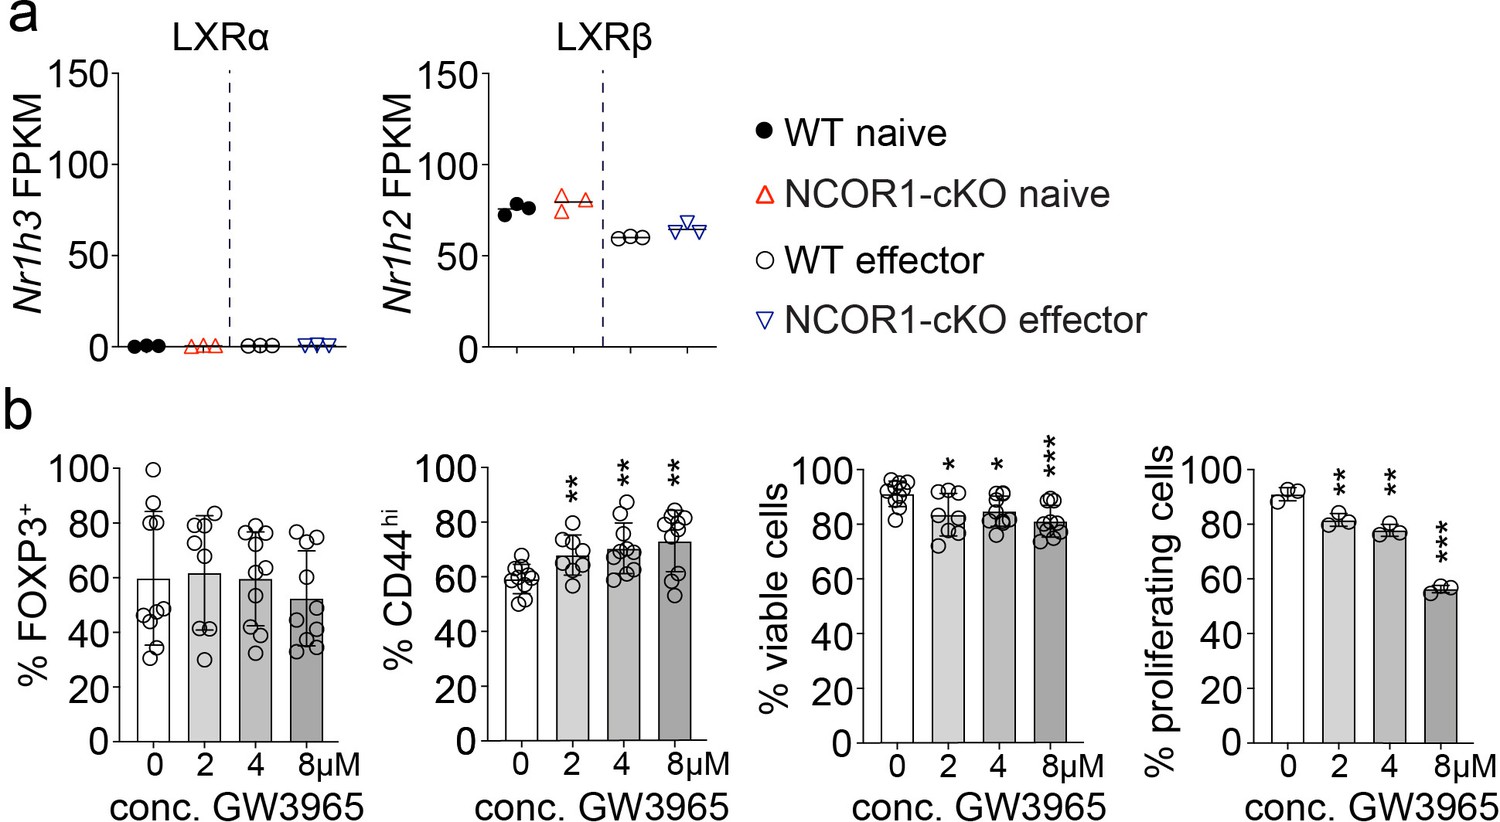
LXRβ agonist-treatment of WT iTreg cells leads to a small increase in CD44hi Treg cells.
(a) Summary showing the expression levels (values shown as fragments per kilobase of transcript per million mapped reads; FPKM) of Nr1h3 (LXRα) and Nr1h2 (LXRβ) in naïve and effector WT and NCOR1-cKO Treg cells as determined by RNA-seq. (b) Naïve WT CD4+ T cells were cultured under iTreg cell-inducing conditions in the presence of the indicated concentrations of GW3965 (or DMSO as control). The percentages of FOXP3+ cells (left), FOXP3+CD44hi cells (2nd panel) and viable cells are shown. The right diagram indicates the percentage of FOXP3+ cells that have been treated with GW3965 or DMSO (as mock control) and which underwent ≥1 cell divisions. (a) Each symbol shows a biological replicate (three mice per replicate). (b) Each symbol indicates one sample. Horizontal bars indicate the mean. *p<0.05, **p<0.01, and ***p<0.001. (a) Unpaired two-tailed Student’s t-test. (b) Unpaired two-tailed Student’s t-test comparing respective GW3965-treated samples with mock (DMSO)-treated control. Data show the summary (a,b) of three (a) or at least eight independent samples (b) that were analyzed in at least three independent experiments.
Figure 7—figure supplement 2
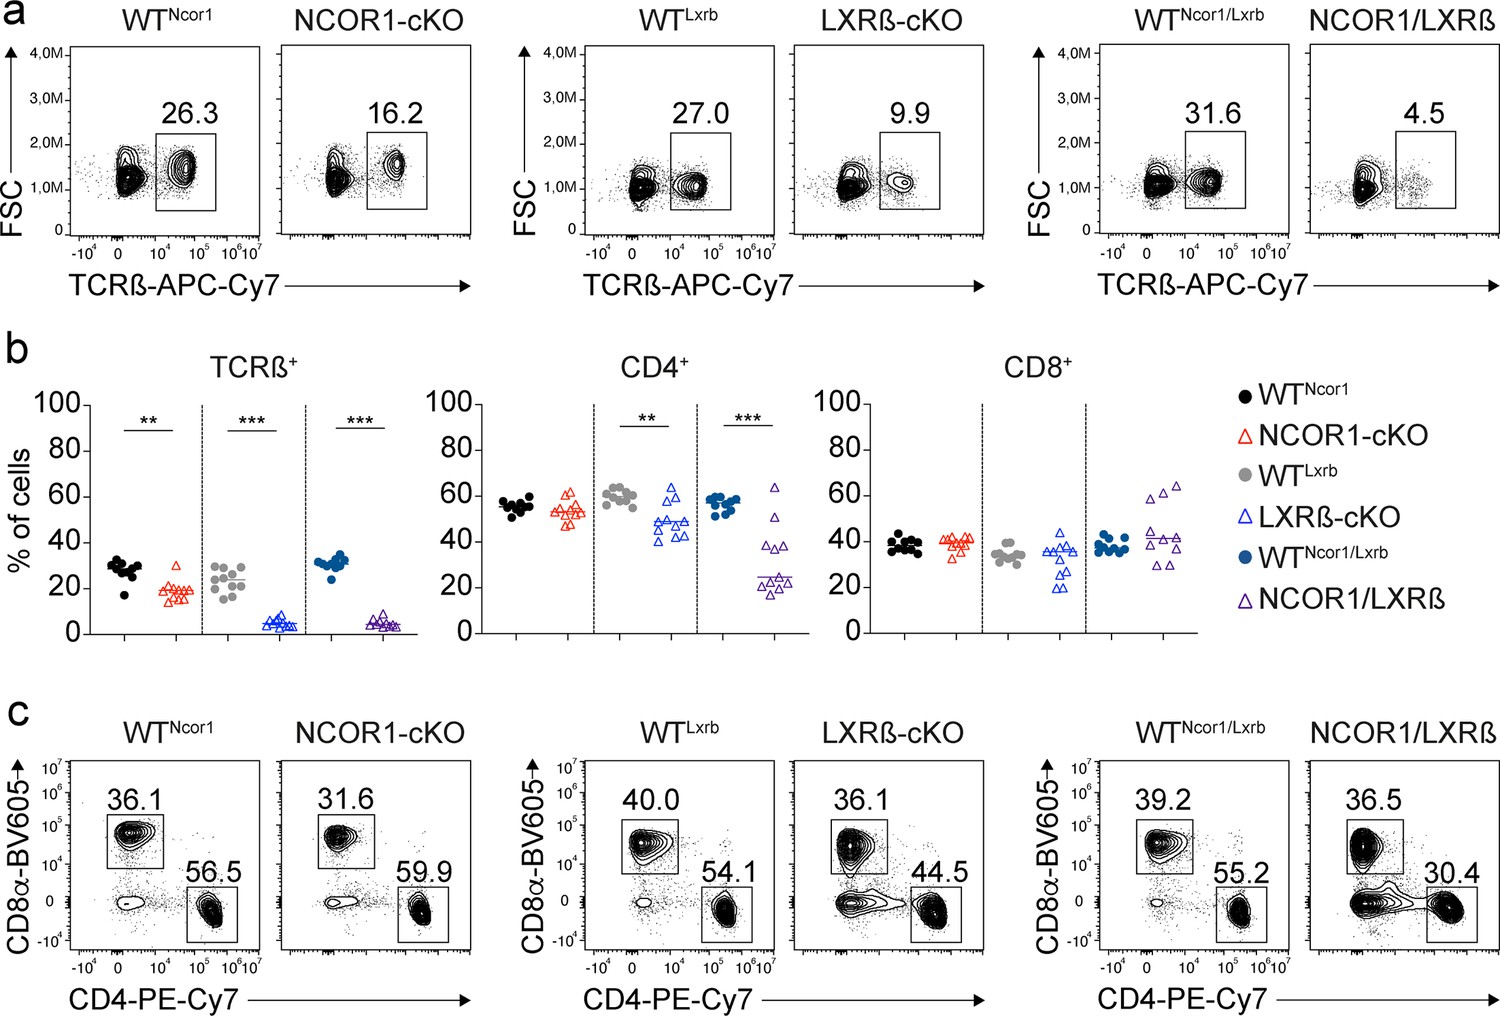
Phenotypic characterization of NCOR1/LXRß-cDKO mice.
(a) Contour plots show TCRß expression on and cell size (forward-scatter; FSC) of splenocytes from mice of the indicated genotype. (b) Diagram indicates the frequency of TCRß+ cells as well as of CD4+TCRß+ and CD8+TCRß+ T cells of all mice analyzed as described in (a) and (c). (c) Flow cytometric analysis of splenocytes isolated from mice of the indicated genotype showing CD4 and CD8 expression on TCRß+ T cells at steady-state. (a,c) Numbers next to the regions indicate the percentage of cells. (b) Each symbol indicates one mouse. Horizontal bars indicate the mean. *p<0.05, **p<0.01, and ***p<0.001. Unpaired two-tailed Student’s t-test comparing the respective WT and knockout groups. Data are representative (a,c) or show the summary (b) of at least ten mice that were analyzed in at least eight independent experiments.
Figure 7—figure supplement 3
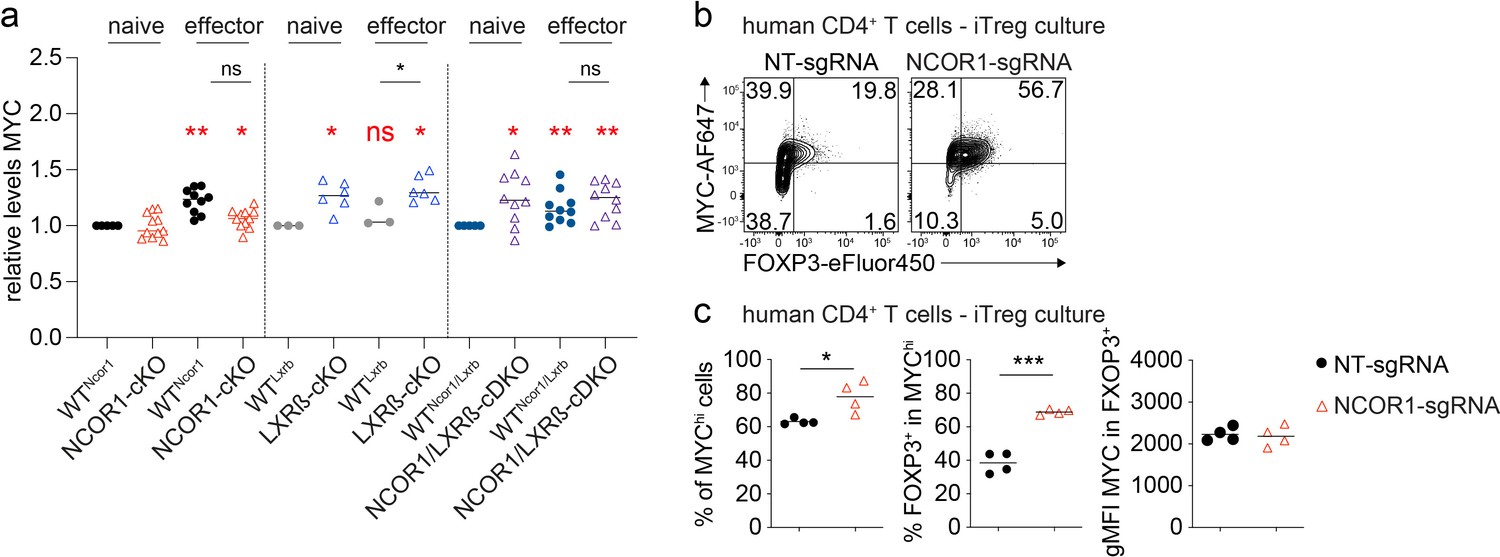
MYC protein expression levels in NCOR1-cKO, LXRβ-cKO and NCOR1-LXRβ-cDKO Treg cell subsets and in human NCOR1-knockout CD4+ T cells cultured under iTreg cell differentiation conditions.
(a) Diagram indicates MYC expression levels (geometric mean fluorescence intensity; gMFI) in naïve (CD44loCD62+) and effector (CD44hiCD62L–) Treg cells of the indicated genotype. For gMFI calculations, MYC expression levels in naïve WT levels were set as one and relative gMFI of MYC is shown. (b) Flow cytometric analysis showing MYC and FOXP3 expression in human CD4+ T cells cultured under iTreg conditions after CRISPR-Cas9-mediated knockout of NCOR1 (NCOR1-sgRNA) or in non-targeting control samples (NT-sgRNA). The same human CD4+ T cell cultures as shown in Figure 2 were analyzed. (c) Diagrams show the summary of the experiments described in (b). The percentage of MYC-high (MYChi) cells (left), the frequency of FOXP3+ cells with the MYChi population (middle) and gMFI of MYC within FOXP3+ cells is shown (right). (b) Cells were pre-gated on the total viable cell population. (a,c) Each symbol indicates one mouse or one human CD4+ T cell sample. (a,c) Horizontal bars indicate the mean. *p<0.05, **p<0.01, and ***p<0.001. (a) Red fonts: t-test and Wilcoxon-ranked column statistics indicating significant changes in the expression levels of MYC compared to the levels in the corresponding WT Treg cells; black fonts: unpaired two-tailed Student’s t-tests comparing MYC gMFI levels between the respective effector (CD44hiCD62L–) WT and knockout Treg cells. (c) Unpaired two-tailed Student’s t-test. Data are representative (b) or show a summary of four individual healthy donors (b,c) or at least ten mice (a) that were analyzed in one (c) or in at least eight (a) independent experiments.
Figure 7—figure supplement 4

NCOR1 positively regulates FOXP3+ Treg cell differentiation and controls naïve and effector Treg cell subset integrity.
NCOR1 promotes FOXP3+ Treg differentiation, since Treg cell frequencies within the CD4+ T cell population are decreased in the absence of NCOR1. In contrast, LXRß restrains Treg cell differentiation, since deletion of LXRß results in increased Treg cell frequencies among CD4+ T cells. Deletion of LXRß on top of NCOR1 deletion reverts the NCOR1-cKO Treg differentiation phenotype, indicating that NCOR1 controls Treg differentiation in an LXRß-dependent manner. NCOR1 might directly suppress LXRβ or counteracts LXRβ-controlled pathways, which are enhanced in the absence of NCOR1. Furthermore, the deletion of NCOR1 alters the ratio of naïve to effector Treg cells and leads to a blurring of the transcriptional separation of naïve and effector Treg cell lineages. In addition, NCOR1 might control Treg cell function. The deletion of LXRβ in the T cell lineage did not recapitulate the increase in CD44hiCD62L– effector Treg cells in the spleen as observed in NCOR1-cKO mice. The combined deletion of NCOR1 and LXRβ resulted in a strong increase in LXRβ-NCOR1 effector Treg cells and a corresponding severe reduction in naïve Treg cells, similar to the phenotype observed in NCOR1-cKO mice. This strongly suggests that NCOR1 controls the ratio of naïve to effector Treg cells in a LXRß-independent manner. See text for more details.
Author response image 1
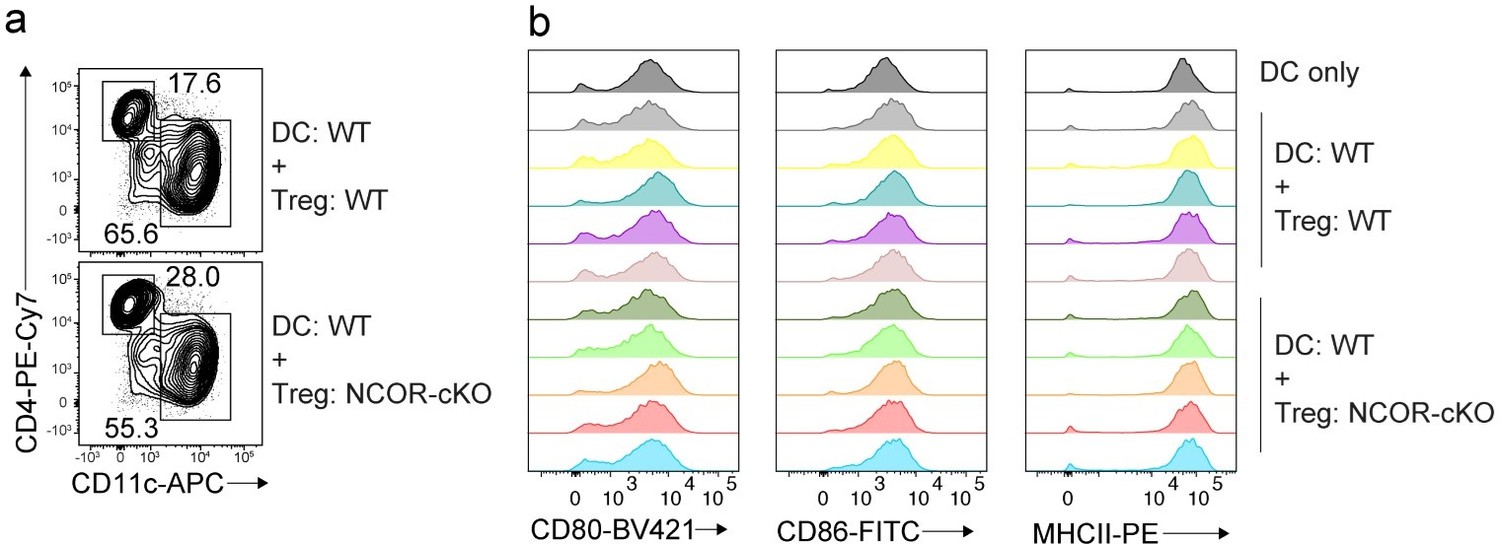
(a) Flow cytometry analysis of CD4 and CD11c expression in co-cultures of splenic dendritic cells (DCs) with either WT of NCOR1-cKO Treg cells after 24 hours.
DC and Treg cells were cocultured in the presence of anti-CD3. (b) Flow cytometry analysis of CD80, CD86 and MHCII expression in DCs from co-cultures as described in (a). The 1st row displays DC only cultures, while rows 2-6 and rows 7-11 show DC co-culture with WT and NCOR1-cko Treg cells, respectively. Each row represents an independent biological sample of Treg cells.
Author response image 2

Summary showing the expression levels (values showing as fragments per kilobase of transcript per million mapped reads; FPKM) of the indicated genes in naive and effector WT and NCOR1-cKO Treg cells as determined by RNA-seq.
Each bar represents 3 mice per group. Mean ±}SD is shown. *P <0.05, **P < 0.01, and ***P < 0.001 (unpaired 2-tailed Student’s t test).
Author response image 3
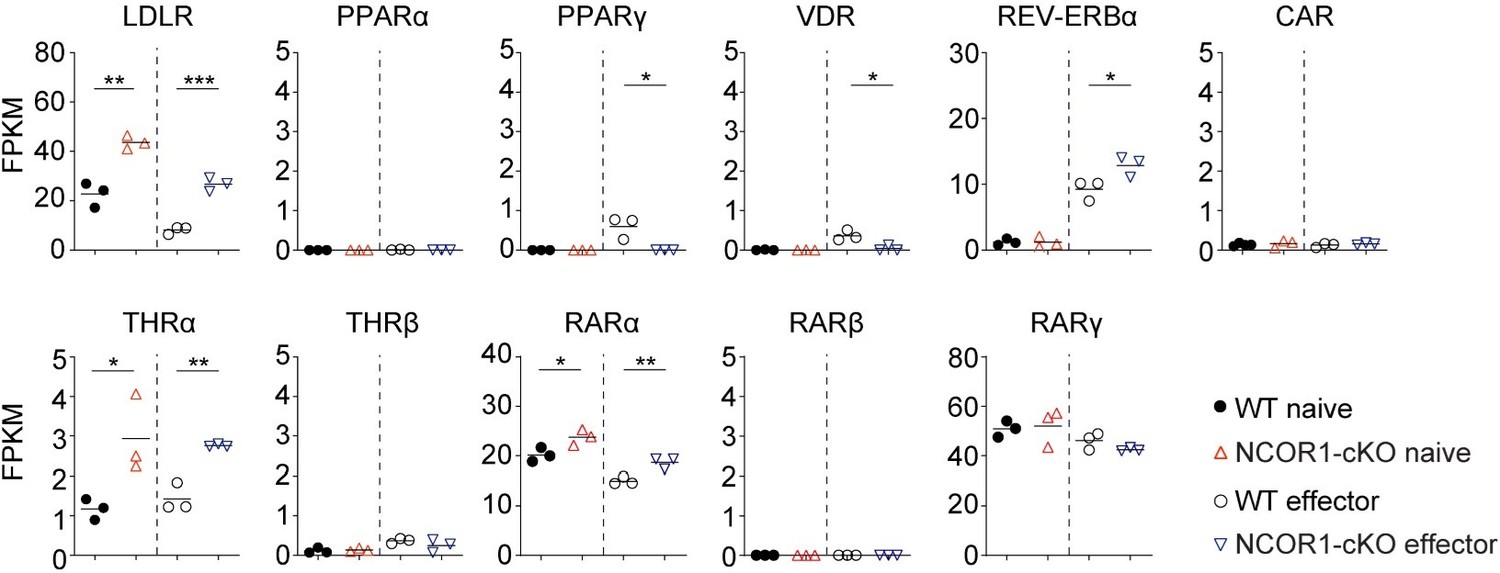
Summary showing the expression levels (values showing as fragments per kilobase of transcript per million mapped reads; FPKM) of the indicated genes in naïve and effector WT and NCOR1cKO Treg cells as determined by RNA-seq.
Each symbol represents one sample (2 mice per sample, 3 independent sample preparations steps).
Additional files
-
Supplementary file 1
Bioinformatic analysis tables of WT and NCOR1-cKO Treg cells.
(a) List of differentially expressed genes (DEG) between NCOR1-cKO and WT naive Treg cells. FDR <0.05. (b) DEG between NCOR1-cKO and WT effector Treg cells. FDR <0.05. (c). Gene Set Enrichment Analysis (GSEA) hallmark gene sets enriched between NCOR1-cKO and WT naïve Treg cells. (d) GSEA hallmark gene sets enriched between NCOR1-cKO and WT effector Treg cells. (e) Top 50 Canonical Pathways (identified by Ingenuity Pathways Analysis) between NCOR1-cKO and WT naive Treg cells. (f) Top 50 Canonical Pathways (identified by Ingenuity Pathways Analysis) between NCOR1-cKO and WT effector Treg cells. (g) Naive and effector Treg cell gene sets. The lists show the 100 most DEG between naive and effector WT Treg cells.
- https://cdn.elifesciences.org/articles/78738/elife-78738-supp1-v1.xlsx
-
MDAR checklist
- https://cdn.elifesciences.org/articles/78738/elife-78738-mdarchecklist1-v1.docx
Download links
A two-part list of links to download the article, or parts of the article, in various formats.
Downloads (link to download the article as PDF)
Open citations (links to open the citations from this article in various online reference manager services)
Cite this article (links to download the citations from this article in formats compatible with various reference manager tools)
Nuclear receptor corepressor 1 controls regulatory T cell subset differentiation and effector function
eLife 13:e78738.
https://doi.org/10.7554/eLife.78738


