High-resolution quantitative and functional MRI indicate lower myelination of thin and thick stripes in human secondary visual cortex
- Department of Neurophysics, Max Planck Institute for Human Cognitive and Brain Sciences, Germany
- International Max Planck Research School on Neuroscience of Communication: Function, Structure, and Plasticity, Germany
- Athinoula A. Martinos Center for Biomedical Imaging, Massachusetts General Hospital, United States
- Department of Radiology, Harvard Medical School, United States
- Harvard-MIT Division of Health Sciences and Technology, Massachusetts Institute of Technology, United States
- Department of Psychology, College of Sciences, San Diego State University, United States
- Poeppel Lab, Ernst Strüngmann Institute (ESI) for Neuroscience in Cooperation with Max Planck Society, Germany
- Felix Bloch Institute for Solid State Physics, Faculty of Physics and Earth Sciences, Leipzig University, Germany
Figures
Figure 1
General overview of acquired magnetic resonance (MR) data and their use in the analysis.
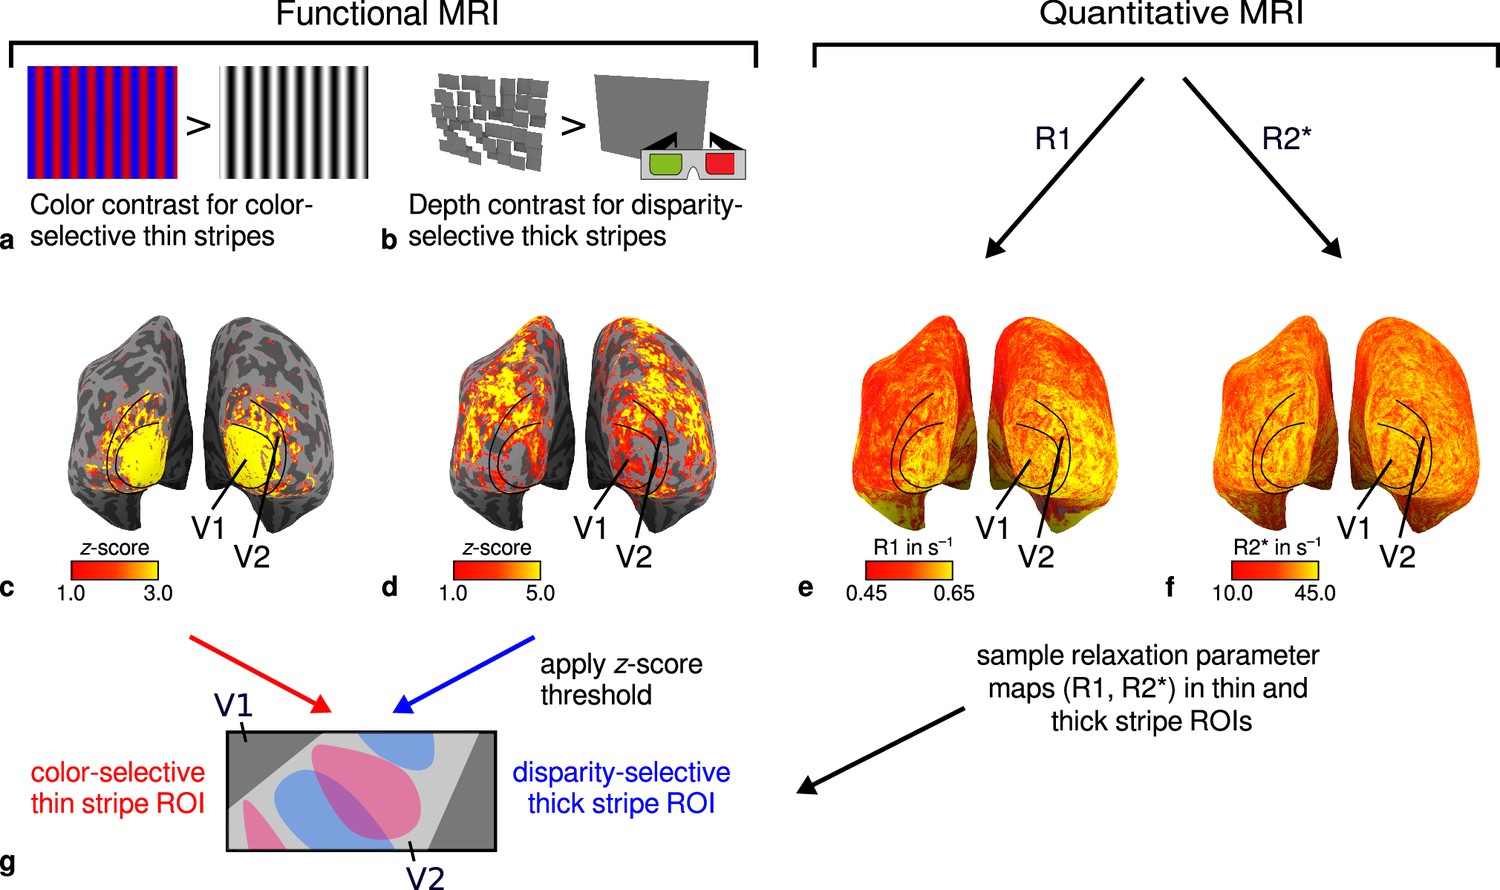
(a) Example of chromatic and achromatic stimuli used to map color-selective thin stripes. (b) Schematic illustration of stimuli when viewed through anaglyph spectacles used for mapping disparity-selective thick stripes. These stimuli consisted of a disparity-defined checkerboard and a plane intersecting at zero depth, respectively. Exemplary activation maps from thin stripe (contrast: color > luminance) and thick stripe (contrast: depth > no depth) mapping sessions are shown for a representative participant (subject 3) in (c) and (d), respectively. Quantitative R1 and R2* maps from the same participant are shown in (e–f). (g) Activation maps from (c) and (d) were used to define regions of interest (ROIs) for thin- and thick-type stripes in V2 by applying a -score threshold. R1 and R2* values were sampled in these ROIs for further analysis. Borders in (c–f) were manually defined on the basis of a separate retinotopy measurement.
Figure 2 with 2 supplements
Activation maps for color-selective thin and disparity-selective thick stripes.
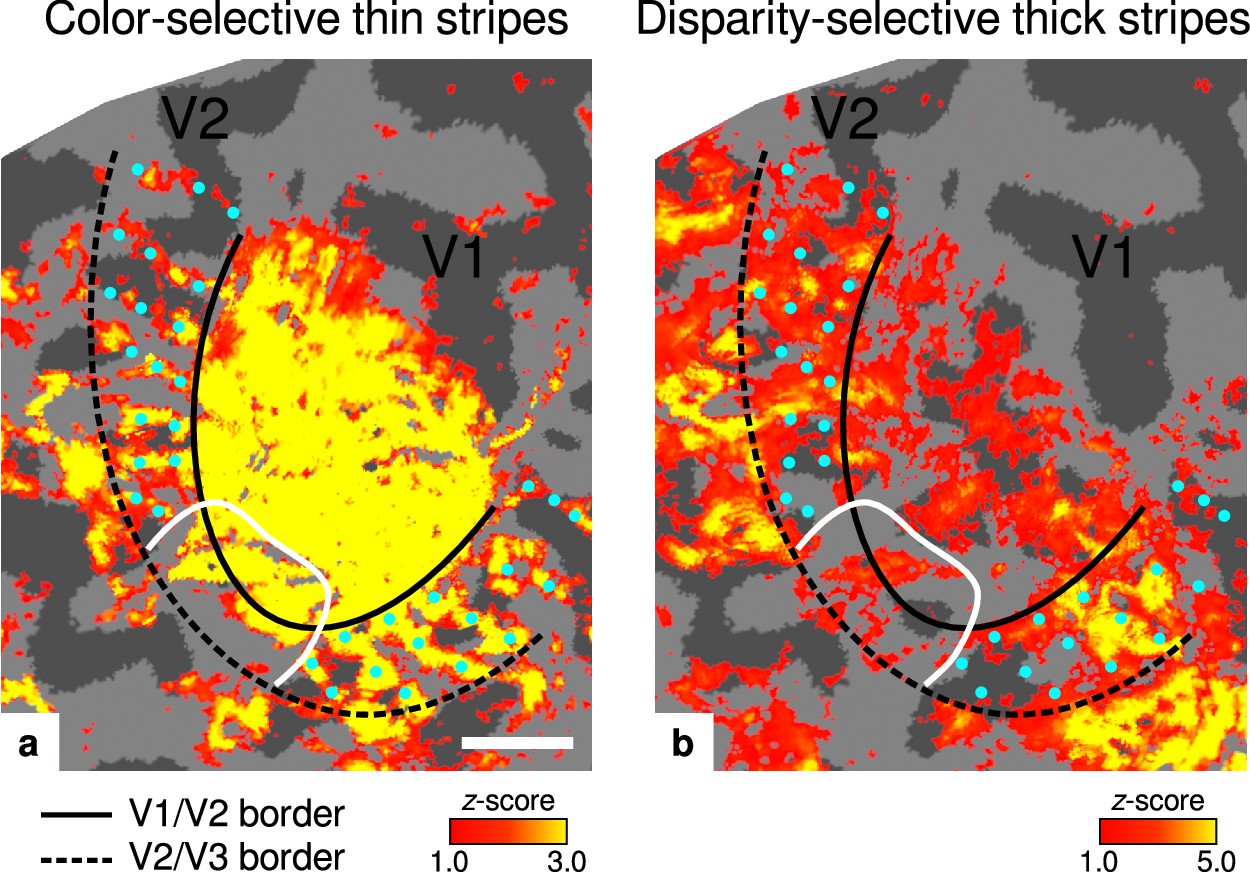
Thin stripes (contrast: color > luminance) and thick stripes (contrast: depth > no depth) are shown as thresholded activation maps in (a) and (b), respectively. Both maps were averaged across sessions, sampled at mid-cortical depth, and are illustrated on the flattened surface of the right hemisphere for one representative participant (subject 3). Surfaces were flattened using FreeSurfer (6.0.0, http://surfer.nmr.mgh.harvard.edu/) after cutting out a region on the surface mesh which included all stimulated portions of V1 and V2. Data from all participants can be found in Appendix 1. In V2, patchy stripes can be identified, which run through V2 oriented perpendicular to the V1/V2 border. Borders were manually defined on the basis of a separate retinotopy measurement, which is illustrated in Figure 2—figure supplement 1 (see Appendix 1 for retinotopy data from all participants). The white border illustrates a region around the foveal representation with missing activation. This region was excluded in the supporting analysis shown in Figure 5—figure supplement 2. For the main analysis, all data points in V2 were used. Manually drawn cyan dots mark activated regions in (a) to illustrate the alternating activation pattern between (a) and (b). Cortical curvature is shown in gray (sulcal cortex is dark gray and gyral cortex light gray). Another example can be found in Figure 2—figure supplement 2. Scale bar: 1 cm.
Figure 2—figure supplement 1
Eccentricity and polar angle maps.
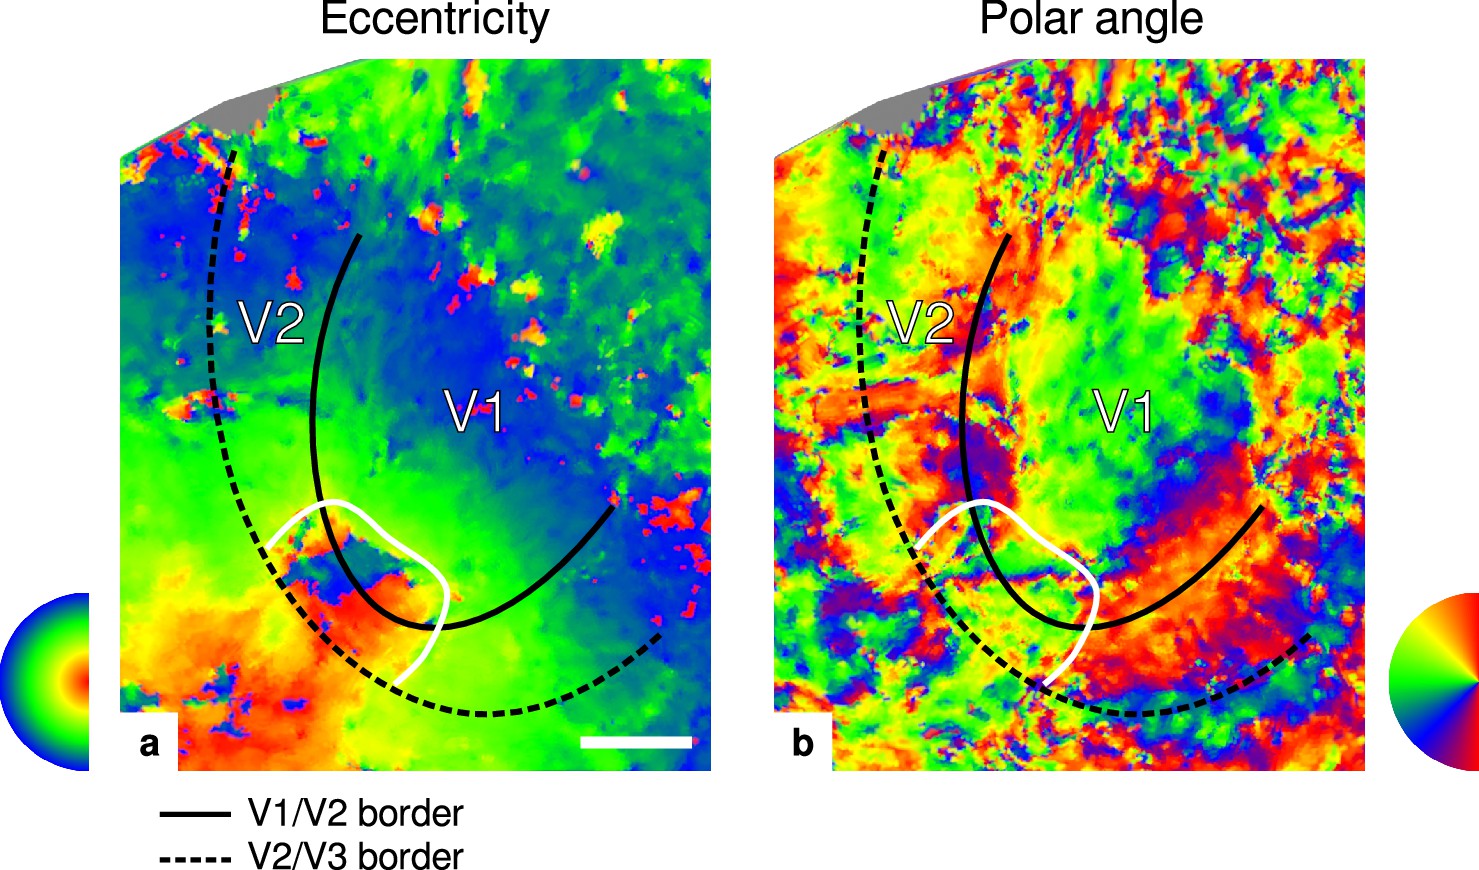
Maps in (a) and (b) show eccentricity and polar angle phase responses, respectively, for the participant (subject 3) shown in Figure 2. The white border encircles a region around the foveal representation in V1 and V2 and was defined by manually drawing a line around the region of eccentricity values (). Borders between V1/V2 and V2/V3 were based on the polar angle data and defined by the location of vertical and horizontal meridians around the calcarine fissure, respectively. Other details as in Figure 2. Maps from all participants can be found in Appendix 1. In comparison to all other participants, retinotopy data for this participant was very noisy. However, visual borders could still clearly be identified. Note that, in contrast to other functional measurements, we did not control for subject attention during retinotopy measurements. Scale bar: 1 cm.
Figure 2—figure supplement 2
Exemplary activation maps from another participant.
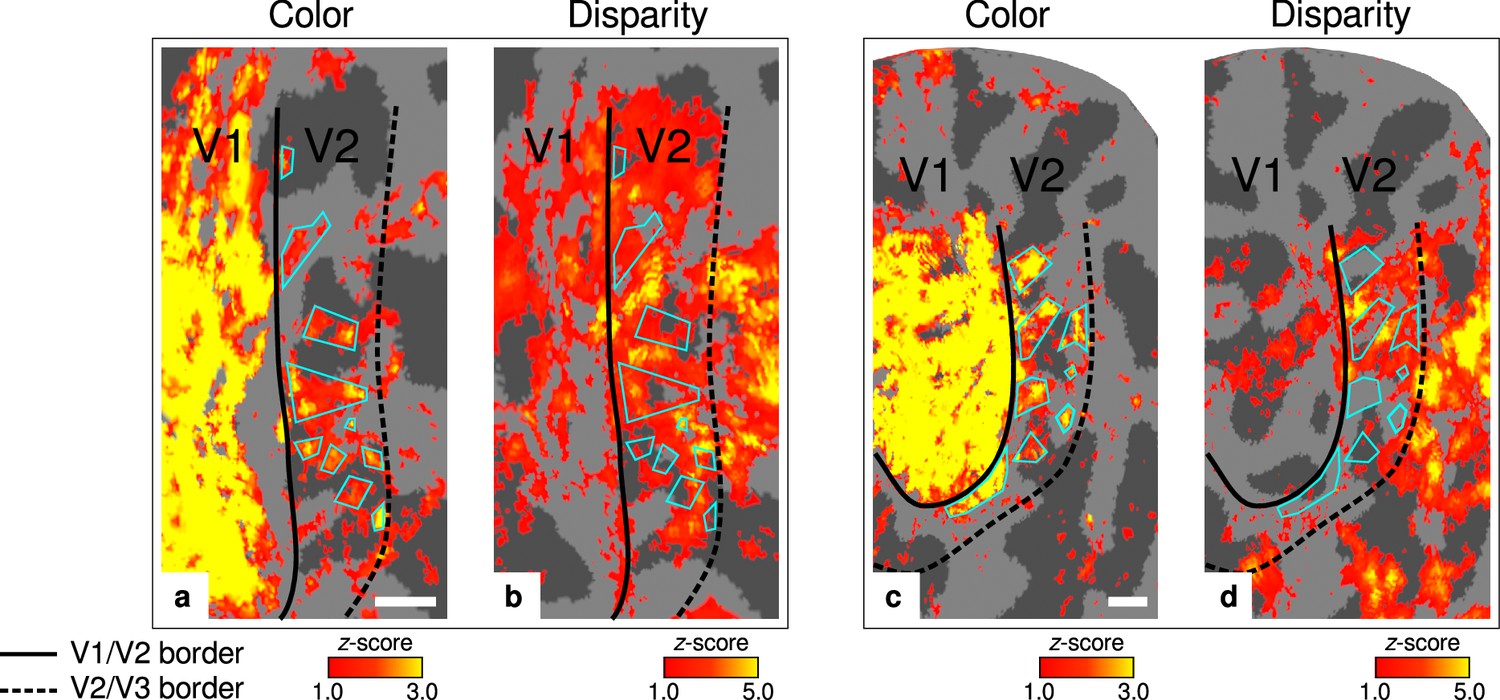
Activation maps are shown for another representative participant (subject 4) to further illustrate the alternating nature of color- and disparity-selective stripes . (a–b) show color- and disparity-selective stripes for the ventral aspect of V2 on the left hemisphere, respectively. (c–d) show corresponding maps for the dorsal aspect of V2 on the right hemisphere. Cyan outlines emphasize activation clusters in (a) and (c) to illustrate the alternating pattern between color-selective thin and disparity-selective thick stripes in (b) and (d), respectively. Other details as in Figure 2. Scale bar: 5 mm.
Figure 3 with 2 supplements
Repeatability of functional magnetic resonance imaging (fMRI) activation maps across scanning sessions.
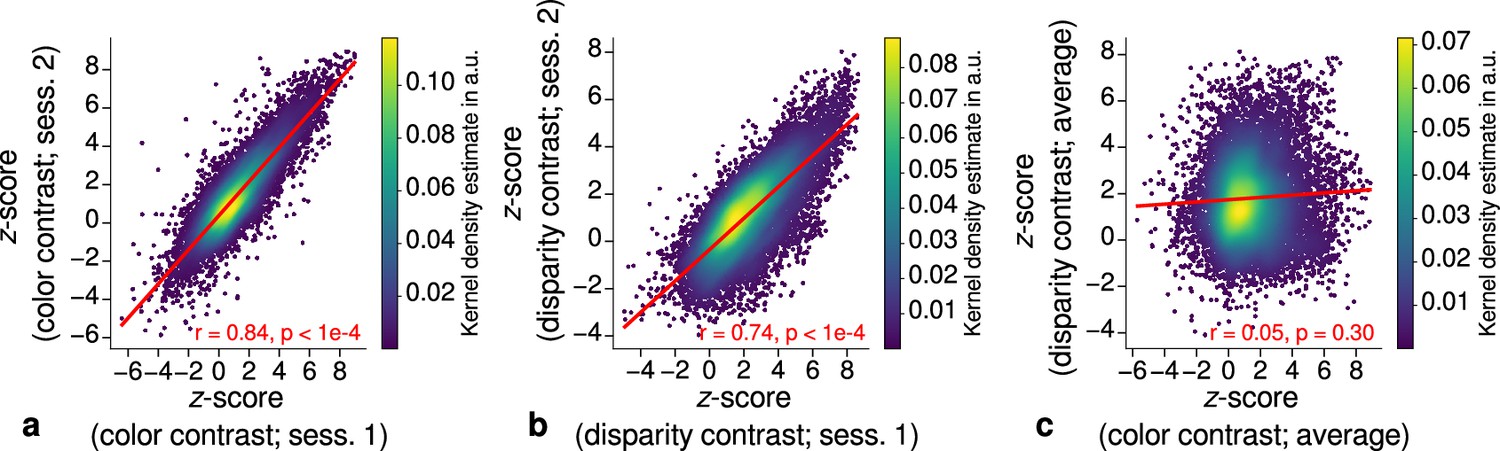
Scatter plots with kernel density estimation illustrate the consistency of activation maps across scanning sessions for one representative participant (subject 3). Sessions were carried out on different days and activation maps were sampled at mid-cortical depth. (a) shows correspondences of -scores in the secondary visual cortex (V2) between single color-selective thin stripe mapping sessions (contrast: color > luminance). (b) shows the same for single disparity-selective thick stripe mapping sessions (contrast: depth > no depth). In (c), correspondences of average -scores (across sessions) between thin and thick stripe sessions are shown. Regression lines are indicated as red lines. Spearman’s rank correlation coefficients and -values determined by permutation analysis (see Materials and methods) are annotated inside the plots and demonstrate high repeatability of color-selective thin and disparity-selective thick stripe scanning sessions. Note that the comparison between thin and thick stripe sessions shows no statistically significant correlation as expected from the interdigitated nature of both stripe types. Plots for all participants can be found in Figure 3—figure supplement 1 and Figure 3—figure supplement 2.
Figure 3—figure supplement 1
Correlation plots for single participants (subjects 1–2).
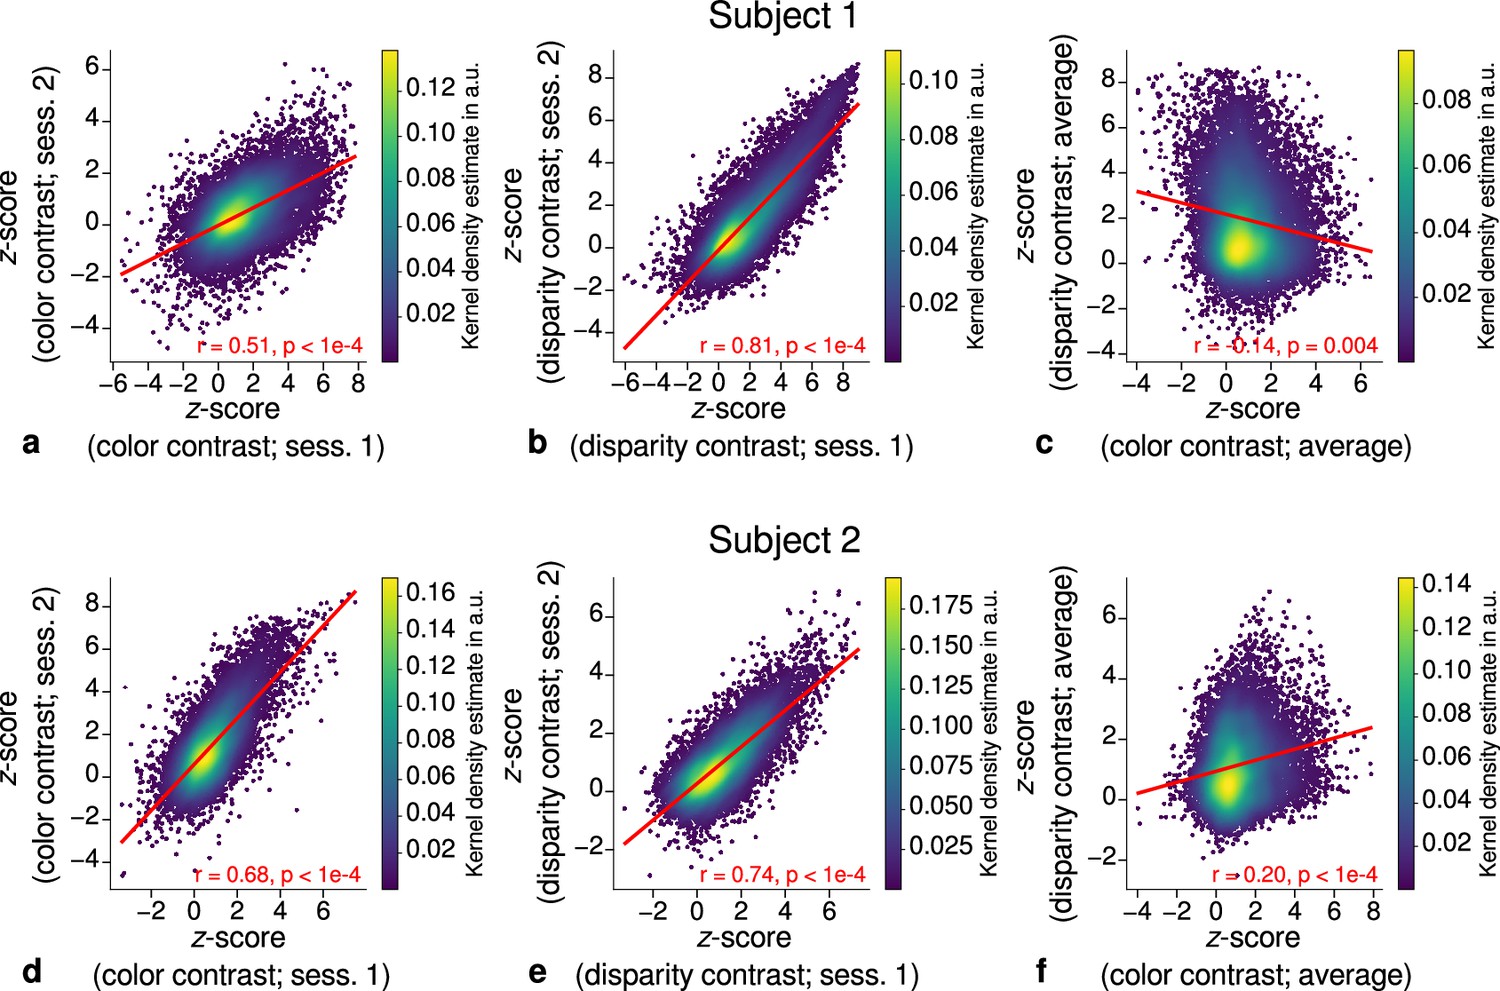
Scatter plots with kernel density estimation illustrate the consistency of activation maps across scanning sessions for single participants (subjects 1–2). The left column (a, d) shows correspondences of -scores in the secondary visual cortex (V2) between single color-selective thin stripe mapping sessions (contrast: color > luminance). The middle column (b, e) shows the same for single disparity-selective thick stripe mapping sessions (contrast: depth > no depth). In (c, f), correspondences of average -scores (across sessions) between thin and thick stripe sessions are shown. Other details as in Figure 3.
Figure 3—figure supplement 2
Correlation plots for single participants (subjects 3–4).
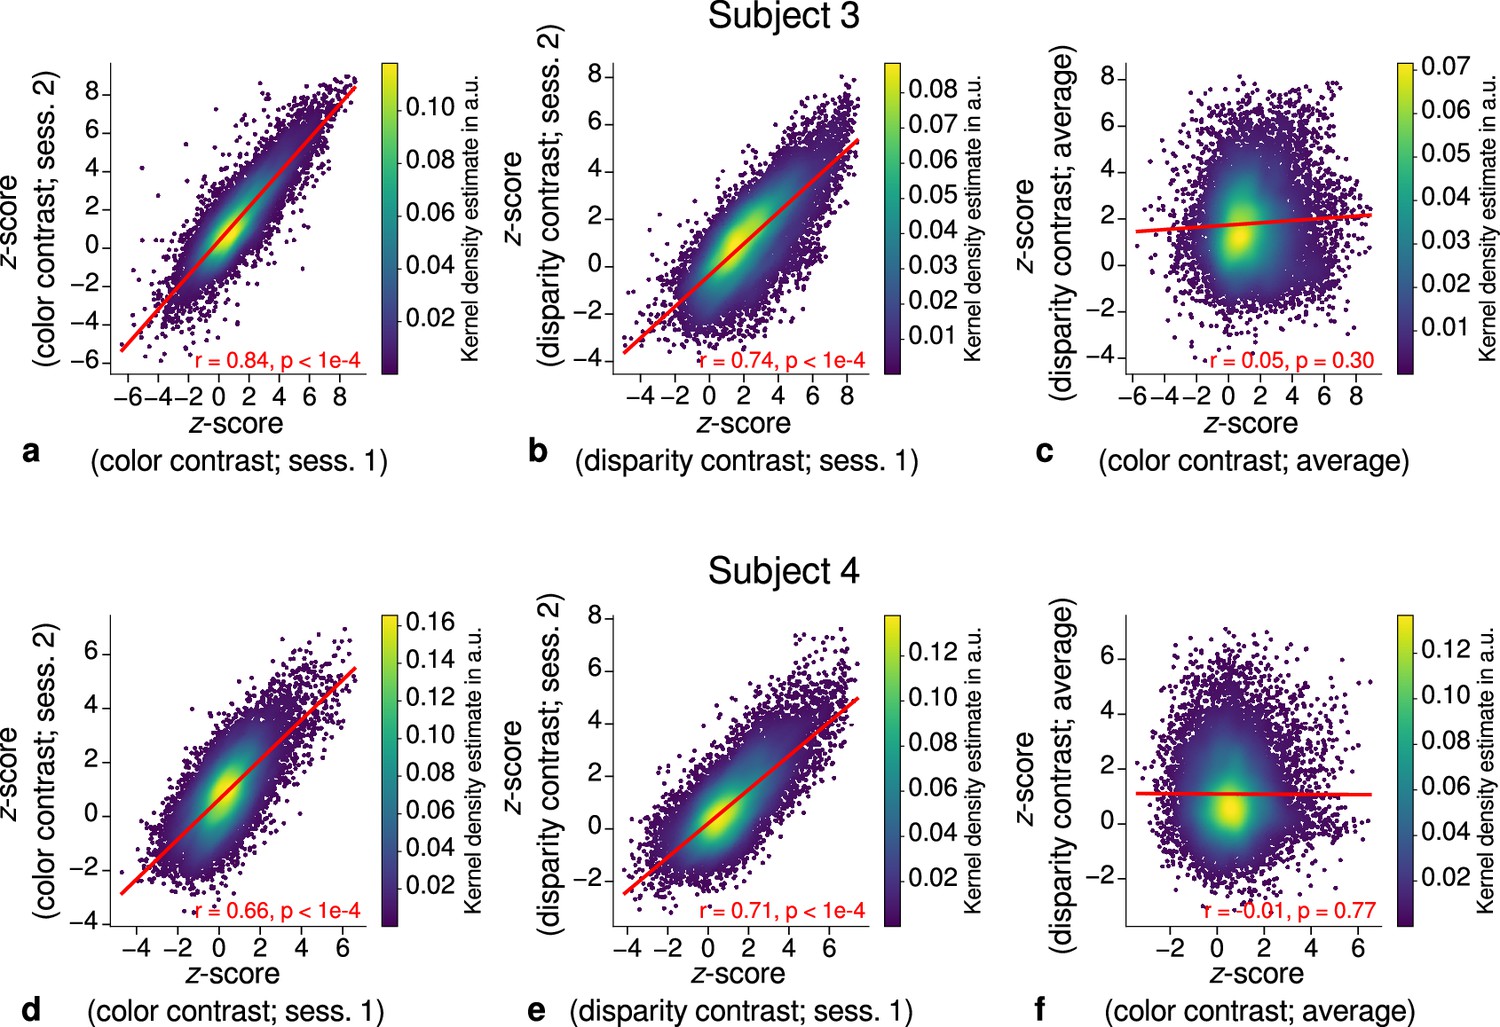
Scatter plots with kernel density estimation illustrate the consistency of activation maps across scanning sessions for single participants (subjects 3–4). The left column (a, d) shows correspondences of -scores in the secondary visual cortex (V2) between single color-selective thin stripe mapping sessions (contrast: color > luminance). The middle column (b, e) shows the same for single disparity-selective thick stripe mapping sessions (contrast: depth > no depth). In (c, f), correspondences of average -scores (across sessions) between thin and thick stripe sessions are shown. Other details as in Figure 3.
Figure 4 with 2 supplements
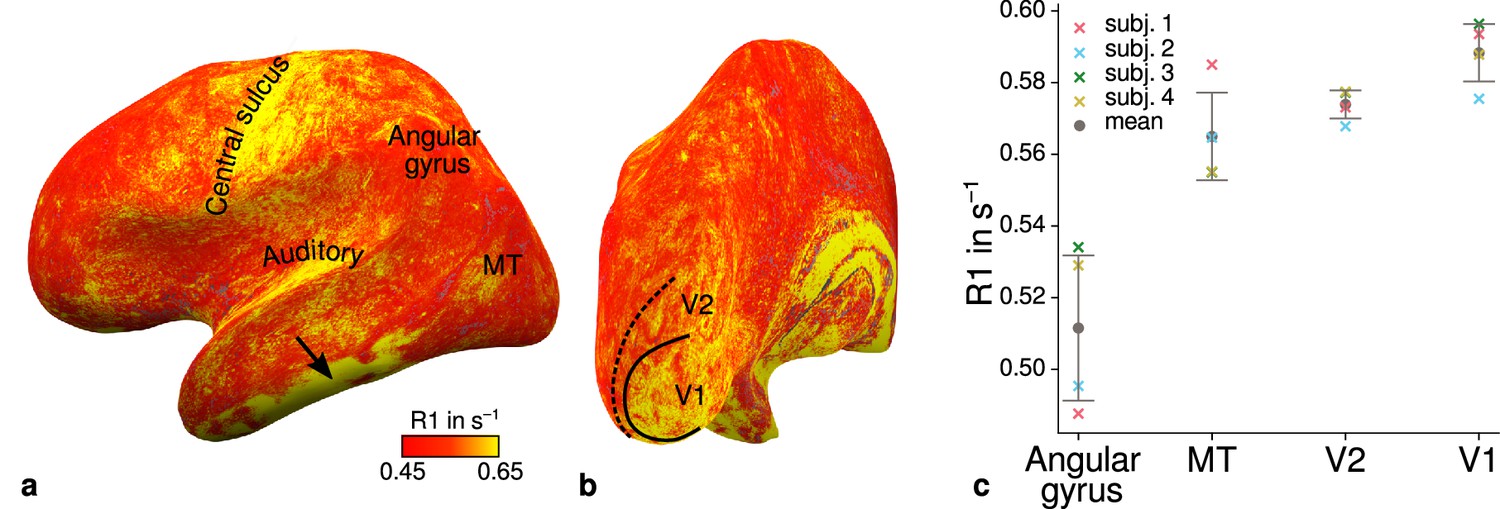
Illustration of quantitative R1 across cortical areas.
Cortical R1 values are shown at mid-cortical depth of the left hemisphere on an inflated surface from a representative participant (subject 3) in lateral (a) and posterior (b) view. Higher R1 values can be qualitatively identified in primary motor and sensory areas, which reflects known cortical myeloarchitecture (Flechsig, 1920; Glasser and Van Essen, 2011). The arrow in (a) points to an artifact outside of V2 caused by magnetic field inhomogeneities. Data from all participants can be found in Appendix 1. (c) Mean R1 values are shown for different cortical regions (angular gyrus, MT, V2, V1) defined by corresponding FreeSurfer labels (Fischl et al., 2008; Hinds et al., 2008; Destrieux et al., 2010) of each participant (similar to Fig. 1(b) in Sereno et al., 2013). All participants show increased R1 values in V1. Corresponding source data is given in Figure 4—source data 1. A corresponding illustration for quantitative R2* can be found in Figure 4—figure supplement 1. Figure 4—figure supplement 2 shows mean R1 (based on a separate whole-brain MP2RAGE acquisition) and PD values across cortical areas. Higher R1 values in V1 as shown in (c) could be confirmed with the independent R1 estimate from the MP2RAGE acquisition. Mean across participants is shown in gray. Vertical error bars indicate 1 standard deviation across participants.
-
Figure 4—source data 1
Source data for mean quantitative magnetic resonance imaging (qMRI) values (R1, R2*, PD) across cortical areas (angular gyrus, MT, V2, V1).
- https://cdn.elifesciences.org/articles/78756/elife-78756-fig4-data1-v2.xlsx
Figure 4—figure supplement 1
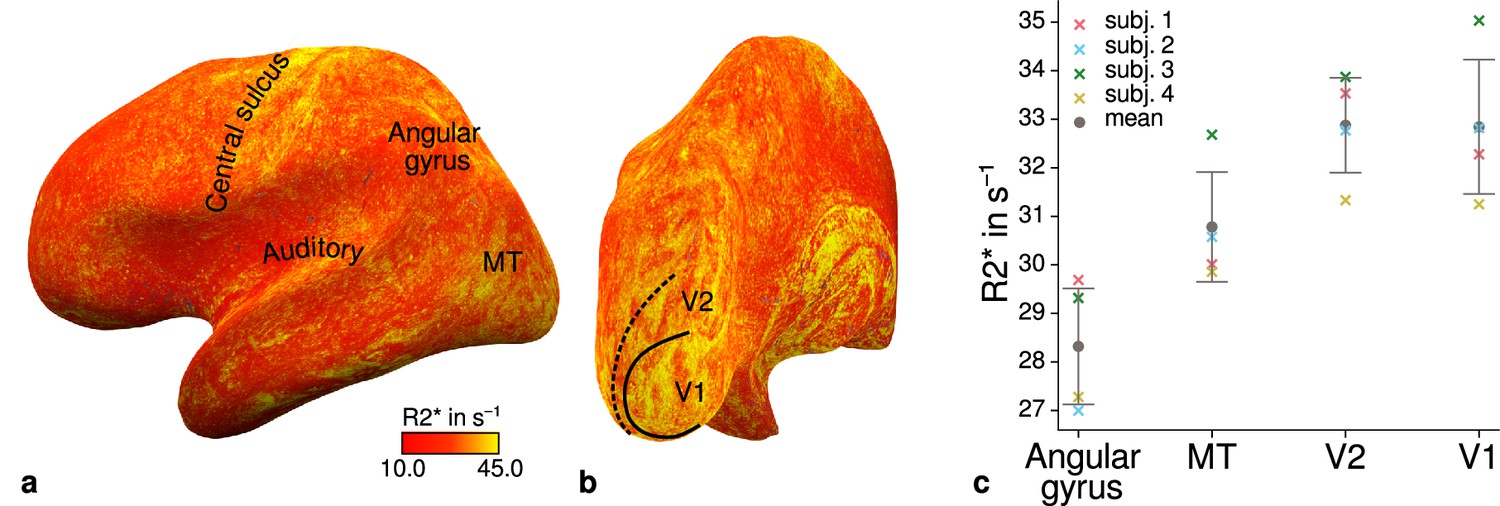
Illustration of quantitative R2* across cortical areas.
Cortical R2* values are shown at mid-cortical depth of the left hemisphere on an inflated surface from a representative participant (subject 3) in lateral (a) and posterior (b) view. Higher values in primary motor and sensory areas are less pronounced than for R1 shown in Figure 4. Data from all participants can be found in Appendix 1. (c) Mean R2* values are shown for different cortical regions (angular gyrus, MT, V2, V1). Overall, higher R2* in early visual cortex can be qualitatively seen similar to Figure 4c. Corresponding source data is given in Figure 4—source data 1. Other details as in Figure 4c.
Figure 4—figure supplement 2
Mean quantitative R1 (MP2RAGE) and PD values across cortical areas.
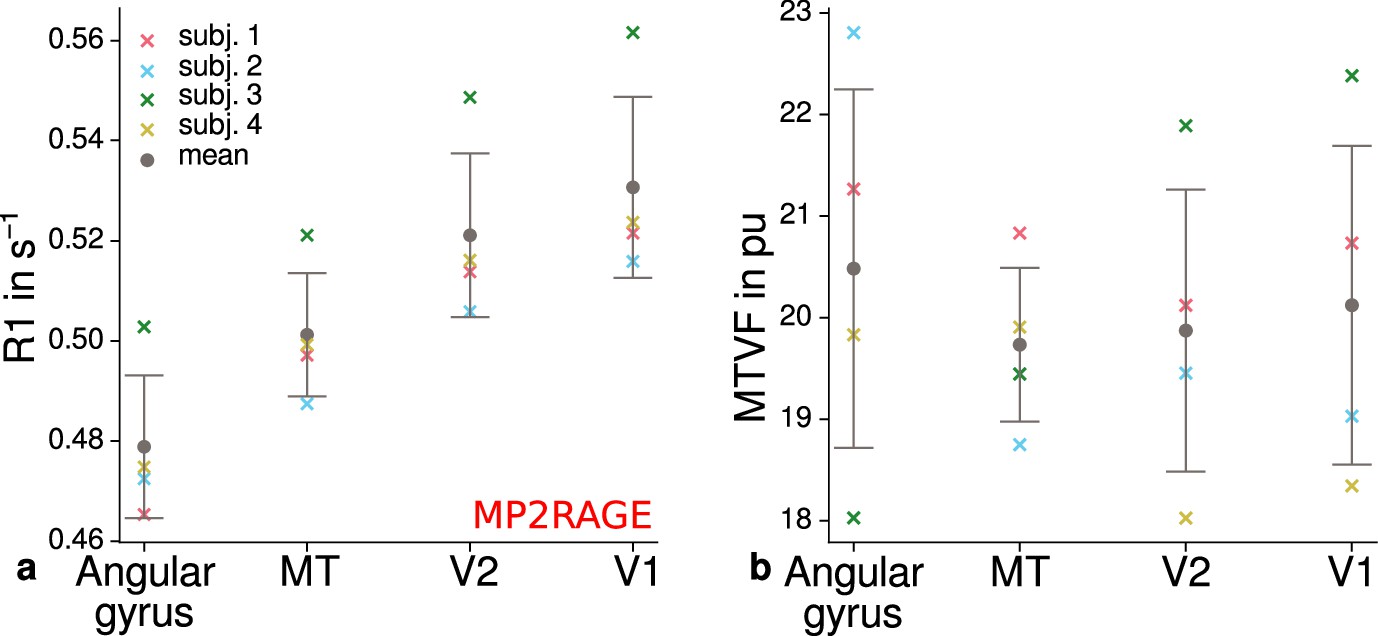
Mean R1 (MP2RAGE) (a) and MTVF = 100% − PD (macromolecular tissue volume fraction [Mezer et al., 2013]) (b) values are shown for different cortical regions (angular gyrus, MT, V2, V1). (a) shows higher R1 values in early visual cortex and especially V1 and therefore qualitatively reproduces the results shown in Figure 4c. No consistent trend across participants was found for MTVF as shown in (b), which was the reason to exclude PD from further analyses. Corresponding source data is given in Figure 4—source data 1. Other details as in Figure 4c.
Figure 5 with 3 supplements
Comparison of quantitative R1 and R2* values between V2 stripe types.
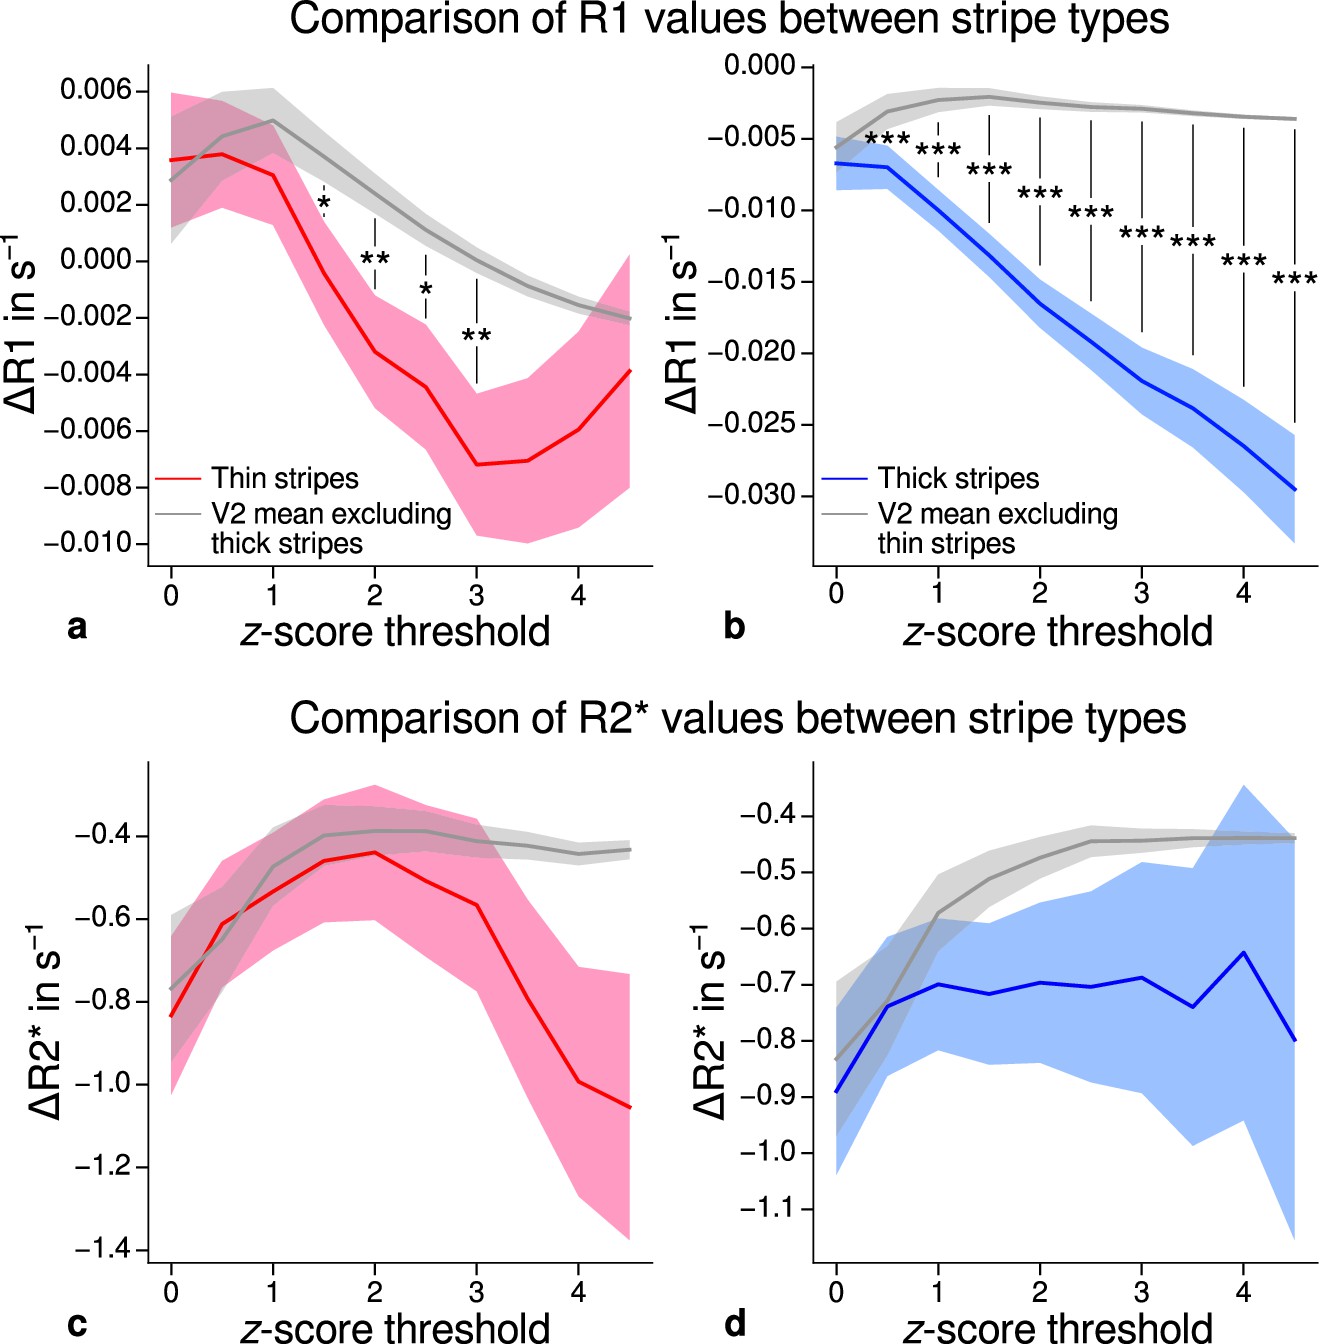
Cortical R1 (a–b) and R2* (c–d) values in thin stripes (red), thick stripes (blue), and whole V2 excluding the other stripe type (gray; and therefore containing contributions from pale stripes) are shown for various -score threshold levels, which were used to define thin and thick stripe regions of interest (ROIs). Quantitative values are illustrated as deviation from the mean within V2 after removing variance from local curvature. Values were pooled across participants and hemispheres. Differences between data in thin/thick stripes and whole V2 without thick/thin stripes were tested for statistical significance at . Statistical significance was assessed by permutation testing (see Materials and methods). R1 in both thin and thick stripes is lower than surrounding gray matter, which points toward higher myelination of pale stripes assuming a strict tripartite stripe division in human V2. No effects were found for R2*. A supporting analysis confirmed these results when excluding the region around the foveal representation from the analysis. This addresses a potential bias due to missing activation around the foveal representation in functional activation maps, which were used to define stripe ROIs. This is shown in Figure 5—figure supplement 1. The results for R1 values were further confirmed using an independent estimate of cortical R1 based on separately acquired whole-brain MP2RAGE scans, which is shown in Figure 5—figure supplement 2 and Figure 5—figure supplement 3. Corresponding source data is given in Figure 5—source data 1. Statistically significant differences are marked by asterisks, *: , **: , ***: . Shaded areas indicate 1 standard deviation of the generated null distribution used for permutation testing.
-
Figure 5—source data 1
Source data for comparisons of R1 and R2* between V2 stripe types.
- https://cdn.elifesciences.org/articles/78756/elife-78756-fig5-data1-v2.xlsx
Figure 5—figure supplement 1
Comparison of quantitative R1 and R2* values between V2 stripe types excluding foveal parts.
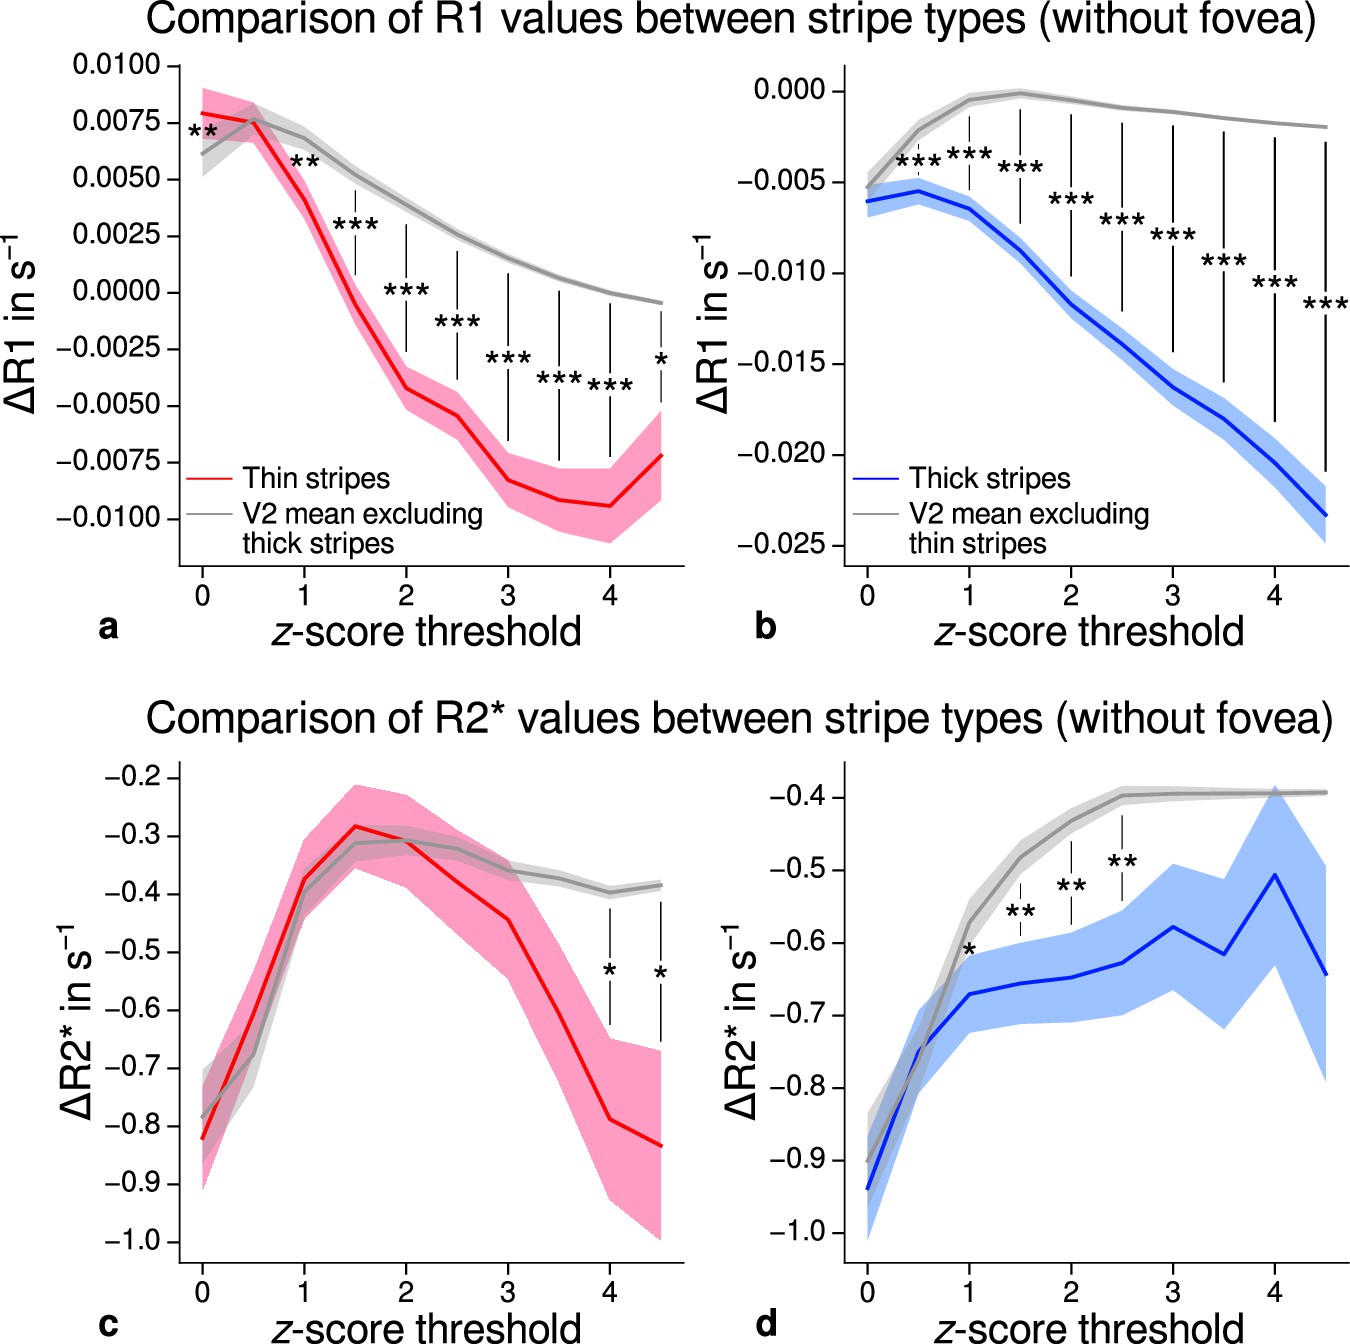
Cortical R1 (a–b) and R2* (c–d) values in thin stripes (red), thick stripes (blue), and V2 excluding the other stripe type plus the region around the foveal representation (gray; and therefore containing contributions from pale stripes) are shown for various -score threshold levels, which were used to define thin and thick stripe regions of interest (ROIs). R1 is lower in both thin and thick stripes than surrounding gray matter, which confirms the results of the main analysis illustrated in Figure 5. This supporting analysis was done to exclude the possibility of bias in the main analysis coming from the stripe ROI definition, which was based on functional activation maps that generally showed absence of activation around the foveal representation. Statistically significant differences are marked by asterisks, *: , **: , ***: . Shaded areas indicate 1 standard deviation of the generated null distribution used for permutation testing. Other details as in Figure 5.
Figure 5—figure supplement 2
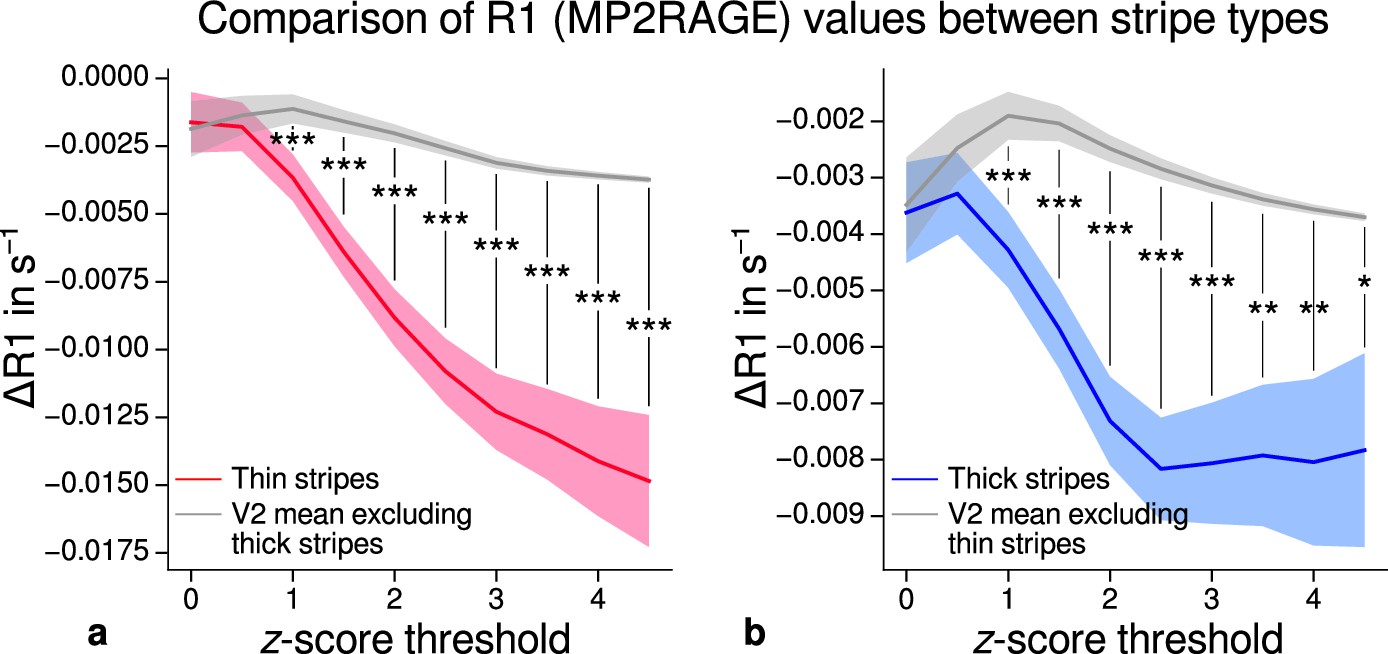
Comparison of quantitative R1 values (MP2RAGE) between V2 stripe types.
Cortical R1 values in thin stripes (red), thick stripes (blue), and whole V2 excluding the other stripe type (gray; and therefore containing contributions from pale stripes) are shown for various -score threshold levels, which were used to define thin and thick stripe regions of interest (ROIs). R1 values are based on a separate data set using the MP2RAGE sequence. Lower values were found in thin (a) and thick stripes (b) when compared to surrounding gray matter, which confirms the results of the main analysis illustrated in Figure 5. Statistically significant differences are marked by asterisks, *: , **: , ***: . Shaded areas indicate 1 standard deviation of the generated null distribution used for permutation testing. Other details as in Figure 5.
Figure 5—figure supplement 3
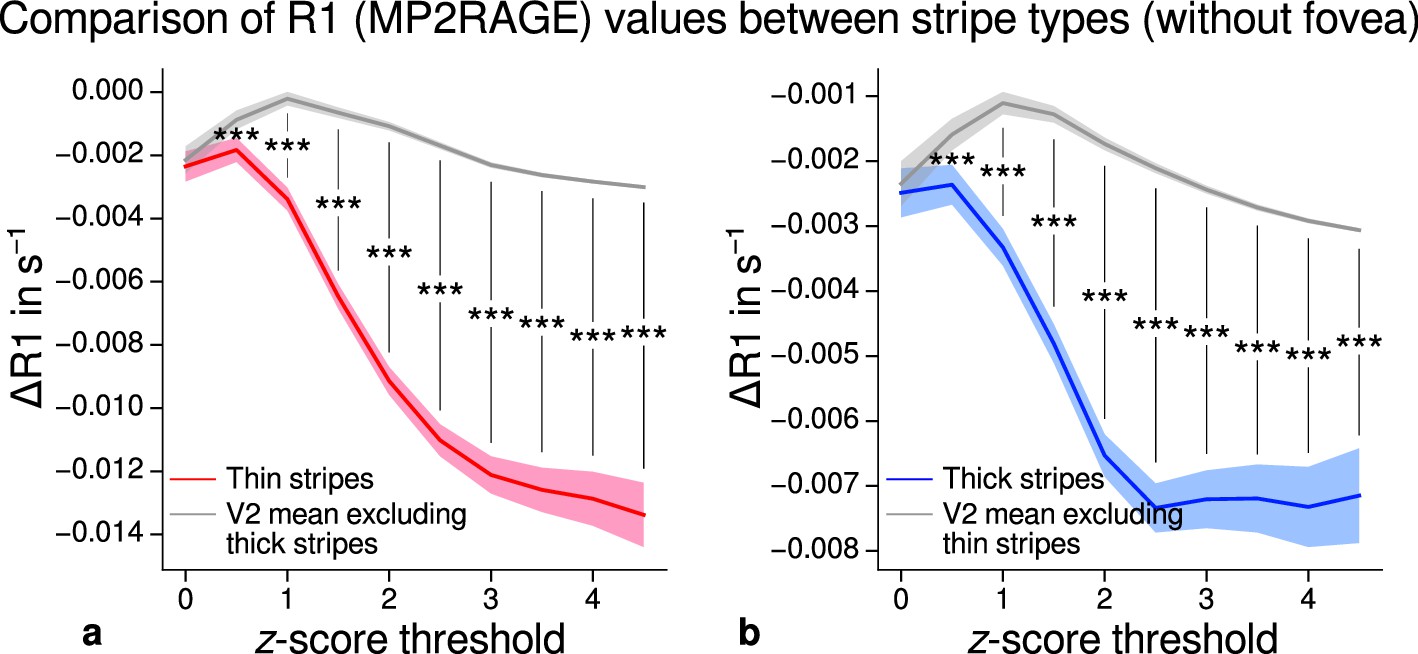
Comparison of quantitative R1 values (MP2RAGE) between V2 stripe types excluding foveal parts.
Cortical R1 values in thin stripes (red), thick stripes (blue), and V2 excluding the other stripe type plus the region around the foveal representation (gray; and therefore containing contributions from pale stripes) are shown for various -score threshold levels, which were used to define thin and thick stripe regions of interest (ROIs). R1 values are based on a separate data set using the MP2RAGE sequence. Lower values were found in thin (a) and thick stripes (b) when compared to surrounding gray matter, which confirms the results of the main analysis illustrated in Figure 5 and the supporting analysis which covered whole V2 shown in Figure 5—figure supplement 2. Statistically significant differences are marked by asterisks, *: , **: , ***: . Shaded areas indicate 1 standard deviation of the generated null distribution used for permutation testing. Other details as in Figure 5.
Figure 6 with 4 supplements
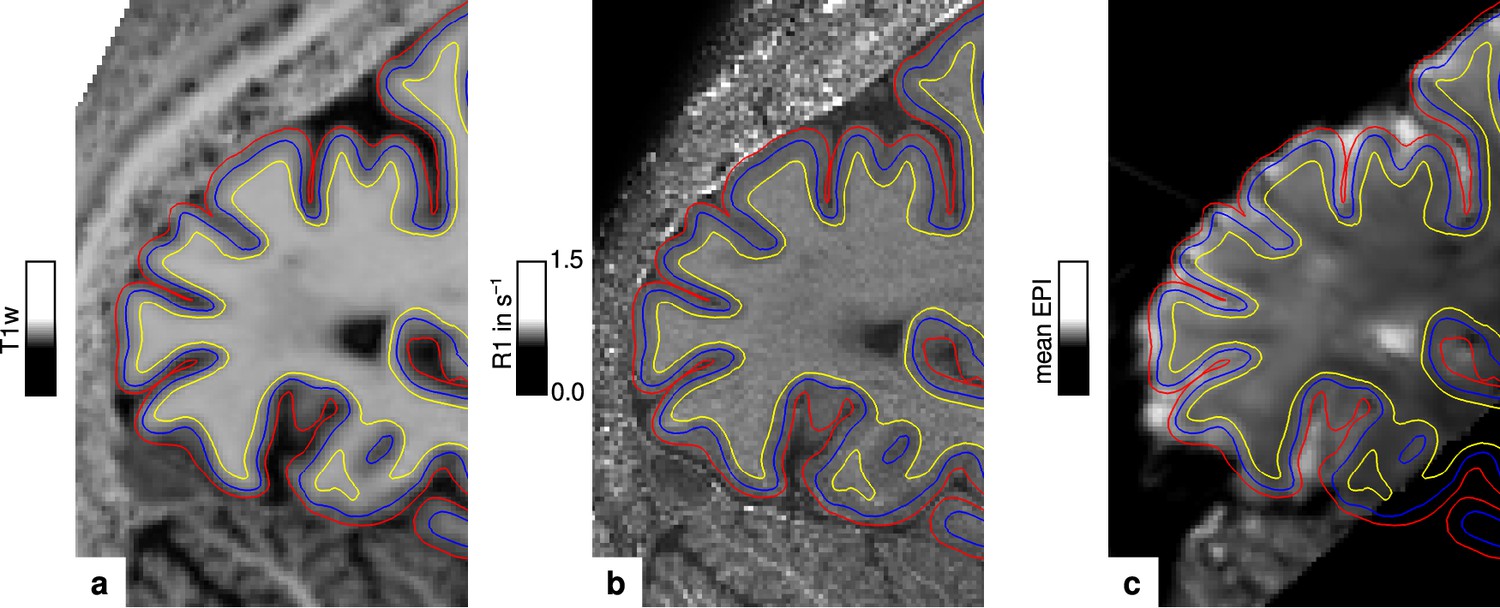
Illustration of segmentation and registration quality.
(a) Posterior part of the MP2RAGE UNI image in sagittal orientation of one representative participant (subject 3), which was used for segmentation of the cerebral cortex. Overlaid contour lines show the reconstructed white matter/gray matter boundary surface (yellow), the pial boundary surface (red), and a surface at mid-cortical depth (blue). The computed R1 map from the multi-parameter mapping (MPM) acquisition and the temporal mean from a representative functional magnetic resonance imaging (fMRI) session are shown in (b) and (c), respectively. Overlaid contour lines are identical to (a) to visualize the segmentation and registration quality. Other illustrations of registration quality are provided for each participant in video format, see Figure 6—video 1, Figure 6—video 2, Figure 6—video 3, and Figure 6—video 4. A more quantitative analysis of the achieved registration performance is shown in Appendix 7.
Figure 6—video 1
Illustration of registration quality (subject 1).
The video shows the posterior part of the R1 map from the multi-parameter mapping (MPM) protocol in temporal counter-phase with registered data from other measurements (temporal mean blood oxygenation level-dependent (BOLD) acquisitions from color-selective thin stripe measurement, disparity-selective thick stripe measurement, baseline measurement without task, retinotopy measurement, and the R1 map from the MP2RAGE acquisition). Twenty slices are shown around the midsagittal plane. A red grid is overlaid for visual guidance.
Figure 6—video 2
Illustration of registration quality (subject 2).
Other details as in Figure 6—video 1.
Figure 6—video 3
Illustration of registration quality (subject 3).
Other details as in Figure 6—video 1.
Figure 6—video 4
Illustration of registration quality (subject 4).
Other details as in Figure 6—video 1.
Appendix 1—figure 1
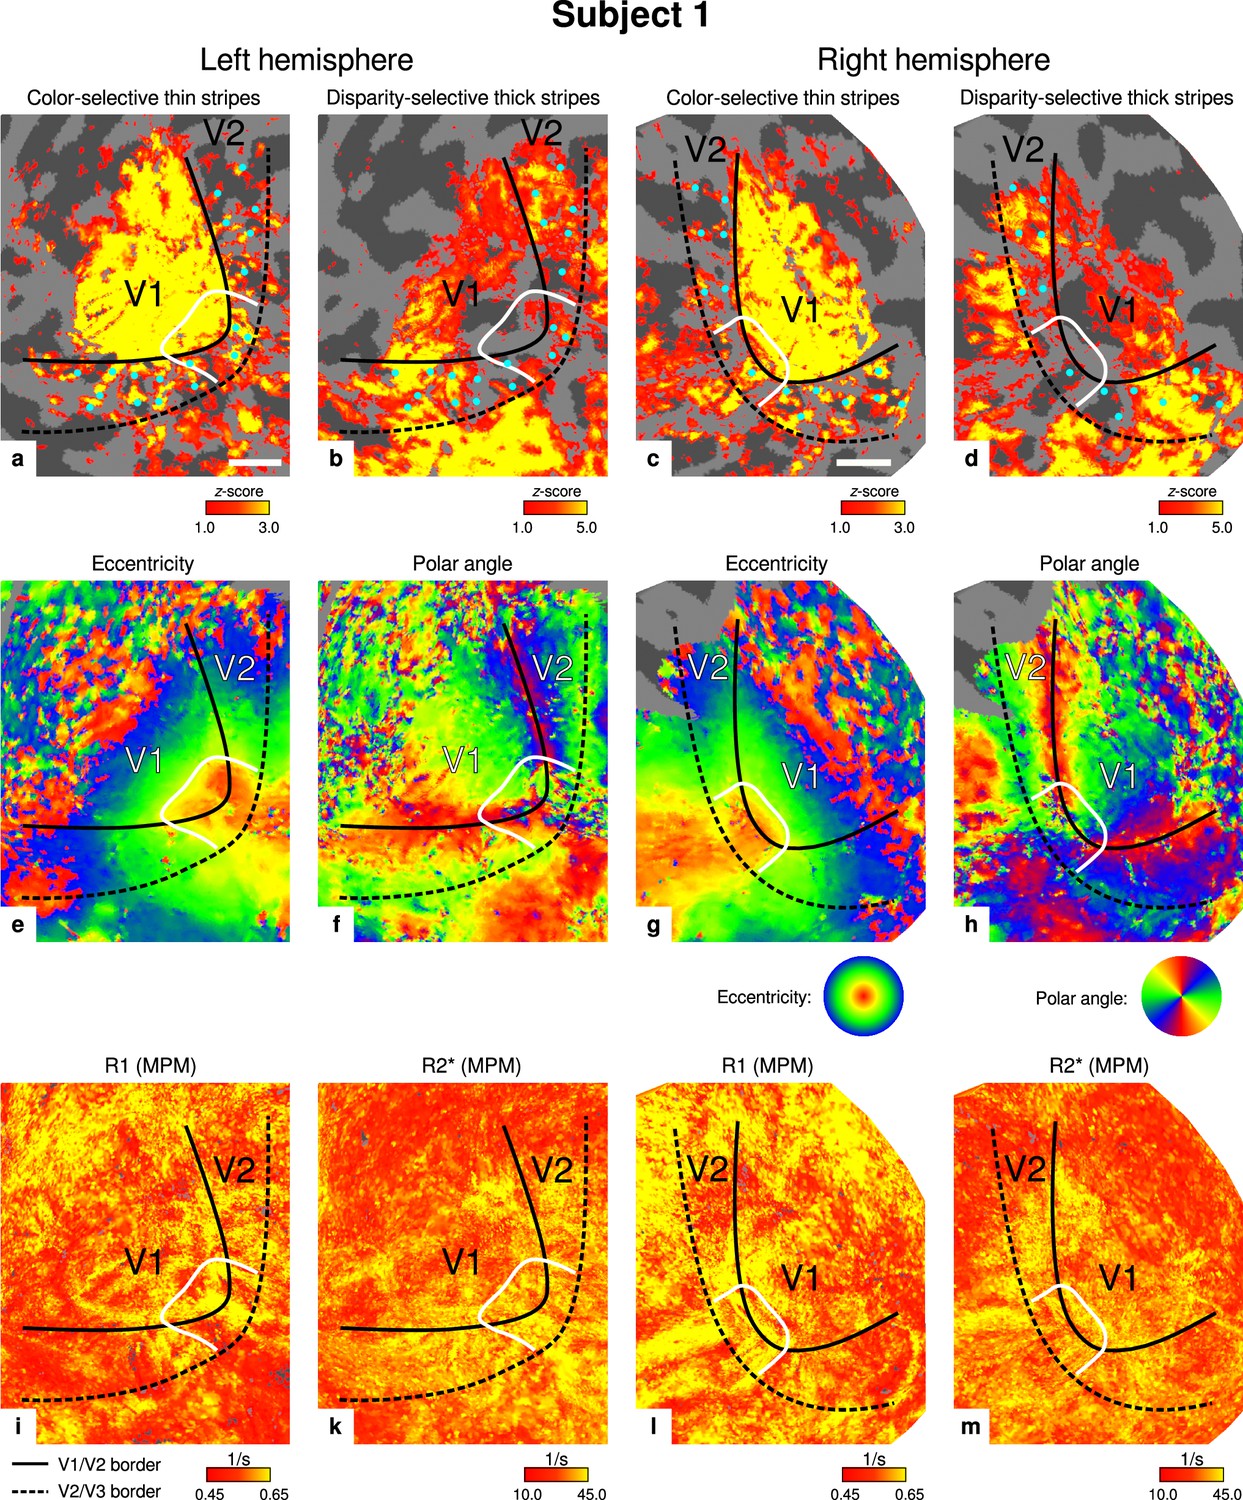
Individual functional magnetic resonance imaging (fMRI) activation maps and quantitative magnetic resonance imaging (qMRI) maps (subject 1).
The first row shows activation maps for color-selective thin stripe measurements (contrast: color > luminance) (a, c) and disparity-thick-stripe measurements (contrast: depth > no depth) (b, d). The second row shows eccentricity (e, g) and polar angle (f, h) phase responses from the retinotopy measurement, which were used to define the positions of V1/V2 and V2/V3 borders. The third row shows qMRI maps of R1 (i, l) and R2* (k, m) from the multi-parameter mapping (MPM) acquisition, which were used to compare myelin content between stripe types. Other details as in Figure 2. Scale bar: 1 cm.
Appendix 1—figure 2
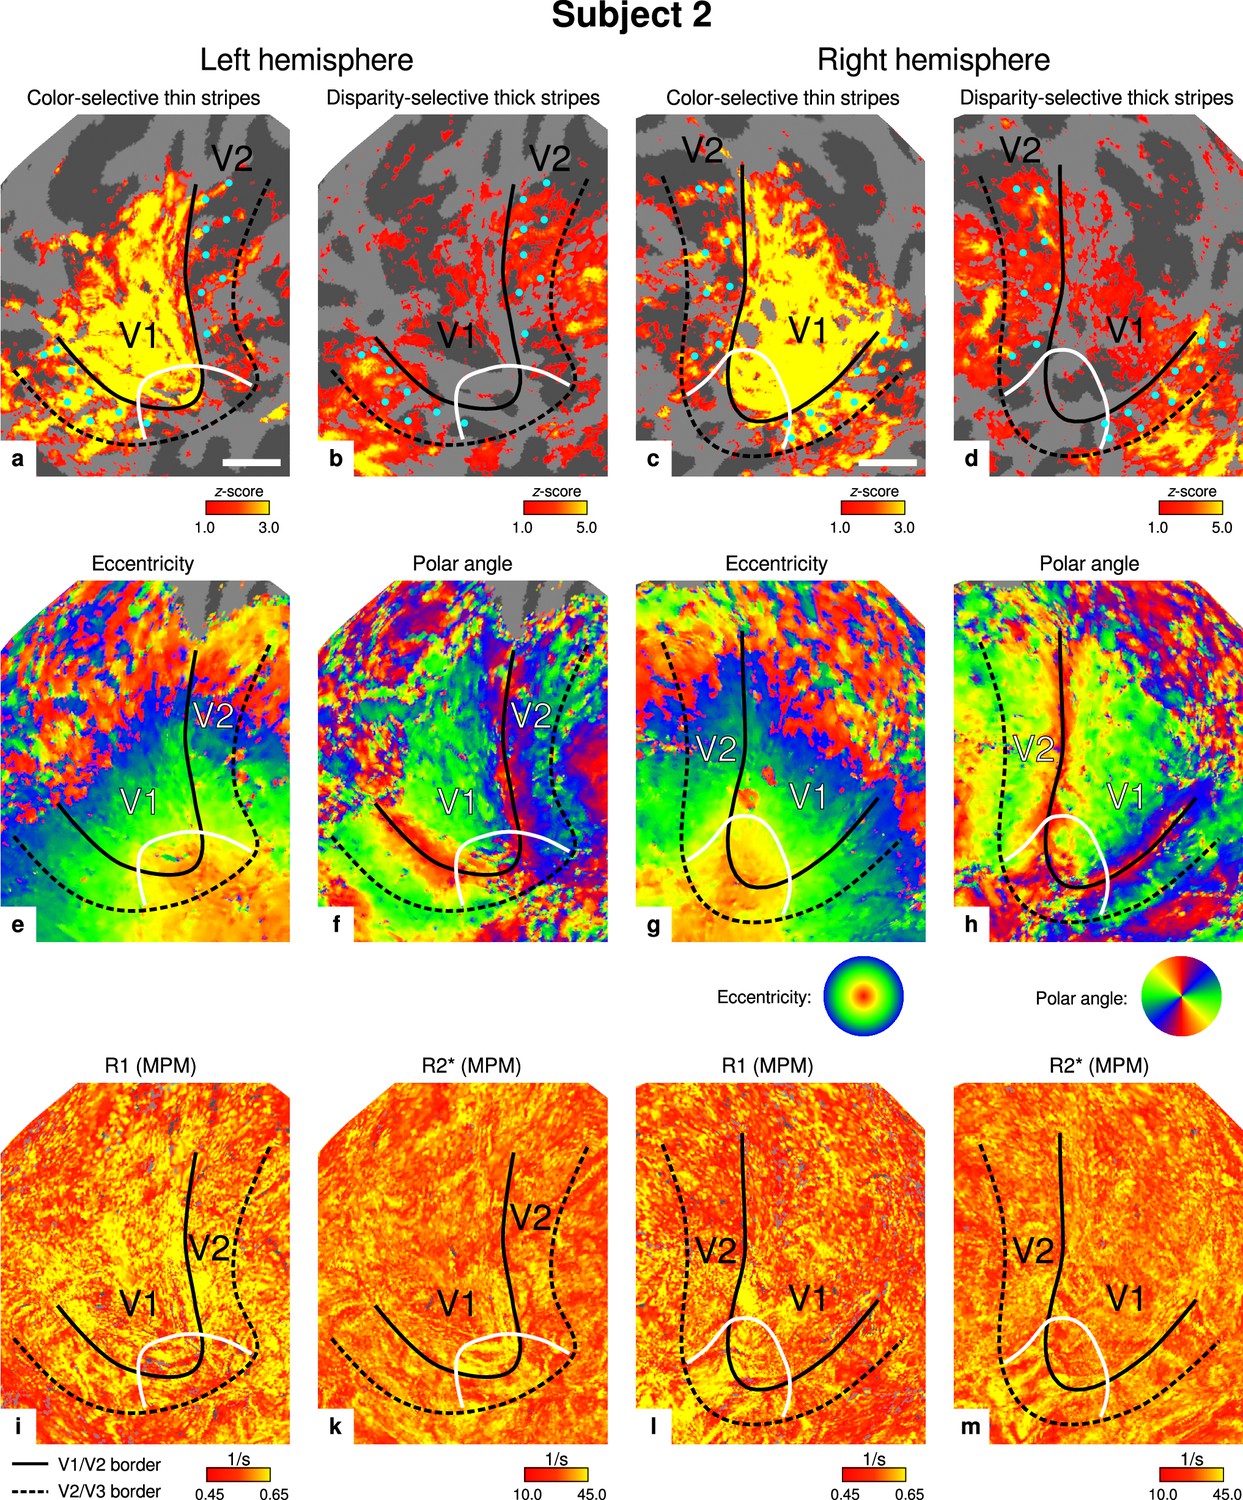
Individual functional magnetic resonance imaging (fMRI) activation maps and quantitative magnetic resonance imaging (qMRI) maps (subject 2).
The first row shows activation maps for color-selective thin stripe measurements (contrast: color > luminance) (a, c) and disparity-thick-stripe measurements (contrast: depth > no depth) (b, d). The second row shows eccentricity (e, g) and polar angle (f, h) phase responses from the retinotopy measurement, which were used to define the positions of V1/V2 and V2/V3 borders. The third row shows qMRI maps of R1 (i, l) and R2* (k, m) from the multi-parameter mapping (MPM) acquisition, which were used to compare myelin content between stripe types. Other details as in Figure 2. Scale bar: 1 cm.
Appendix 1—figure 3
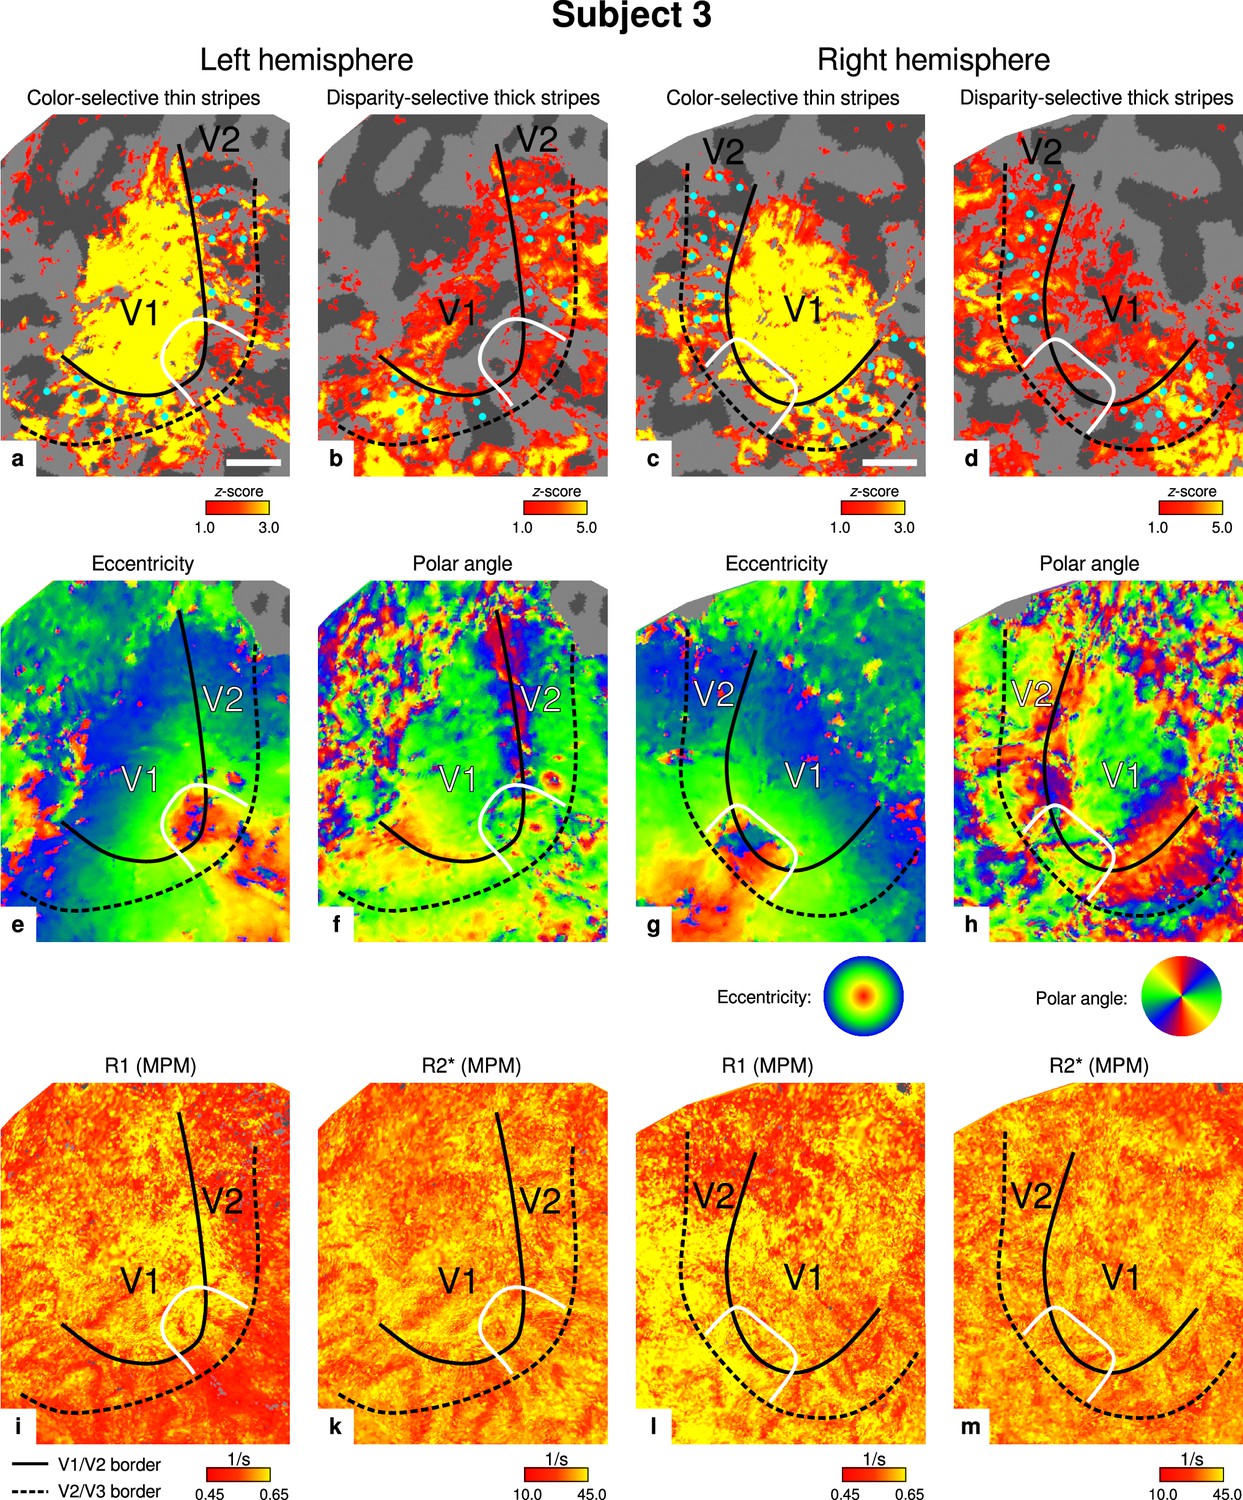
Individual functional magnetic resonance imaging (fMRI) activation maps and quantitative magnetic resonance imaging (qMRI) maps (subject 3).
The first row shows activation maps for color-selective thin stripe measurements (contrast: color > luminance) (a, c) and disparity-thick-stripe measurements (contrast: depth > no depth) (b, d). The second row shows eccentricity (e, g) and polar angle (f, h) phase responses from the retinotopy measurement, which were used to define the positions of V1/V2 and V2/V3 borders. The third row shows qMRI maps of R1 (i, l) and R2* (k, m) from the multi-parameter mapping (MPM) acquisition, which were used to compare myelin content between stripe types. Other details as in Figure 2. Scale bar: 1 cm.
Appendix 1—figure 4
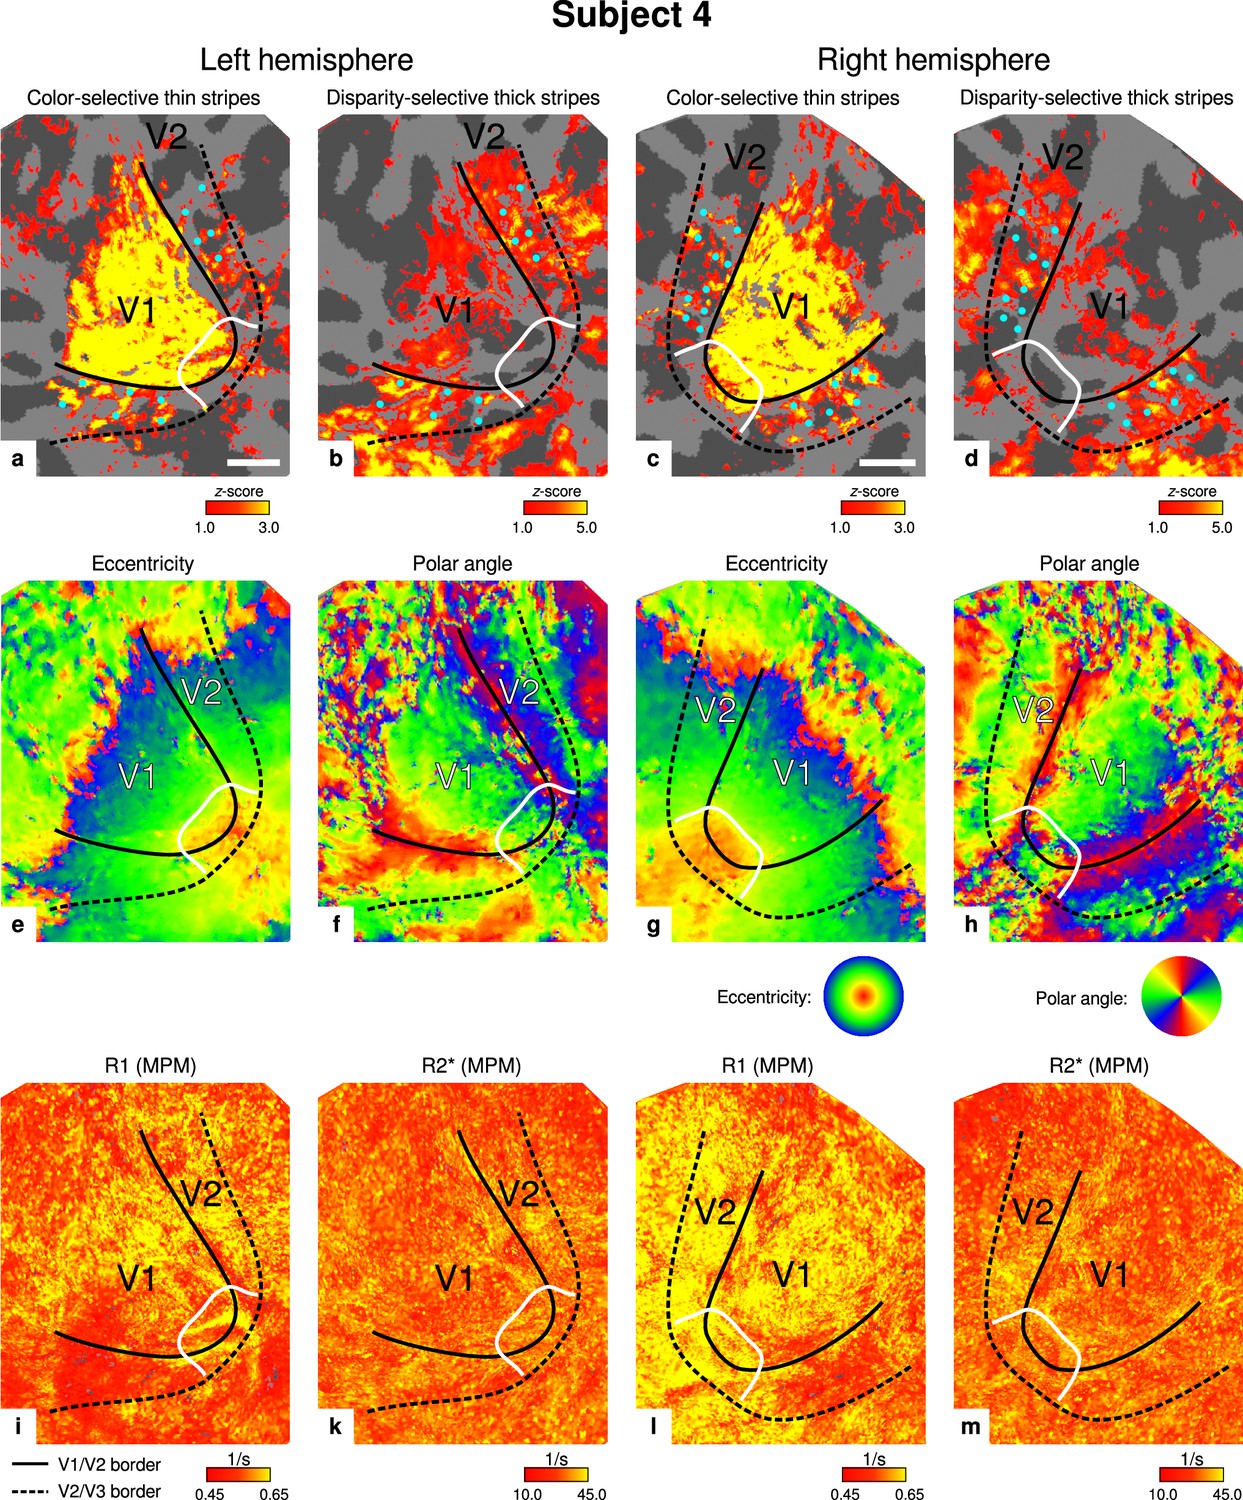
Individual functional magnetic resonance imaging (fMRI) activation maps and quantitative magnetic resonance imaging (qMRI) maps (subject 4).
The first row shows activation maps for color-selective thin stripe measurements (contrast: color > luminance) (a, c) and disparity-thick-stripe measurements (contrast: depth > no depth) (b, d). The second row shows eccentricity (e, g) and polar angle (f, h) phase responses from the retinotopy measurement, which were used to define the positions of V1/V2 and V2/V3 borders. The third row shows qMRI maps of R1 (i, l) and R2* (k, m) from the multi-parameter mapping (MPM) acquisition, which were used to compare myelin content between stripe types. Other details as in Figure 2. Scale bar: 1 cm.
Appendix 2—figure 1
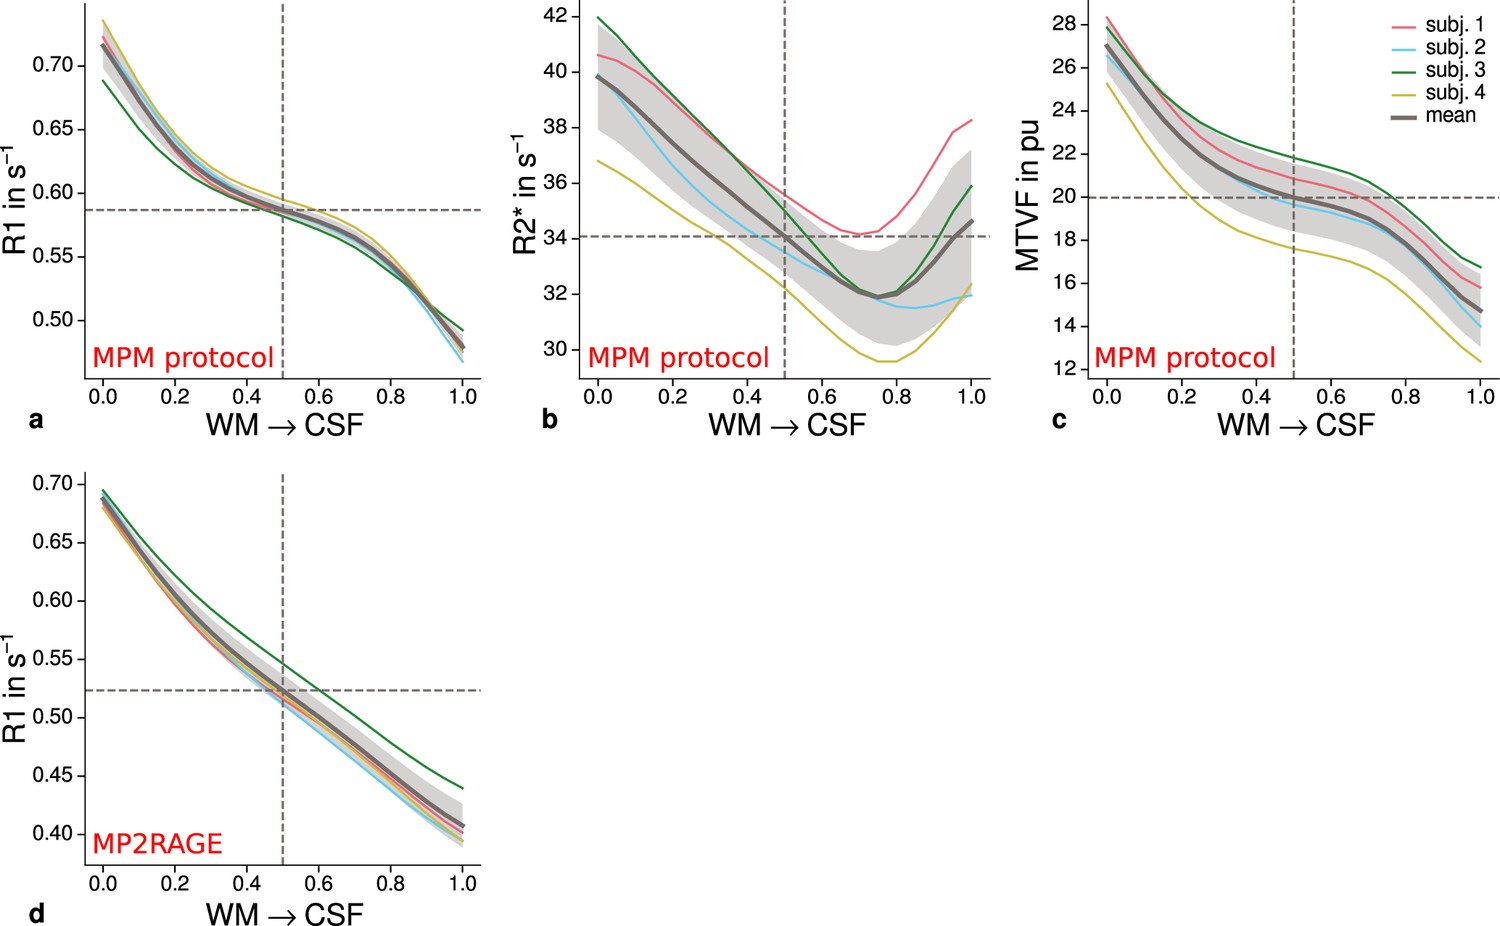
Cortical profiles of mean quantitative magnetic resonance imaging (qMRI) parameters within V2.
Mean R1 (a), R2* (b), and MTVF = 100% − PD (macromolecular tissue volume fraction [Mezer et al., 2013]) (c) values based on the multi-parameter mapping (MPM) protocol were sampled at 21 cortical depths between the gray matter/white matter boundary surface and pial surface. The expected decrease of quantitative parameters toward the pial surface can be seen in all plots. (d) shows mean R1 across cortical depth based on a separate data set using the MP2RAGE sequence. A similar decrease as shown in (a) can be seen. However, in comparison to (a), a plateau at middle depths is less visible. This might be attributable to the larger voxel size in (d) and the larger point spread function along the phase-encoding direction (Marques et al., 2010) of MP2RAGE acquisitions. The mean across participants is shown as gray line. Dashed lines mark the mean at mid-cortical depth. Shaded areas indicate 1 standard deviation across participants.
Appendix 3—figure 1
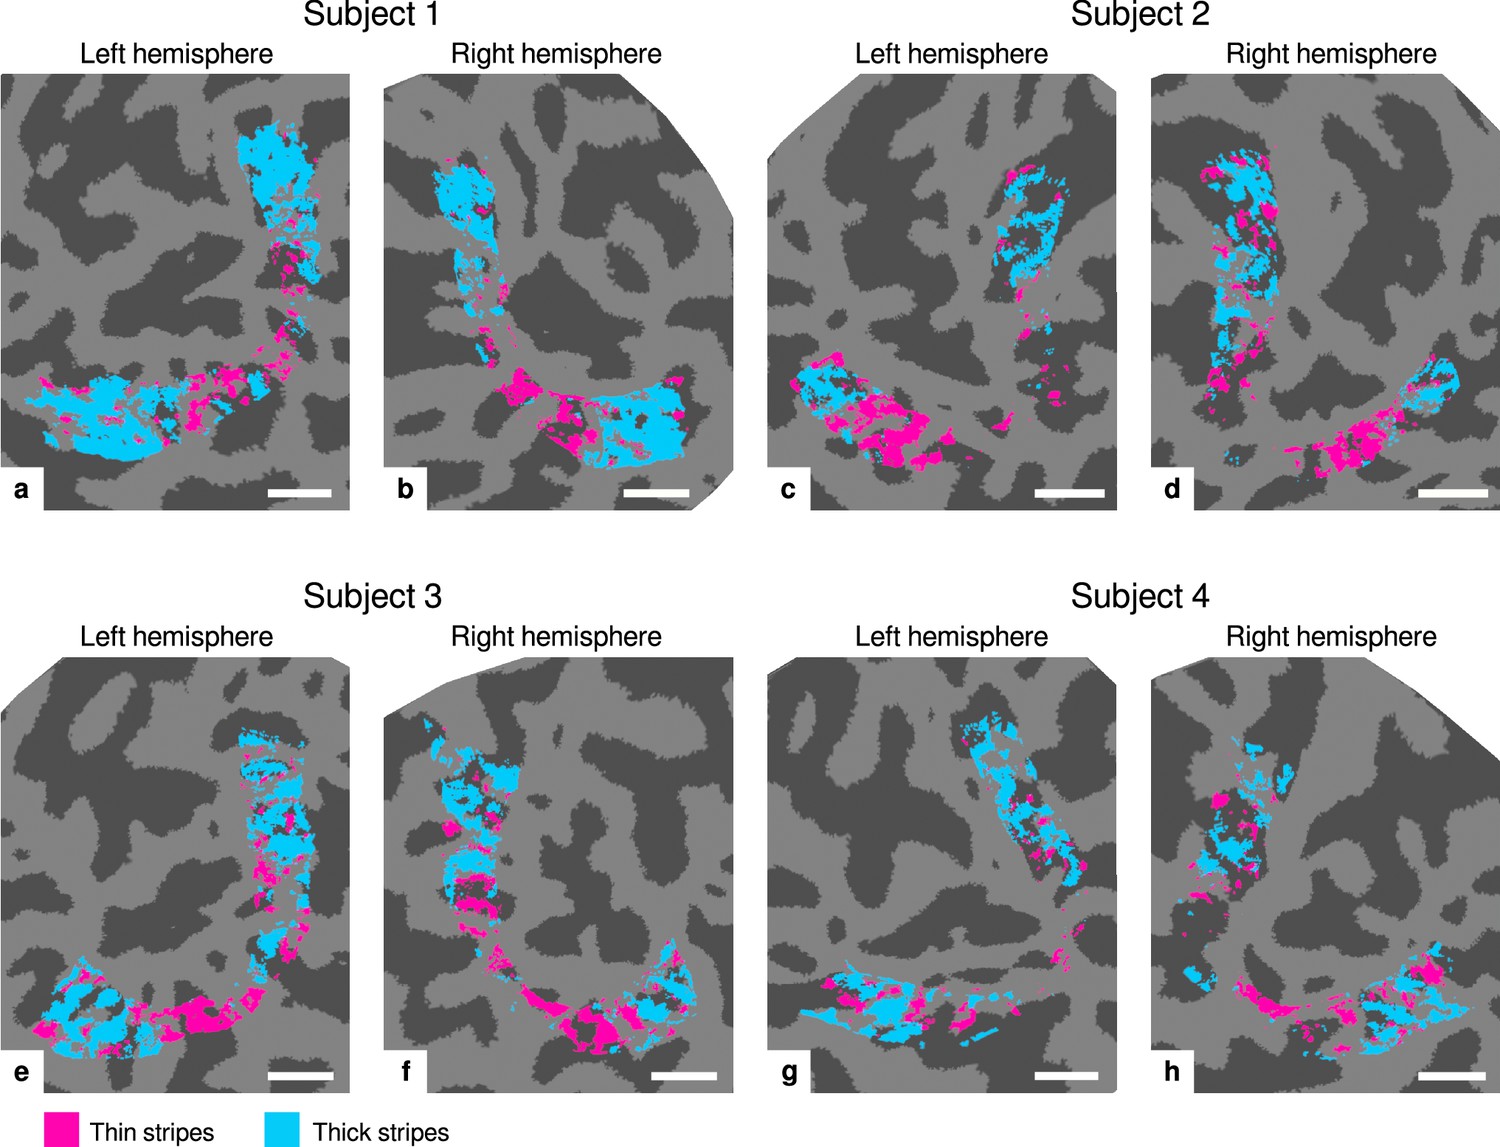
Visualization of thin and thick stripe regions of interest (ROIs).
Thin stripe (magenta) and thick stripe (cyan) ROIs are shown for each participant. Presented ROIs were created by thresholding functional activation maps from color-selective thin stripe and disparity-selective thick stripe measurements at a -score threshold level of (, two-sided). Note that ROIs were defined to be mutually exclusive, that is, data points (vertices) were only classified as belonging either to thin stripes or thick stripes, if the corresponding contrast exceeded the defined threshold but not the other. To aid comparison, all maps are presented in the same format as in Figure 2 and Appendix 1. Cortical curvature is shown in gray (sulcal cortex is dark gray and gyral cortex light gray). Scale bar: 1 cm.
Appendix 4—figure 1
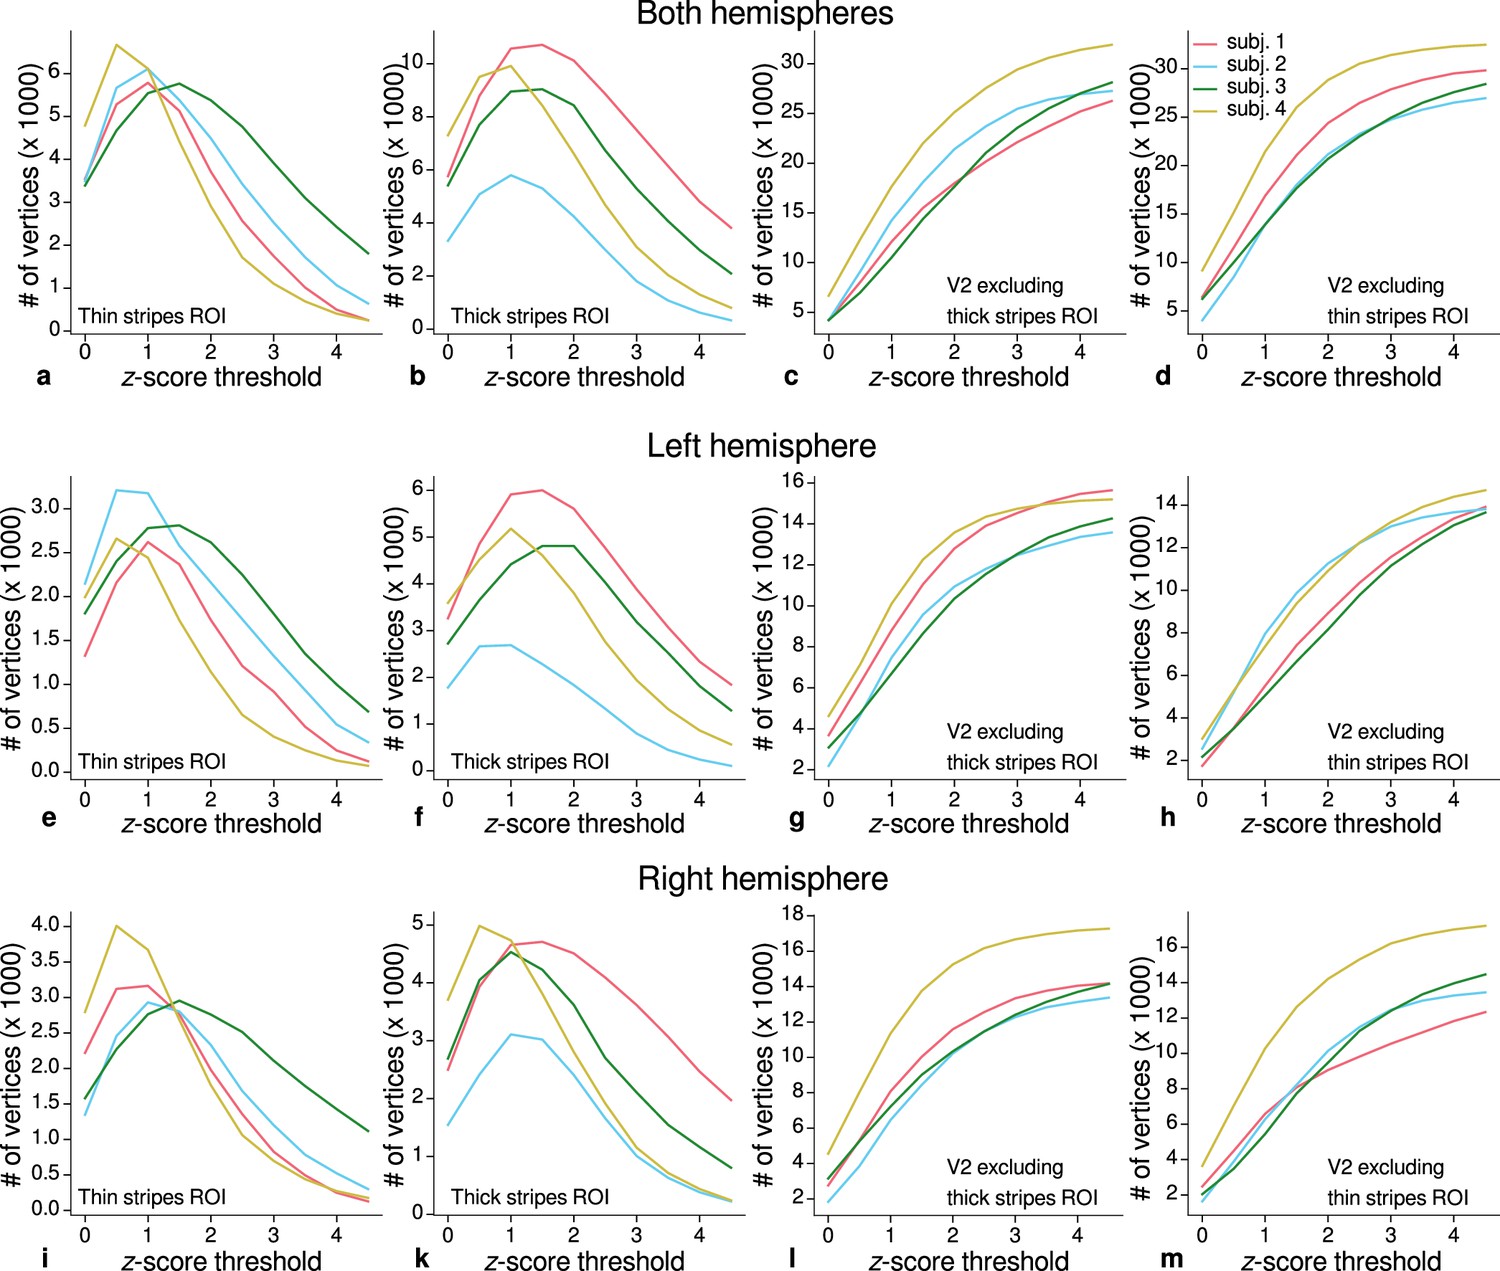
Sizes of stripe regions of interest (ROIs) for each threshold level.
ROI sizes (number of vertices) across hemispheres for color-selective thin stripes (a), disparity-selective thick stripes (b), and whole V2 excluding one stripe type (c–d) are shown for several -score threshold levels and all participants (upper row). These ROIs were used for comparison of quantitative magnetic resonance imaging (qMRI) parameters (R1, R2*) between stripe types as shown in Figure 5. Voxels activated by both color and disparity contrasts were excluded from thin and thick stripe ROIs, explaining the non-monotonous dependence on the -score threshold. Middle and lower rows show number of vertices from single hemispheres.
Appendix 5—figure 1
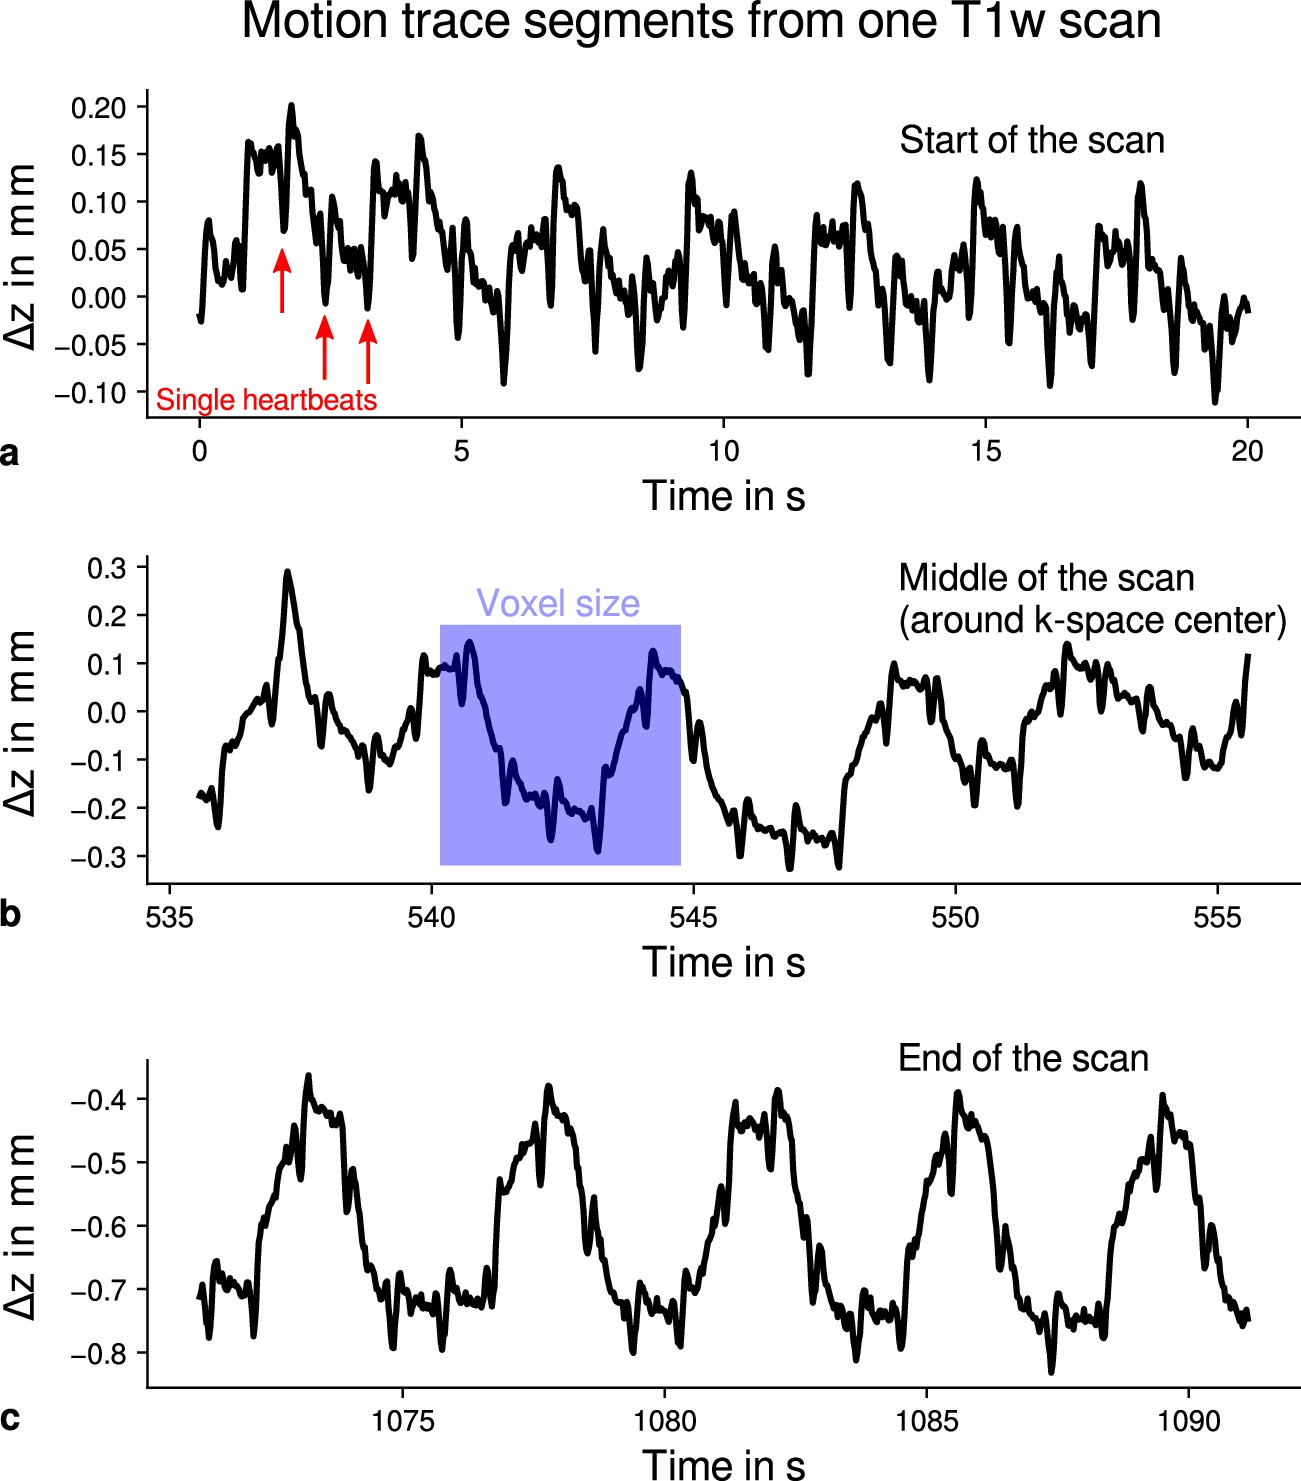
Exemplary motion data from one multi-parameter mapping (MPM) measurement.
For one representative participant (subject 3), head movements are shown from the 3D multi-echo fast low angle shot (FLASH) scan with T1-weighting (T1w). Movements were measured during acquisition using an optical tracking system and used for prospective motion correction. From the start (a), the middle (time of -space center sampling) (b) and the end of the scan (c), excerpts of 20 s depict translational movements for each TR = 25 ms in -direction (inferior-superior) relative to start of the scan. In all plots, the participant’s breathing pattern can be seen as slow oscillation. On top of this oscillation, displacements at a faster rate related to the cardiac cycle can be identified. In (a), a subset of cardiac beats are marked by red arrows. This demonstrates the ability to detect small movements, which were prospectively corrected during high-resolution anatomical scans. Note that motion was overall on the order of the (0.5 mm)3 voxel size (even for the short excerpts shown), which makes an accurate correction for subject motion necessary during the long scan time (acquisition time around 18 min). This is qualitatively illustrated by showing the 0.5 mm voxel edge length as blue square in (b). It can be further noticed that movements were getting larger toward the end of the scan as expected due to the long scan time.
Appendix 6—figure 1
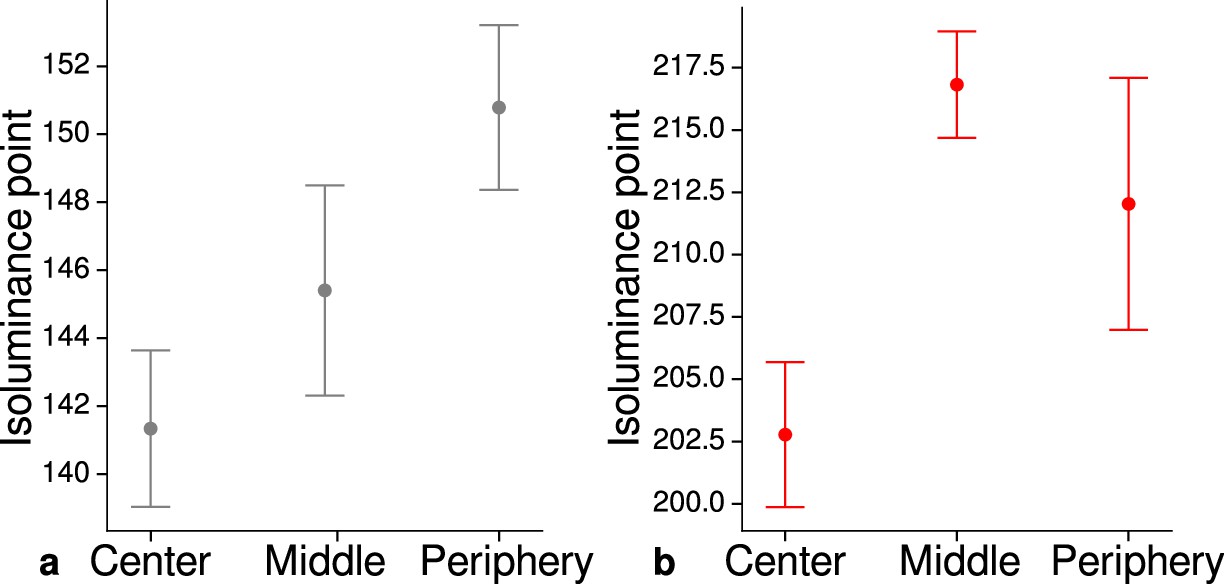
Measured mean isoluminance points across participants and sessions at different eccentricities.
For each participant, isoluminance points were measured before scanning within the scanner at three different eccentricities (center: 0°–1.7°, middle: 1.7°–4.1°, periphery: 4.1°–8.3°). Luminance points for gray (a) and red (b) were adjusted to match blue (RGB: 0, 0, 255), see Materials and methods. Across participants and scanning sessions, we found a statistically significant effect of eccentricity for gray (, , ) and red (, , ) with the application of a one-way ANOVA. Error bars indicate 1 standard error of the mean.
Appendix 7—figure 1
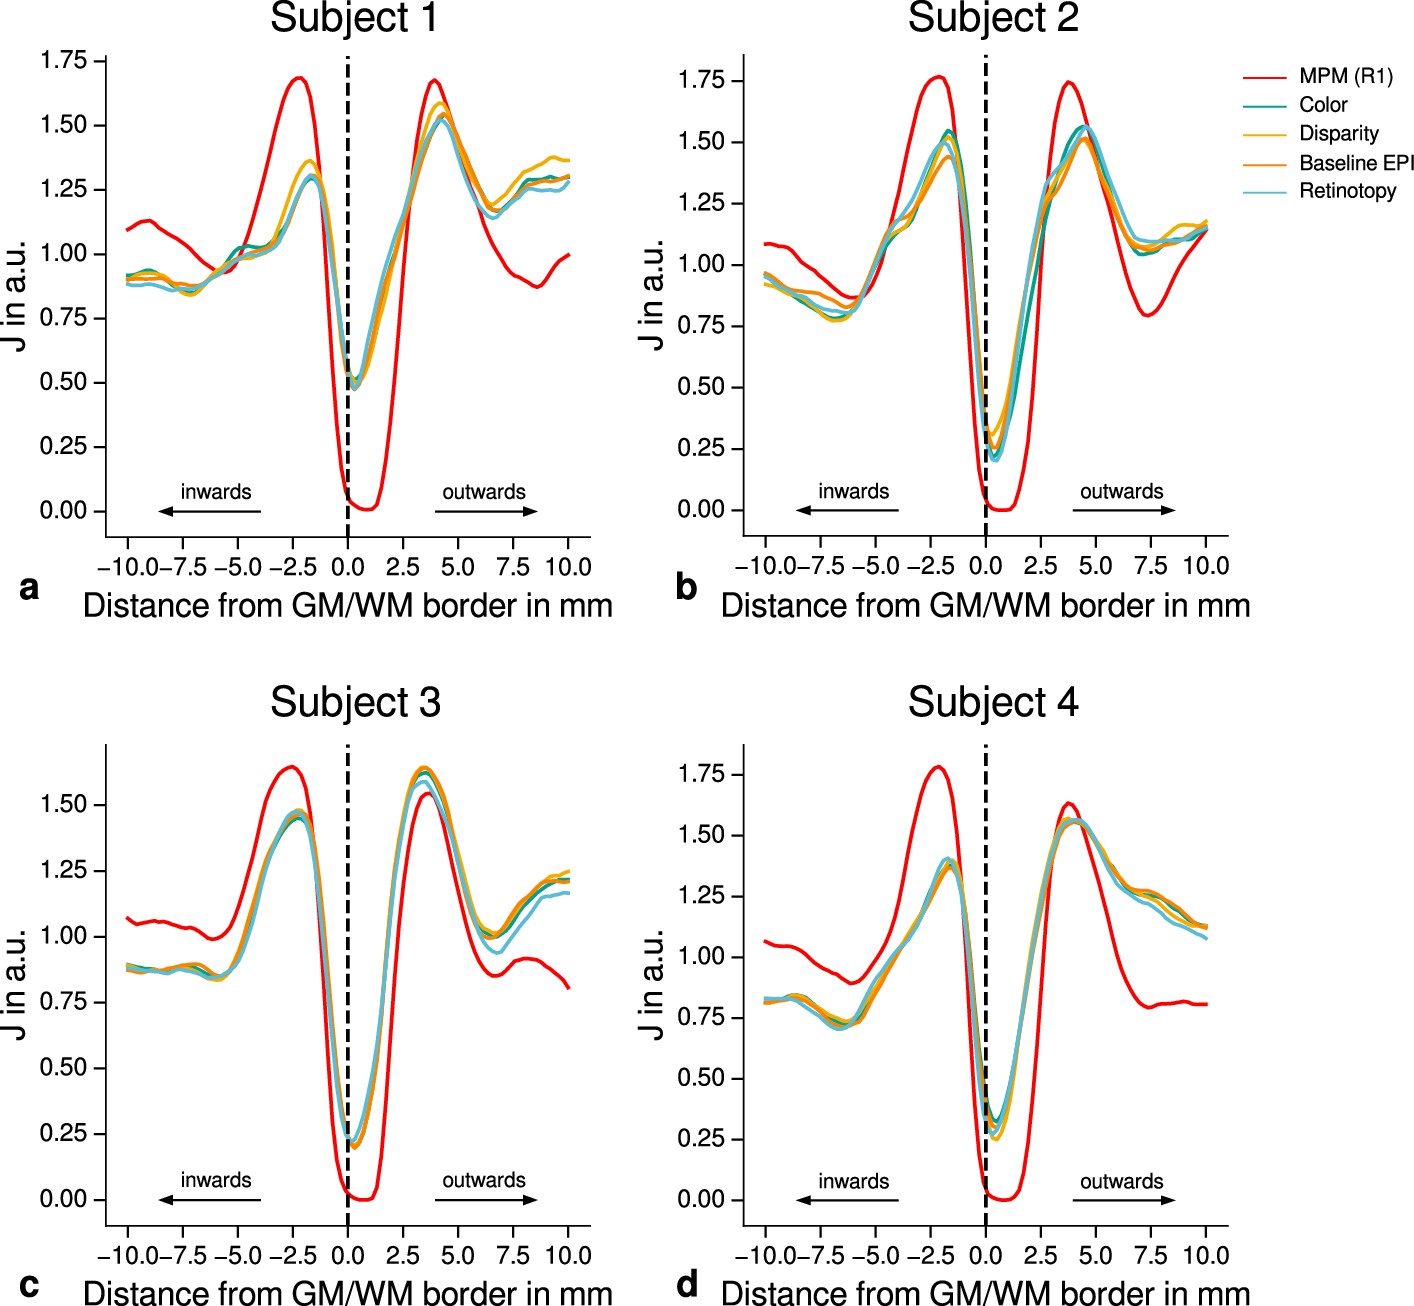
Quantitative analysis of registration accuracy.
For each participant, the local image contrast is estimated by the cost function at multiple positions around the gray matter (GM)/white matter (WM) border. For all imaging modalities, contrast is maximal ( is minimal) at the GM/WM border. This demonstrates the high quality of registration between different modalities (quantitative magnetic resonance imaging [qMRI], functional magnetic resonance imaging [fMRI]) for all participants and used data sets. The position of the GM/WM border is indicated as vertical dashed line.
Author response image 1
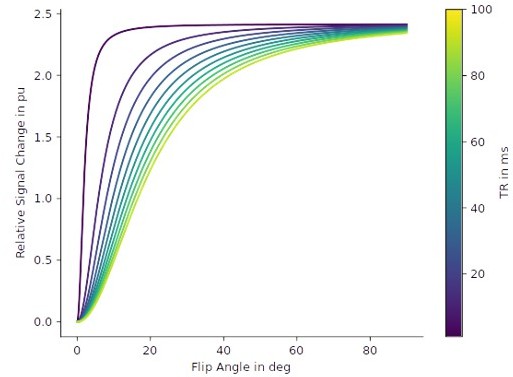
Relative signal changes based on R1 differences.
Based on the Ernst equation, the set of curves shows the relative signal change in percent unit between the signal at R1 and the signal at R1+ΔR1 for different repetition times (TR) and flip angles. T1-weighting in gradient echo sequences increases for small TR and large flip angles. We set the R1 = 0.58 s-1 (which is the mean cortical gray matter R1 of our cohort in V2) and ΔR1 = 0.014 s-1 (see p. 7, lines 185–188), which corresponds to a relative R1 change of about 2.4%. In the graphic, it can be seen that this change in R1 translates to a similar maximal relative signal change of ca. 2% in the weighted gradient echo images.
Additional files
Download links
A two-part list of links to download the article, or parts of the article, in various formats.
Downloads (link to download the article as PDF)
Open citations (links to open the citations from this article in various online reference manager services)
Cite this article (links to download the citations from this article in formats compatible with various reference manager tools)
High-resolution quantitative and functional MRI indicate lower myelination of thin and thick stripes in human secondary visual cortex
eLife 12:e78756.
https://doi.org/10.7554/eLife.78756


