Effects of side-effect risk framing strategies on COVID-19 vaccine intentions: a randomized controlled trial
- Assistant Professorship of Behavioral Science for Disease Prevention and Health Care,Technical University of Munich, Germany
- Heidelberg Institute of Global Health, Heidelberg University, Germany
Figures
Figure 1

CONSORT flow diagram.
Of the 9002 enrolled participants, 8998 individuals completed the survey (response rate = 99.96%).
Figure 2
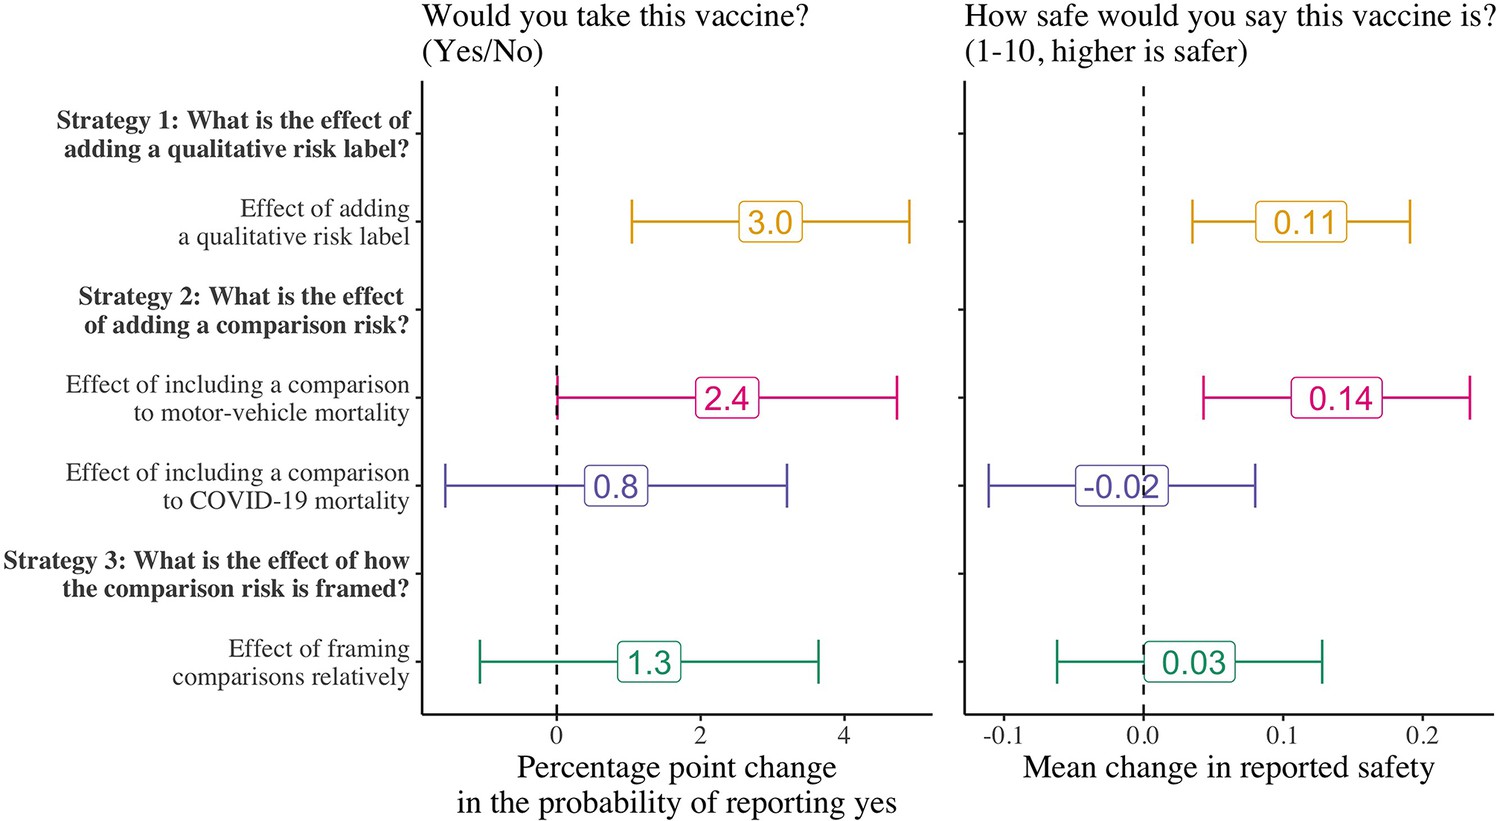
Effect of the vaccine side-effect framing strategies on participants’ vaccine intentions and perceived safety.
N=8998 for strategies 1 and 2; strategy 3 is estimated only among those that received a comparison risk (N=5998). We estimated the main effects of each treatment strategy on participants’ vaccine intentions using logistic regression models and on the perceptions of vaccine safety using OLS regression models. Control means for strategies 1 and 2 are 65% and 67% for strategy 3. Error bars represent 95% confidence intervals.
Figure 3
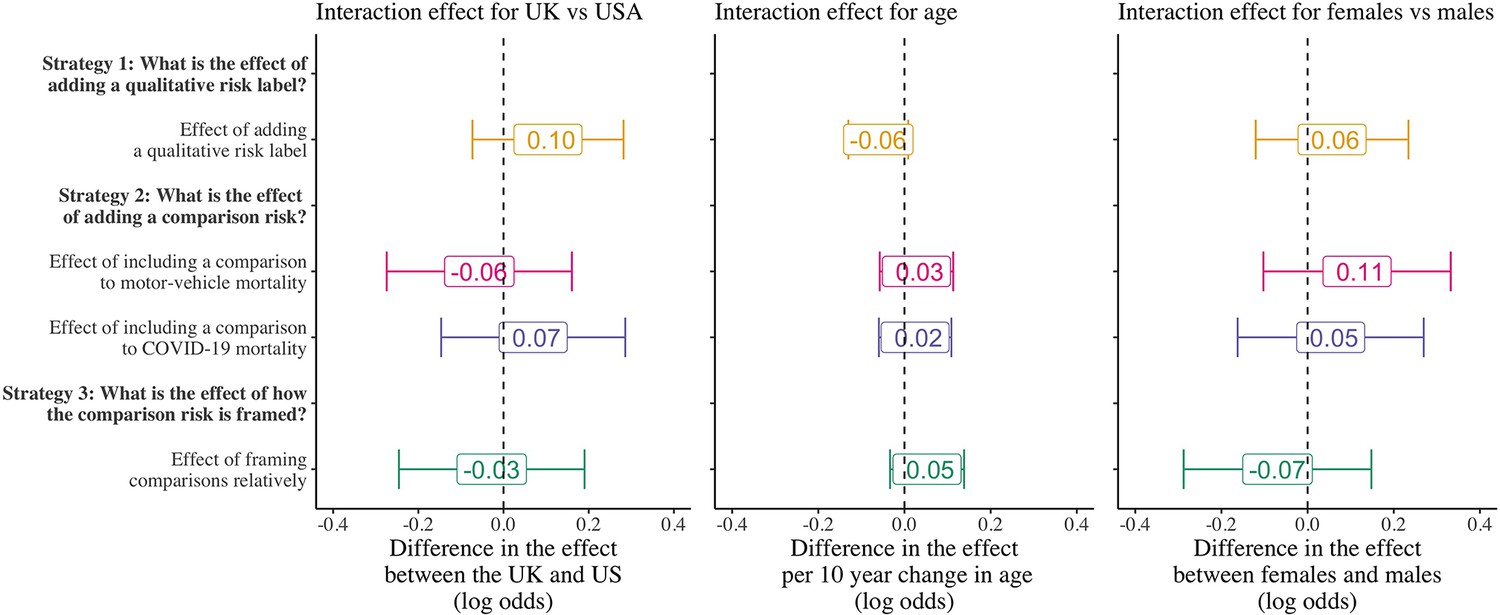
Differences in the framing effects by country, age, and sex.
Coefficients are the interaction effect of the main heterogeneity characteristic with the indicator for each treatment strategy and are presented as coefficients on the log-odds scale from logistic regression models. Error bars represent 95% confidence intervals.
Appendix 1—figure 1
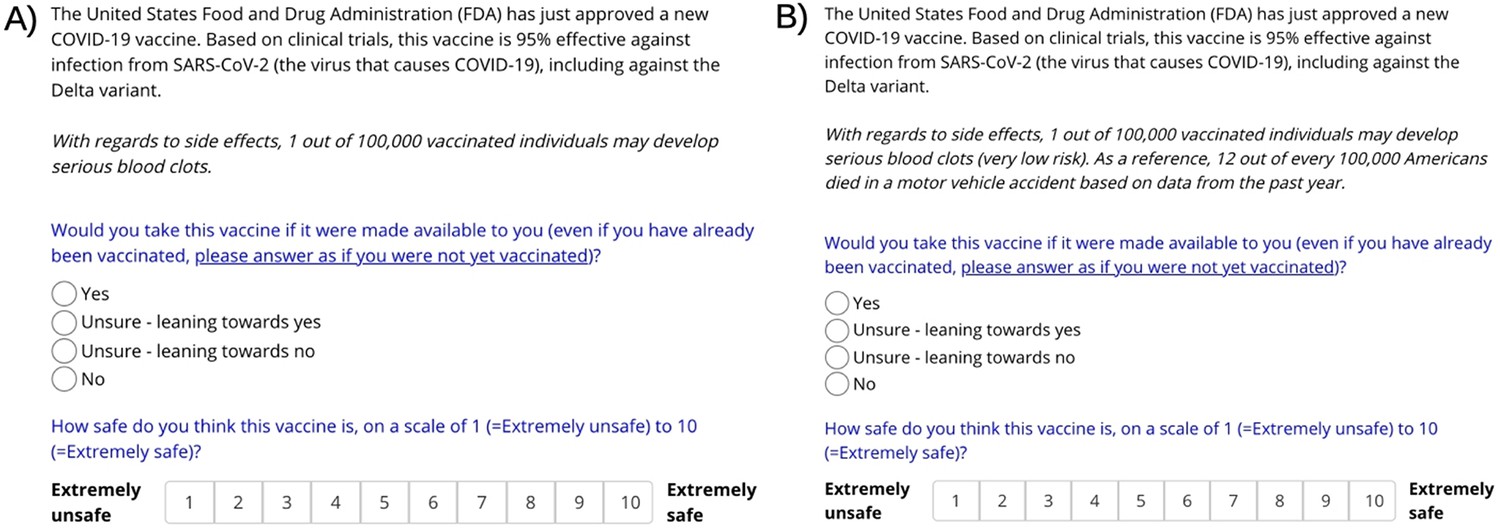
Screenshots of the online, Gorilla-based, experiment content for 2 of the 10 possible experimental combinations (A) no risk label, no control group; (B) risk label, comparison to motor-vehicle mortality, absolute comparison.
Appendix 1—figure 2

Detailed randomization diagram across the main study factors.
We have shown the randomization here with sample sizes referring to both countries combined; in practice, we conducted this procedure stratified by country such that each cell in the diagram has exactly 50% US and 50% UK observation.
Appendix 1—figure 3
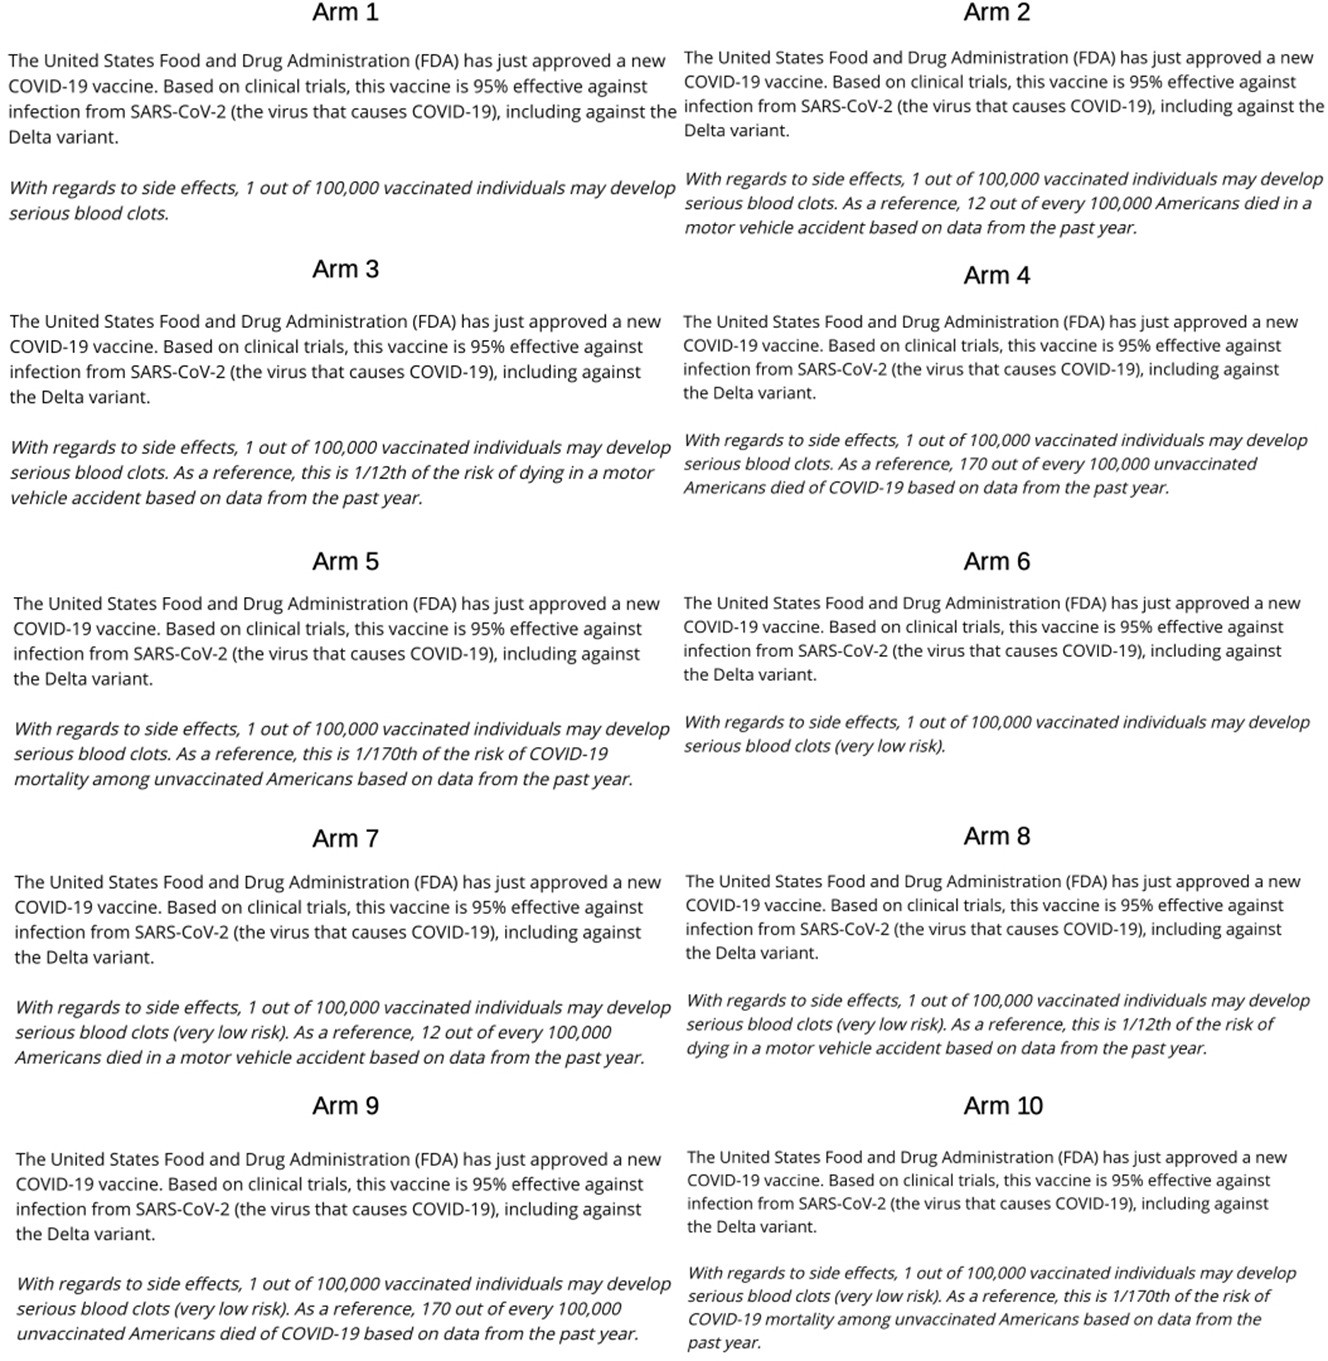
Screenshots of each experimental arm for US participants.
Note that we have labeled the arms for the figure, but participants were not shown this label. Reference mortality information for motor-vehicle and COVID-19 fatalities were taken from the Centers for Disease Control and Prevention (Centers for Disease Control and Prevention, 2021b; Centers for Disease Control and Prevention, 2020).
Appendix 1—figure 4
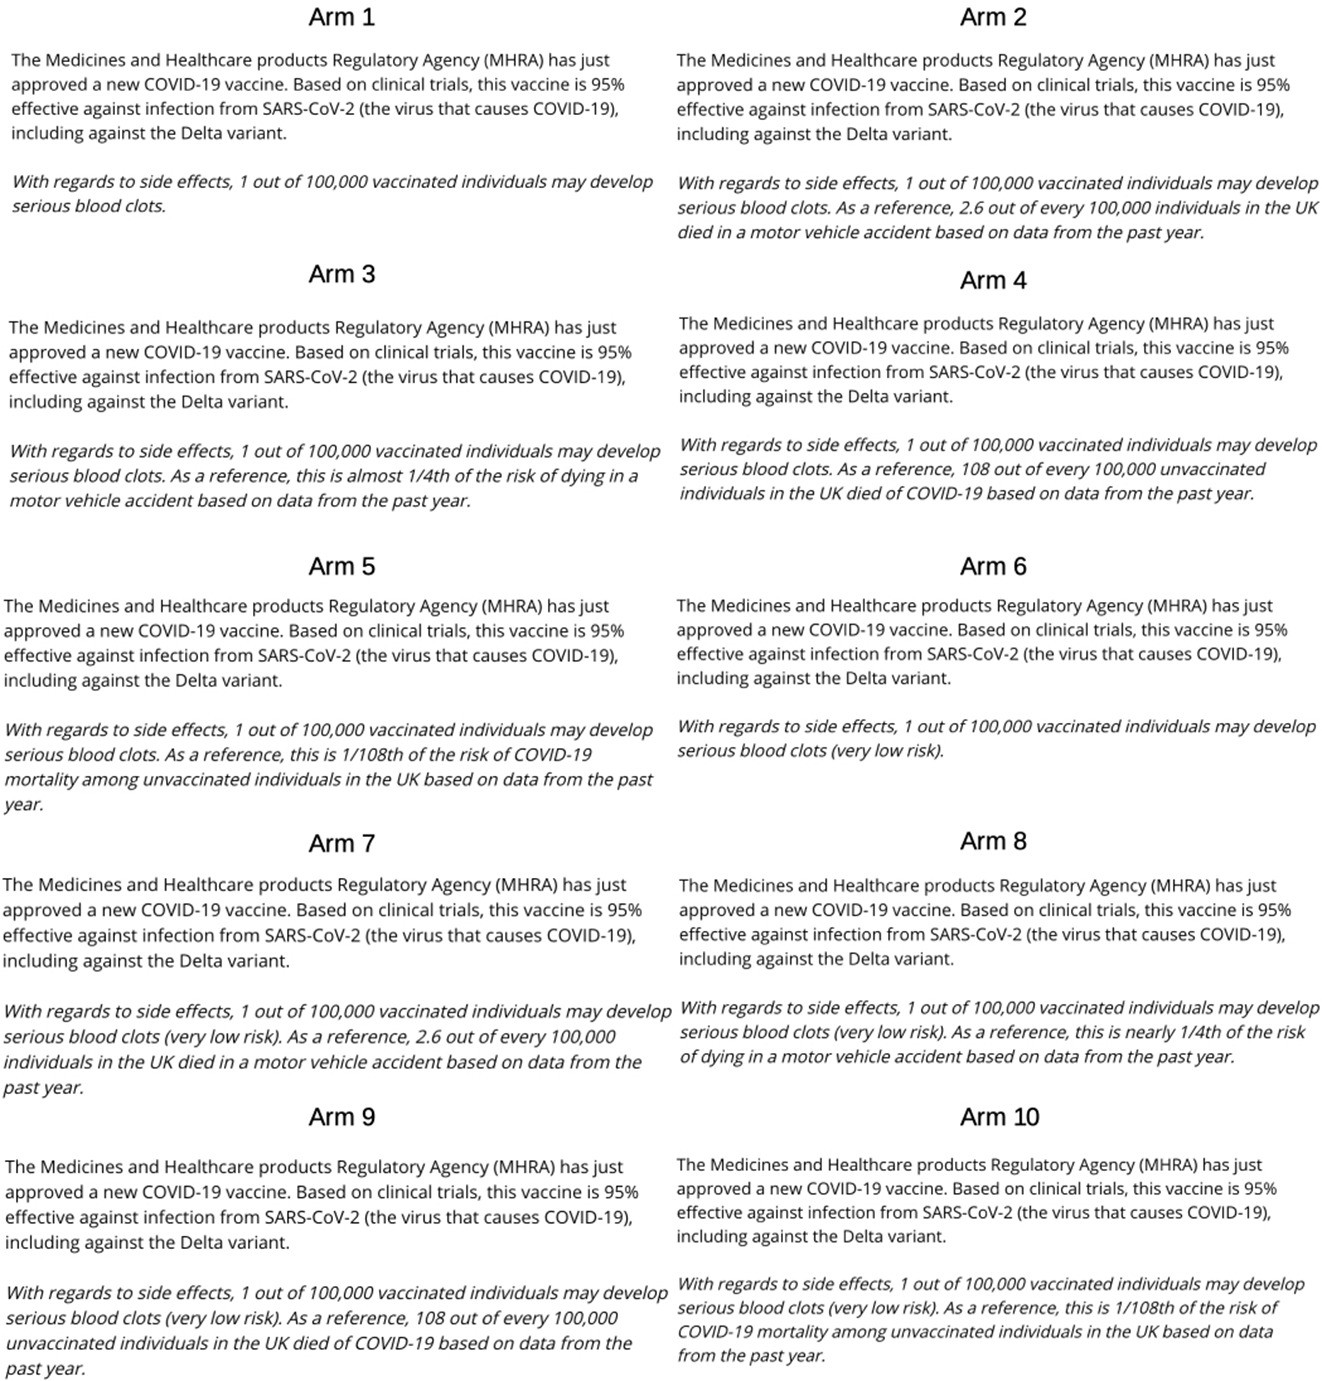
Screenshots of each experimental arm for UK participants.
Note that we have labeled the arms for the figure, but participants were not shown this label. Reference mortality information for motor-vehicle fatalities were taken from the Department of Transportation (Department for Transport, 2020) and COVID-19 from the Public Health England (Public Health England, 2022).
Tables
Table 1
Demographic composition of the study samples.
| United States(N=4502) | United Kingdom(N=4496) | |
|---|---|---|
| Gender | ||
| Male | 2,216 (49.2%) | 2,236 (49.7%) |
| Female | 2,205 (49.0%) | 2,216 (49.3%) |
| Other | 81 (1.8%) | 44 (1.0%) |
| Age | ||
| 18–30 | 3,090 (68.6%) | 1,859 (41.4%) |
| 30–45 | 1,077 (23.9%) | 1,531 (34.0%) |
| 45–60 | 268 (6.0%) | 776 (17.3%) |
| 60+ | 67 (1.5%) | 330 (7.3%) |
| Education | ||
| Less than secondary education | 142 (3.1%) | 498 (11.1%) |
| Completed secondary education | 987 (21.9%) | 1217 (27.1%) |
| Some college | 1786 (39.7%) | 1014 (22.5%) |
| Bachelor’s degree | 1061 (23.6%) | 1182 (26.3%) |
| More than bachelor’s degree | 526 (11.7) | 585 (13.0%) |
| Race* | ||
| White | 3607 (80.1%) | 3813 (84.8%) |
| Black/African | 357 (7.9%) | 139 (3.1%) |
| Asian | 441 (9.8%) | 316 (7.0%) |
| Other | 329 (7.3%) | 190 (4.2%) |
| Hispanic | 538 (11.9%) | – |
-
Notes: *Participants were allowed to choose multiple options if they identified as a member of multiple races. We used the race/ethnic categories used by the US Census Bureau and the UK Office for National Statistics when asking individuals to report their race and/or ethnicity.
Table 2
Balance table of baseline participant characteristics between the no risk label and risk label treatment arms.
| No risk label (N=4496) | Risk label(N=4502) | p-Value | |||
|---|---|---|---|---|---|
| Female (n, %) | 2224 (49.5%) | 2197 (48.8%) | 0.542 | ||
| Age (mean years, SD) | 31.7 (12.6) | 31.6 (12.7) | 0.623 | ||
| Education (n, %) | 0.836 | ||||
| Less than secondary education | 320 (7.1%) | 319 (7.1%) | |||
| Completed secondary education | 1097 (24.4%) | 1107 (24.6%) | |||
| Some college | 1392 (31.0%) | 1409 (31.3%) | |||
| Bachelor’s degree | 1143 (25.4%) | 1100 (24.4%) | |||
| More than bachelor’s degree | 544 (12.1%) | 567 (12.6%) | |||
-
Notes: p-Values for gender and education correspond to a chi-squared test and a two-sided t-test for age.
Table 3
Balance table of baseline participant characteristics between the no comparison, comparison with motor-vehicle mortality, and comparison with COVID-19 mortality treatment arms.
| No comparison (N=3000) | Comparison with motor-vehicle mortality(N=3002) | Comparison with COVID-19 mortality(N=2996) | p-Value | |
|---|---|---|---|---|
| Female (n, %) | 1478 (49.3%) | 1452 (48.4%) | 1491 (49.8%) | 0.547 |
| Age (mean years, SD) | 31.8 (12.8) | 31.4 (12.5) | 31.6 (12.7) | 0.516 |
| Education (n, %) | 0.873 | |||
| Less than secondary education | 210 (7.0%) | 202 (6.7%) | 227 (7.6%) | |
| Completed secondary education | 717 (24.0%) | 744 (24.8%) | 743 (24.8%) | |
| Some college | 931 (31.0%) | 933 (31.1%) | 937 (31.2%) | |
| Bachelor’s degree | 769 (25.6%) | 753 (25.1%) | 721 (24.1%) | |
| More than bachelor’s degree | 373 (12.4%) | 370 (12.3%) | 368 (12.3%) |
-
Notes: p-Values for gender and education correspond to a chi-square test and an ANOVA-test for age.
Table 4
Balance table of baseline participant characteristics between the absolute risk and relative risk treatment arms.
| Absolute risk (N=2997) | Relative risk(N=3001) | p-Value | |
|---|---|---|---|
| Female (n, %) | 1473 (49.1%) | 1470 (49.0%) | 0.918 |
| Age (mean years, SD) | 31.4 (12.4) | 31.6 (12.8) | 0.543 |
| Education (n, %) | 0.897 | ||
| Less than secondary education | 222 (7.4%) | 207 (6.9%) | |
| Completed secondary education | 737 (24.6%) | 750 (25.0%) | |
| Some college | 934 (31.2%) | 936 (31.2%) | |
| Bachelor’s degree | 743 (24.8%) | 731 (24.3%) | |
| More than bachelor’s degree | 361 (12.0%) | 377 (12.6%) |
-
Notes: p-Values for gender and education correspond to a chi-square test and a two-sided t-test for age.
Table 5
Independent and combined effects of risk labeling and motor-vehicle mortality comparisons on willingness to take a hypothetical COVID-19 vaccine.
| Effect size(percentage points) | p-Value | |
|---|---|---|
| Effect of risk labeling (ref: no risk label) N=8998 | 3.0 | 0.003 |
| Effect of motor-vehicle comparison (ref: no comparison) N=8998 | 2.4 | 0.049 |
| Effect of both risk labeling and a motor-vehicle comparison (ref: no risk label nor comparison) N=3002 | 6.1 | <0.001 |
-
Notes: Outcome: ‘Would you take this vaccine?’ (yes = 1, others = 0). All the results are from logistic regression models with the results presented as average marginal effects. As per our pre-analysis plan, all regressions include covariates for age, sex, education, and country. Sample sizes for the relative to absolute comparison and effect of both labeling and a motor-vehicle mortality comparison are smaller since they are only estimated among subset of the total sample. p-Values are from two-tailed t-tests.
Appendix 1—table 1
Robustness of main paper results to alternative regression types and the inclusion/exclusion of covariates.
| Logistic regression models with results presented as average marginal effects | Linear probability models | |||
|---|---|---|---|---|
| With covariates (main paper results) | Without covariates | With covariates | Without covariates | |
| Effect of labeled risk compared to unlabeled risk | 3.0 pp (p=0.003) | 3.0 pp (p=0.003) | 3.0 pp (p=0.003) | 3.0 pp (p=0.003) |
| Effect of comparison to motor-vehicle mortality compared to no comparison | 2.4 pp (p=0.049) | 2.4 pp (p=0.051) | 2.4 pp (p=0.0498) | 2.4 pp (p=0.052) |
| Effect of comparison to COVID-19 mortality compared to no comparison | 0.8 pp (p=0.496) | 0.7 pp (p=0.568) | 0.8 pp (p=0.497) | 0.7 pp (p=0.571) |
| Effect of relative comparison compared to absolute comparison | 1.3 pp (p=0.285) | 1.3 pp (p=0.277) | 1.3 pp (p=0.286) | 1.3 pp (p=0.277) |
| Effect of both risk labeling and a motor-vehicle comparison compared to no labeling or comparison | 6.1 pp (p<0.001) | 6.1 pp (p<0.001) | 6.1 pp (p<0.001) | 6.1 pp (p<0.001) |
-
Notes: Outcome: ‘Would you take this vaccine?’ (yes = 1, others = 0). As per our pre-analysis plan, covariates include age, sex, education, and country. Sample sizes for the relative to absolute comparison (N=5998) and effect of both labeling and a motor-vehicle mortality comparison (N=3002) are smaller since they are only estimated among subset of the total sample.
Appendix 1—table 2
Main paper results estimated using ordinal logistic regression models with a four-category outcome specification rather than logistic regression models with a binary outcome.
| Odds ratio (p-value) | |
|---|---|
| Effect of labeled risk compared to unlabeled risk | 1.15 (p=0.002) |
| Effect of comparison to motor-vehicle mortality compared to no comparison | 1.11 (p=0.050) |
| Effect of comparison to COVID-19 mortality compared to no comparison | 1.03 (p=0.541) |
| Effect of relative comparison compared to absolute comparison | 1.05 (p=0.327) |
| Effect of both risk labeling and a motor-vehicle comparison compared to no labeling or comparison | 1.31 (p<0.001) |
-
Note. Outcome: ‘Would you take this vaccine?’ (No, Unsure – leaning towards no, Unsure – leaning towards yes, Yes). As per the main paper results and pre-analysis plan, all regressions include controls for age, sex, country, and education. Sample sizes for the relative to absolute comparison (N=5998) and effect of both labeling and a motor-vehicle mortality comparison (N=3002) are smaller since they are only estimated among subset of the total sample.
Additional files
Download links
A two-part list of links to download the article, or parts of the article, in various formats.
Downloads (link to download the article as PDF)
Open citations (links to open the citations from this article in various online reference manager services)
Cite this article (links to download the citations from this article in formats compatible with various reference manager tools)
Effects of side-effect risk framing strategies on COVID-19 vaccine intentions: a randomized controlled trial
eLife 11:e78765.
https://doi.org/10.7554/eLife.78765


