Molecular characteristics and laminar distribution of prefrontal neurons projecting to the mesolimbic system
- Research Centre for Natural Sciences, Hungary
- Institute of Experimental Medicine, Hungary
- Doctoral School of Psychology/Cognitive Science, Budapest University of Technology and Economics, Hungary
- Department of Anatomy and Histology, University of Veterinary Medicine, Hungary
Figures
Figure 1 with 1 supplement
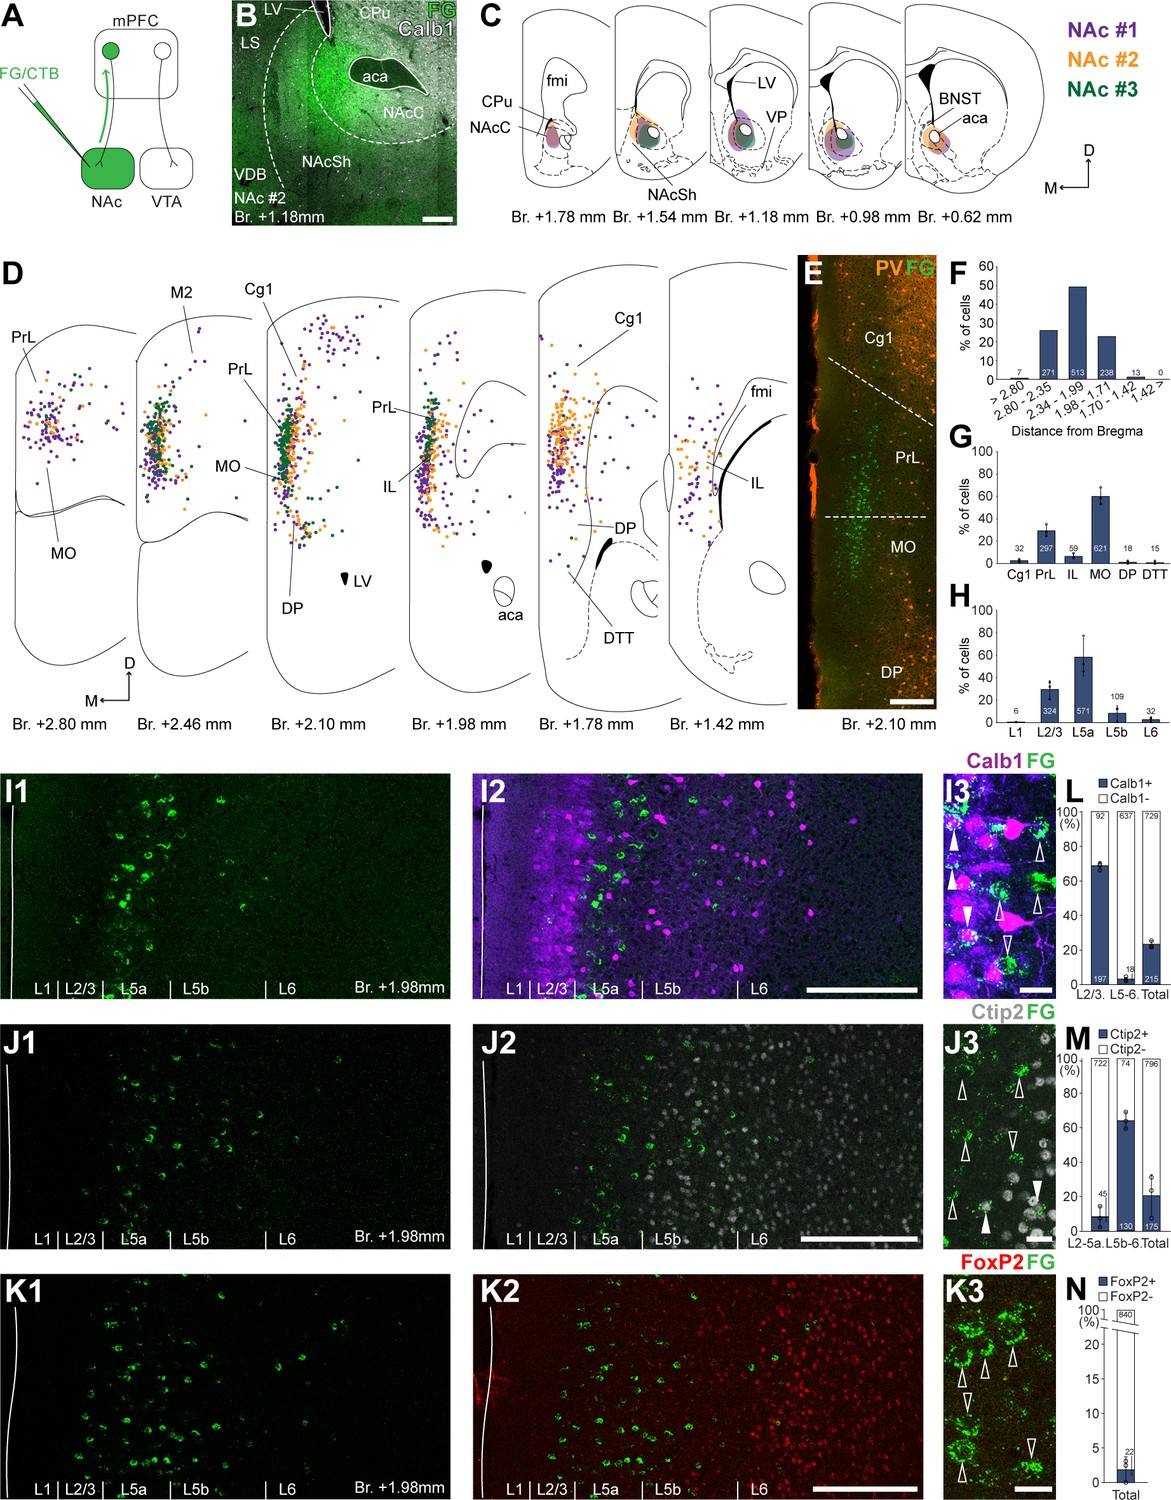
Nucleus accumbens (NAc) is innervated by L2/3 and L5 medial prefrontal cortical (mPFC) cells.
(A) Experimental design. (B) A representative retrograde tracer (Fluoro-Gold [FG], green) injection site in the NAc. (C) Extent of injection sites in the NAc of three animals. Each case is represented with different color. (D) Plotted distribution of retrogradely labeled cells throughout the mPFC of the same animals as in C (same colors represent same animals). Each dot represents one labeled mPFCNAc cell. (E) Distribution of labeled mPFCNAc neurons in relation to parvalbumin (PV) (orange) immunofluorescent labeling outlining the PrL cortex (Figure 1—figure supplement 1). (F) Pooled anteroposterior distribution of mPFCNAc neurons for three animals. (G) Distribution of mPFCNAc cells in individual mPFC subregions. (H) Laminar distribution of mPFCNAc neurons in the mPFC. (I–K) Confocal images showing the distribution of FG-labeled cells (green) in the PrL at Br. + 1.98 mm (I1–K1) with the counterstaining of Calb1 (purple, I2), Ctip2 (gray scale, J2), and FoxP2 (red, K2) (Figure 1—figure supplement 1). Note that most labeled cells are localized in the L2/3 (Calb1) and L5a (Ctip2). (I3–K3) High-magnification confocal images showing the coexpression of FG and Calb1 (I3), Ctip2 (J3), or FoxP2 (K3). White arrowheads indicate colabeling, empty arrowheads indicate the lack of marker expression. (L–N) Bar graphs showing the proportion of Calb1- (L), Ctip2- (N), and FoxP2-expressing (M) mPFCNAc cells. All data are shown as mean ± standard deviation (SD), n = 3 mice. Numbers in the bars represent cell counts and circles represent individual animal data. For detailed quantitative data see Tables 1 and 2. Scale bars: (B, E, I1–K1, I2–K2) 200 µm; (I3–K3) 20 µm. aca, anterior commissure, anterior part; BNST, bed nucleus of the stria terminalis; CPu, caudate putamen; fmi, forceps minor of the corpus callosum; LS, lateral septum; LV, lateral ventricle; VDB, nucleus of the vertical limb of the diagonal band; VP, ventral pallidum.
Figure 1—figure supplement 1
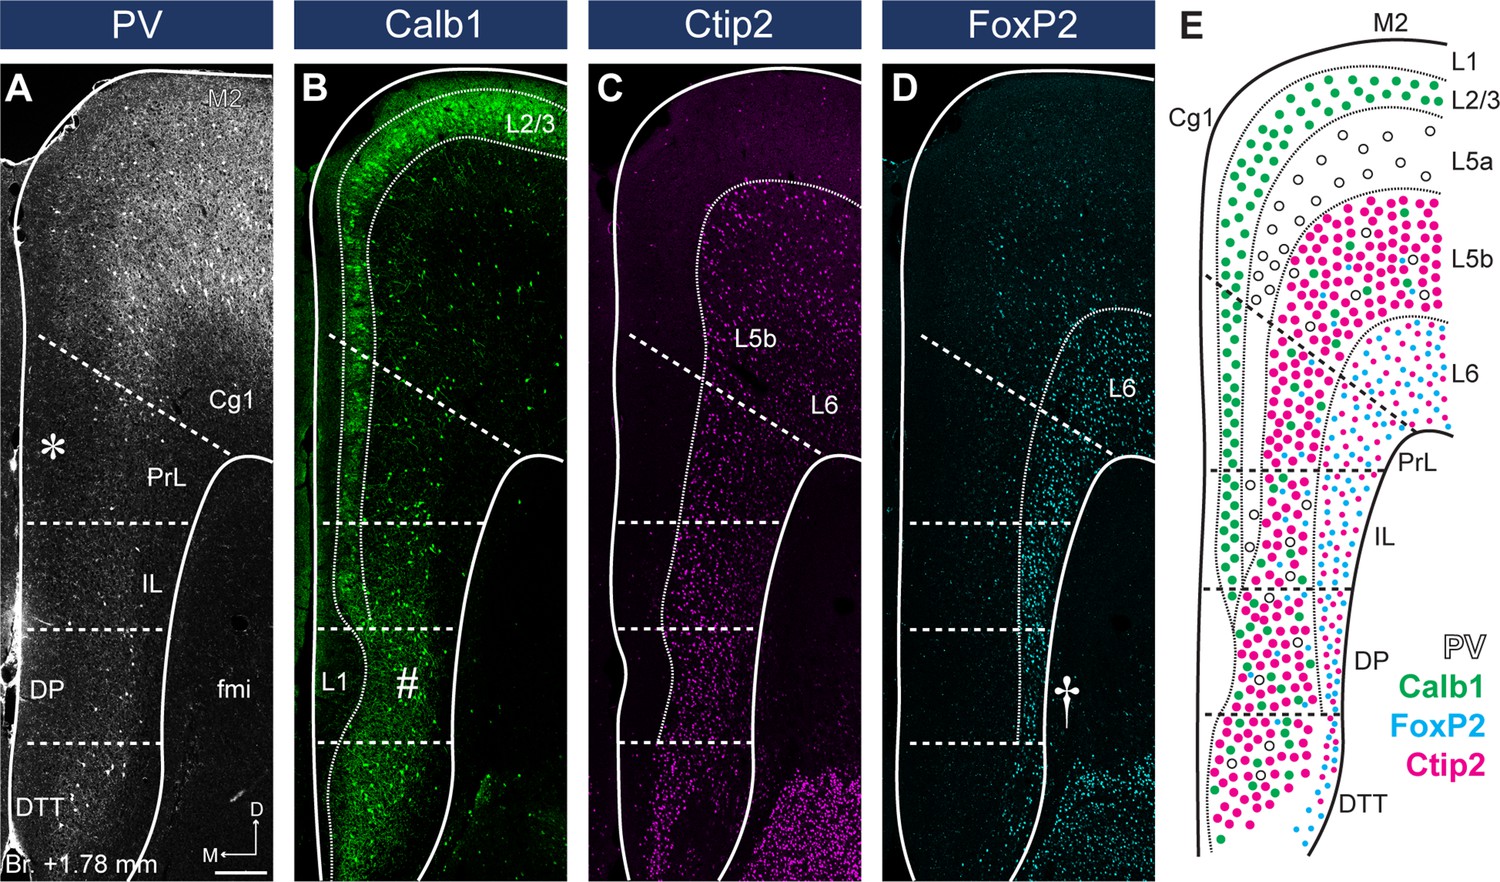
Parvalbumin (PV), Calb1, Ctip2, and FoxP2 staining define medial prefrontal cortical (mPFC) subregion borders and layers.
(A) The lack of PV + axonal and cellular immunolabeling (gray scale) in the L2/3 defines the territory of PrL (asterisk). (B) Calb1-expressing L2/3 (green) is clearly visible in most parts of the mPFC. A thickened L1 and a more compact L2/3 and L5 identify the deep peduncular cortex (DP) (number sign). (C) Ctip2 (magenta) is expressed in the L5b (bigger neurons) and L6 (smaller neurons). (D) FoxP2 (cyan) is expressed throughout the L6 of the mPFC. Narrowed L6 and the lack of FoxP2-expressing cells (cyan) in the L5 reveal DP (cross). (E) Schematic summary of PV, Calb1, FoxP2, and Ctip2 distribution in the mPFC. Scale bar: 200 µm.
Figure 2
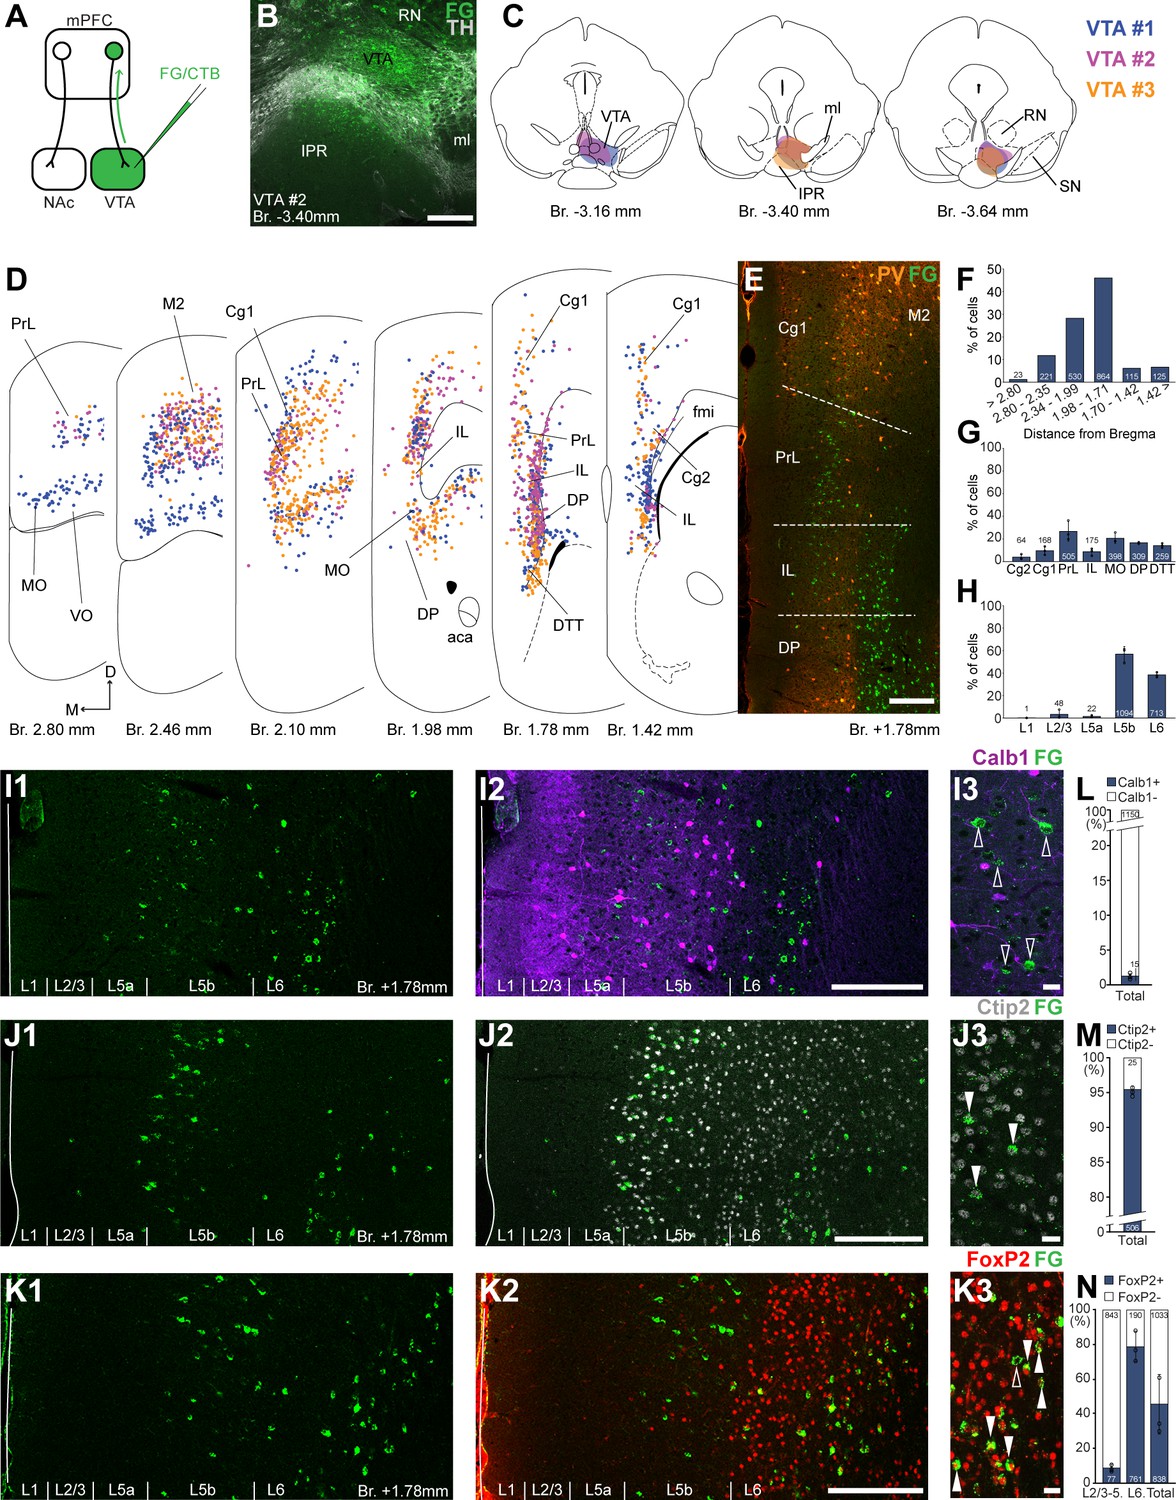
Ventral tegmental area (VTA) is innervated by two medial prefrontal cortical (mPFC) cell clusters.
(A) Experimental design. (B) A representative retrograde tracer (Fluoro-Gold [FG], green) injection site in the VTA. (C) Full extent of the injection sites in the VTA in three animals. Each case is represented with different color. (D) Plotted distribution of retrogradely labeled neurons throughout the mPFC of the same animals as in (C) (same colors represent same animals). Each dot represents one labeled mPFCVTA cell. (E) Distribution of labeled neurons in the mPFC in relation to parvalbumin (PV) (orange) immunofluorescent labeling outlining the PrL cortex. (F) Pooled anteroposterior distribution of mPFCVTA neurons for three animals. (G) Distribution of mPFCVTA cells in individual mPFC subregions. (H) Laminar distribution of mPFCVTA neurons in the mPFC. (I–K) Confocal images showing the layer-specific distribution of FG-labeled cells (green) in the PrL (I1–K1) with counterstaining of Calb1 (purple, I2), Ctip2 (gray scale, J2), and FoxP2 (red, K2). Note that the labeled cells are almost exclusively localized in the L5b (Ctip2) and L6 (Ctip2 + FoxP2) layers. (I3–K3) High-magnification confocal images showing the coexpression of FG and Calb1 (I3), Ctip2 (J3), or FoxP2 (K3). White arrowheads indicate colabeling, empty arrowheads indicate the lack of marker expression. Bar graphs showing the proportion of Calb1- (L), Ctip2- (M), and FoxP2-expressing (N) mPFCVTA cells. All data are shown as mean ± standard deviation (SD), n = 3 mice. Numbers in the bars represent cell counts and circles represent individual animal data. For detailed quantitative data see Tables 1 and 3. Scale bars: (B, E, I1–K1, I2–K2) 200 µm; (I3–K3) 20 µm. aca, anterior commissure, anterior part; fmi, forceps minor of the corpus callosum; IPR, interpeduncular nucleus, rostral subnucleus; ml, medial lemniscus; RN, red nucleus; SN, substantia nigra; VO, ventral orbital cortex.
Figure 3 with 2 supplements
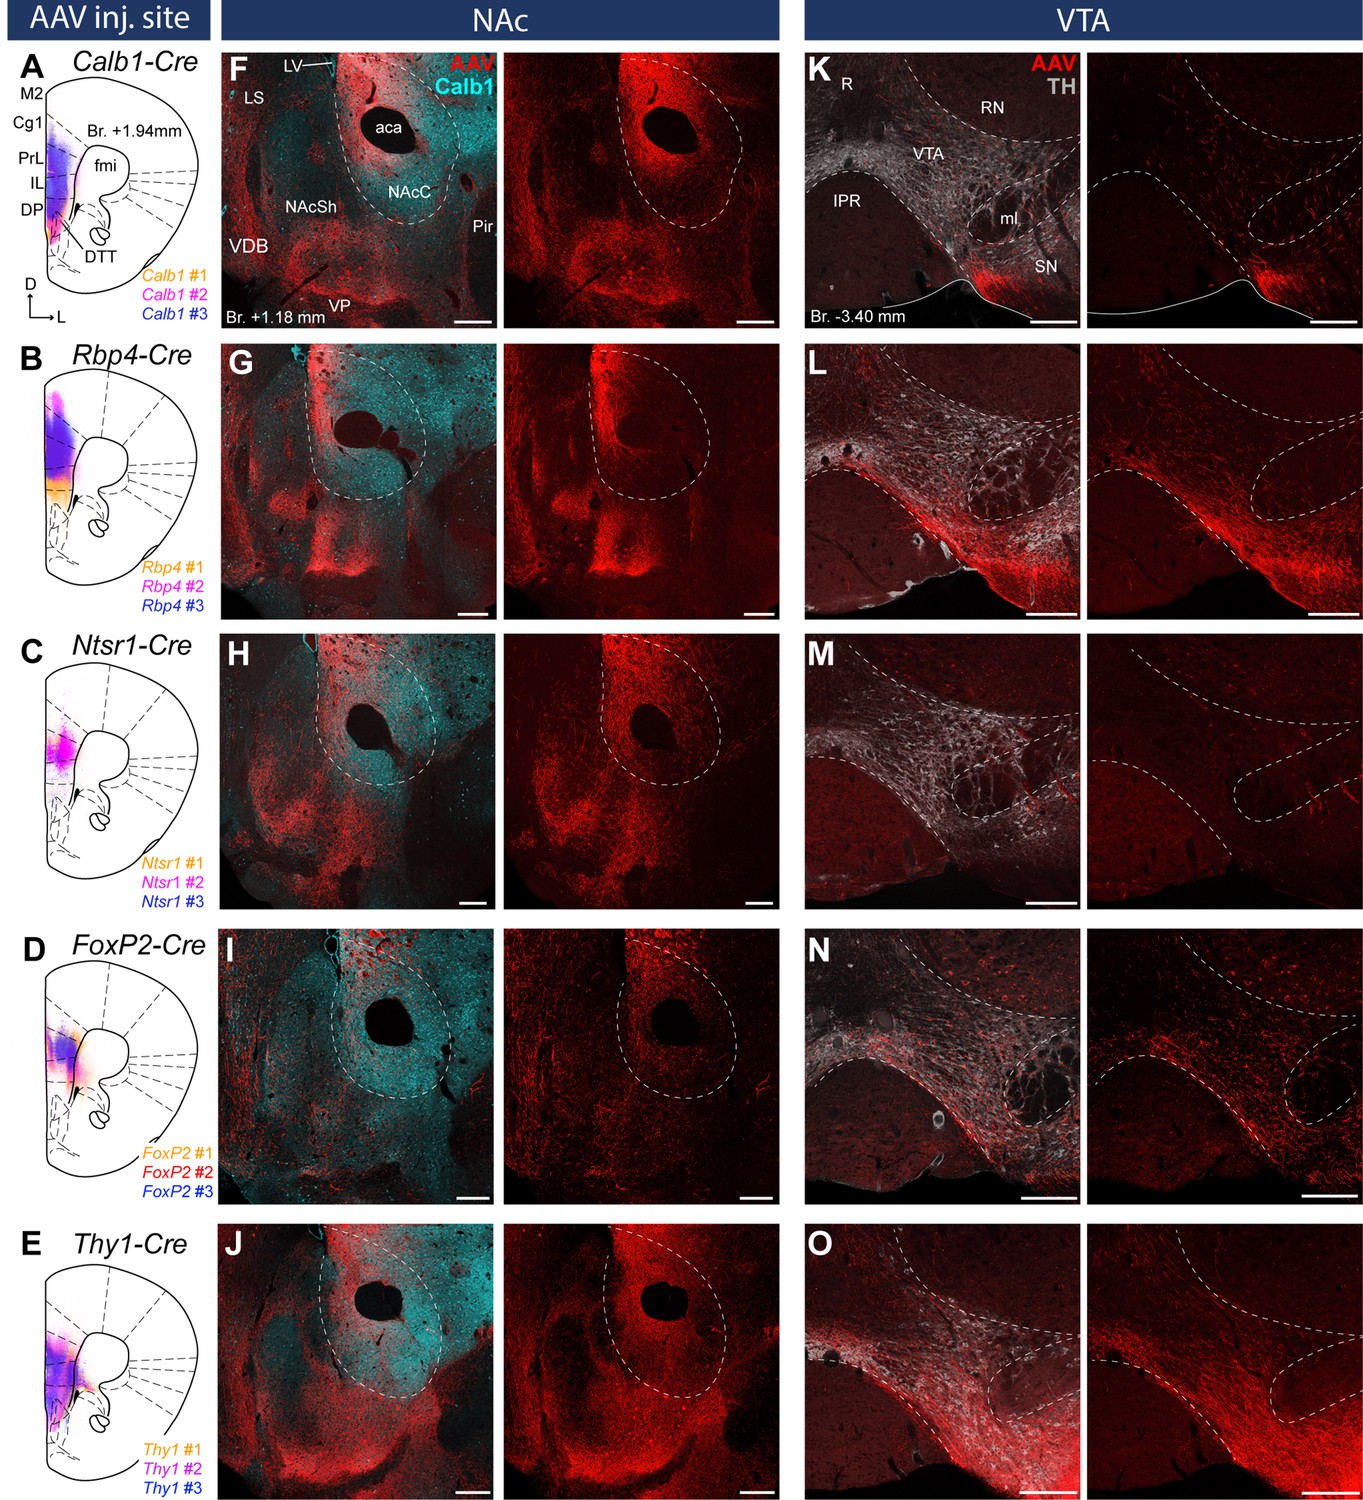
Distinct nucleus accumbens (NAc) and ventral tegmental area (VTA) innervation by genetically identified medial prefrontal cortical (mPFC) cell populations.
Delineation of AAV-DIO-mCherry/eYFP injection sites in the mPFC of the Calb1- (A), Rbp4- (B) Ntsr1- (C) FoxP2- (D), and Thy1-Cre (E) strains (n = 3 mice in each strain). Viral labeling was always analyzed after immunohistochemical enhancement (Figure 3—figure supplement 1). For higher magnification distribution of labeled cells in the mPFC and M1 see Figure 3—figure supplement 2. Confocal images showing virally labeled prefrontal axons (red) in the NAc of Calb1- (F), Rbp4- (G), Ntsr1- (H), FoxP2- (I) and Thy1-Cre (J) mouse strains. Calb1 (cyan) immunofluorescent staining was used to identify the NAc. (K–O) Distribution of labeled axons (red) from the same animals, respectively, in the VTA defined with TH staining (gray scale). Scale bars: 200 µm. aca, anterior commissure, anterior part; fmi, forceps minor of the corpus callosum; IPR, interpeduncular nucleus, rostral subnucleus; LS, lateral septum; LV, lateral ventricle; ml, medial lemniscus; Pir, piriform cortex; R, raphe; RN, red nucleus; SN, substantia nigra; VDB, nucleus of the vertical limb of the diagonal band; VP, ventral pallidum.
Figure 3—figure supplement 1
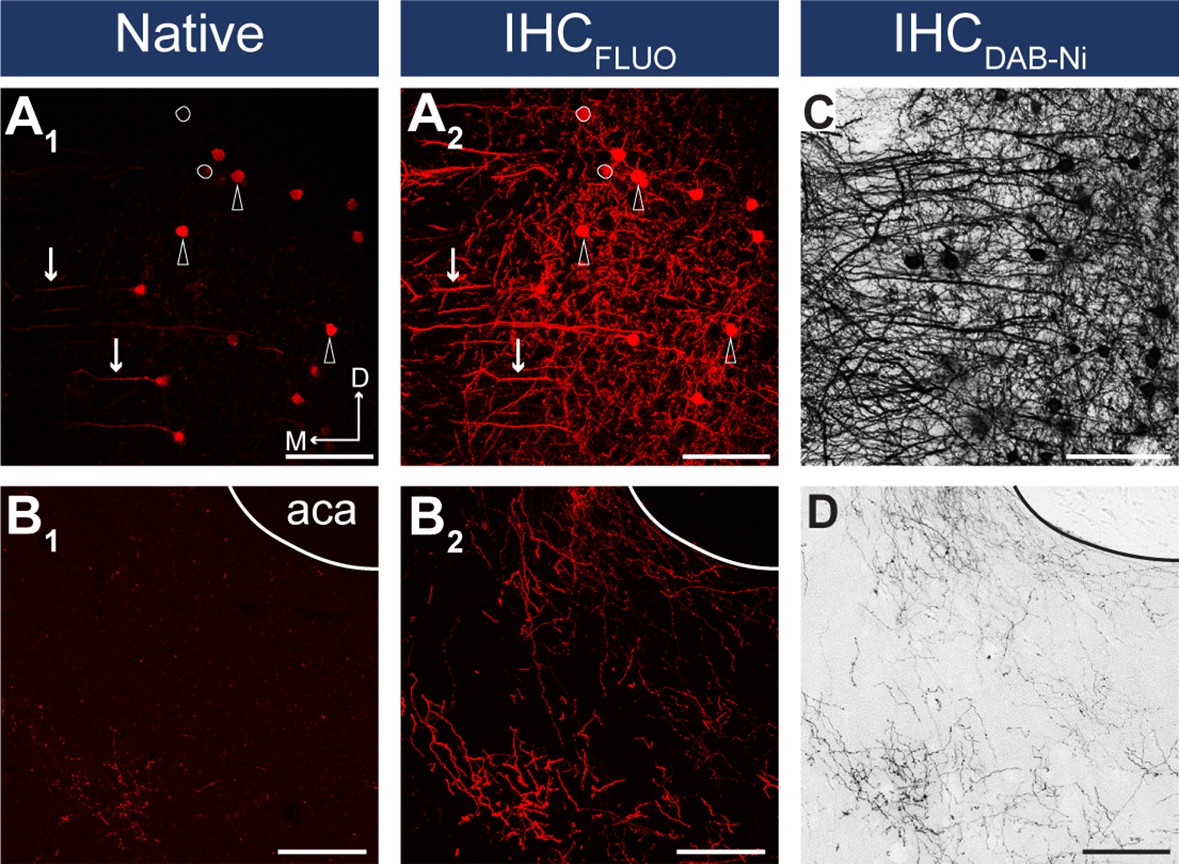
IHC enhancement is necessary for reliable detection of viral fluorescent signal.
(A–B) Confocal images showing the native mCherry signals in the somatodendritic (A1) and axonal compartments (B1) and after IHCFluo signal enhancement (A2, B2) of the same slice taken from the medial prefrontal cortex (mPFC) (A) (injection site) and from the nucleus accumbens (NAc) (B). Arrows indicate dendrites, arrowheads indicate neurons visible in both the native and IHCFluo-enhanced sample. White circles indicate neurons not visible in the native sample. (C, D) Brightfield images showing IHCDAB-Ni-enhanced samples taken from a neighboring slice. Scale bars: 100 µm. aca, anterior commissure, anterior part.
Figure 3—figure supplement 2
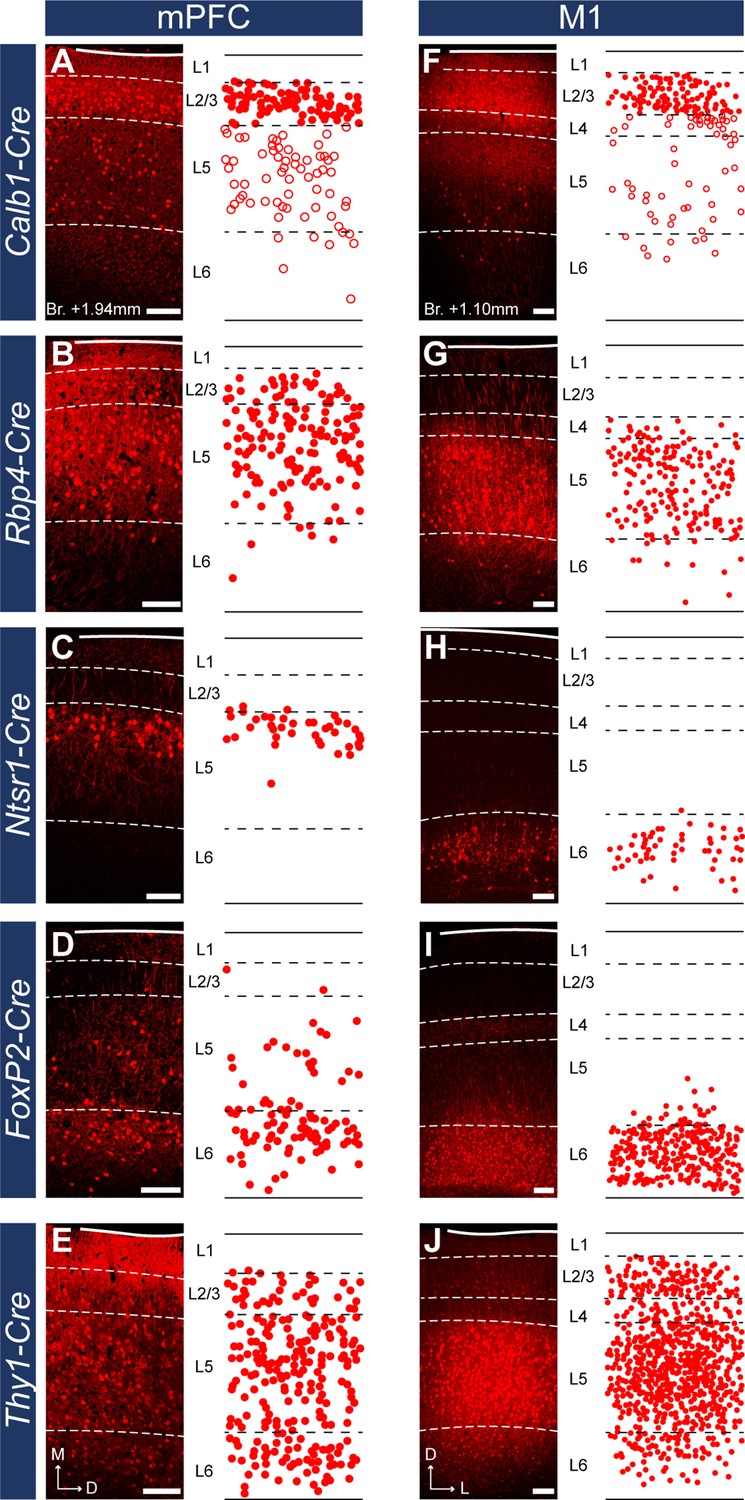
Layer-specific Cre mouse lines reveal different laminal distribution of medial prefrontal cortical (mPFC) and primary motor cortical cells.
(A–E) Confocal images (left) and plots (right) showing the adeno-associated viral vector (AAV)-labeled cells in the mPFC in the same animals as in Figure 3, respectively. (F–J) Localization of labeled neurons in the M1 cortex in the same mouse strains. Note the different distribution of Rbp4- (B, G), Ntsr1- (C, H), and FoxP2-expressing (D, I) cells in the two cortical regions. Dashed lines indicate layer borders defined with IHCFluo against Calb1, Ctip2, or FoxP2 (Figure 1—figure supplement 1). Open circles in A, F represent putative GABAergic interneurons. Scale bars: 200 µm.
Figure 4
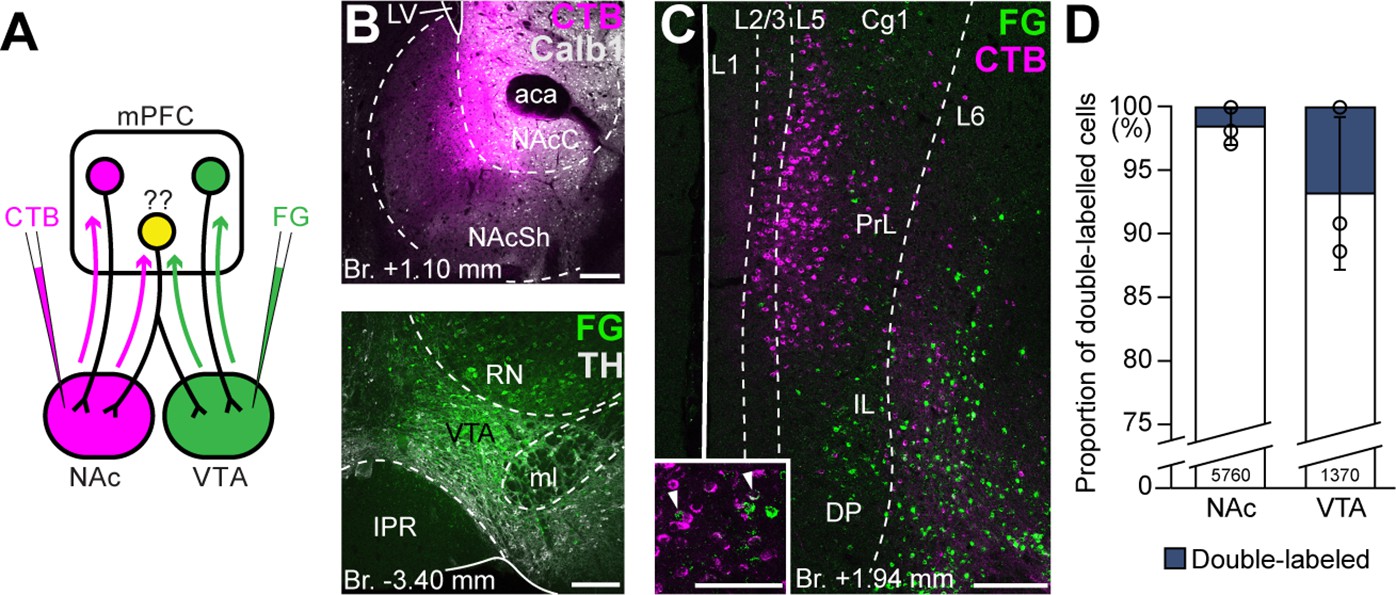
Ventral tegmental area (VTA) and nucleus accumbens (NAc) are mostly innervated by nonoverlapping medial prefrontal cortical (mPFC) cell populations.
(A) Experimental design of double retrograde tracing experiments. (B) Representative CTB (magenta) injection site in the NAc (top) and Fluoro-Gold (FG) (green) in the VTA (bottom). (C) High-magnification confocal image showing the distribution of mPFCNAc (magenta) and mPFCVTA cells (green) in the mPFC. Inset shows higher magnification of the same slice with arrowheads representing double-labeled cells. (D) Only a small proportion of labeled mPFC cells innervated both VTA and NAc. All data are shown as mean ± standard deviation (SD), n = 3 mice. Exact cell counts are written in the bars. For detailed quantitative data see Table 4. Scale bars: 200 µm, (C) inset: 100 µm. aca, anterior commissure, anterior part; IPR, interpeduncular nucleus, rostral subnucleus; LV, lateral ventricle; ml, medial lemniscus; RN, red nucleus.
Figure 5
Nucleus accumbens (NAc) or ventral tegmental area (VTA) preference of medial prefrontal cortical (mPFC) cells.
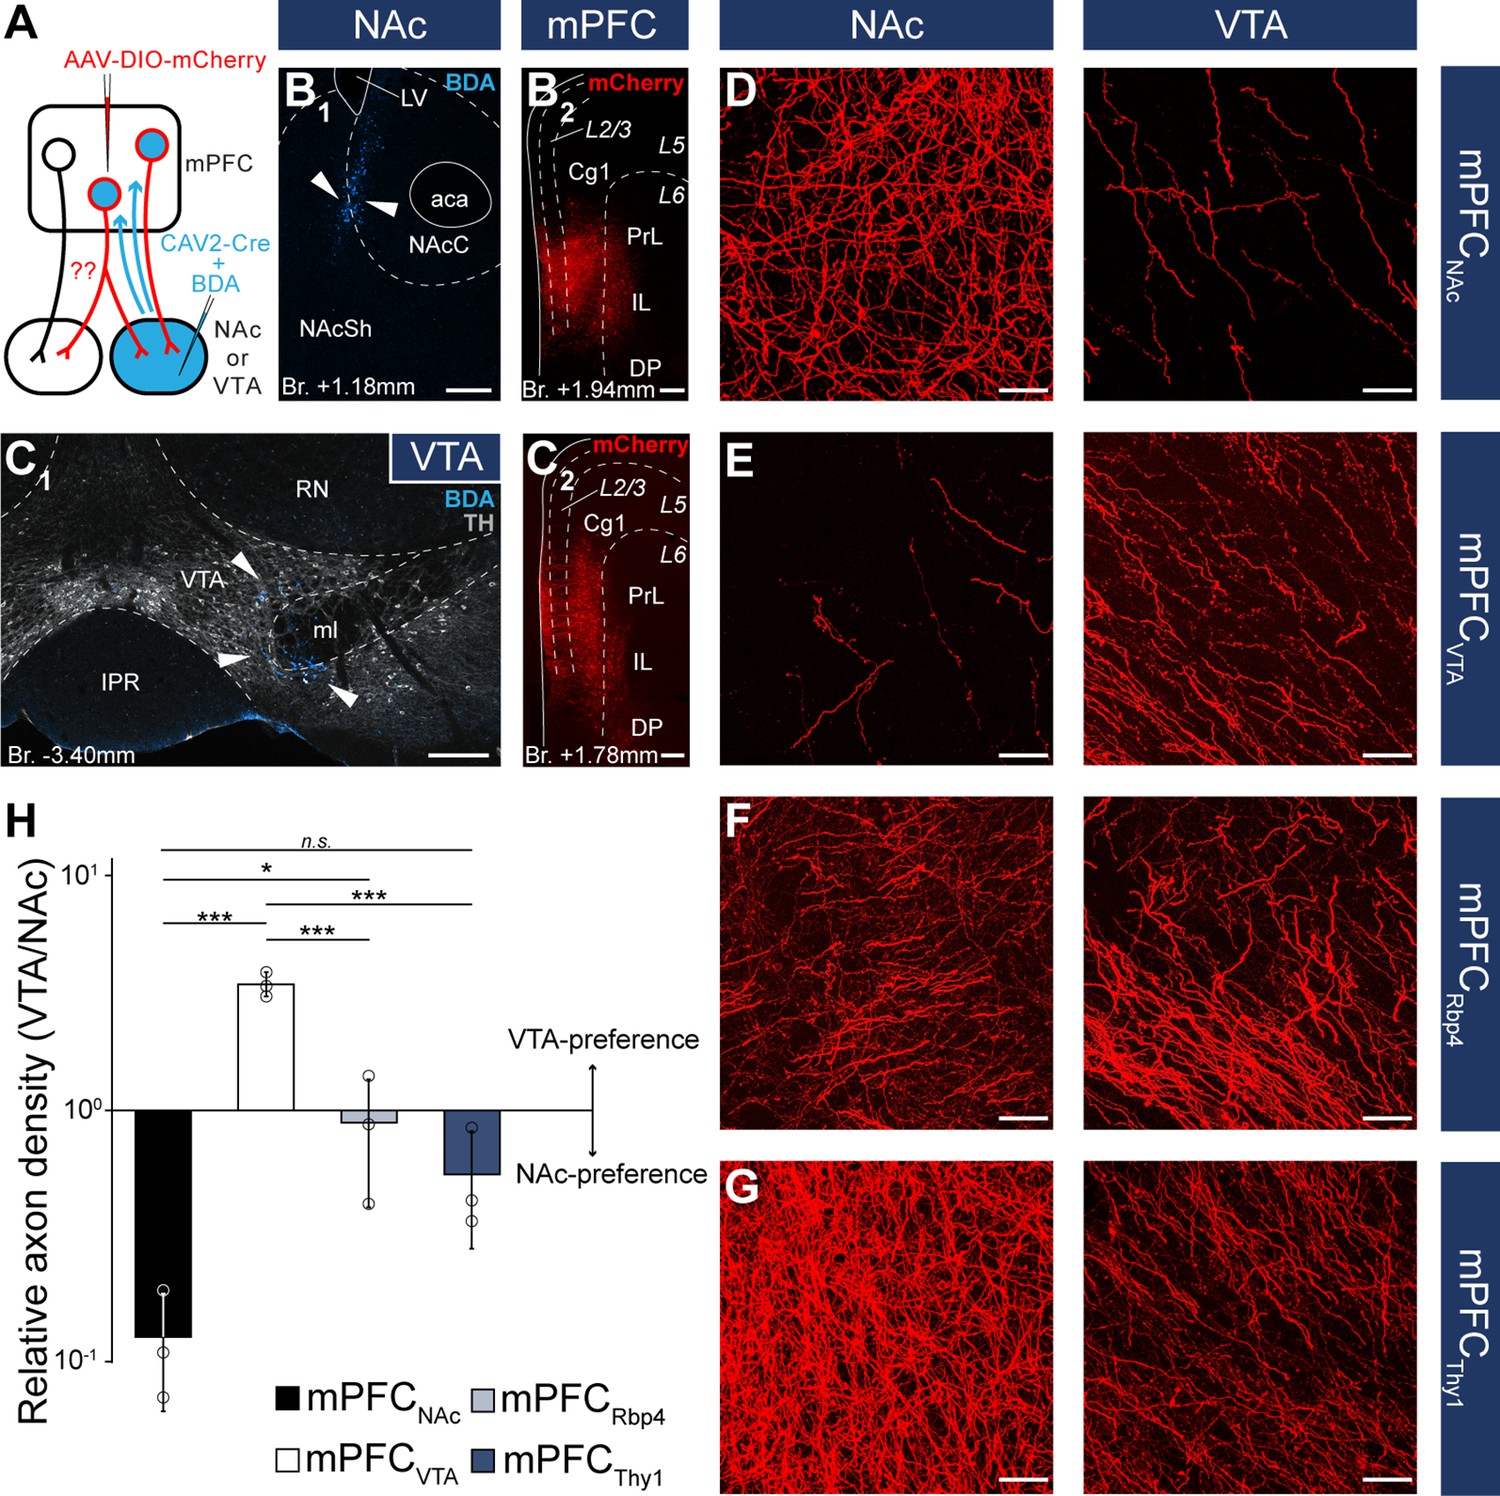
(A) Experimental design of CAV2-Cre-mediated viral tracing experiments. BDA was used to visualize the exact location of injection sites. (B) Representative CAV2-Cre + 5% BDA (cyan) injection site (B1) in the NAc and AAV-DIO-mCherry (red) injection site (B2) in the mPFC of the same animal. (C) Representative CAV2-Cre + BDA (cyan) injection site (C1) in the VTA counterstained with TH (grayscale) and AAV-DIO-mCherry (red) injection site (C2) in the mPFC of the same animal. (D–G) High-magnification confocal images showing the distribution of mCherry (red)-labeled axons in the NAc (left) and the VTA (right) in a mPFCNAc (D), mPFCVTA (E), mPFCRbp4 (F); same animal as in Figure 3C, H, M and Figure 3—figure supplement 1B and mPFCThy1 (G); same animal as in Figure 3F, K, P and Figure 3—figure supplement 1E animal. (H) Quantification of relative axon density (RAD) in the mPFCNAc, mPFCVTA, mPFCRbp4, and mPFCThy1 animals F(3, 8) = 55.56; p = 0.000011; mPFCNAc vs. mPFCVTA, p = 0.0000026; mPFCNAc vs. mPFCRbp4, p = 0.028; mPFCNAc vs. mPFCThy1, p = 0.18; mPFCVTA vs. mPFCRbp4, p = 0.000018; mPFCVTA vs. mPFCThy1, p = 0.0000072; one-way analysis of variance (ANOVA), least significant difference (LSD) post hoc test; *p < 0.05; ***p < 0.001; n.s., not significant. All data are shown as mean ± standard deviation (SD), n = 3 mice in each group. For detailed quantitative data see Table 5 and Figure 5—source data 1. Scale bars: (B–C) 200 µm, (D–G) 20 µm. aca, anterior commissure, anterior part; BDA, biotinylated dextran amine; IPR, interpeduncular nucleus, rostral subnucleus; LV, lateral ventricle; ml, medial lemniscus; RN, red nucleus.
-
Figure 5—source data 1
Detailed quantitative data for axon density analysis.
- https://cdn.elifesciences.org/articles/78813/elife-78813-fig5-data1-v2.xlsx
Figure 6
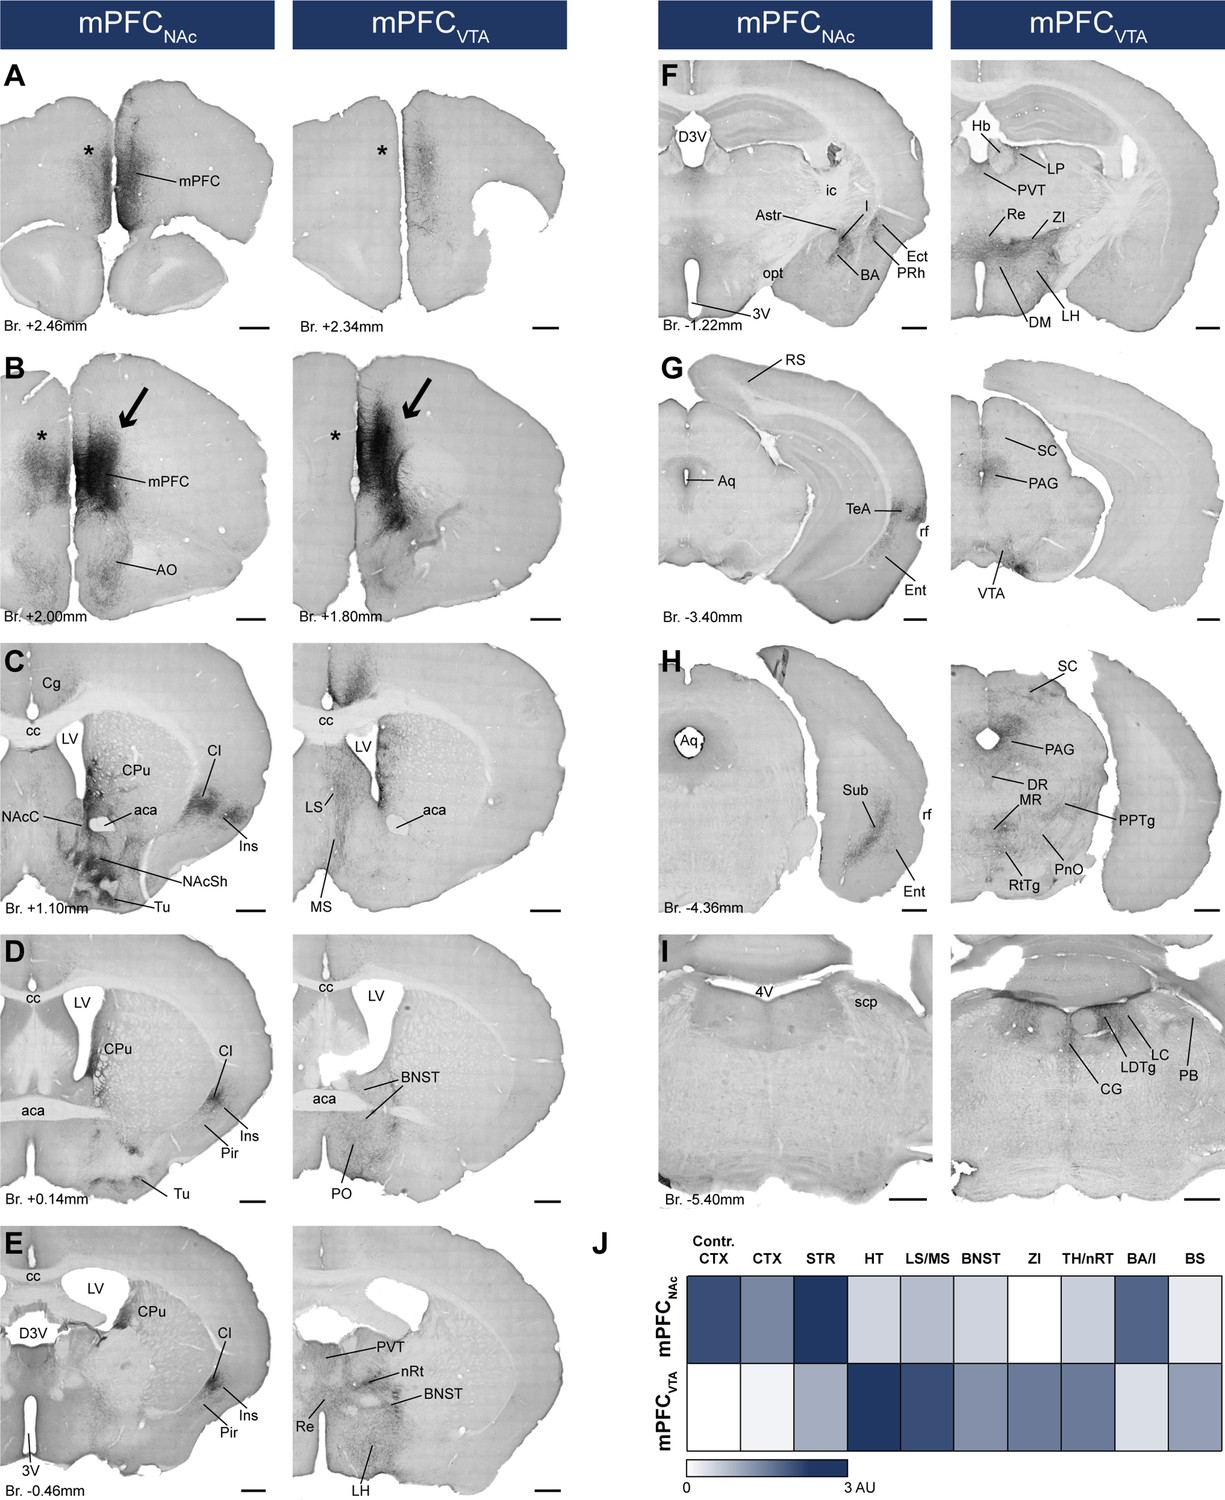
mPFCNAc and mPFCVTA neurons possess different efferent connections.
(A–I) Brightfield images showing the distribution of CAV2-Cre-mediated AAV-DIO-mCherry-labeled axons visualized with IHCDAB-Ni at different AP levels. Arrows indicate adeno-associated viral vector (AAV) injection sites in the medial prefrontal cortex (mPFC) (B). Note the clear difference between the mPFCNAc (left column) and mPFCVTA (right column) populations, most prominently in the striatum (C), different cortical areas (A–H), the hypothalamus (D–F), and the brainstem (F–I) – including the ventral tegmental area (VTA) (G). Note the almost complete lack of contralateral cortical projection in mPFCVTA animals as opposed to mPFCNAc animals (A, B, asterisks). For experimental design see Figure 6A. (J) Summary table showing the innervation intensities of mPFCNAc (top row) and mPFCVTA (bottom row) populations (n = 3–3 mice) in different brain regions. Darker color indicates stronger innervation. For details see Table 6. Scale bars: 500 µm. 3V, 3rd ventricle; 4V, 4th ventricle; aca, anterior commissure, anterior part; AO, anterior olfactory nucleus; Astr, amygdalostriatal transition area; Aq, aqueduct; BA, basolateral amygdaloid nucleus; BNST, bed nucleus of the stria terminalis; BS, brainstem; cc, corpus callosum; CG, central gray; CPu, caudate putamen; CTX, cortex; D3V, dorsal 3rd ventricle; DM, dorsomedial hypothalamic nucleus; DR, dorsal raphe; Ect, ectorhinal cortex; Ent, entorhinal cortex; Hb, habenula; I, intercalated amygdalar nuclei; ic, internal capsule; Ins, insular cortex; LH, lateral hypothalamus; LC, locus coeruleus; LDTg, laterodorsal tegmental nucleus; LP, lateral posterior thalamic nucleus; LS, lateral septum; LV, lateral ventricle; MR, medial raphe; MS, medial septum; nRT, reticular thalamic nucleus; PVT, paraventricular thalamic nucleus; VDB, nucleus of the vertical limb of the diagonal band; VP, ventral pallidum; opt, optic tract; PAG, periaqueductal gray; PB, parabrachial nucleus; Pir, piriform cortex; PnO, pontine reticular nucleus, oral part; PO, preoptic area; PPTg, pedunculopontine tegmental nucleus; PRh, perirhinal cortex; Re, reuniens thalamic nucleus; rf, rhinal fissure; RS, retrosplenial cortex; RtTg, reticulotegmental nucleus of the pons; SC, superior colliculus; scp, superior cerebellar peduncle; STR, striatum; Sub, subiculum; TeA, termporal association cortex; TH, thalamus; Tu, olfactory tubercule; ZI, zona incerta.
Figure 7
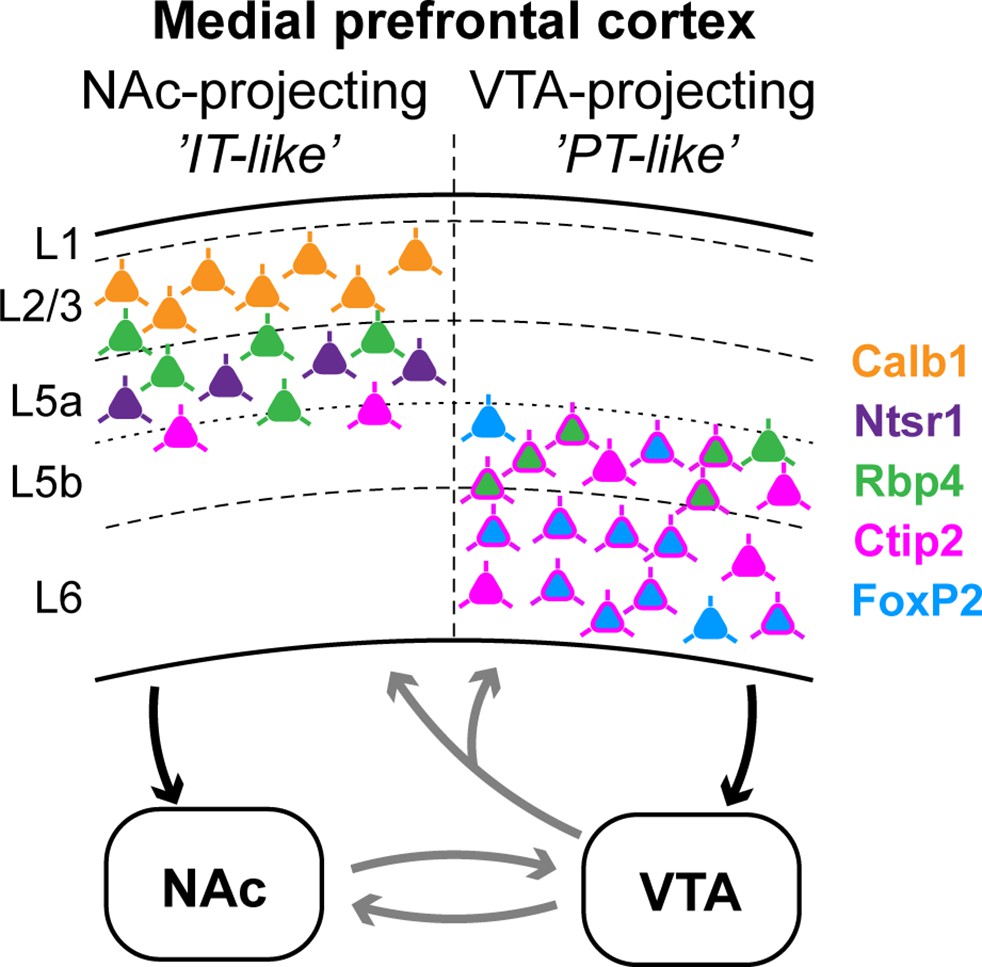
Summary: molecular characteristics and laminar distribution of the two identified projection groups in the medial prefrontal cortex (mPFC).
Neurons that innervate the nucleus accumbens (NAc) (‘IT-like’) are mostly localized in the upper layers of the mPFC (L2/3–5a) and express Calb1 (green), Ntsr1 (purple), Rbp4 (orange), and to a lesser extent, Ctip2 (magenta). mPFC cells that innervate the ventral tegmental area (VTA) (‘PT-like’) are mostly localized in the deeper layers (L5b–6) and express Ctip2, FoxP2 (cyan), and Rbp4. Connections between NAc and VTA, and ascending VTA pathways (gray arrows) are based on literature data (see Introduction, Discussion).
Tables
Table 1
Anteroposterior, subregional, and laminar distribution of mPFCNAc and mPFCVTA neurons (n = 3–3 mice).
| mPFCNAc | mPFCVTA | ||
|---|---|---|---|
| Anteroposterior distribution (Bregma level) | >2.80 mm | 7 0.67% | 23 1.22% |
| 2.80–2.35 mm | 271 26.01% | 221 11.77% | |
| 2.34–1.99 mm | 513 49.23% | 530 28.22% | |
| 1.98–1.71 mm | 238 22.84% | 864 46.01% | |
| 1.70–1.42 mm | 13 1.25% | 115 6.12% | |
| <1.42 mm | 0 0.00% | 125 6.66% | |
| Subregional distribution | Cg2 | 0, 0, 0 0 ± 0% | 26, 16, 22 3.88 ± 2.33% |
| Cg1 | 2, 26, 4 2.46 ± 1.38% | 53, 42, 73 9.57 ± 3.71% | |
| PrL | 49, 194, 54 29.31 ± 5.26% | 95, 257, 153 26.68 ± 8.63% | |
| IL | 10, 35, 14 6.40 ± 2.33% | 20, 67, 88 8.63 ± 3.25% | |
| MO | 135, 404, 82 59.99 ± 7.57% | 71, 128, 199 20.57 ± 4.46% | |
| DP | 2, 16, 0 1.11 ± 1.16% | 68, 111, 130 16.54 ± 0.75% | |
| DTT | 0, 15, 0 0.72 ± 1.26% | 64, 86, 109 14.12 ± 1.98% | |
| Laminar distribution | L1 | 1, 4, 1 0.58 ± 0.07% | 1, 0, 0 0.08 ± 0.15% |
| L2/3 | 71, 221, 32 29.55 ± 7.84% | 30, 9, 9 3.33±3.66 | |
| L5a | 92, 360, 119 58.64 ± 16.39% | 10, 7, 5 1.38 ± 1.00% | |
| L5b | 25, 83, 1 8.43 ± 6.75% | 194, 434, 466 56.82 ± 6.91% | |
| L6 | 9, 22, 1 2.79 ± 1.98% | 162, 257, 294 38.38 ± 2.25% | |
| Total cell count | 198, 690, 154 | 397, 707, 774 | |
-
Note that anteroposterior data have been pooled in both groups.
Table 2
Proportion of FoxP2-, Ctip2-, and Calb1-expressing neurons in the mPFCNAc population (n = 3 mice).
| mPFCNAc | |||
|---|---|---|---|
| Layers | Calb1 | ||
| # FG+ /animal | # Calb1+ /animal | % Calb1+ (AVG ± SD) | |
| L2/3 | 128, 101, 60 | 84, 71, 42 | 68.6 ± 2.6% |
| L5a-5b-6 | 287, 200, 168 | 7, 4, 7 | 2.9 ± 1.1% |
| Total | 415, 301, 228 | 91, 75, 49 | 22.8 ± 1.9% |
| Layers | Ctip2 | ||
| # FG+ /animal | # Ctip2+ /animal | % Ctip2+ (AVG ± SD) | |
| L2/3-5a | 62, 356, 349 | 9, 9, 27 | 8.26 ± 6.01% |
| L5b-6 | 37, 29, 138 | 22, 20, 88 | 64.1 ± 4.76% |
| Total | 99, 385, 487 | 31, 29, 115 | 20.8 ± 12.1% |
| Layers | FoxP2 | ||
| # FG+ /animal | # FoxP2+ /animal | % FoxP2+ (AVG ± SD) | |
| L2/3-5a-5b | 288, 357, 173 | 5, 10, 0 | 1.5 ± 1.4% |
| L6 | 20, 24, 0 | 4, 3, 0 | -* |
| Total | 308, 381, 173 | 9, 13, 0 | 2.1 ± 1.8% |
-
#, number of labeled cells.
-
Calb1, Ctip2, and FoxP2-immunostainings were used to define the cortical layers in mPFC.
-
*
When total cell count was <10, percentage was not calculated.
Table 3
Proportion of FoxP2-, Ctip2-, and Calb1-expressing neurons in the mPFCVTA population (n = 3 mice).
| mPFCVTA | |||
|---|---|---|---|
| Layers | Calb1 | ||
| # FG+ /animal | # Calb1+ /animal | % Calb1+ (AVG ± SD) | |
| L2/3 | 4, 2, 5 | 4, 2, 2 | -* |
| L5a-5b-6 | 371, 452, 331 | 3, 2, 2 | -* |
| Total | 375, 454, 336 | 7, 4, 4 | 1.3 ± 0.5% |
| Layers | Ctip2 | ||
| # FG+ /animal | # Ctip2+ /animal | % Ctip2+ (AVG ± SD) | |
| L2/3-5a | 1, 2, 1 | 1, 0, 0 | -* |
| L5b-6 | 152, 163, 187 | 144, 158, 178 | 95.6 ± 1.2% |
| Total | 153, 165, 188 | 145, 158, 178 | 95.1 ± 0.6% |
| Layers | FoxP2 | ||
| # FG+ /animal | # FoxP2+ /animal | % FoxP2+ (AVG ± SD) | |
| L2/3-5a-5b | 162, 347, 411 | 17, 22, 38 | 8.7 ± 2.1% |
| L6 | 393, 283, 275 | 347, 219, 195 | 78.9 ± 8.8% |
| Total | 555, 630, 686 | 364, 241, 233 | 45.9 ± 17.2% |
-
#, number of labeled cells.
-
Calb1, Ctip2, and FoxP2-immunostainings were used to define the cortical layers in mPFC.
-
*
When total cell count was <10, percentage was not calculated.
Table 4
Table 5
Quantification of axon length and density in the ventral tegmental area (VTA) and nucleus accumbens (NAc) in the mPFCNAc, mPFCVTA, mPFCRbp4, and mPFCThy1 animals (n = 3 mice in each group).
| NAc | VTA | NAc | VTA | ||||
|---|---|---|---|---|---|---|---|
| mPFCNAc | Axon length (mm) | 907.58 | 30.80 | PFCRbp4 | Axon length (mm) | 597.27 | 299.93 |
| 1385.42 | 24.23 | 617.26 | 353.48 | ||||
| 401.99 | 9.70 | 1323.86 | 99.42 | ||||
| Volume (mm3) | 0.0068 | 0.018 | Volume (mm3) | 0.0069 | 0.019 | ||
| 0.0060 | 0.020 | 0.0059 | 0.0089 | ||||
| 0.0028 | 0.019 | 0.0032 | 0.016 | ||||
| Density (mm/mm3) | 49,215.43 | 4539.63 | Density (mm/mm3) | 31,674.39 | 43,542.44 | ||
| 69,073.73 | 4042.84 | 69,696.59 | 60,044.90 | ||||
| 20,991.09 | 3519.42 | 80,501.53 | 31,307.55 | ||||
| Relative density* | 0.092 | Relative density* | 1.37 | ||||
| 0.059 | 0.86 | ||||||
| 0.17 | 0.39 | ||||||
| mPFCVTA | Axon length (mm) | 130.72 | 196.69 | mPFCThy1 | Axon length (mm) | 1708.58 | 517.52 |
| 129.94 | 161.77 | 2719.73 | 459.37 | ||||
| 46.42 | 63.91 | 2807.45 | 398.95 | ||||
| Volume (mm3) | 0.0067 | 0.017 | Volume (mm3) | 0.0058 | 0.016 | ||
| 0.0061 | 0.016 | 0.0068 | 0.016 | ||||
| 0.0064 | 0.014 | 0.0057 | 0.013 | ||||
| Density (mm/mm3) | 7578.49 | 29,542.50 | Density (mm/mm3) | 104,685.07 | 88,715.34 | ||
| 7954.40 | 26,648.57 | 166,781.92 | 67,511.08 | ||||
| 3206.06 | 9953.67 | 210,241.59 | 69,900.41 | ||||
| Relative density* | 3.90 | Relative density* | 0.85 | ||||
| 3.35 | 0.40 | ||||||
| 3.10 | 0.33 | ||||||
-
*
Relative density = RADVTA/RADNAc.
Table 6
Whole-brain mapping data showing the axon densities in different brain regions in the mPFCNAc and mPFCVTA animals (n = 3–3 mice).
| mPFCVTA | mPFCNAc | ||||||
|---|---|---|---|---|---|---|---|
| mPFCVTA #1 | mPFCVTA #2 | mPFCVTA #3 | mPFCNAc #1 | mPFCNAc #2 | mPFCNAc #3 | ||
| CTX | Contralat. mPFC | ++ | +++ | +++ | |||
| Ins/Cl | + | + | +++ | ++ | +++ | ||
| RS | + | + | + | + | + | ||
| TeA | ++ | ++ | +++ | ||||
| Pir | + | + | + | ||||
| Ect | ++ | + | ++ | ||||
| Sub | ++ | ++ | +++ | ||||
| Ent | + | ++ | ++ | ||||
| STR | NAc | + | + | + | +++ | +++ | +++ |
| CPu | ++ | + | ++ | +++ | +++ | +++ | |
| Tu | + | + | + | +++ | +++ | +++ | |
| TH | PVT | +++ | +++ | +++ | ++ | + | + |
| Re | ++ | +++ | +++ | + | + | + | |
| LP | ++ | + | ++ | + | |||
| DLG | + | ||||||
| PIL | + | + | + | ||||
| nRT | ++ | ++ | +++ | + | + | + | |
| AMY | MeA | ++ | + | ++ | + | + | |
| Astr | ++ | ++ | +++ | ||||
| CeA | + | + | + | + | |||
| I | + | ++ | ++ | ++ | |||
| BA | + | + | +++ | ++ | +++ | ||
| BS | pv | +++ | ++ | +++ | + | + | + |
| PAG | +++ | ++ | +++ | + | + | + | |
| VTA | +++ | +++ | +++ | + | + | + | |
| SC | + | ++ | |||||
| SN | ++ | + | + | + | |||
| MR | ++ | ++ | + | ||||
| DR | ++ | + | ++ | + | + | ||
| DpMe | + | + | |||||
| IC | + | + | |||||
| PPTg | + | + | |||||
| PnO | ++ | + | +++ | ||||
| RR | + | + | + | ||||
| RtTg | + | + | ++ | + | |||
| LDTg | ++ | + | +++ | + | + | + | |
| PB | ++ | ++ | ++ | ||||
| CG | ++ | + | +++ | + | + | + | |
| LC | + | ++ | + | + | |||
| DMTg | ++ | ||||||
| Pn | + | ||||||
| SubB | + | ++ | |||||
| Others | VP | ++ | ++ | ++ | + | + | + |
| BNST | ++ | + | ++ | + | + | ||
| Septum | +++ | ++ | +++ | + | + | + | |
| HT | +++ | +++ | +++ | + | + | ||
| NB/SI | + | + | + | + | + | ++ | |
| Hb | + | + | + | ||||
| ZI | ++ | + | +++ | ||||
-
AMY, amygdala; Astr, amygdalostriatal transition area; BA, basolateral amygdaloid nucleus; BNST, bed nucleus of the stria terminalis; BS, brainstem; CeA, central amygdaloid nucleus; CG, central gray; Cl, claustrum; CPu, caudate putamen; CTX, cortex; DLG, dorsal lateral geniculate nucleus; DMTg, dorsomedial tegmental area; DpMe, deep mesencephalic nucleus; DR, dorsal raphe; Ect, ectorhinal cortex; Ent, entorhinal cortex; Hb, habenula; HT, hypothalamus; I, intercalated amygdalar nuclei; IC, inferior colliculus; Ins, insular cortex; LC, locus coeruleus; LDTg, laterodorsal tegmental nucleus; LP, lateral posterior thalamic nucleus; MeA, medial amygdaloid nucleus; MR, medial raphe; NB, basal nucleus; nRT, reticular thalamic nucleus; PVT, paraventricular thalamic nucleus; VP, ventral pallidum; PAG, periaqueductal gray; PB, parabrachial nucleus; PIL, posterior intralaminar thalamic nucleus; Pir, piriform cortex; Pn, pontine nuclei; PnO, pontine reticular nucleus, oral part; PPTg, pedunculopontine tegmental nucleus; pv, periventricular fiber system; Re, reuniens thalamic nucleus; RR, retrorubral nucleus; RS, retrosplenial cortex; RtTg, reticulotegmental nucleus of the pons; SC, superior colliculus; SI, substantia innominata; STR, striatum; Sub, subiculum; SubB, subbrachial nucleus; TeA, termporal association cortex; TH, thalamus; Tu, olfactory tubercule; ZI, zona incerta.
Appendix 1—key resources table
| Reagent type (species) or resource | Designation | Source or reference | Identifiers | Additional information |
|---|---|---|---|---|
| Strain, strain background (M. musculus, male, female) | Tg(Rbp4-cre)KL100Gsat | MMRRC | RRID: MMRRC_037128-UCD | |
| Strain, strain background (M. musculus, male, female) | FVB/N-Tg(Thy1-cre)1Vln/J | The Jackson Laboratory | RRID: IMSR_JAX:006143 | |
| Strain, strain background (M. musculus, male, female) | B6;129S-Calb1tm2.1(cre)Hze/J | The Jackson Laboratory | RRID: IMSR_JAX:028532 | |
| Strain, strain background (M. musculus, male, female) | Tg(Ntsr1-cre)GN220Gsat | MMRRC | RRID: MMRRC_017266-UCD | |
| Strain, strain background (M. musculus, male, female) | B6.Cg-Foxp2tm1.1(cre)Rpa/J | The Jackson Laboratory | RRID: IMSR_JAX:030541 | |
| Strain, strain background (M. musculus, male, female) | C57BL/6J | The Jackson Laboratory | RRID: IMSR_JAX:000664 | |
| Biological sample (species) | AAV5.EF1a.DIO.eYFP.WPRE.hGH | Penn Vector Core | Cat. #27056-AAV5 | Viral titer: 5 × 10¹² GC/ml |
| Biological sample (species) | AAV5-EF1a-DIO-mCherry | UNC Vector Core | Cat. #50462 | Viral titer: 7 × 10¹² GC/ml |
| Biological sample (species) | Canine adenovirus type 2 carrying Cre-recombinase gene | Plateforme de Vectorologie de Montpellier, France | CMV promoter, titer: 2.5 × 10¹⁰ pp/ml | |
| Biological sample (species) | 10% normal donkey serum | Sigma-Aldrich | S30-M | |
| Biological sample (species) | 10% normal goat serum | Vector | S-1000, RRID: AB_2336615 | |
| Antibody | Anti-GFP (chicken polyclonal) | Life Technology | A10262, RRID: AB_2534023 | 1:2000 |
| Antibody | Anti-mCherry (rabbit polyclonal) | BioVision | 5993-100, RRID: AB_1975001 | 1:2000 |
| Antibody | Anti-RFP (rat monoclonal) | Chromotek | 5F8, RRID: AB_2336064 | 1:2000 |
| Antibody | Anti-FoxP2 (mouse monoclonal) | Merck Millipore | MABE415, RRID: AB_2721039 | 1:2000 |
| Antibody | Anti-FoxP2 (mouse monoclonal) | Invitrogen | MA5-31419, RRID: AB_2787055 | 1:2000 |
| Antibody | Anti-FoxP2 (rabbit polyclonal) | Abcam | ab16046, RRID: AB_2107107 | 1:500 |
| Antibody | Anti-Calb1 (rabbit polyclonal) | Swant | CB38, RRID: AB_10000340 | 1:2000 |
| Antibody | Anti-Calb1 (mouse monoclonal) | Swant | 300, RRID: AB_10000347 | 1:2000 |
| Antibody | Anti-Calb1 (chicken polyclonal) | Synaptic Systems | 214 006, RRID: AB_261990 | 1:2000 |
| Antibody | Anti-TH (mouse monoclonal) | Immunostar | 22941, RRID: AB_572268 | 1:8000 |
| Antibody | Anti-FG (rabbit polyclonal) | Fluorochrome LLC | 1:50,000 | |
| Antibody | Anti-FG (guinea pig polyclonal) | Protos Biotech | NM-101, RRID: AB_2314409 | 1:5000 |
| Antibody | Anti-CTB (goat, N/A) | List Biological Laboratories | #703 | 1:10,000 |
| Antibody | Anti-PV (mouse monoclonal) | Swant | PV 235, RRID: AB_10000343 | 1:2000 |
| Antibody | Anti-Ctip2 (rat monoclonal) | Abcam | ab18465, RRID: AB_2064130 | 1:500 |
| Antibody | Anti-rabbit, Alexa-488 conjugated (donkey polyclonal) | Jackson | 711-545-152, RRID: AB_2313584 | 1:500 |
| Antibody | Anti-mouse, Alexa-488 conjugated (donkey polyclonal) | Jackson | 715-545-150, RRID: AB_2340846 | 1:500 |
| Antibody | Anti-chicken, Alexa-488 conjugated (goat polyclonal) | Molecular Probes | A11039, RRID: AB_142924 | 1:500 |
| Antibody | Anti-guinea pig, Alexa-488 conjugated (donkey polyclonal) | Jackson | 706-545-148, RRID: AB_2340472 | 1:500 |
| Antibody | Anti-goat, Alexa-555 conjugated (donkey polyclonal) | Molecular Probes | A21432, RRID: AB_141788 | 1:500 |
| Antibody | Anti-mouse, Alexa-555 conjugated (donkey polyclonal) | Molecular Probes | A31570, RRID: AB_2536180 | 1:500 |
| Antibody | Anti-rat, Alexa-555 conjugated (donkey polyclonal) | Southern Biotech | 6430–32, RRID: AB_2796359 | 1:500 |
| Antibody | Anti-mouse, Cy3 conjugated (donkey polyclonal) | Jackson | 715-165-151, RRID: AB_2340813 | 1:500 |
| Antibody | Anti-rabbit, Cy3 conjugated (donkey polyclonal) | Jackson | 715-165-152, RRID: AB_2307443 | 1:500 |
| Antibody | Anti-mouse, Alexa-594 conjugated (donkey polyclonal) | Molecular Probes | A21203, RRID: AB_141633 | 1:500 |
| Antibody | Anti-rabbit, Alexa-594 conjugated (donkey polyclonal) | Molecular Probes | A21207, RRID: AB_141637 | 1:500 |
| Antibody | Anti-mouse, Alexa-647 conjugated (donkey polyclonal) | Jackson | 715-605-151, RRID: AB_2340863 | 1:500 |
| Antibody | Anti-mouse, Alexa-647 conjugated (donkey polyclonal) | Invitrogen | A-31571, RRID: AB_162542 | 1:500 |
| Antibody | Anti-rabbit, Alexa-647 conjugated (donkey polyclonal) | Jackson | 711-605-152, RRID: AB_2492288 | 1:500 |
| Antibody | Anti-goat, biotinylated (horse polyclonal) | Vector Laboratories | BA-9500, RRID: AB_2336123 | 1:300 |
| Antibody | Anti-rabbit, biotinylated (goat polyclonal) | Vector Laboratories | BA-1000, RRID: AB_2313606 | 1:300 |
| Antibody | Anti-guinea pig, biotinylated (goat polyclonal) | Vector Laboratories | BA-7000, RRID: AB_2336132 | 1:300 |
| Peptide, recombinant protein | Streptavidin, Alexa-488 conjugated | Jackson | 016-540-084, RRID: AB_2337249 | 1:2000 |
| Peptide, recombinant protein | Streptavidin, Cy3 conjugated | Jackson | 016-160-084, RRID: AB_2337244 | 1:2000 |
| Peptide, recombinant protein | Streptavidin, Alexa-647 conjugated | Jackson | 016-600-084, RRID: AB_2341101 | 1:2000 |
| Commercial assay or kit | VECTASTAIN Elite ABC-HRP Kit, Peroxidase (Standard) | Vector Laboratories | PK-6100, RRID: AB_2336819 | 1:300 |
| Chemical compound, drug | 0.5% Cholera Toxin B subunit | List Biological Laboratories | Cat.: 104 | |
| Chemical compound, drug | 2% Fluoro-Gold | Fluorochrome LLC | ||
| Chemical compound, drug | Rimadyl (Carprofen 1.4 mg/kg) | Pfizer | ||
| Chemical compound, drug | 4% paraformaldehyde | Sigma-Aldrich | CAS No. 30525-89-4 | |
| Chemical compound, drug | 5% biotinylated dextrane amine | Molecular Probes | D1956, RRID: AB_2307337 | Molecular weight: 10,000 |
| Chemical compound, drug | Triton-X | Sigma-Aldrich | CAS Number: 9036-19-5 | IF: 0.5% DAB-Ni: 0.2% |
| Chemical compound, drug | 3-3′-diaminobenzidine | Sigma-Aldrich | CAS Number: 91-95-2 | |
| Software, algorithm | CaseViewer 2.4 | 3DHistech, Hungary | ||
| Software, algorithm | Zeiss ZEN 2010B SP1 Release version 6.0 | Zeiss Microimaging GmbH | ||
| Software, algorithm | CellSens Entry 1.16 | Olympus Corporation | ||
| Software, algorithm | ImageJ | NIH | ||
| Software, algorithm | Axon density analyzer script | Mátyás et al., 2018 | Available at: https://github.com/baabek/Axon-density-analyzer-ImageJ-script.git. | |
| Software, algorithm | SPSS Statistics, ver. 27.0.1.0 | IBM | ||
| Other | Vectashield | Vector Laboratories | H-1000, RRID: AB_2336789 | Antifade mounting medium for fluorescent samples (see Materials and methods/Fluorescent immunohistochemistry) |
| Other | DePex | Serva, Germany | Cat. No. 18243 | Mounting medium for histological samples (see Materials and methods/Immunoperoxidase staining) |
Additional files
Download links
A two-part list of links to download the article, or parts of the article, in various formats.
Downloads (link to download the article as PDF)
Open citations (links to open the citations from this article in various online reference manager services)
Cite this article (links to download the citations from this article in formats compatible with various reference manager tools)
Molecular characteristics and laminar distribution of prefrontal neurons projecting to the mesolimbic system
eLife 11:e78813.
https://doi.org/10.7554/eLife.78813


