Regionally distinct trophoblast regulate barrier function and invasion in the human placenta
- The Eli and Edythe Broad Center of Regeneration Medicine and Stem Cell, University of California, San Francisco, United States
- Department of Urology, University of California, San Francisco, United States
- Center for Reproductive Sciences, University of California, San Francisco, United States
- Developmental and Stem Cell Biology Graduate Program, University of California, San Francisco, United States
- Department of Obstetrics, Gynecology, and Reproductive Sciences, University of California, San Francisco, United States
Figures
Figure 1 with 8 supplements
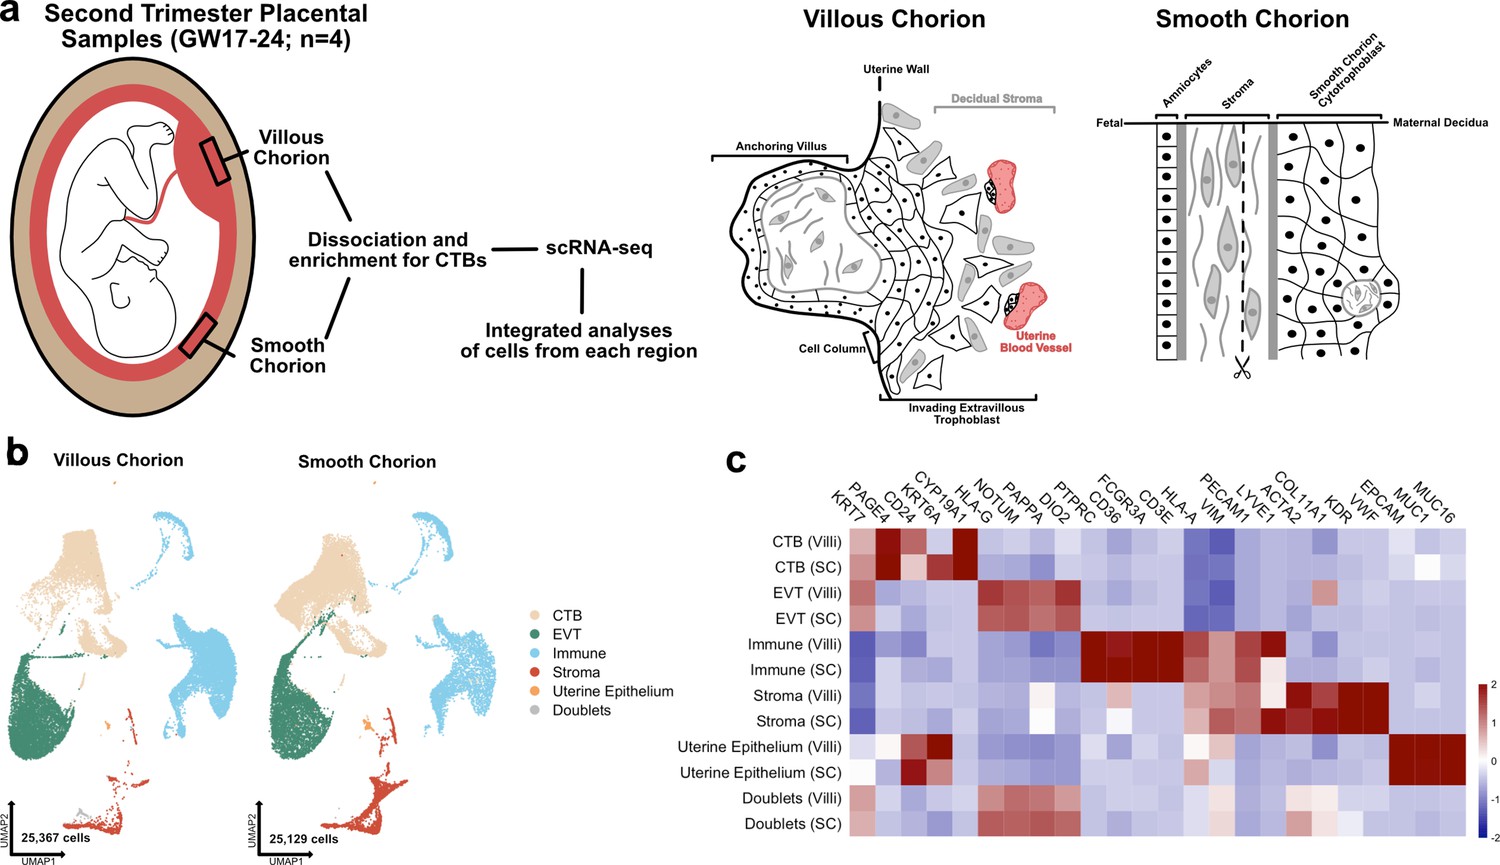
The transcriptional landscape of the villous (VC) and smooth chorion (SC) at mid-gestation.
(a) Left: Schematic of the placenta at mid-gestation, highlighting the regions sampled, together with the methods used for cell isolation and characterization. Right: Schematic of the cell types and their organization in each region. (b) UMAPs of integrated samples, shown by region of origin (left – VC, right – SC), and colored according to broad cell type clusters. (c) Heatmap of the transcript expression of select cell identity markers across broad cell type clusters and regions. Values are scaled expression across the clusters of each region independently.
-
Figure 1—source data 1
Marker genes for the clusters of the Immune subset.
- https://cdn.elifesciences.org/articles/78829/elife-78829-fig1-data1-v2.csv
-
Figure 1—source data 2
Marker genes for the clusters of the Stroma subset.
- https://cdn.elifesciences.org/articles/78829/elife-78829-fig1-data2-v2.csv
Figure 1—figure supplement 1

Metrics of the integrated dataset.
(a) Violin plots of the number of unique genes (left), number of UMI (middle), and the percent of mitochondrial reads (right) per cell for each broad cell type cluster. (b) The total number of cells (left) and the percent of the total library (right) in each broad cell type cluster from each placental sample are shown. (c) UMAPs of the integrated dataset shown by each placental sample. Colors correspond to each broad cell type cluster in the legend at the right. The number of cells analyzed from each placental sample is listed beneath. (d) The number of cells in each broad cell type cluster from each region (villous chorion [VC] – black; smooth chorion [SC] – blue).
Figure 1—figure supplement 2

XIST expression by sample.
(a) Violin plot of XIST transcript expression in each sample for each trophoblast cluster. Since all trophoblast are of fetal origin, samples expressing XIST are XX and samples with no XIST expression are XY. (b) Violin plot of XIST transcript expression in each sample for each stromal cluster. Clusters with XIST expression in samples other than GW23 are of maternal origin. Clusters with XIST expression only in GW23 are of fetal origin. (c) Violin plot of XIST transcript expression in each sample for each immune cluster. Clusters with XIST expression in samples other than GW23 are of maternal origin. Clusters with XIST expression only in GW23 are of fetal origin.
Figure 1—figure supplement 3

Comparison of stroma and immune clusters to Vento-Tormo et al., 2018.
(a) Spearman correlations between the average expression within each stromal cell cluster identified in this study (y-axis) and in Vento-Tormo et al., 2018 (x-axis). Black dots denote p-value ≤ 0.05 derived from permutation testing for each correlation. (b) UMAP plot of the integration of stromal cells identified in this study and in Vento-Tormo et al., 2018. On the left, cells originating from this study are colored by their independently derived cluster annotations. On the right, cells originating from Vento-Tormo et al., 2018, are colored by their independently derived cluster annotations. (c) Spearman correlations between the average expression within each immune cell cluster identified in this study (y-axis) and in Vento-Tormo et al., 2018 (x-axis). Black dots denote p-value ≤ 0.05 derived from permutation testing for each correlation. (d) UMAP plot of the integration of immune cells identified in this study and in Vento-Tormo et al., 2018. On the left, cells originating from this study are colored by their independently derived cluster annotations. On the right, cells originating from Vento-Tormo et al., 2018, are colored by their independently derived cluster annotations.
Figure 1—figure supplement 4
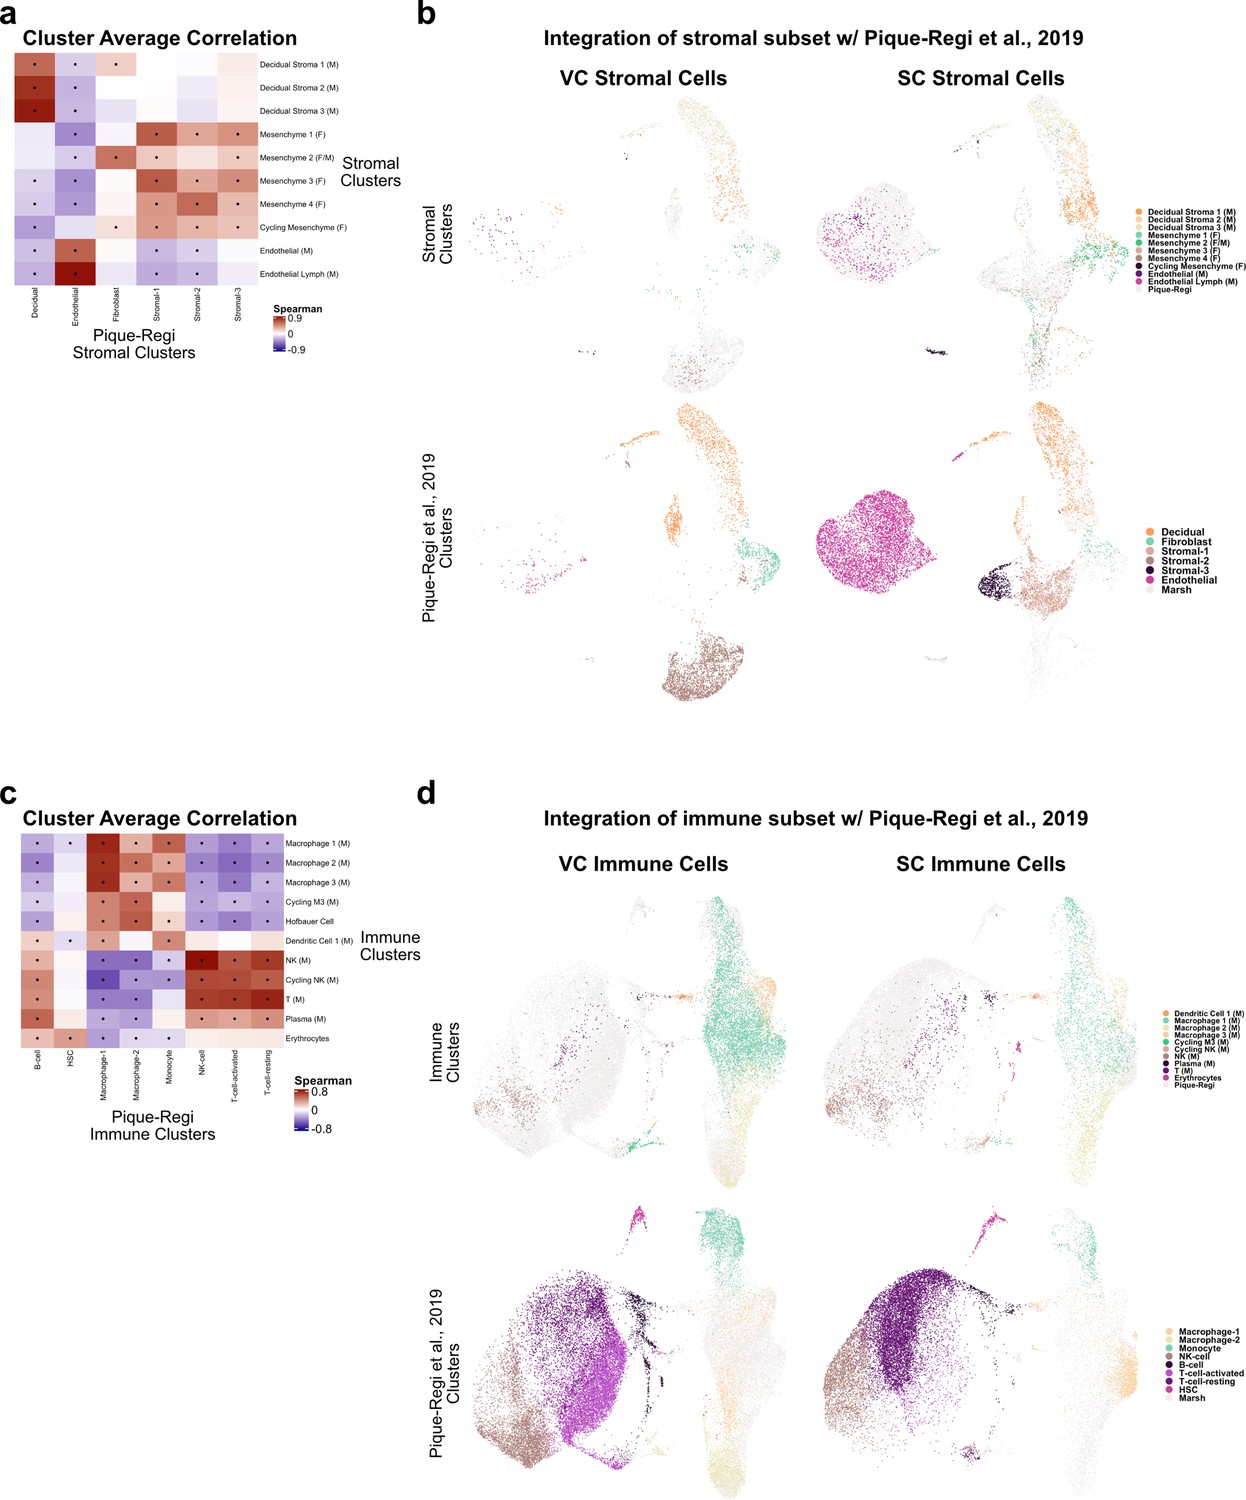
Comparison of stroma and immune clusters to Pique-Regi et al., 2019.
(a) Spearman correlations between the average expression within each stromal cell cluster identified in this study (y-axis) and in Pique-Regi et al., 2019 (x-axis). Black dots denote p-value ≤ 0.05 derived from permutation testing for each correlation. (b) UMAP plots of the integration of stromal cells identified in this study and in Pique-Regi et al., 2019. Cells originating from the villous chorion (VC) are highlighted on the left and cells originating from the smooth chorion (SC) are highlighted on the right colored by their independently derived cluster annotations. Cells originating from this study are highlighted on the top row and cells originating from Pique-Regi et al., 2019, are highlighted on the bottom row colored by their independently derived cluster annotations. (c) Spearman correlations between the average expression within each immune cell cluster identified in this study (y-axis) and in Pique-Regi et al., 2019 (x-axis). Black dots denote p-value ≤ 0.05 derived from permutation testing for each correlation. (d) UMAP plot of the integration of immune cells identified in this study and in Pique-Regi et al., 2019. Cells originating from the VC are highlighted on the left and cells originating from the SC are highlighted on the right colored by their independently derived cluster annotations. Cells originating from this study are highlighted on the top row and cells originating from Pique-Regi et al., 2019, are highlighted on the bottom row colored by their independently derived cluster annotations.
Figure 1—figure supplement 5
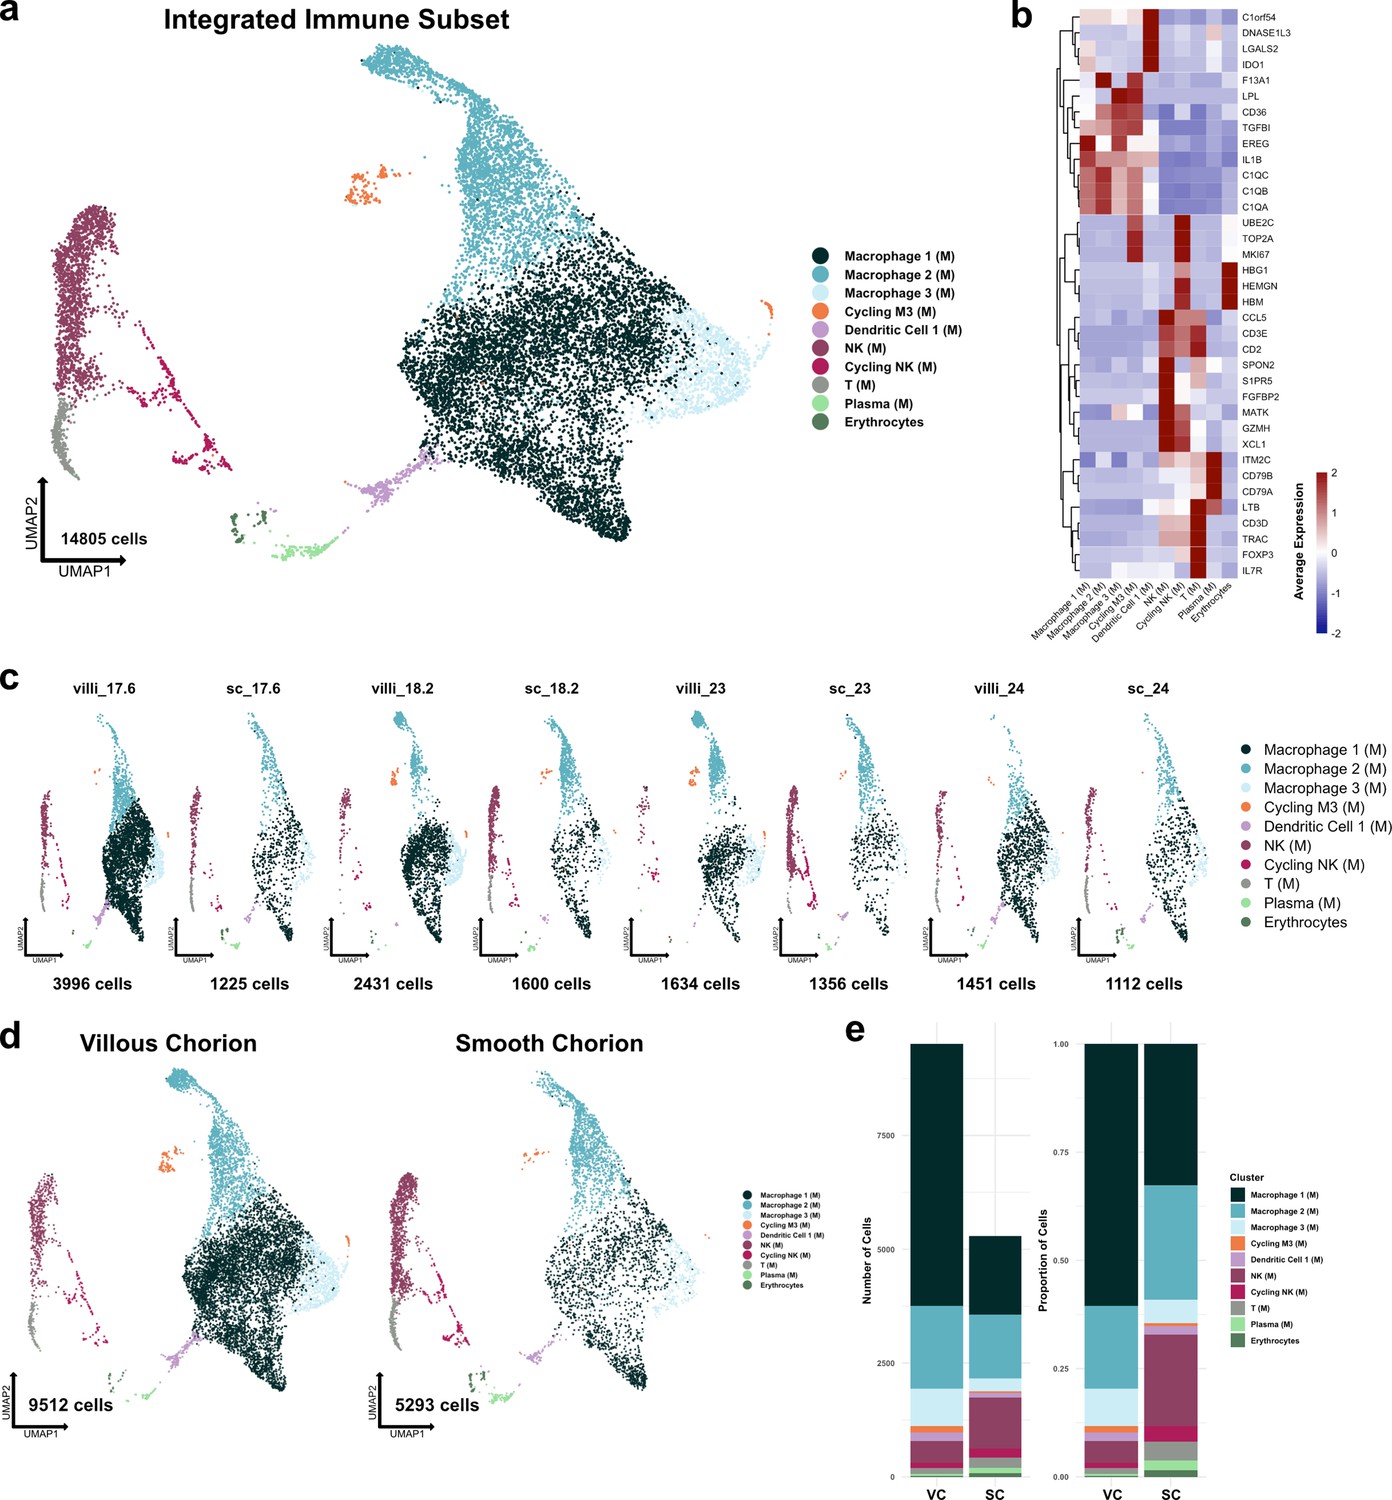
Metrics and markers of the immune cell subset.
(a) UMAP of all subclustered immune cells (n=14,805). Colors correspond to the clusters in the legend at the right. (b) Heatmap of selected marker genes of each immune cell cluster. Expression was displayed as the scaled mean expression in the cluster. (c) UMAP of immune cells shown by sample. (d) UMAP of immune cells shown by region of origin. (e) Stacked bar chart of the number of cells (left) or proportion of cells (right) in each cluster by region of origin.
Figure 1—figure supplement 6

Independent analysis of villous chorion (VC) and smooth chorion (SC) immune cells.
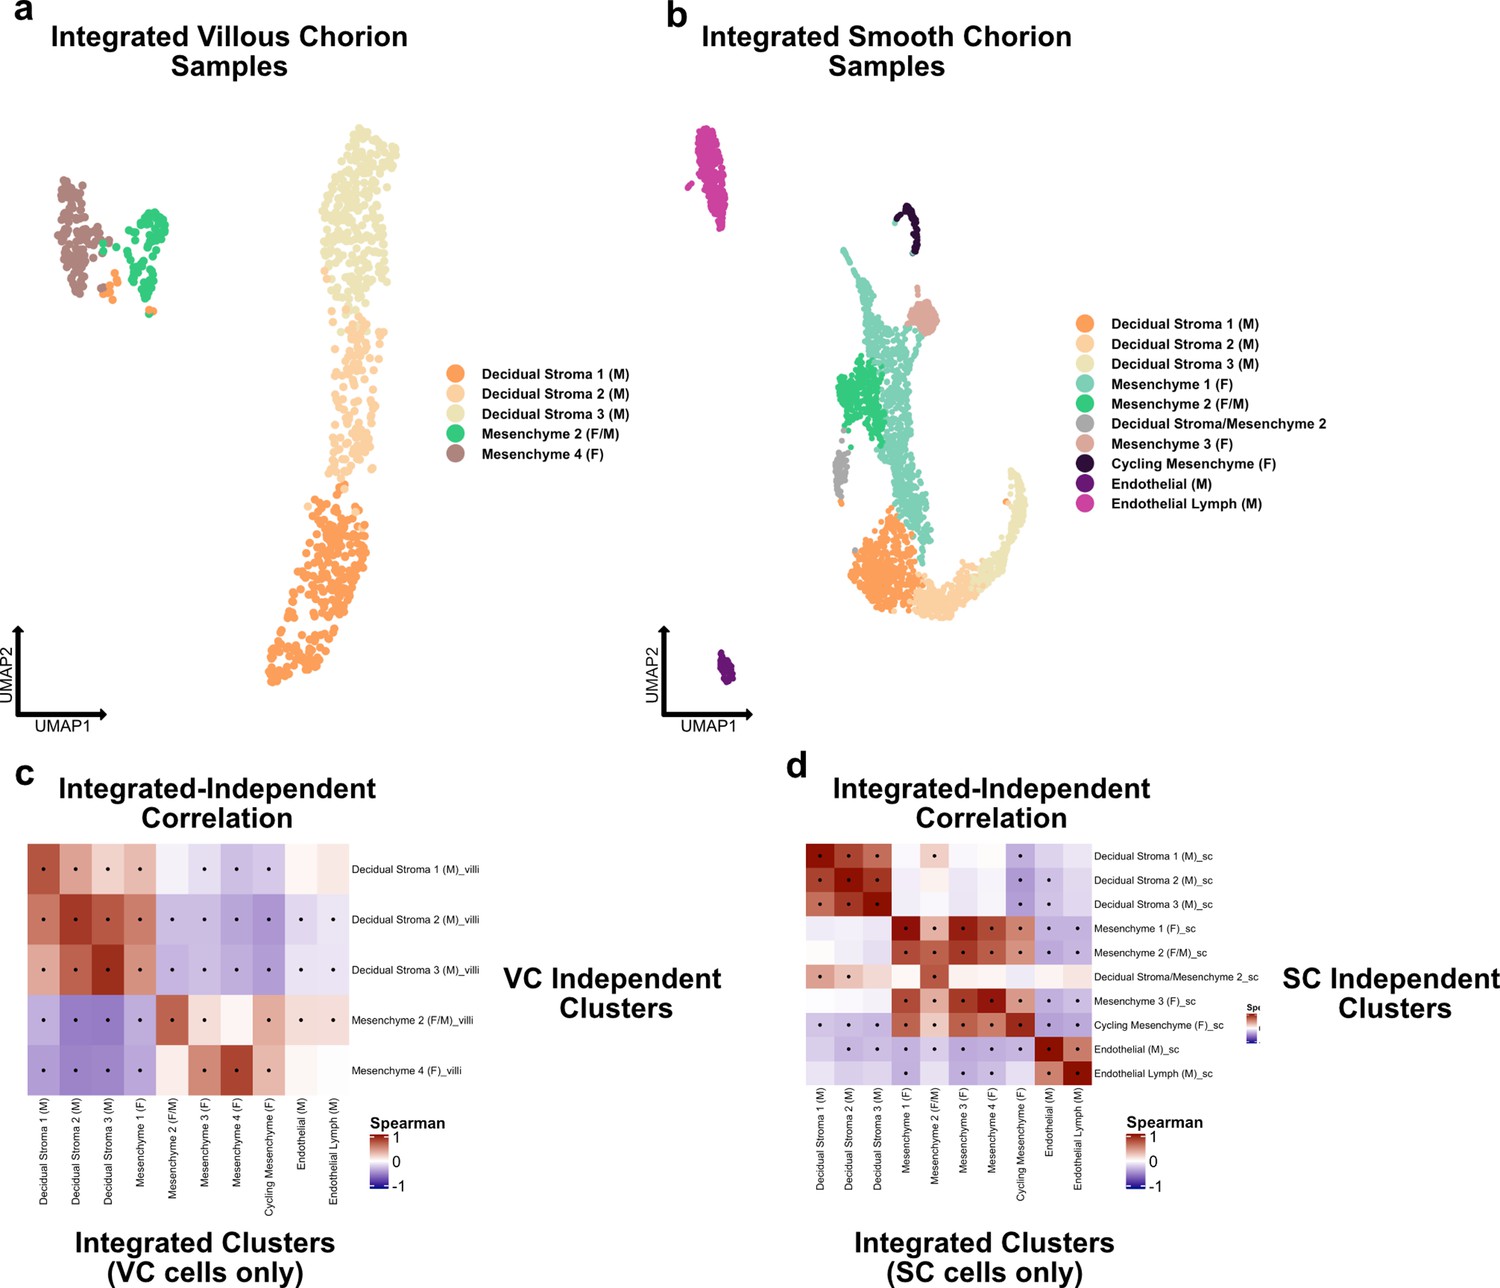
(a) UMAP of subclustered stromal cells isolated from the VC. Colors correspond to the clusters at the right. (b) UMAP of subclustered stromal cells isolated from the SC. Colors correspond to the clusters at the right. (c) Spearman correlations between the average expression within independently derived VC clusters (y-axis) and the clusters from the integrated dataset (Figure 2). (d) Spearman correlations between the average expression within independently derived SC clusters (y-axis) and the clusters from the integrated dataset (Figure 2). Black dots denote p-value ≤ 0.05 derived from permutation testing for each correlation plot in c and d.
Figure 1—figure supplement 7
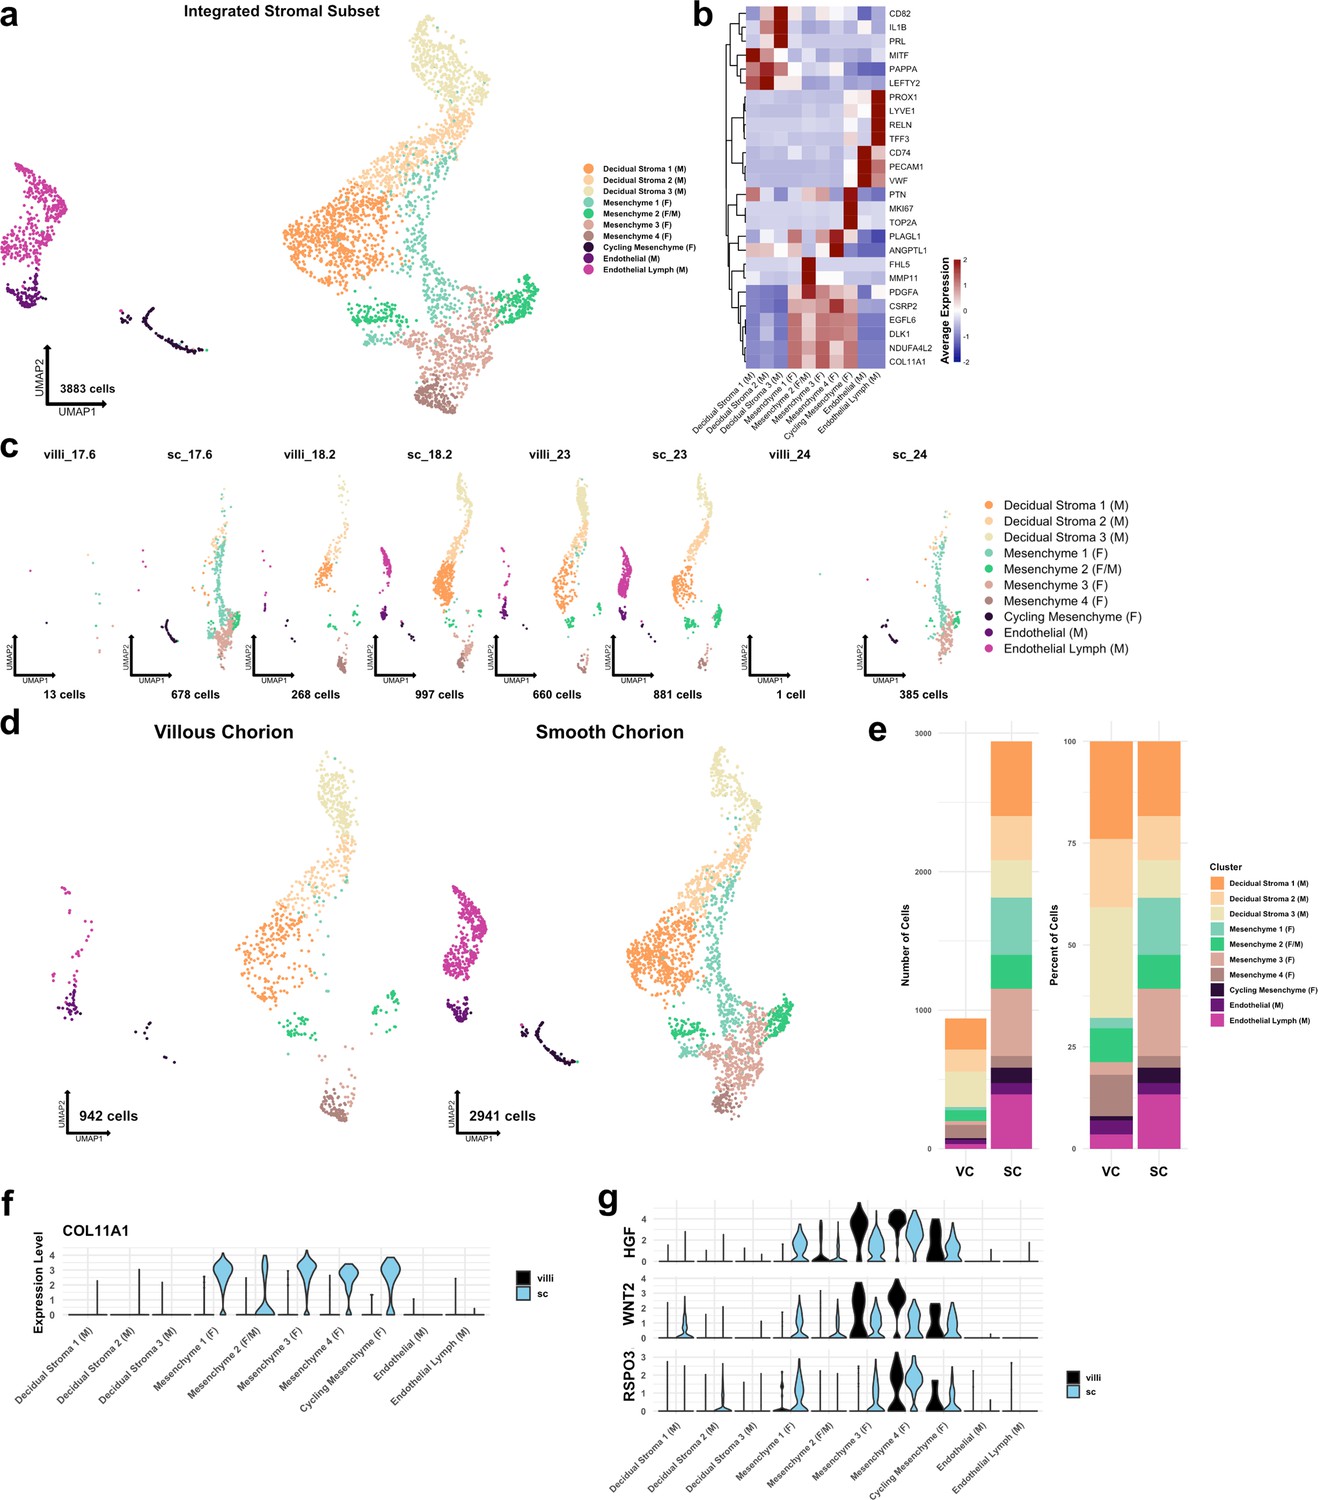
Metrics and markers of the stromal cell subset.
(a) UMAP of subclustered stromal cells (n=3883). Colors correspond to the clusters in the legend at the right. (b) Heatmap of selected marker genes for each stromal cell cluster. Expression was displayed as the scaled mean expression in the cluster. (c) UMAP of stromal cells shown by sample. (d) UMAP of stromal cells shown by region of origin. (e) Stacked bar chart of the number of cells (left) or percent of cells (right) in each cluster by region of origin. (f) Violin plot of COL11A1 expression in each cluster shown by each region, showing expression in only smooth chorion (SC) cells. (g) Violin plots of HGF, WNT2, and RSPO3 expression in each cluster and shown by each region, showing expression in both villous chorion (VC) and SC cells.
Figure 1—figure supplement 8
Independent analysis of villous (VC) and smooth chorion (SC) stromal cells.
(a) UMAP of subclustered immune cells isolated from the VC. Colors correspond to the clusters at the right. (b) UMAP of subclustered immune cells isolated from the SC. Colors correspond to the clusters at the right. (c) Spearman correlations between the average expression within independently derived VC clusters (y-axis) and the clusters from the integrated dataset (Figure 2). (d) Spearman correlations between the average expression within independently derived SC clusters (y-axis) and the clusters from the integrated dataset (Figure 2). Black dots denote p-value ≤ 0.05 derived from permutation testing for each correlation plot in c and d.
Figure 2 with 4 supplements
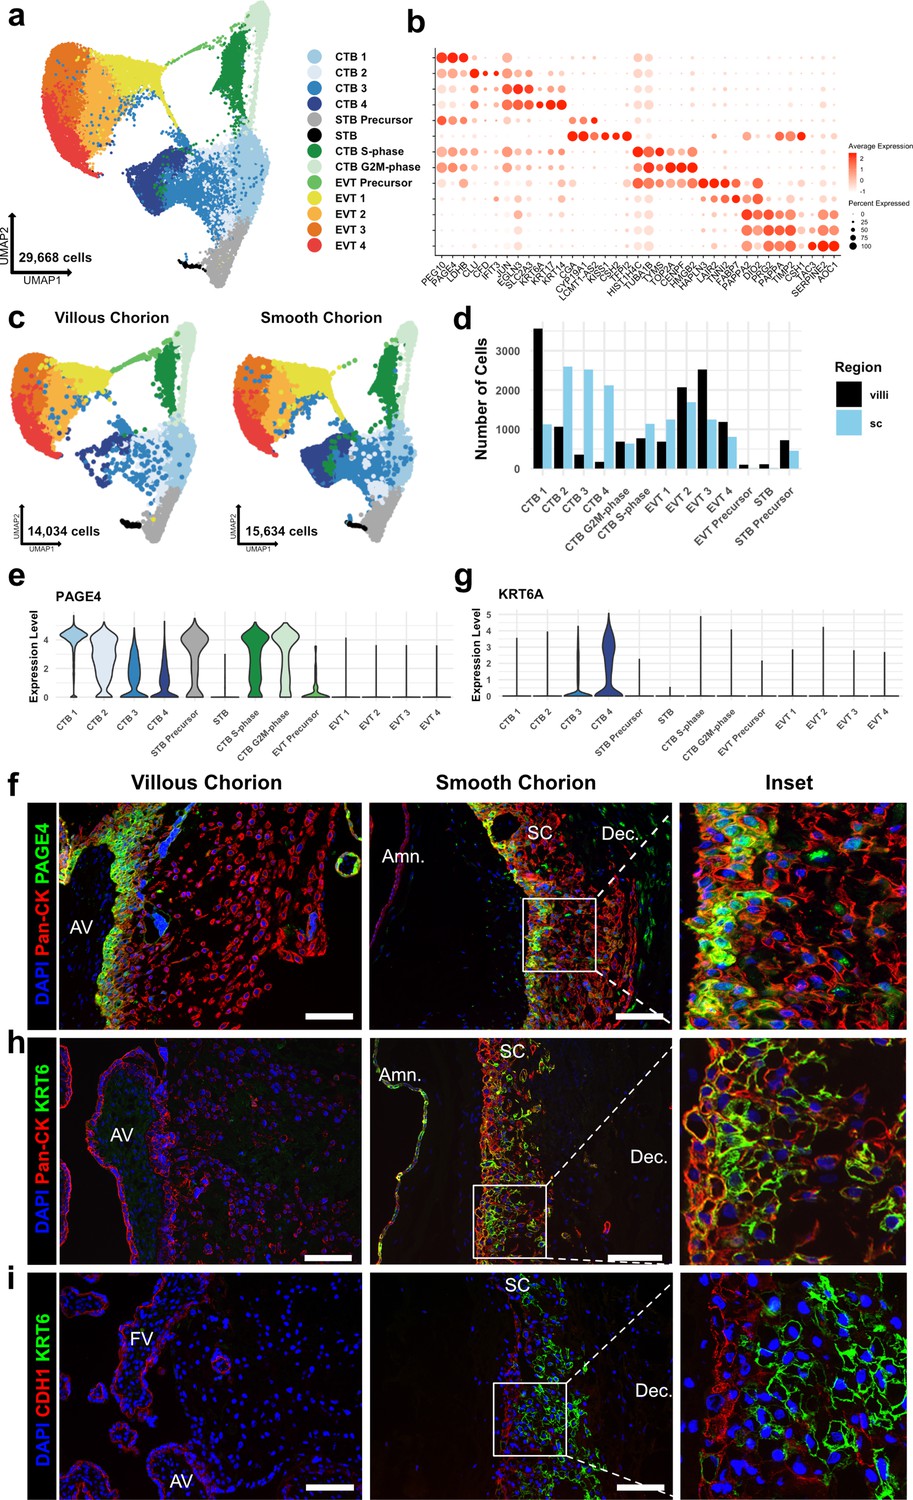
Identification of a smooth chorion-specific cytotrophoblast.
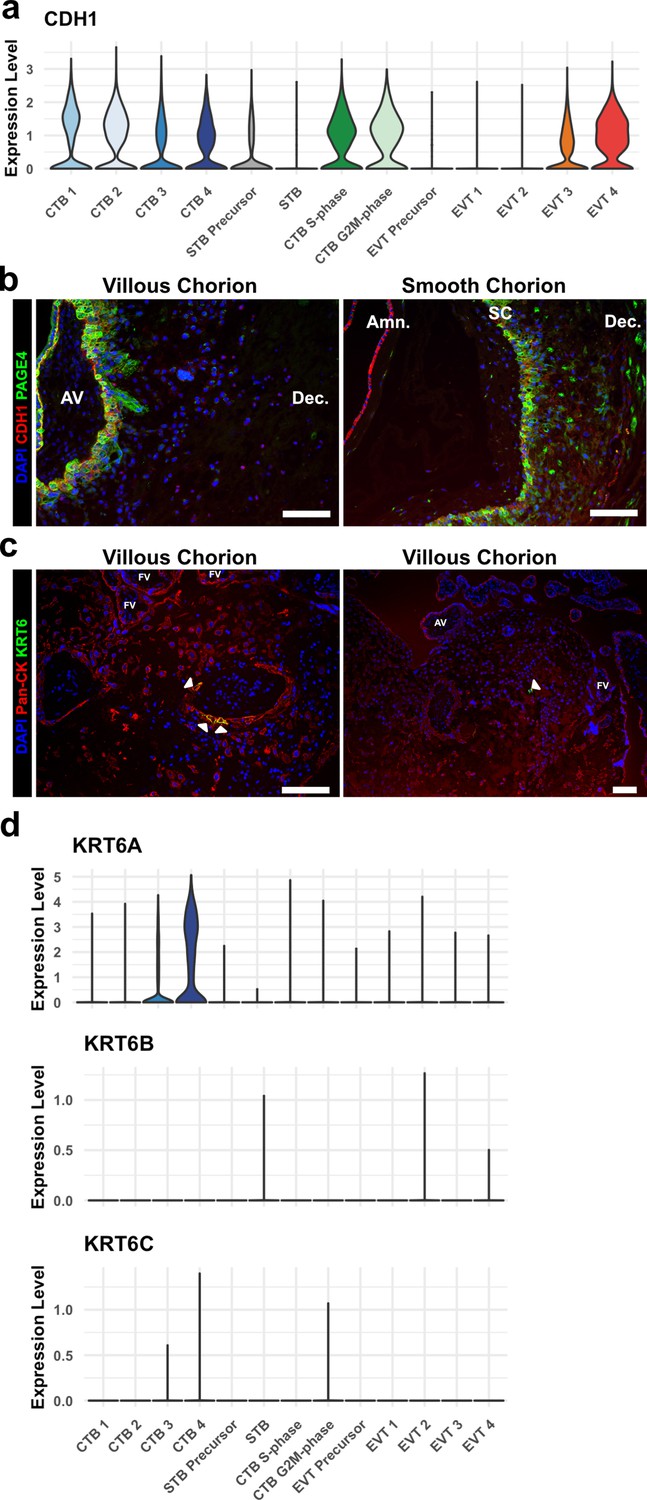
(a) UMAP of subclustered trophoblasts (n=29,668). Colors correspond to the clusters at the right. (b) Dot plot showing average expression and percent of cells in each cluster as identified by the marker genes listed on the x-axis. The clusters are listed on the y-axis. (c) UMAP of subclustered trophoblasts from the villous chorion (VC) (left) or the SC (right). Clusters and colors are the same as in panel a. (d) Quantification of the number of cells in each trophoblast cluster from each region. Cells from the VC are shown in black. Cells from the SC are shown in blue. (e) Violin plot of PAGE4 transcript expression across all trophoblast clusters. (f) Immunofluorescence co-localization of PAGE4 with pan-cytokeratin (marker of all trophoblast) in the VC (left) or SC (right). (g) Violin plot of KRT6A transcript expression across all trophoblast clusters. (h) Immunofluorescence co-localization of KRT6 with pan-cytokeratin (marker of all trophoblast) in the VC (left) or SC (right). (i) Immunofluorescence co-localization of CDH1 and KRT6 in the VC (left) or SC (middle). High magnification inset is denoted by the white box (right). For all images, nuclei were visualized by DAPI stain; scale bar = 100 μm. Abbreviations: AV = anchoring villi; FV = floating villi; SC = smooth chorion epithelium; Amn. = amnion; Dec. = decidua.
-
Figure 2—source data 1
Marker genes for each cluster in the trophoblast subset.
- https://cdn.elifesciences.org/articles/78829/elife-78829-fig2-data1-v2.csv
Figure 2—figure supplement 1

Metrics of the trophoblast subset.
(a) Violin plots of the number of unique genes (left), number of UMI (middle), and the percent of mitochondrial reads (right) per cell for each trophoblast cluster. (b) UMAPs of the trophoblast dataset shown by each placental sample. Colors correspond to each trophoblast cluster shown in the legend at the right. The number of cells analyzed from each placental sample is listed beneath. (c) The number of cells (left) and the percentage (right) in each trophoblast cluster from each placental sample. (d) Spearman correlations between the average expression within each trophoblast cell cluster identified in this study (y-axis) and in Vento-Tormo et al., 2018 (x-axis). Black dots denote p-value ≤ 0.05 derived from permutation testing for each correlation. (e) UMAP plot of the integration of trophoblast cells identified in this study and in Vento-Tormo et al., 2018. On the left, cells originating from this study are colored by their independently derived cluster annotations. On the right, cells originating from Vento-Tormo et al., 2018, are colored by their independently derived cluster annotations. (f) Spearman correlations between the average expression within each trophoblast cell cluster identified in this study (y-axis) and in Pique-Regi et al., 2019 (x-axis). Black dots denote p-value ≤ 0.05 derived from permutation testing for each correlation. (g) UMAP plots of the integration of trophoblast cells identified in this study and in Pique-Regi et al., 2019. Cells originating from the villous chorion (VC) are highlighted on the left and cells originating from the smooth chorion (SC) are highlighted on the right colored by their independently derived cluster annotations. Cells originating from this study are highlighted on the top row and cells originating from Pique-Regi et al., 2019, are highlighted on the bottom row colored by their independently derived cluster annotations. The dashed line annotates the contribution of CTB 3 and CTB 4 identified in this study, and their absence in the VC and in the Pique-Regi et al., 2019, dataset.
Figure 2—figure supplement 2
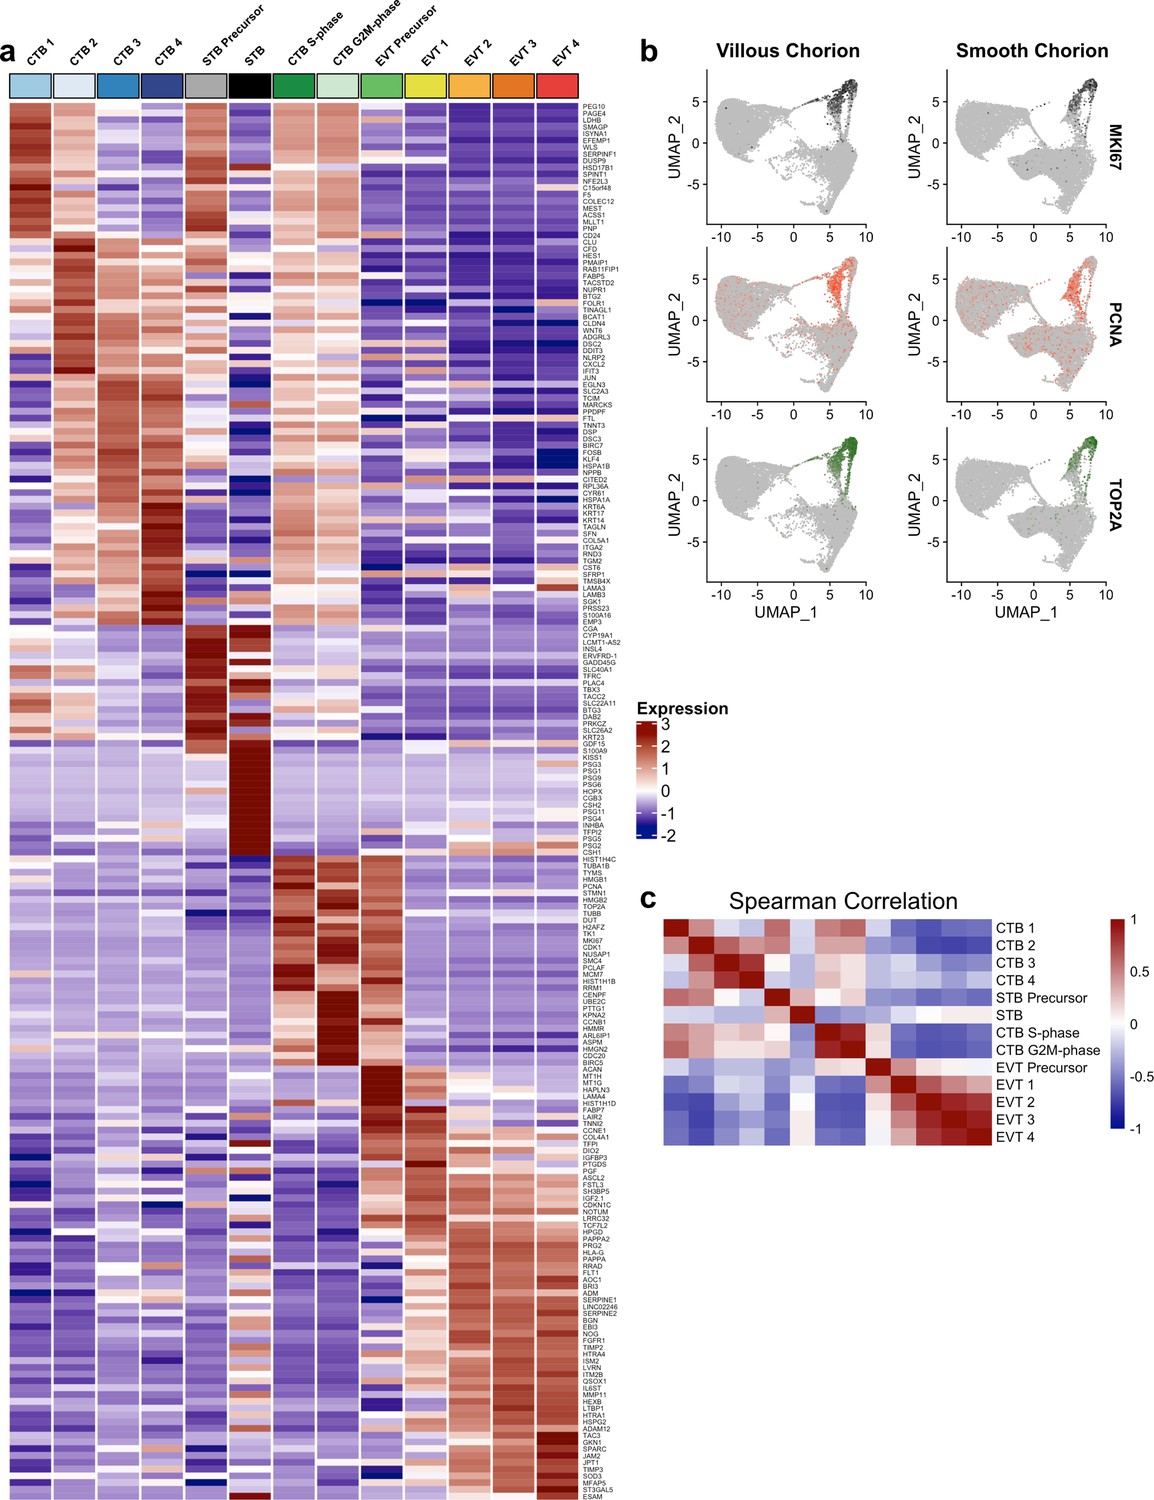
Markers of the trophoblast subset.
(a) Heatmap of the expression of the top 20 marker genes for each trophoblast population. (b) Expression of phasic transcripts MKI67 (top), PCNA (middle), and TOP2A (bottom) were projected in UMAP space. (c) Heatmap of the Spearman correlation coefficients between each trophoblast population.
Figure 2—figure supplement 3
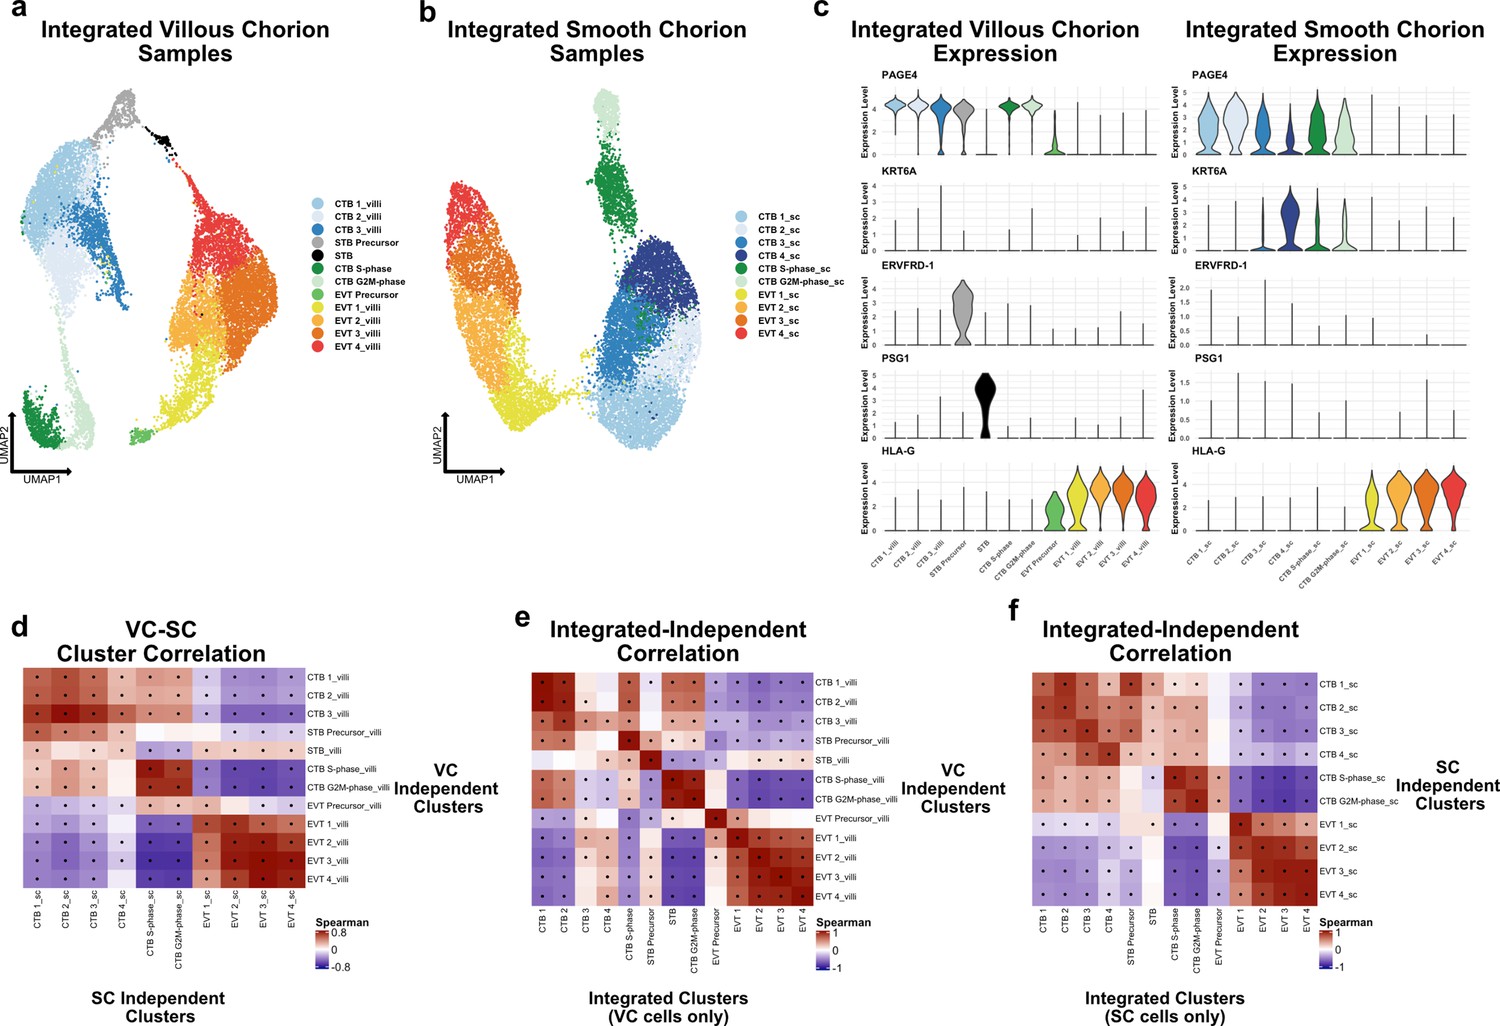
Independent analysis of villous (VC) and smooth chorion (SC) trophoblast.
(a) UMAP of subclustered trophoblasts isolated from the VC. Colors correspond to the clusters at the right. (b) UMAP of subclustered trophoblasts isolated from the SC. Colors correspond to the clusters at the right. (c) Violin plots of transcript expression of CTB 1 marker PAGE4, CTB 4 marker KRT6A, STB Precursor marker ERVFRD-1, STB marker PSG1, and EVT marker HLA-G in the independently derived VC cell clusters (left) and SC cell clusters (right). (d) Spearman correlations between the average expression within independently derived VC clusters (y-axis) and the independently derived SC clusters (x-axis). Black dots denote p-value ≤ 0.05 derived from permutation testing for each correlation. (e) Spearman correlations between the average expression within independently derived VC clusters (y-axis) and the clusters from the integrated dataset (Figure 2). Black dots denote p-value ≤ 0.05 derived from permutation testing for each correlation. (f) Spearman correlations between the average expression within independently derived SC clusters (y-axis) and the clusters from the integrated dataset (Figure 2). Black dots denote p-value ≤ 0.05 derived from permutation testing for each correlation.
Figure 2—figure supplement 4
KRT6 expression in the villous chorion (VC) region.
(a) Violin plot of CDH1 transcript expression across all trophoblast clusters. (b) Immunofluorescence co-localization of CDH1 and PAGE4 in the VC (left) and SC (right). (c) Immunofluorescence co-localization of Pan-CK (marker of all trophoblast) and KRT6 in the VC. Arrowheads denote KRT6+ cells. (d) Violin plots of expression of each KRT6 isoform, showing expression of only KRT6A in trophoblasts. For all images, nuclei were visualized by DAPI stain; scale bar = 100 μm. Abbreviations: AV = anchoring villi; Amn. = amnion; SC = smooth chorion epithelium; Dec. = decidua; FV = floating villi.
Figure 3 with 2 supplements

A common cytotrophoblast (CTB) progenitor gives rise to syncytiotrophoblasts (STBs) in the villous chorion (VC) and smooth chorion (SC)-CTBs in the SC.
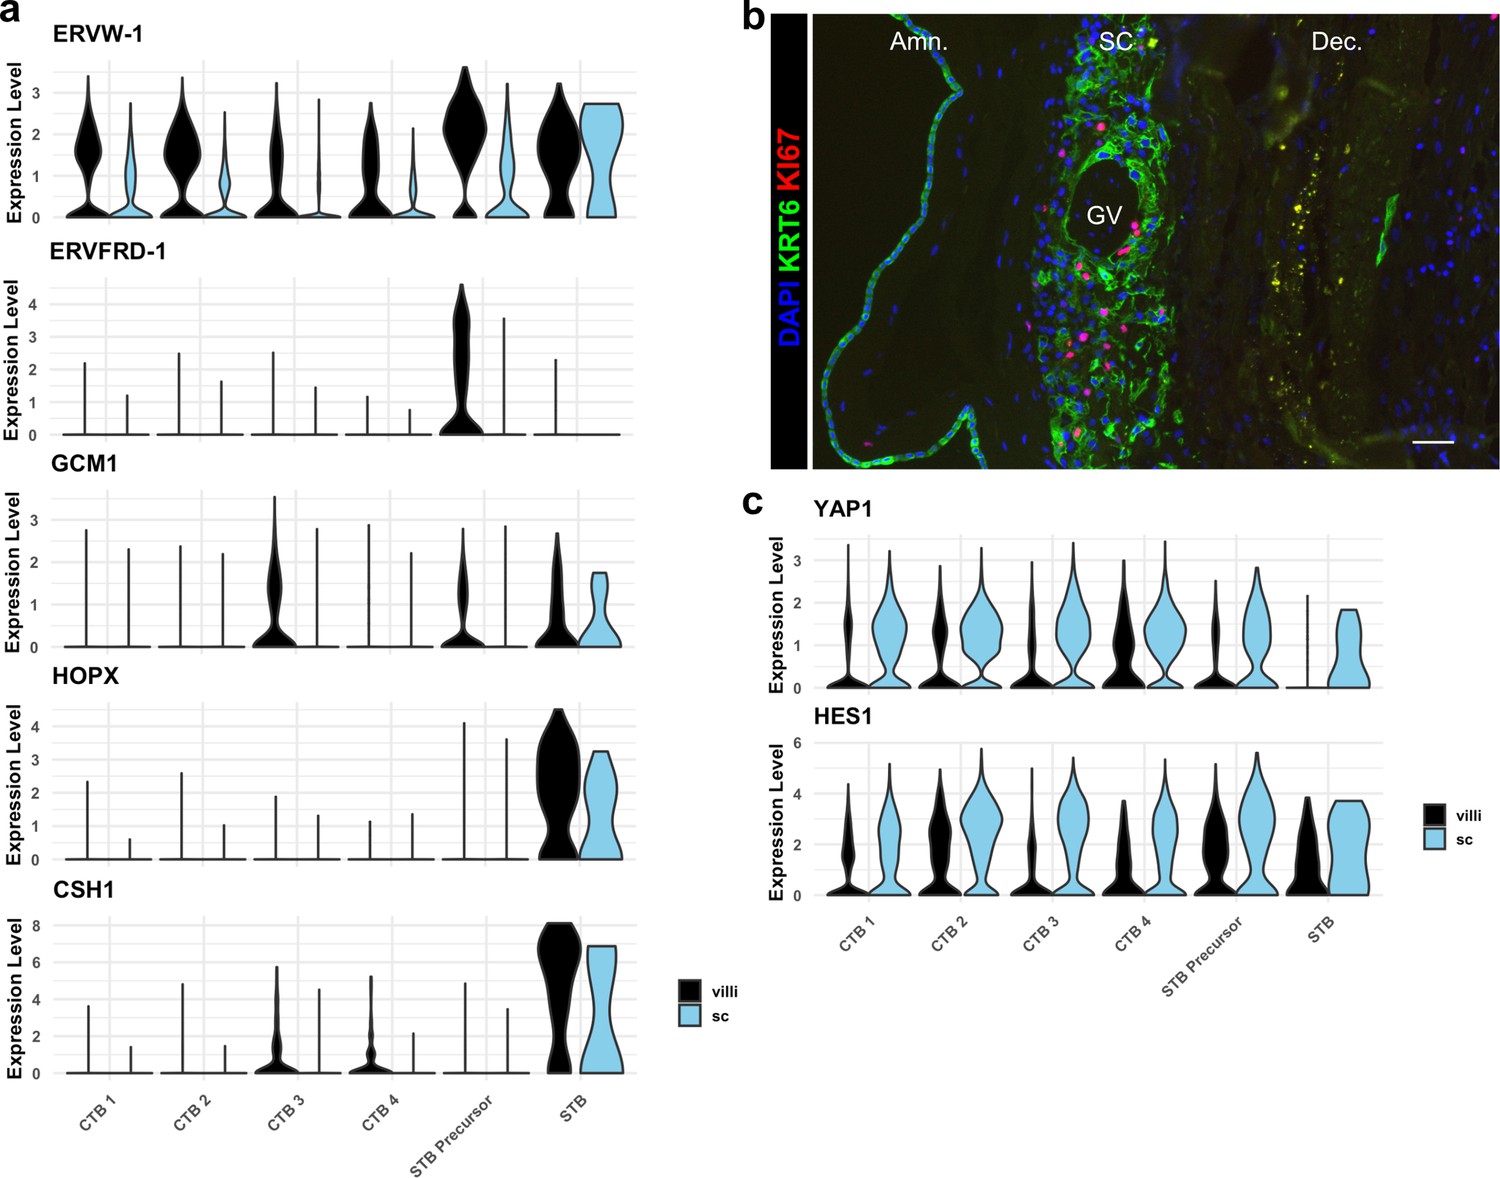
RNA velocity vector projections overlaid on to UMAPs for trophoblast cells isolated from the (a) VC and (b) SC. Arrows denote direction and magnitude is represented by line thickness. (c) Pseudotime reconstruction of SC derived CTB 1–4 clusters from the scVelo dynamical model of latent time. Each column represents one cell. Cells at the left are clustered in CTB 1 and progress through CTB 2, 3, and 4 along the x-axis. Select genes that were the major drivers of the pseudotime alignment are shown on the y-axis. Expression ranged from dark blue (lowest) to yellow (highest). (d) Violin plots of select factors from (c) demonstrated shared or region-specific expression for genes associated with the CTB 4 differentiation trajectory.
Figure 3—figure supplement 1
Smooth chorion (SC) trophoblast display reduced expression of syncytiotrophoblast (STB), increased expression of epithelial TFs, and proliferate.
(a) Violin plots of expression of markers of STB differentiation in each trophoblast cluster shown by region, demonstrating reduced expression of all markers in STB Precursor and STB clusters. (b) Immunofluorescence showing colocalization of KRT6 and KI67, demonstrating proliferation of SC-CTBs. (c) Violin plots of expression of YAP1 and HES1, demonstrating increasing expression in CTB 1–4 and greater expression in the SC compared to the villous chorion (VC).
Figure 3—figure supplement 2
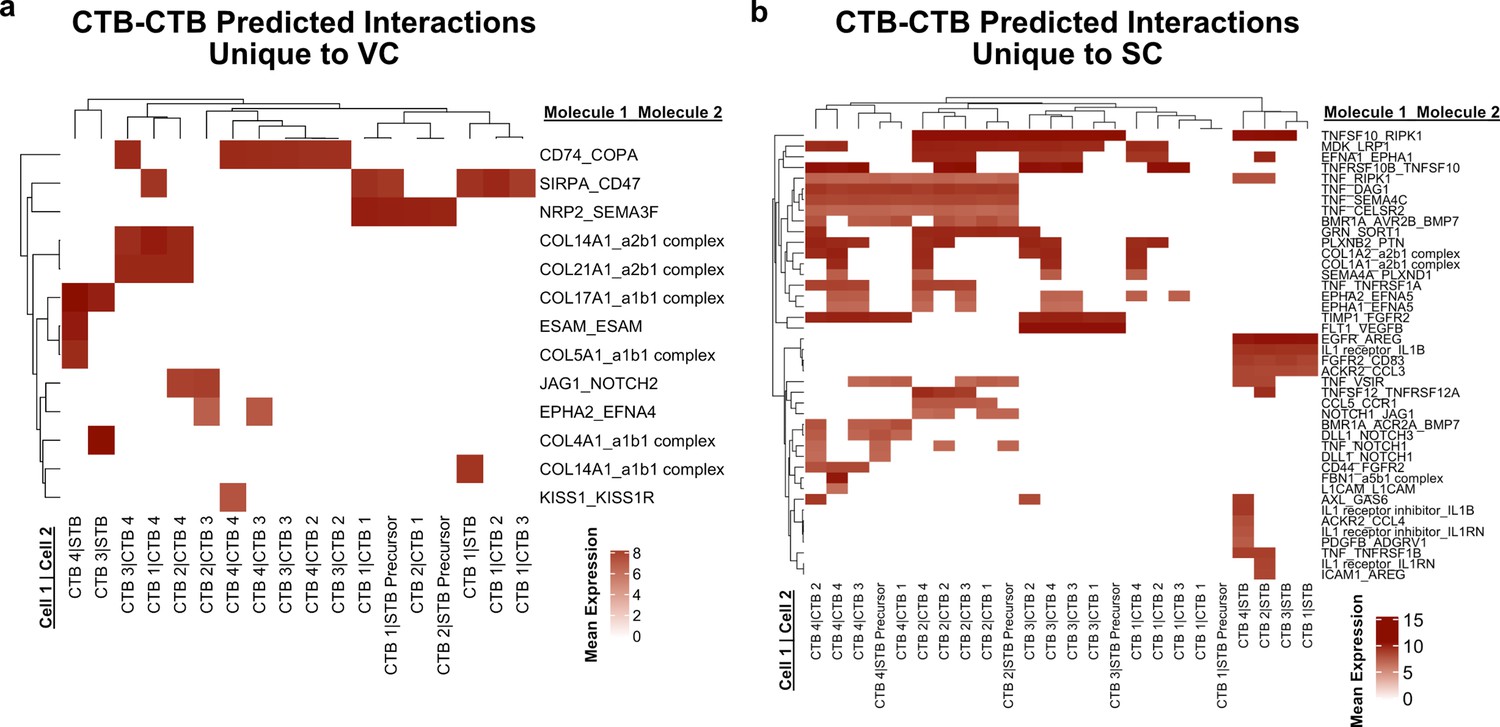
Predicted interactions between cytotrophoblasts (CTBs).
(a) Predicted receptor-ligand interactions from CellPhoneDB between CTB clusters of the villous chorion (VC) for interactions which are unique to the VC. (b) Predicted receptor-ligand interactions from CellPhoneDB between CTB clusters of the smooth chorion (SC) for interactions which are unique to the SC. The strength of interaction is estimated by mean expression and are plotted in the heatmaps. Receptor-ligand interactions and cell pairs are listed such that Molecule 1 is expressed by Cell 1 and Molecule 2 is expressed by Cell 2.
Figure 4 with 4 supplements
Smooth chorion-specific cytotrophoblasts (SC-CTBs) express a distinct epidermal transcriptional program.
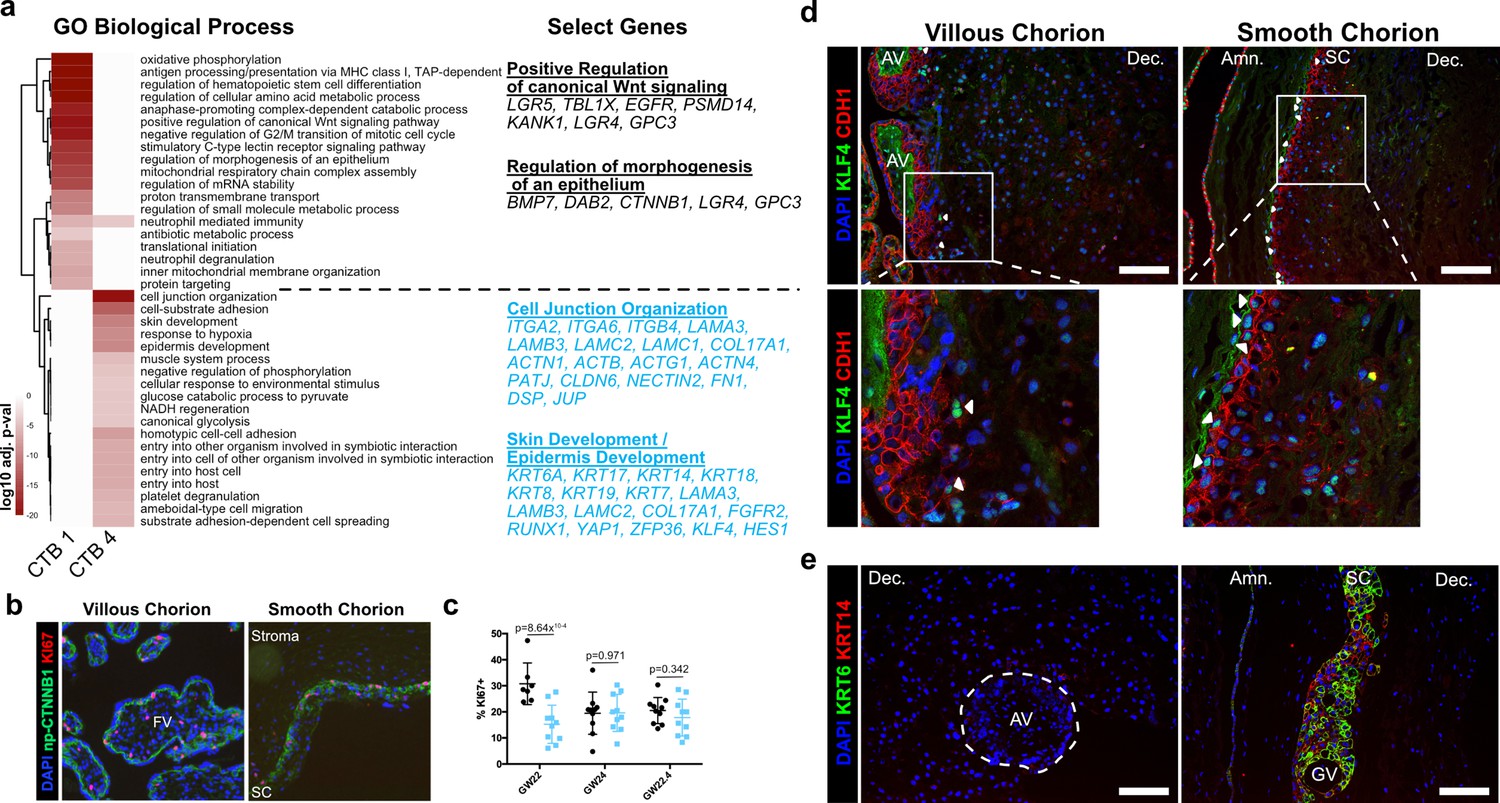
(a) Heatmap of gene ontology analysis adjusted p-values. Dark red corresponds to the lowest p-values and white represents p-values greater than 0.0005. Ontology categories are organized by hierarchical clustering along the y-axis. Marker genes for each cluster were used as inputs for the analysis. A subset of genes in selected categories are listed at the right. Categories and genes enriched in CTB 1 or CTB 4 are in black or blue, respectively. (b) Representative immunofluorescence co-localization of non-phosphorylated CTNNB1 and KI67 in the VC (left) and SC (right). (c) Quantification of the percent of np-CTNNB1 cells with KI67 expression in each region in three placental samples. Each dot represents the percentage in one field of view (at least seven per region per sample) as an estimate of mitotic cells per population. Percentages for the villous chorion (VC) region are shown in black and the SC region in blue. (d) Immunofluorescence co-localization of CDH1 and KLF4 protein in the VC (left) or SC (right). Arrowheads denote CDH1+/KLF4+ cells. (e) Immunofluorescence co-localization of KRT14 and KRT6 protein in the VC (left) or SC (right). The outline of the anchoring villi (AV) is denoted by the white dashed line. For all images, nuclei were visualized by DAPI stain; scale bar = 100 μm. Abbreviations: FV = floating villi; SC = smooth chorion epithelium; Amn. = amnion; Dec. = decidua; GV = ghost villi.
Figure 4—figure supplement 1
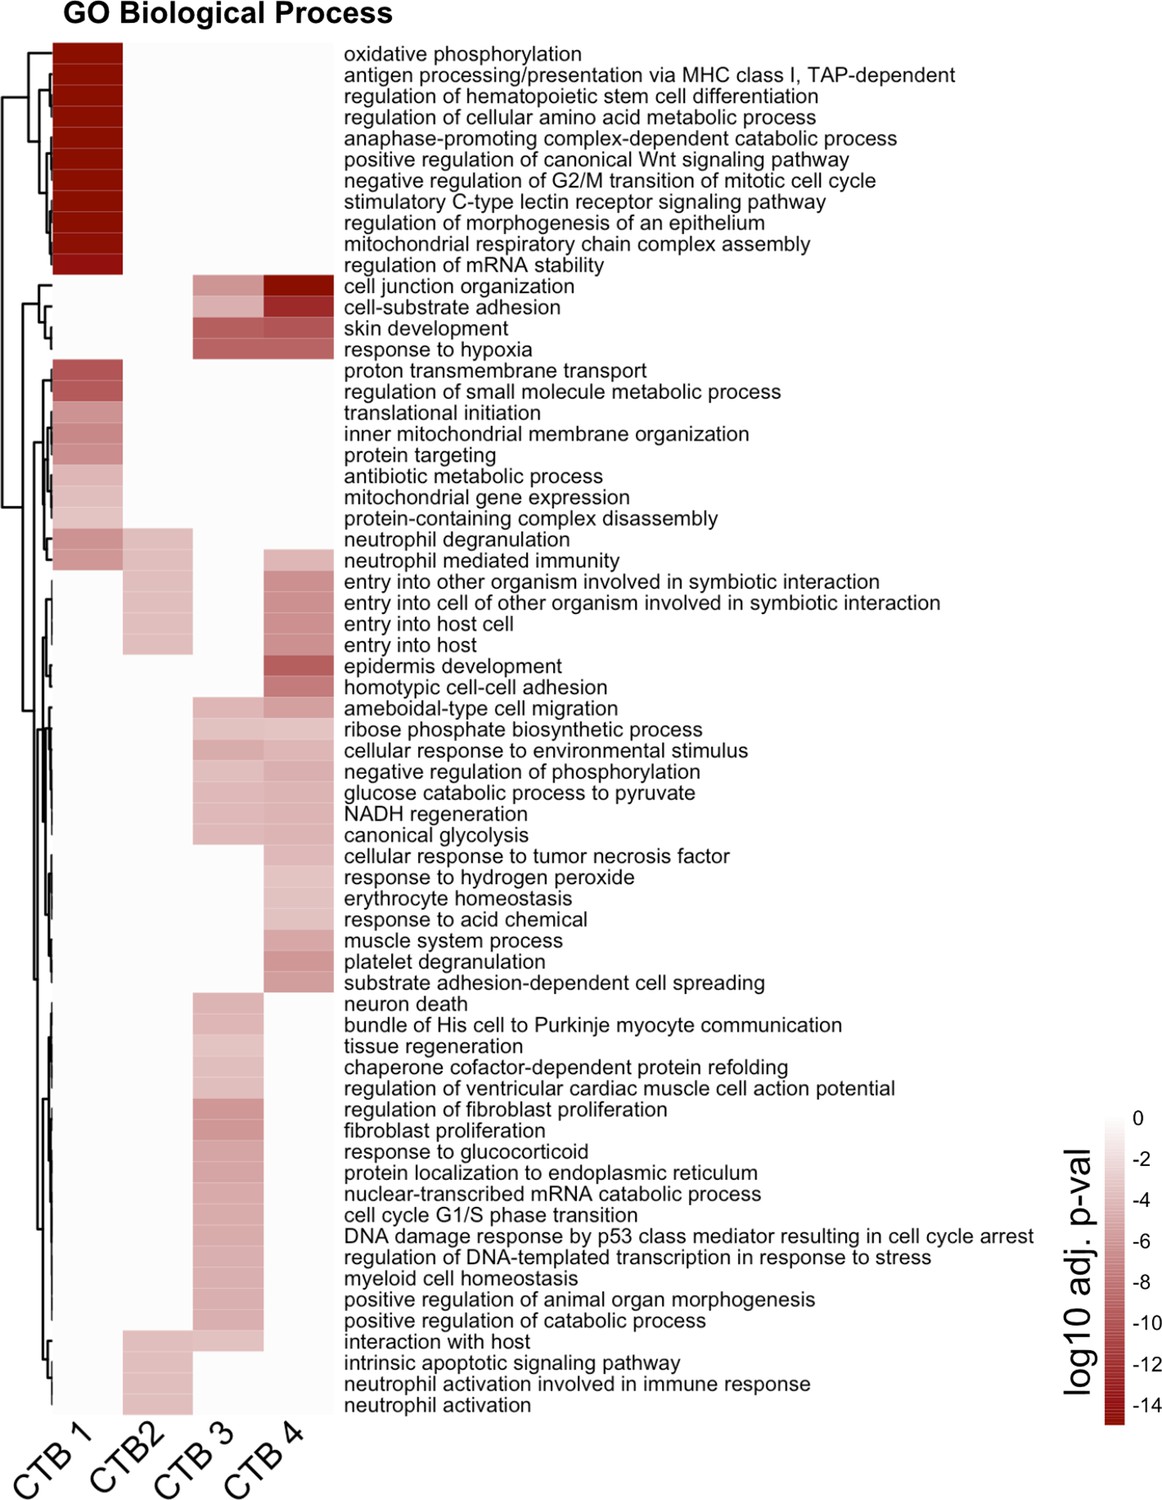
Complete cytotrophoblast (CTB) gene ontology analysis.
The unabridged gene ontology results from each CTB cluster, displayed as adjusted p-values. Dark red corresponds to the lowest p-values and white represents p-values greater than 0.0005. Ontology categories are organized by hierarchical clustering along the y-axis. Marker genes for each cluster were used as inputs for the analysis.
Figure 4—figure supplement 2

Similarities and differences between cytotrophoblast (CTB) 1 in villous chorion (VC) and SC.
(a) Immunofluorescence co-localization of CDH1 and non-phosphorylated CTNNB1 in the VC (left) and SC (right), showing identical domains of expression in both regions. For all images, nuclei were visualized by DAPI stain; scale bar = 100 μm. Abbreviations: FV = floating villi; MB = maternal blood space; SC = smooth chorion epithelium; Dec. = decidua. (b) Gene ontology analysis for CTB 1 genes common to VC and SC, genes enriched in VC, and genes enriched in SC. (c) Violin plots of genes within the gene ontology categories indicated in (b) for common categories (top), VC enriched categories (middle), and SC enriched categories (bottom).
Figure 4—figure supplement 3

Cytokeratin expression in villous (VC) and smooth chorion (SC) trophoblast.
(a) Violin plots of cytokeratins expressed in trophoblast in both VC and SC regions by cluster and region of origin. (b) Violin plots of cytokeratins expressed in SC trophoblast by cluster and region of origin.
Figure 4—figure supplement 4
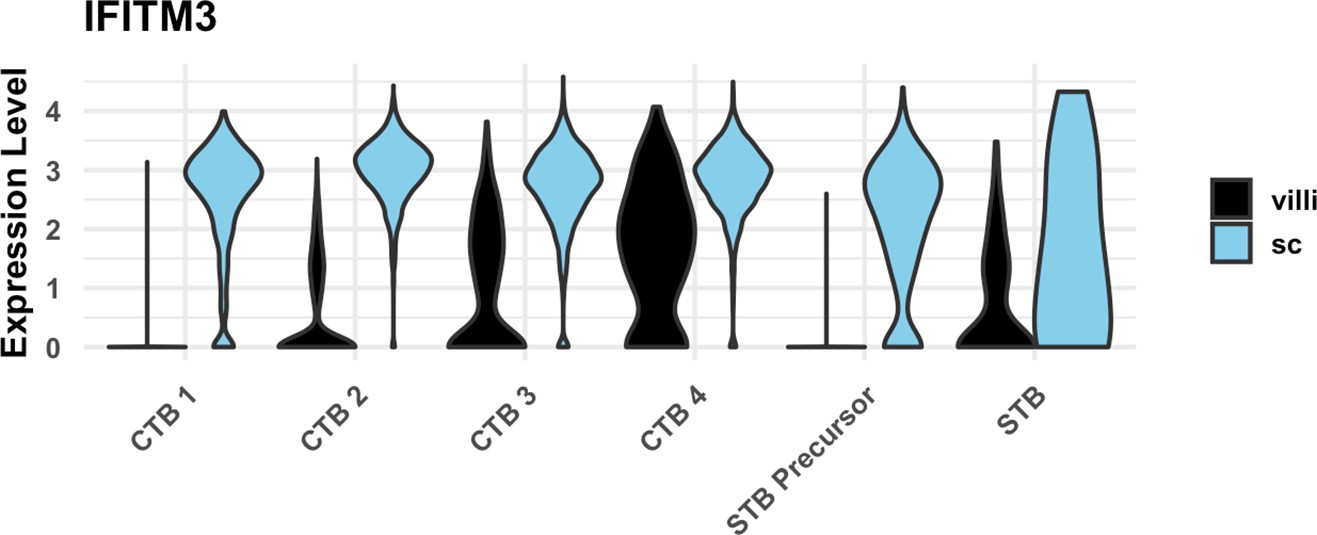
IFITM3 expression in cytotrophoblast (CTB) populations.
Violin plot of IFITM3 expression in trophoblast clusters by region, showing increased expression in smooth chorion (SC) compared to villous chorion (VC).
Figure 5 with 3 supplements

Extravillous trophoblasts (EVTs) of the villous chorion (VC) and SC regions display distinct invasive activity but are transcriptionally similar.
(a) Expression of HLA-G transcript per cell projected in UMAP space for the VC (left) and SC (right). Expression ranged from low in light gray to high in dark red. (b) Immunofluorescence localization of HLA-G in the VC (left) and SC (right). The anchoring villi (AV) are outlined in white (left). The boundaries of the smooth chorion epithelium are denoted by the white lines (right). (c) Quantification of the number of HLA-G expressing extravillous trophoblast (EVT) (left) and the percent of total trophoblast that express HLA-G (right) for each chorionic region. (d) UMAP of all trophoblast cells including the EVT clusters (left). The percent of EVT cells in each cluster from each region (right). (e) Volcano plot of the differentially expressed genes between regions for all EVTs. All genes with a log fold change greater than an absolute value of 0.25 and a p-value of less than 0.05 were plotted. Those with greater expression in VC EVT are shown in black. Those with greater expression in SC EVT are shown in blue. (f) Immunofluorescence localization of CSH1 in the VC (top) and SC (bottom). Arrowheads denote CSH1 expressing cells. (g) Violin plots of the number of differentially expressed genes between 100 cells from each chorionic region within each cluster (100 permutations). Clusters with less than 100 cells per region were omitted due to the small sample size. For all images, nuclei were visualized by DAPI stain; scale bar = 100 μm. Abbreviations: FV = floating villi; SC = smooth chorion epithelium; Amn. = amnion; Dec. = decidua; STB = syncytiotrophoblast; CC = cell column.
-
Figure 5—source data 1
EVT 1 cluster differentially expressed genes between regions.
- https://cdn.elifesciences.org/articles/78829/elife-78829-fig5-data1-v2.csv
-
Figure 5—source data 2
EVT 2 cluster differentially expressed genes between regions.
- https://cdn.elifesciences.org/articles/78829/elife-78829-fig5-data2-v2.csv
-
Figure 5—source data 3
EVT 3 cluster differentially expressed genes between regions.
- https://cdn.elifesciences.org/articles/78829/elife-78829-fig5-data3-v2.csv
-
Figure 5—source data 4
EVT 4 cluster differentially expressed genes between regions.
- https://cdn.elifesciences.org/articles/78829/elife-78829-fig5-data4-v2.csv
Figure 5—figure supplement 1
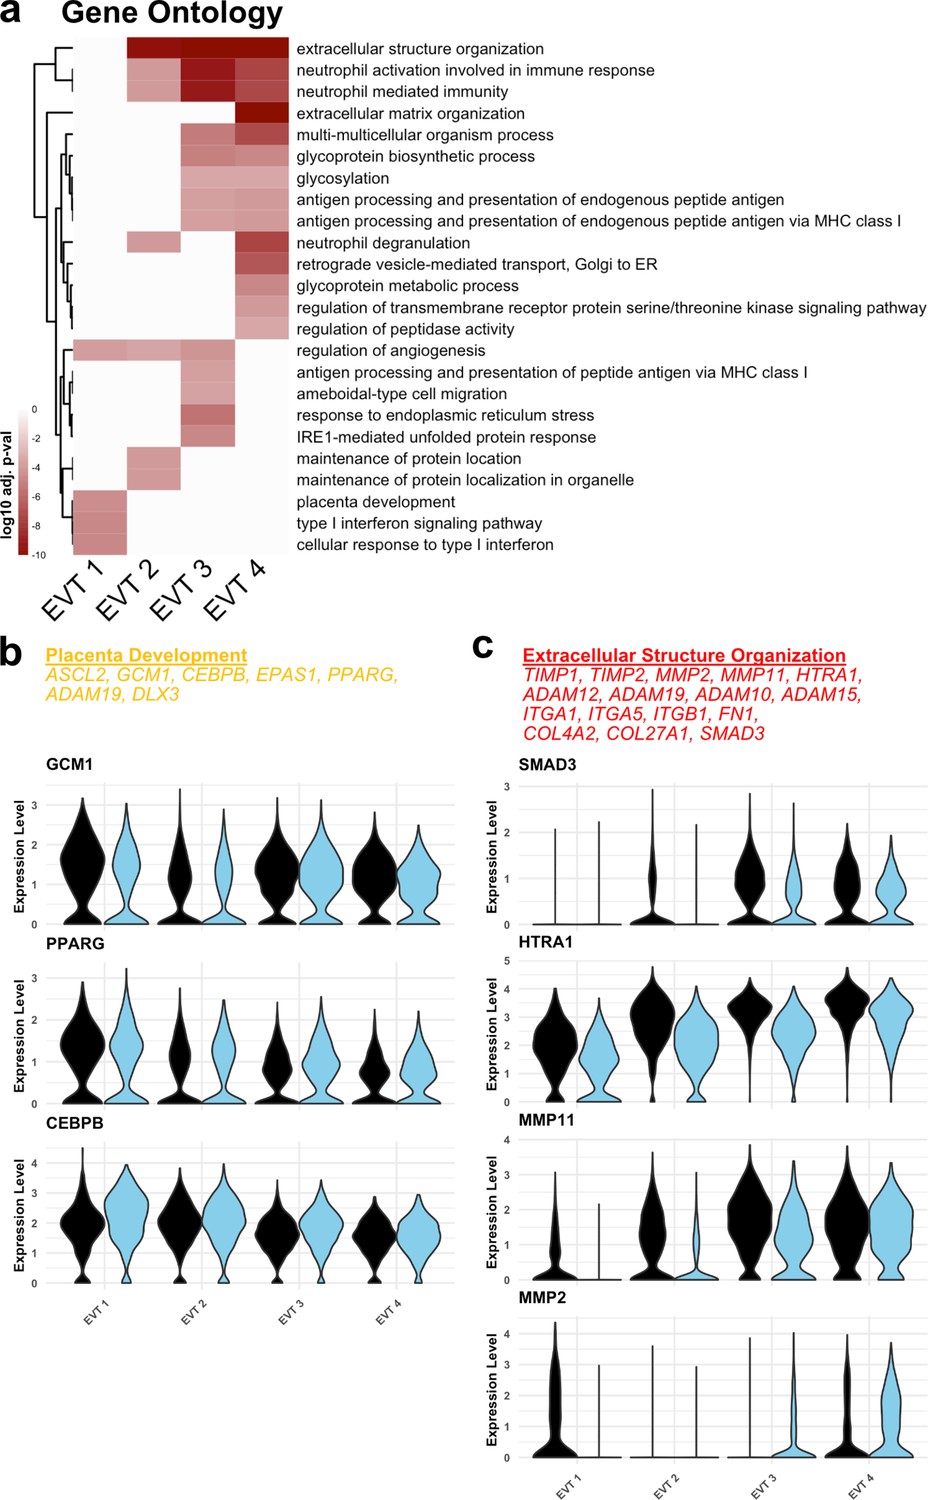
Functional annotation of extravillous trophoblast (EVT) clusters.
(a) Gene ontology results from each EVT cluster displayed as adjusted p-values. Dark red corresponds to the lowest p-values and white represents p-values greater than 0.0005. Ontology categories are organized by hierarchical clustering along the y-axis. Marker genes for each cluster were used as inputs for the analysis. (b) Selected genes in the ‘placenta development’ gene ontology category (top). Violin plots of expression for selected genes in each EVT cluster by region. (c) Selected genes in the ‘Extracellular Structure Organization’ gene ontology category (top). Violin plots of expression for selected genes in each EVT cluster by region.
Figure 5—figure supplement 2

Differential expression between extravillous trophoblasts (EVT) from villous (VC) and smooth chorion (SC).
(a) Volcano plots showing the differentially expressed genes the VC or SC for each EVT cluster. Only significantly differentially expressed genes are plotted (p-value < 0.05). Genes with higher expression in VC compared to SC are shown in black. Genes with higher expression in SC compared to VC are shown in blue. Selected differentially expressed genes are labelled. (b) Violin plots of VC-specific genes in EVTs. (c) Spearman correlation coefficients between VC and SC for each cluster ranked from greatest to least similarity across regions. Syncytiotrophoblast (STB) and EVT Precursor populations are excluded due to the low number of cells recovered in the SC.
Figure 5—figure supplement 3
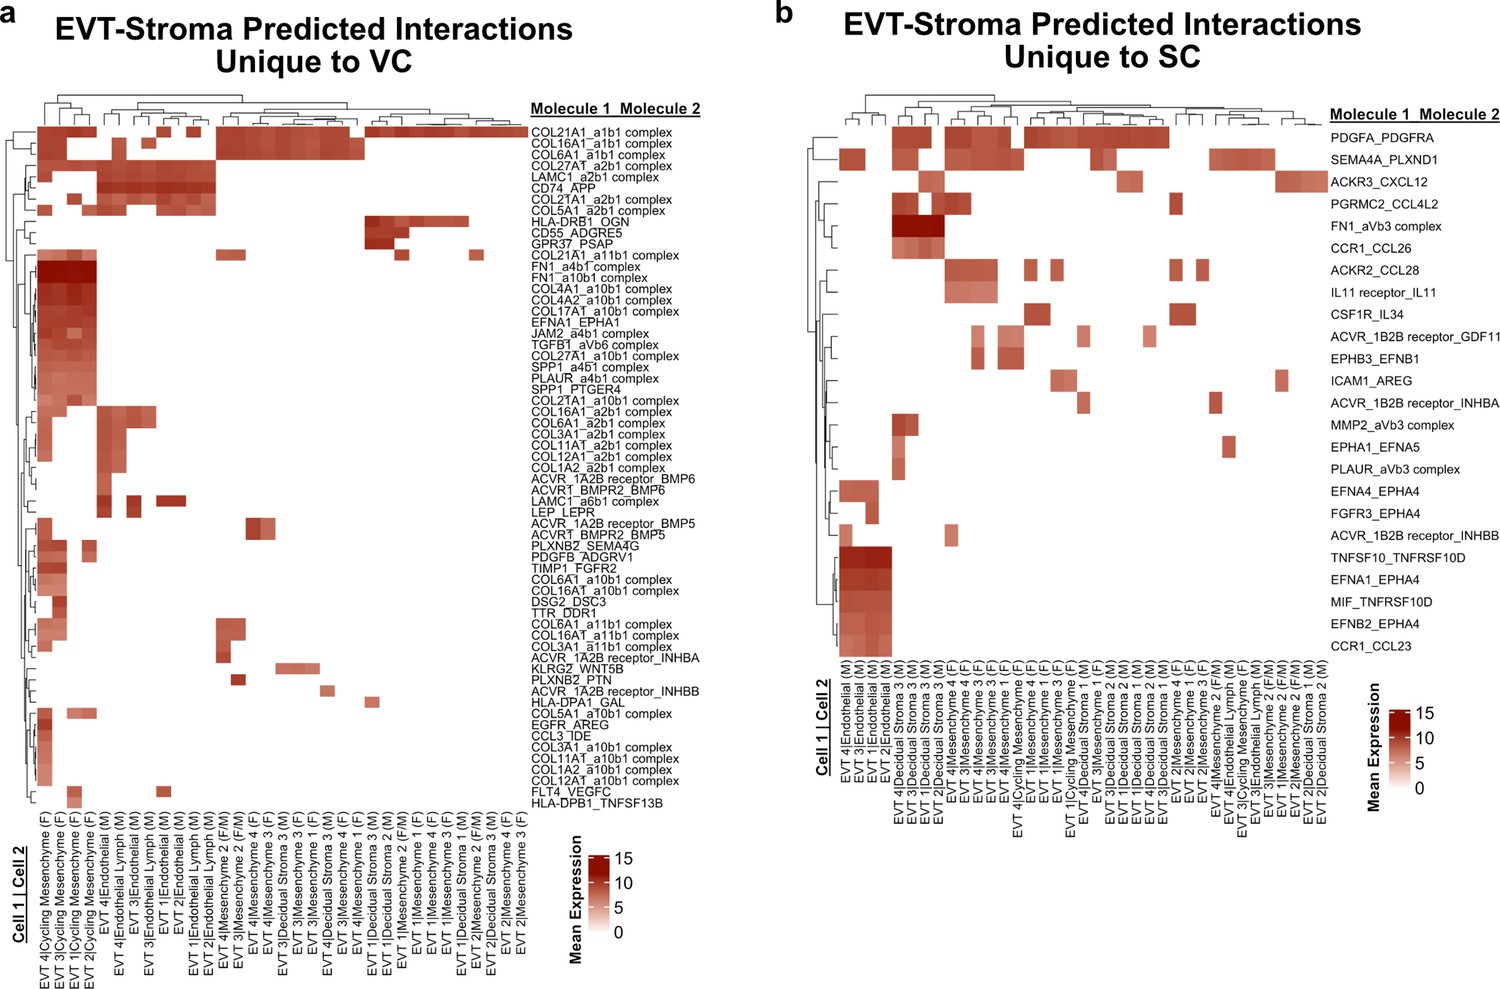
Predicted interactions between extravillous trophoblast (EVT) and stromal cells.
(a) Predicted receptor-ligand interactions from CellPhoneDB between EVT-Stromal cells of the villous chorion (VC) for interactions which are unique to the VC. (b) Predicted receptor-ligand interactions from CellPhoneDB between EVT-Stromal cells of the smooth chorion (SC) for interactions which are unique to the SC. The strength of interaction is estimated by mean expression and are plotted in the heatmaps. Receptor-ligand interactions and cell pairs are listed such that Molecule 1 is expressed by Cell 1 and Molecule 2 is expressed by Cell 2.
Figure 6 with 4 supplements
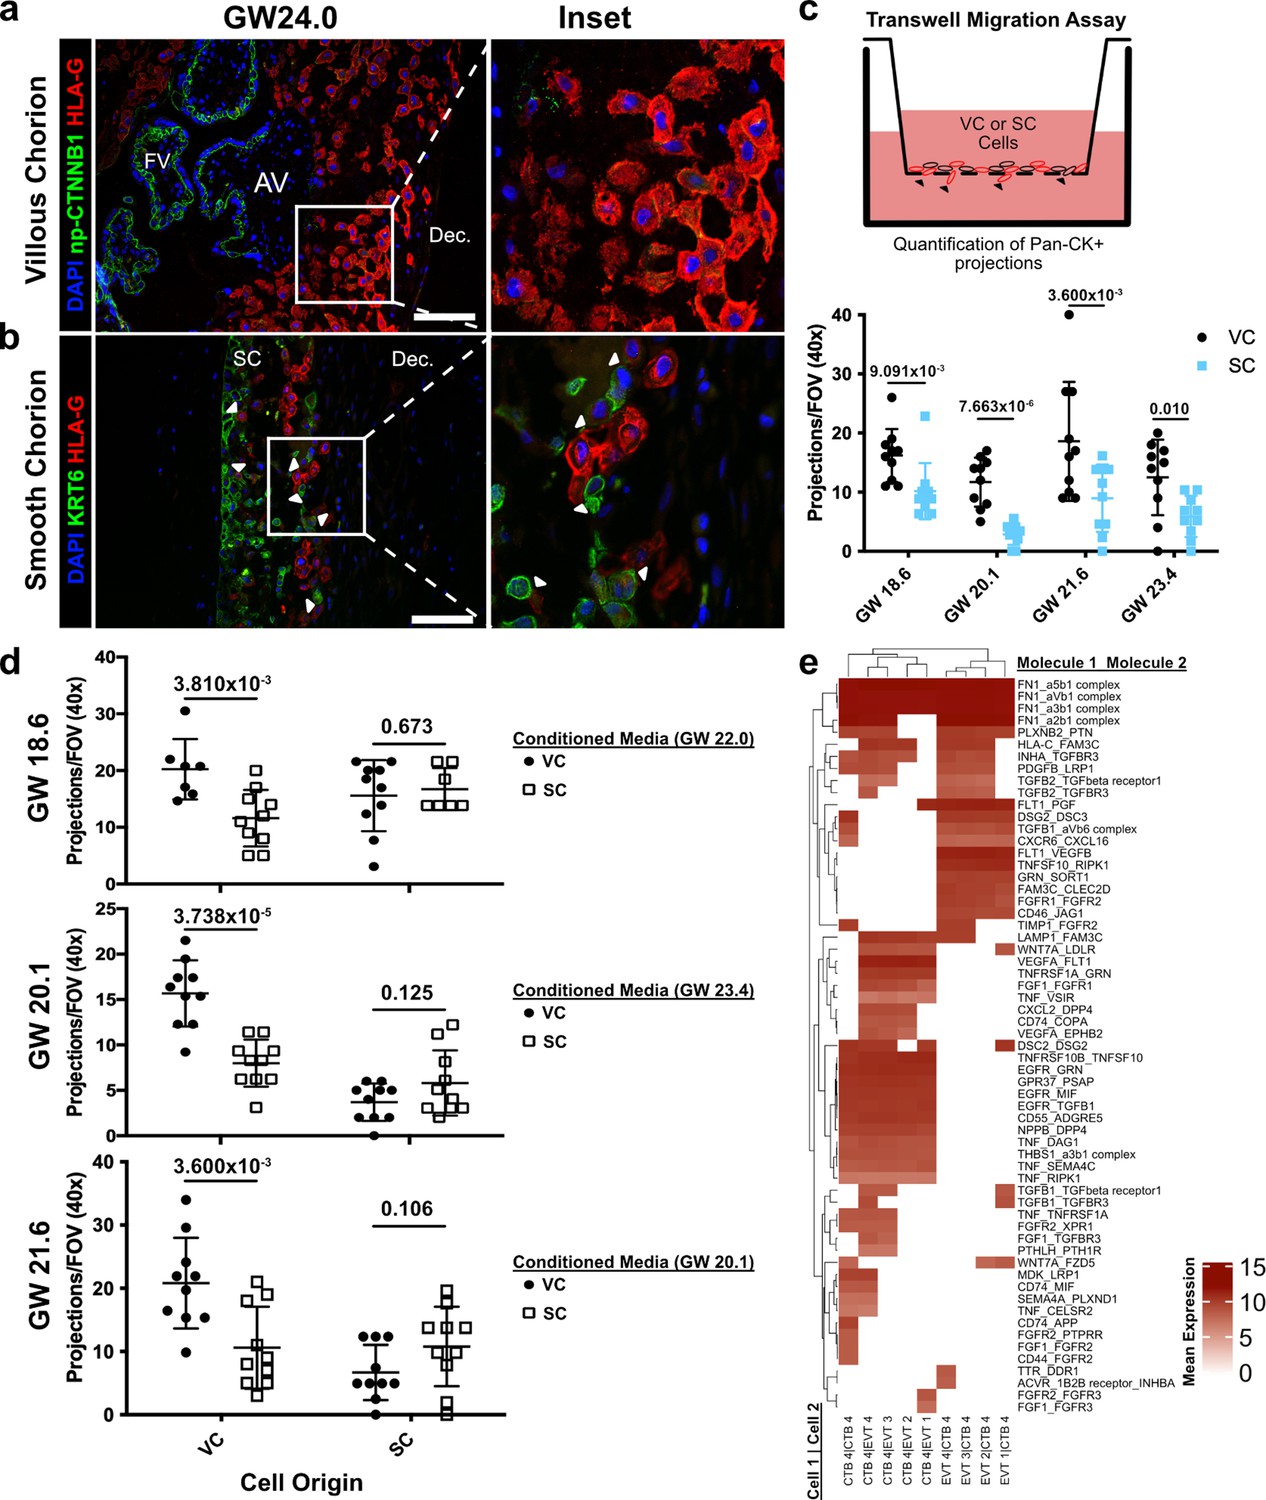
Cytotrophoblasts (CTBs) of the SC inhibit extravillous trophoblast (EVT) invasion.
(a) Immunofluorescence co-localization of np-CTNNB1 and HLA-G in the VC. (b) Immunofluorescence co-localization of KRT6 and HLA-G in the SC. Arrowheads denote CTB and EVT interactions. (c) Schematic of the transwell invasion assay (top). Cells from either chorionic region were plated in the upper chamber of the transwell. After 39 hr of culture, the transwell membrane was fixed and stained with a Pan-cytokeratin antibody. The projections through the membrane are denoted by black arrowheads and quantified below. Results from the VC derived cells are shown in black, and the results from the SC derived cells are shown in blue. (d) Results from three biological replicates from each chorionic region cultured with conditioned medium from either VC or SC cells. The gestational ages of the plated cells are shown adjacent to the y-axis. The gestational ages of the cells from which conditioned medium was collected are noted in the legends at the right. The results for cells cultured with VC cell conditioned medium are denoted by black dots, and the results for those cultured in SC cell conditioned medium are denoted by open squares. p-Values were determined by t-test and are listed above each comparison. (e) Predicted receptor-ligand interactions from CellPhoneDB. The strength of interaction is estimated by mean expression and is plotted in the heatmap. Receptor-ligand interactions and cell pairs are listed such that Molecule 1 is expressed by Cell 1 and Molecule 2 is expressed by Cell 2. For all images, nuclei were visualized by DAPI staining; scale bar = 100 μm. Abbreviations: AV = anchoring villi; FV = floating villi; SC = smooth chorion epithelium; Dec. = decidua.
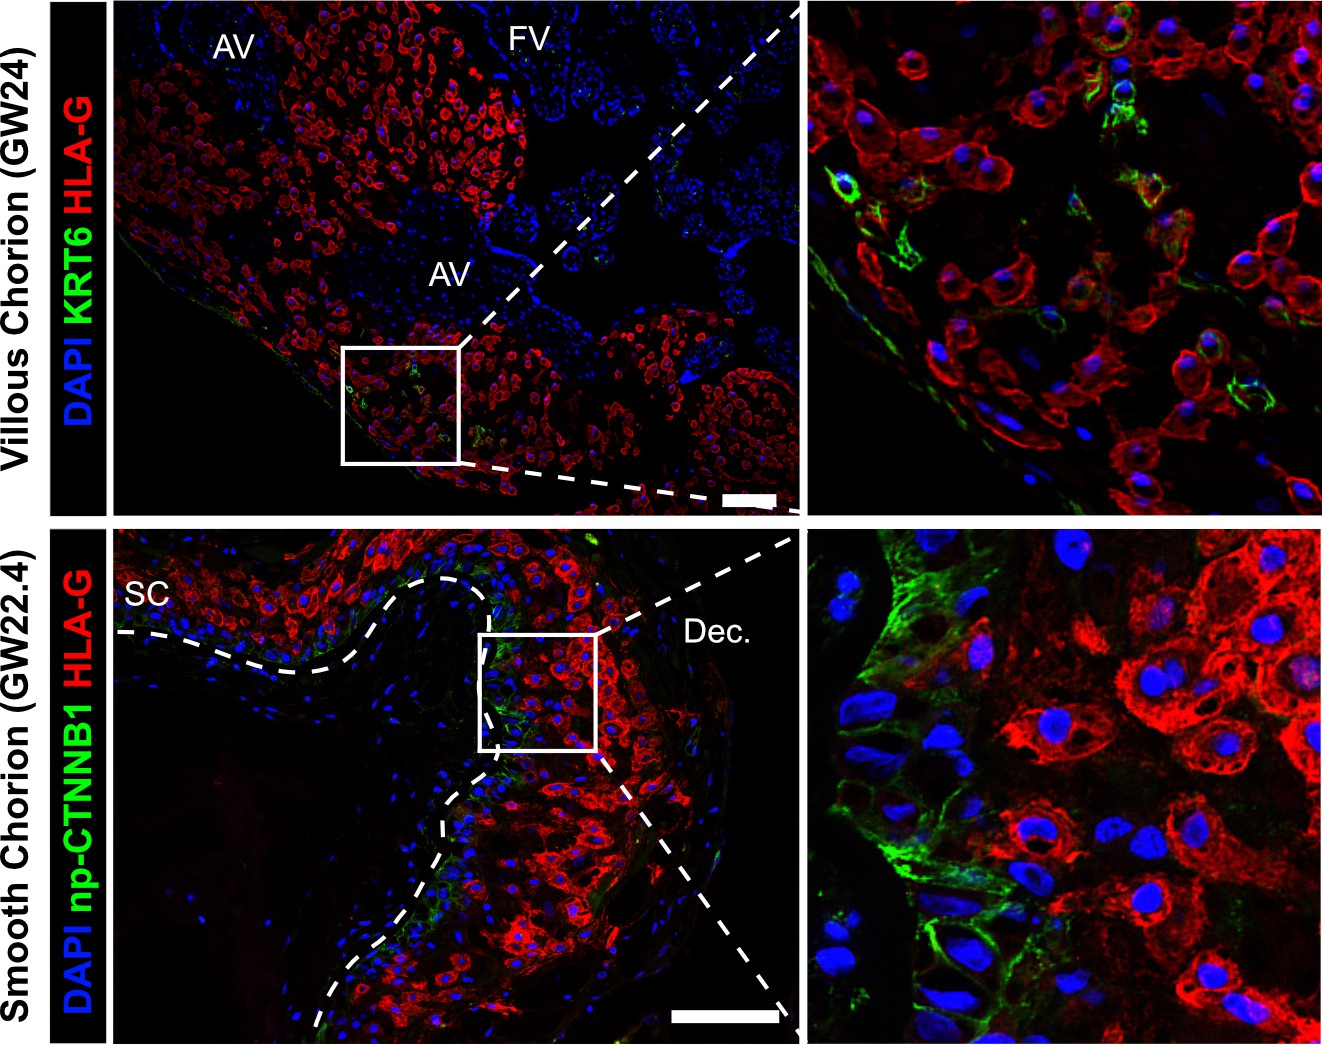
Figure 6—figure supplement 1
Cytotrophoblast (CTB)-extravillous trophoblasts (EVT) interactions in the villous chorion (VC) or SC region.
Co-localization of KRT6 (SC-CTB marker) and HLA-G (EVT marker) showing rare KRT6+ cells in the VC (top). These cells are few and do not interact with EVT in the same manner as was observed in the SC. Co-localization of non-phosphorylated CTNNB1 (CTB 1 marker) and HLA-G (EVT marker) in the SC (bottom). Limited interactions between these populations was observed. The basal lamina separating the fetal stroma from the SC epithelium is marked by the white dashed line. For all images, nuclei were visualized by DAPI stain; scale bar = 100 μm. Abbreviations: AV = anchoring villi; FV = floating villi; SC = smooth chorion epithelium; Dec. = decidua.
Figure 6—figure supplement 2
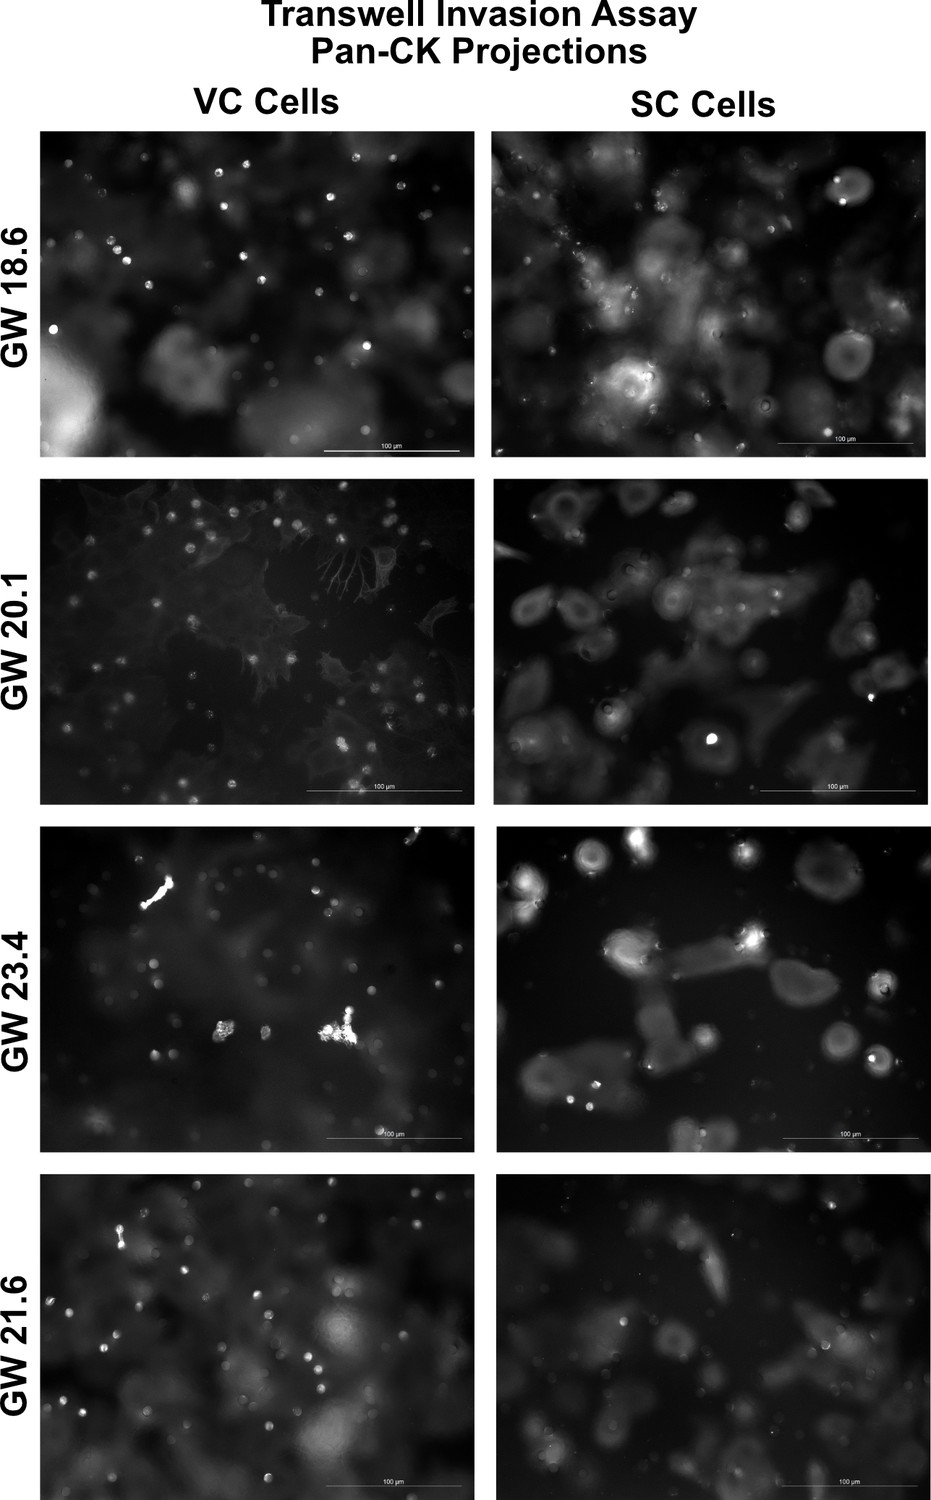
Representative images of the transwell invasion assay.
Representative images of trophoblast projections through the transwell filter are seen as white dots. For quantification, the number of projections (white bright dots) was counted. For each sample, the median DAPI area was quantified across the transwell membrane, and then the projections multiplied by a factor to normalize for cell density. Scale bar = 100 μm.
Figure 6—figure supplement 3
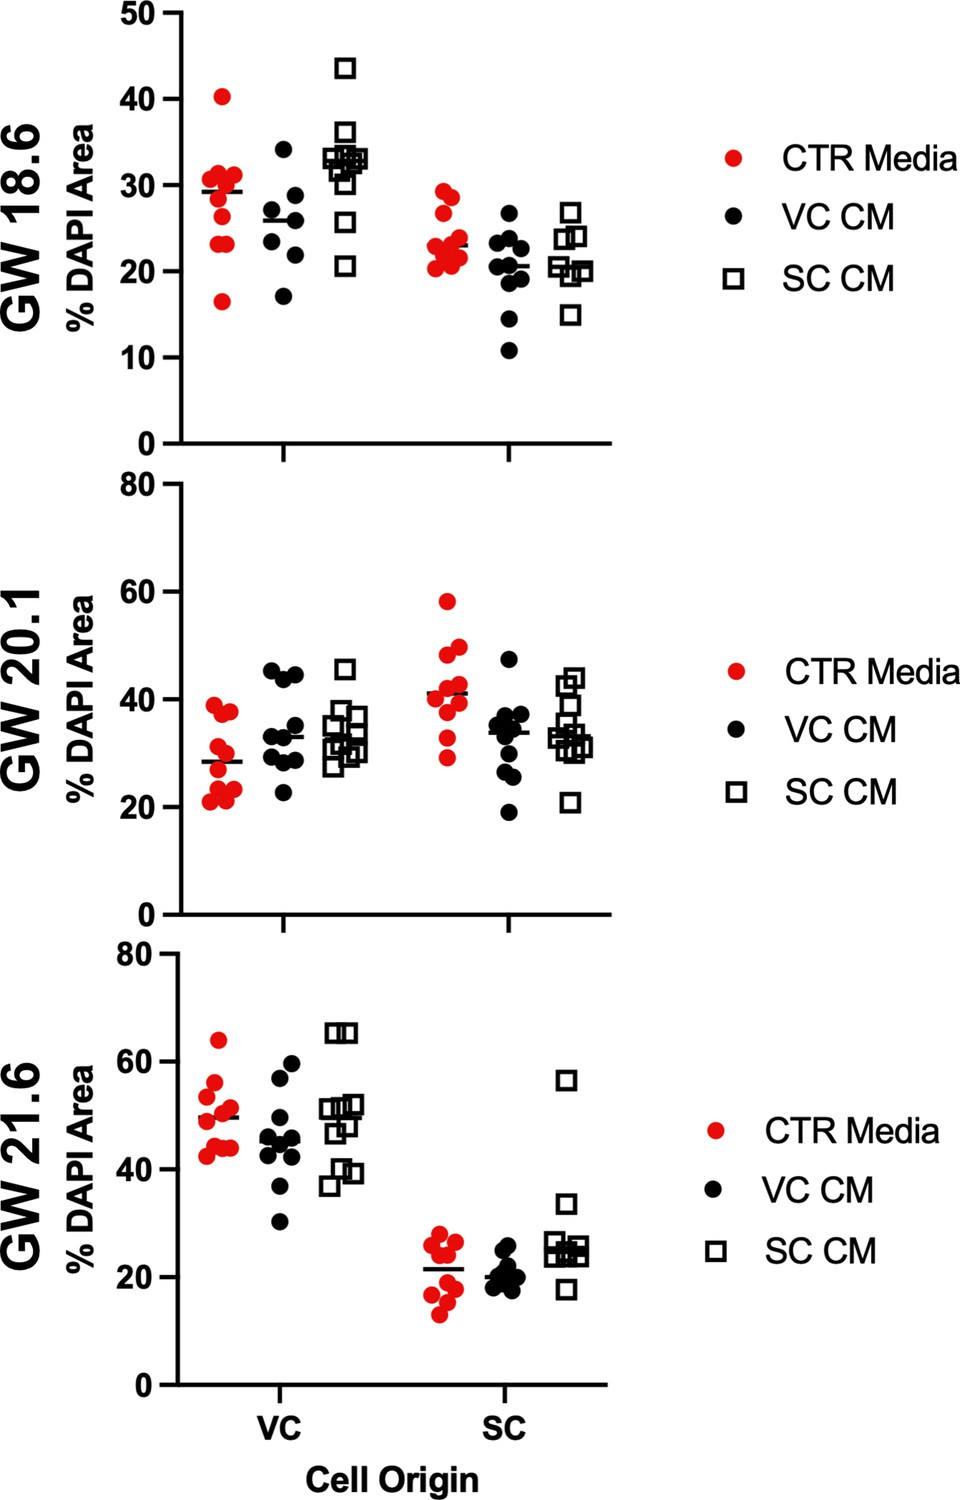
Cell density is not correlated with culture in conditioned media.
The DAPI+ area in each field of view was quantified and plotted as a measure of cell density. Each dot represents the percent area of the field of view which stained with DAPI. Measurements from each experiment are shown and the gestational ages of the cultured cells is on the y-axis at the left. Measurements of cells treated with control media (Serum Free Media) are shown in red, VC cell conditioned media are shown in black, and smooth chorion (SC) cell conditioned media are shown in open squares.
Figure 6—figure supplement 4

Complete predicted interactions between cytotrophoblast (CTB)-extravillous trophoblast (EVT) in the smooth chorion (SC).
(a) Predicted receptor-ligand interactions from CellPhoneDB between CTB-EVT and the SC. The strength of interaction is estimated by mean expression and is plotted in the heatmaps. Receptor-ligand interactions and cell pairs are listed such that Molecule 1 is expressed by Cell 1 and Molecule 2 is expressed by Cell 2.
Tables
Key resources table
| Reagent type(species) or resource | Designation | Source or reference | Identifiers | Additional information |
|---|---|---|---|---|
| Antibody | Rat anti E-cadherin Monoclonal Antibody (ECCD-2) | Thermofisher Scientific | 13-1900 | IF (1:250) |
| Antibody | Rabbit Anti-PAGE4 antibody (Polyclonal) | Sigma-Aldrich | HPA023880 | IF (1:100) |
| Antibody | Rabbit Recombinant Anti-Cytokeratin 6 Monoclonal antibody [EPR1603Y] | Abcam | ab52620 | IF (1:100) |
| Antibody | Rabbit anti Non-phospho (Active) β-Catenin (Ser33/37/Thr41) Monoclonal Antibody | Cell Signaling | 8814 | IF (1:100) |
| Antibody | Mouse anti Cytokeratin 14 Monoclonal Antibody (LL002) | Invitrogen | MA5-11599 | IF (1:100) with Antigen Retrieval |
| Antibody | Rabbit Anti-KLF4 antibody (polyclonal) | Sigma-Aldrich | HPA00292 | IF (1:100) |
| Antibody | Rat anti Cytokeratin (7D3) Monoclonal Antibody | Susan Fisher/University of California, San Francisco Cat# Fisher_001-clone7D3,RRID:AB_2631235 | AB_2631235 | IF (1:100) |
| Antibody | Mouse anti HLA-G (4H84) Monoclonal Antibody | Susan Fisher/University of California, San Francisco Cat# Fisher_002-clone4H84, RRID:AB_2631236 | AB_2631236 | IF (1:20) with Antigen Retrieval |
| Software, algorithm | R | https://www.r-project.org/ | ||
| Software, algorithm | ImageJ | ImageJ (http://imagej.nih.gov/ij/) | ||
| Software, algorithm | Seurat (3.1.3) | https://satijalab.org/seurat/ | ||
| Software, algorithm | cellranger (3.0.2) | https://support.10xgenomics.com/single-cell-gene-expression/software/pipelines/latest/feature-bc | ||
| Software, algorithm | ClusterProfiler | https://guangchuangyu.github.io/software/clusterProfiler/ | ||
| Software, algorithm | scVelo | https://github.com/theislab/scvelo (Marsh, 2022b) copy archived at swh:1:rev:1805ab4a72d3f34496f0ef246500a159f619d3a2 | ||
| Software, algorithm | Prism 6.0 | https://www.graphpad.com/scientific-software/prism/ | ||
| Software, algorithm | DoubletFinder | https://github.com/chris-mcginnis-ucsf/DoubletFinder (Marsh, 2022c) copy archived at swh:1:rev:67fb8b5808eb16167ead5f9b439677cc24837554 |
Additional files
-
Supplementary file 1
Number of cells captured from each region per cluster for the trophoblast dataset.
- https://cdn.elifesciences.org/articles/78829/elife-78829-supp1-v2.xlsx
-
MDAR checklist
- https://cdn.elifesciences.org/articles/78829/elife-78829-mdarchecklist1-v2.docx
Download links
A two-part list of links to download the article, or parts of the article, in various formats.
Downloads (link to download the article as PDF)
Open citations (links to open the citations from this article in various online reference manager services)
Cite this article (links to download the citations from this article in formats compatible with various reference manager tools)
Regionally distinct trophoblast regulate barrier function and invasion in the human placenta
eLife 11:e78829.
https://doi.org/10.7554/eLife.78829


