Functional coupling between TRPV4 channel and TMEM16F modulates human trophoblast fusion
- Department of Biochemistry, Duke University Medical Center, United States
- Department of Molecular Genetics and Microbiology, Duke University Medical Center, United States
- Department of Obstetrics and Gynecology, Duke University Medical Centre, United States
- MOE-Shanghai Key Laboratory of Children's Environmental Health, Xinhua Hospital, China
- Department of Neurology, Duke University Medical Center, United States
- Department of Anesthesiology, Duke University Medical Center, United States
- Department of Neurobiology, Duke University Medical Center, United States
- College of Dentistry, Department of Molecular Pathobiology, NYU, United States
- Duke Human Vaccine Institute, Duke University, United States
Figures
Figure 1 with 5 supplements
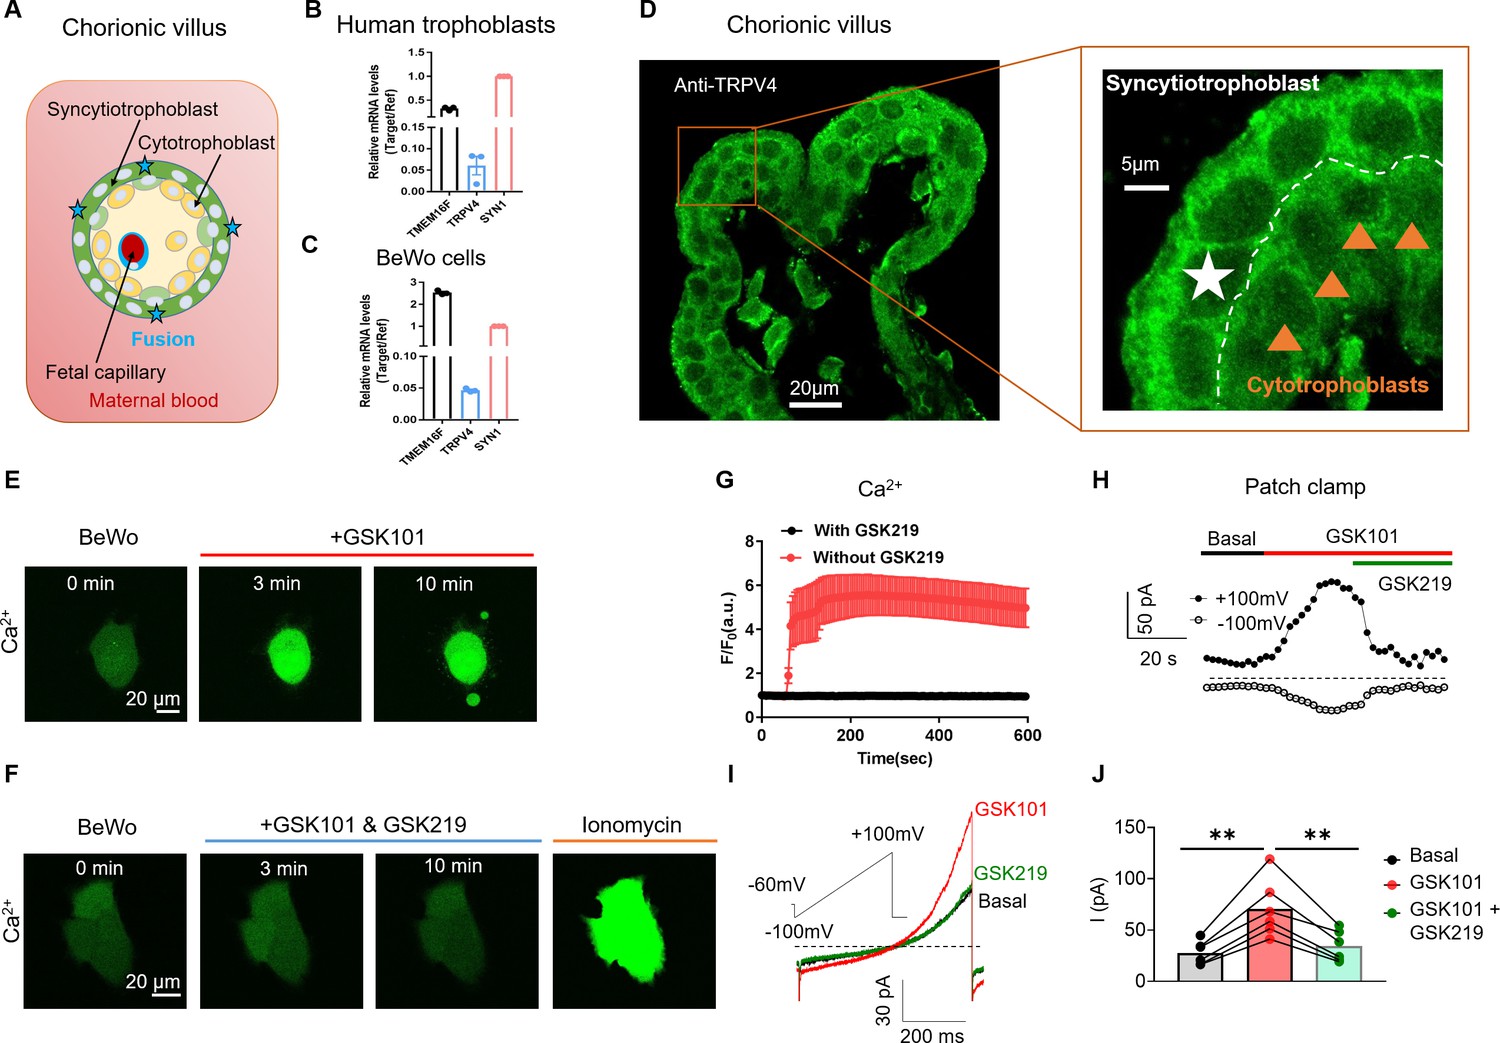
TRPV4 is functionally expressed in human trophoblasts.
(A) Schematic of the first trimester placental villus and trophoblast fusion. (B, C) qRT-PCR of TRPV4 in primary human trophoblasts (B) and BeWo cells (C). All genes were normalized to GAPDH and then normalized to Syncytin-1 (SYN1) (n=3). (D) Representative immunofluorescence of TRPV4 (green) and nuclei (blue) in a human first trimester placenta villus (cross-section). TRPV4 is expressed in both cytotrophoblasts and syncytiotrophoblasts. (E) GSK1016790A (GSK101, 20 nM), a specific TRPV4 agonist, triggers robust intracellular Ca2+ elevation in BeWo cells. (F) GSK2193874 (GSK219, 500 nM), a selective TRPV4 antagonist, abolishes GSK101-induced Ca2+ influx through TRPV4 channels in BeWo cells. Ca2+ elevation through ionomycin is intact in the presence of GSK219. All fluorescence images in (D–F) are the representatives of at least three biological replicates. (G) Summary of GSK101 (n=4) and GSK219 (n=5) effects on BeWo cell Ca2+ dynamics measured by Ca2+ dye (Calbryte 520). (H) Time course of outside-out currents elicited in response to 30 nM GSK101 with and without 500 nM GSK219. Current was elicited by a 500-ms ramp voltage protocol from –100 to +100 mV. The holding potential was set at –60 mV. (I) Representative current traces in the presence of GSK101 and GSK219+GSK101 from (H). (J) Quantification of GSK101-induced current in BeWo cells using the same voltage protocol in (H). Values represent mean ± SEM and statistics were done using Student’s t-test (n=5 for each group, **: p<0.01).
-
Figure 1—source data 1
This data is from the Human Protein Atlas V20.1.proteinatlas.org.V20.1.proteinatlas.org.
- https://cdn.elifesciences.org/articles/78840/elife-78840-fig1-data1-v2.xlsx
Figure 1—figure supplement 1
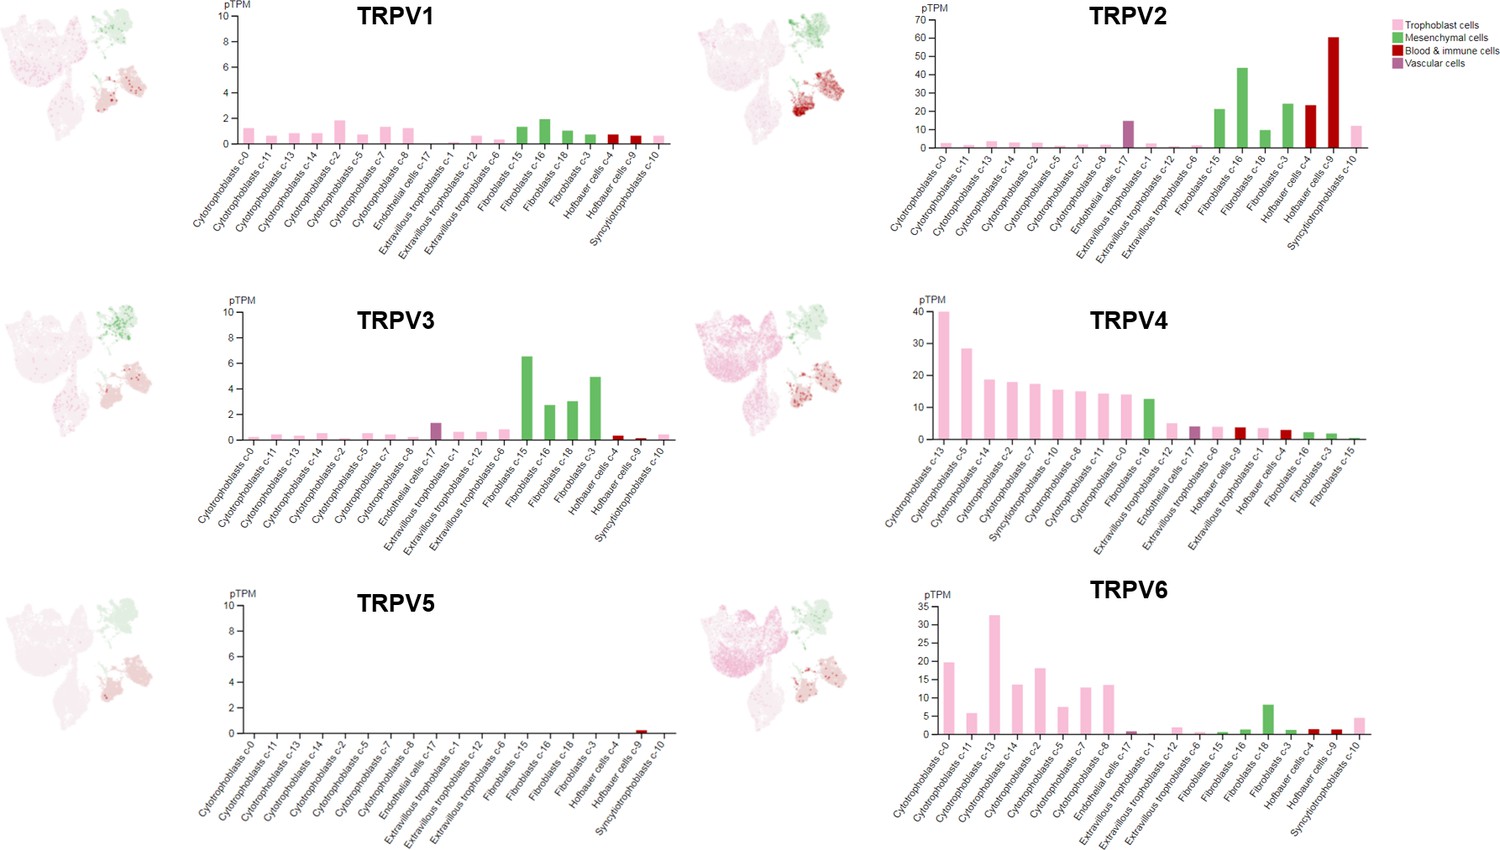
Single-cell RNA sequencing results of TRPV channel genes in different cell types from human placentas.
UMAP plots (left) illustrate single-cell RNA expression profiles in different cell types, and bar graphs (right) show pTPM levels in each single cells cluster. All the data were from the Human Protein Atlas V20.1. proteinatlas.org.
Figure 1—figure supplement 2
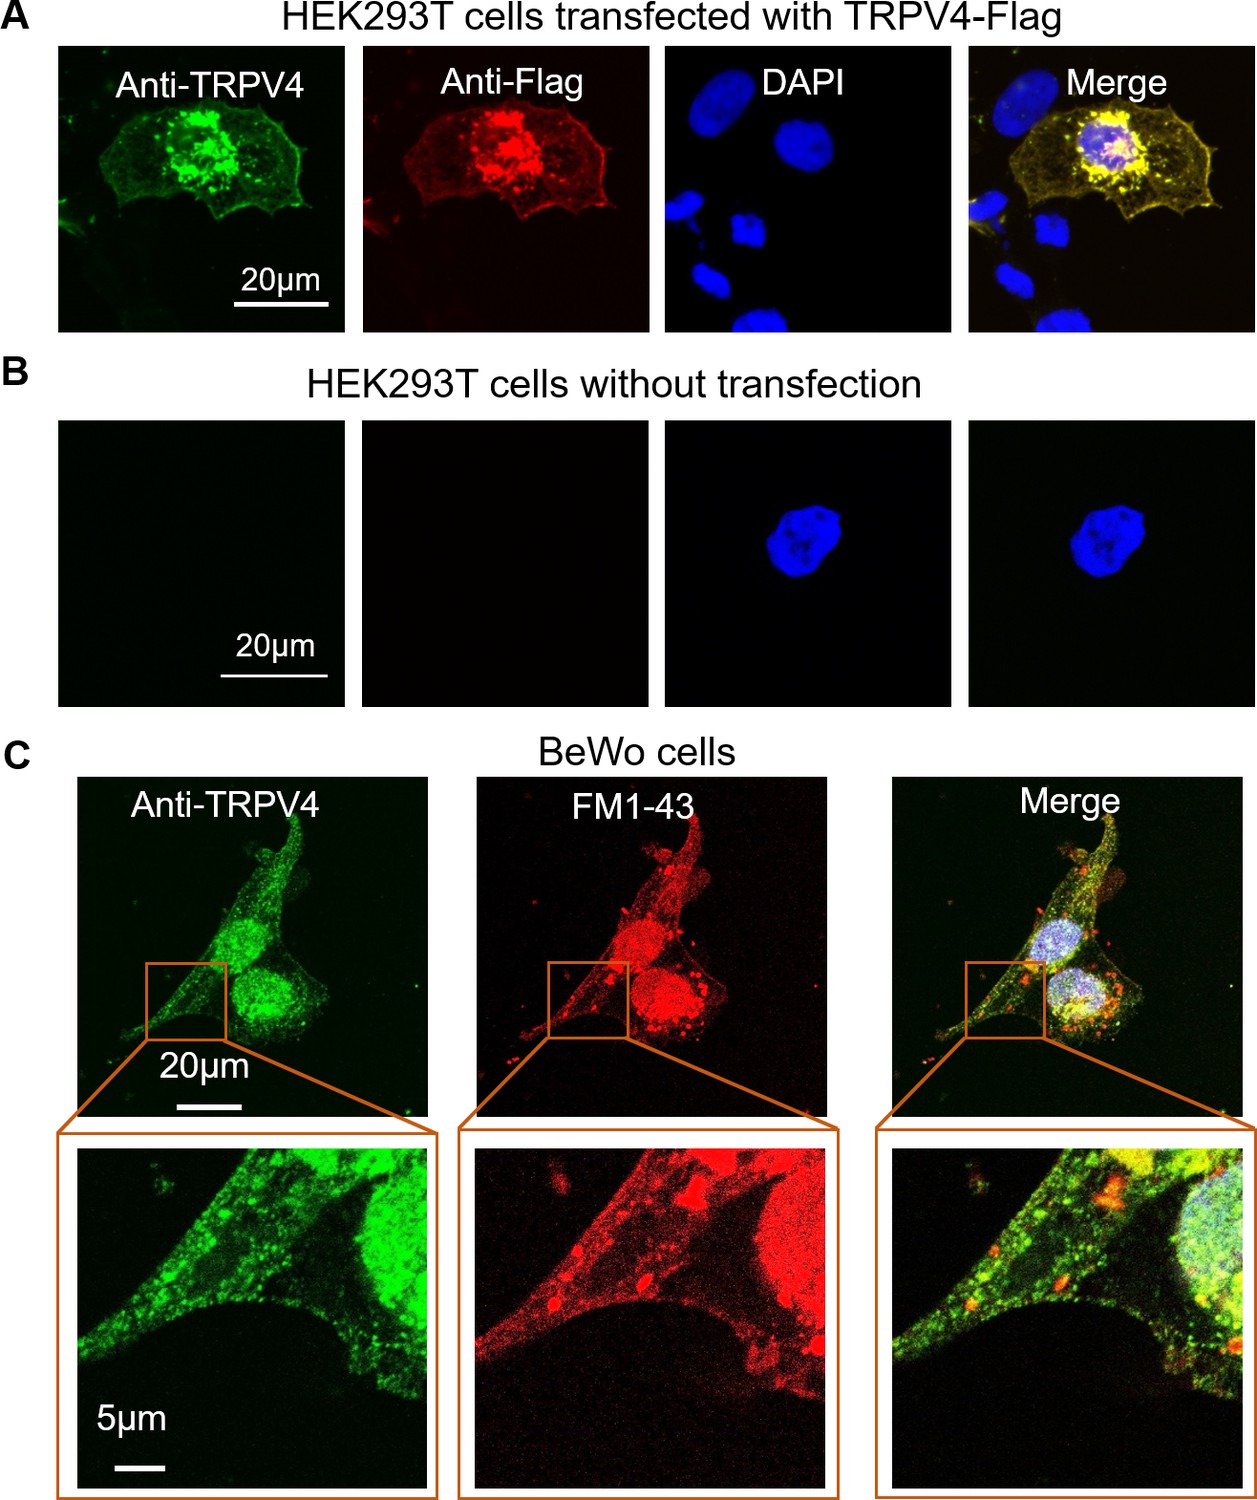
Validation of the TRPV4 antibody for immunofluorescence.
(A, B) Validation of the TRPV4 antibody in HEK293T cells heterologously expressing a Flag-tagged TRPV4 plasmid. Immunofluorescence of TRPV4 (anti-TRPV4, green) and Flag tag (anti-Flag, red) in HEK293T cells transfected with a Flag-tagged TRPV4 plasmid (A) and non-transfected control (B). DAPI-stained nuclei are shown in blue. (C) Representative immunofluorescence of TRPV4 (green) in BeWo cells. The nuclei were stained with Hoechst (blue) and a plasma membrane marker, FM1-43 dye, is shown in red. All fluorescence images are the representatives of at least three biological replicates.
Figure 1—figure supplement 3
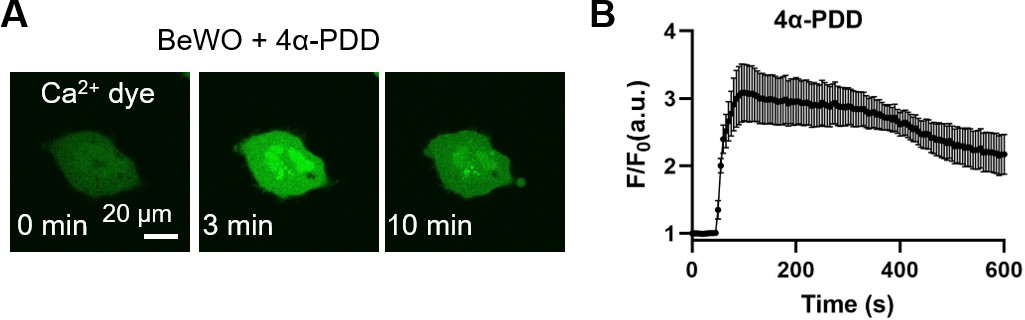
4α-phorbol-12, 13-didecanoate (4α-PDD, 20 μM), a TRPV4 agonist, triggers intracellular Ca2+ elevation in BeWo cells.
(A) Ca2+ dye (Calbryte 520, green) was used to monitor the dynamics of intracellular Ca2+. All fluorescence images are the representatives of at least three biological replicates. (B) Time course of 4α-PDD triggered Ca2+ influx in BeWo cells (n=7).
Figure 1—figure supplement 4
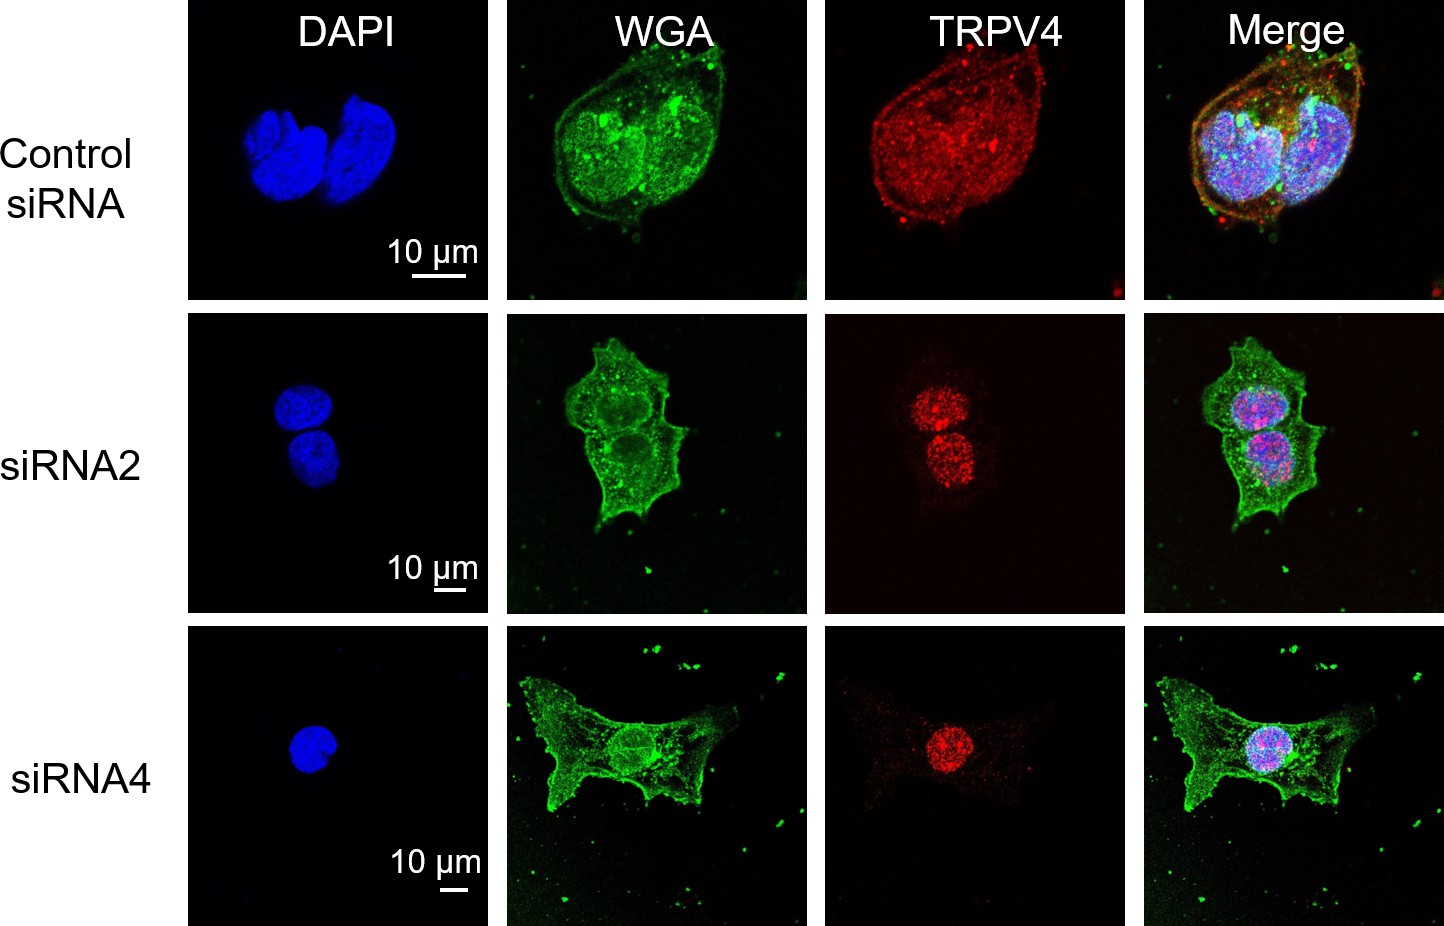
Immunofluorescence of TRPV4 in BeWo cells transfected with TRPV4 siRNAs.
Representative immunofluorescence of TRPV4 (red) in scrambled control siRNA and TRPV4 siRNA knockdown BeWo cells. The nuclei were stained with Hoechst (blue). The plasma membrane was labeled with WGA dye (green). All fluorescence images are the representatives of at least three biological replicates.
Figure 1—figure supplement 5
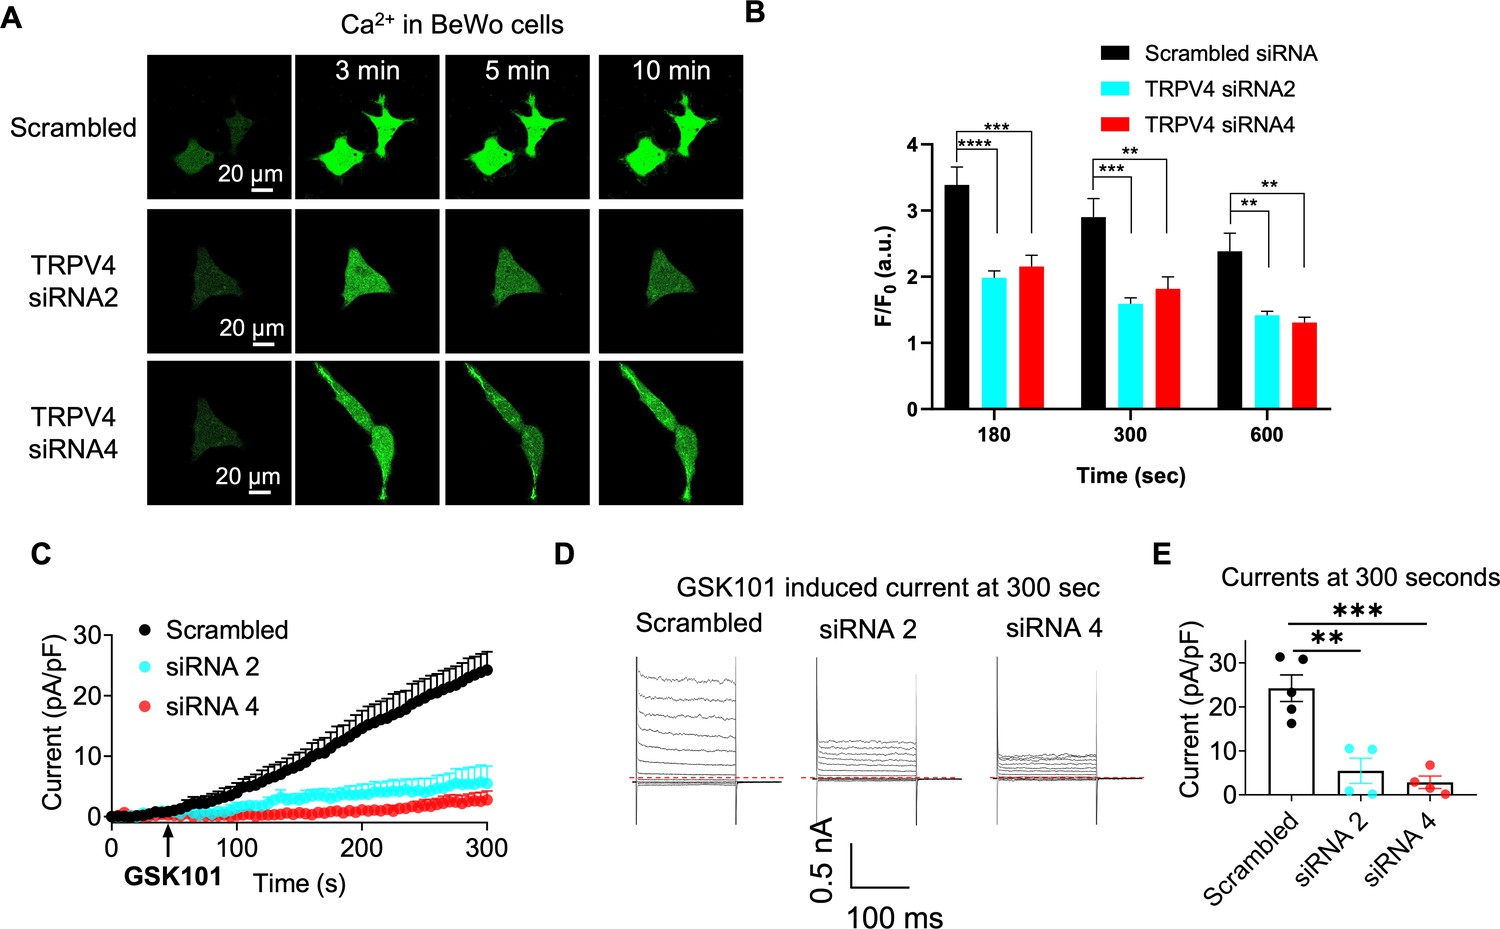
siRNA knockdown supports TRPV4 functional expression in BeWo cells.
(A) Representative Ca2+ imaging in BeWo cells transfected with scrambled siRNA and TRPV4 siRNAs. Calbryte 590 was used to monitor cytosolic Ca2+ dynamics. All fluorescence images are the representatives of at least three biological replicates. (B) Quantification of GSK101-induced Ca2+ influx in BeWo cells transfected with scrambled siRNA (n=50), TRPV4 siRNA2 (n=55), or siRNA4 (n=51) from at least three biological replicates. Values represent mean ± SEM and statistics were done using two-way ANOVA followed by Tukey’s test (**: p<0.01, ***: p<0.001, and ****: p<0.0001). (C) Time course of 30 nM GSK101-induced currents from scrambled siRNA and TRPV4 siRNAs transfected BeWo cells. Whole-cell current was elicited by a ramp protocol from –100 to +100 mV every 5 s and is plotted at +100 mV. Error bar represents SEM. n=4–5. (D) Representative GSK101-induced currents at 300 s after GSK101 stimulation in (C). Whole-cell current was elicited by a voltage step protocol (200 ms) from –100 to +140 mV. (E) Currents densities at +140 mV after 300 s after GSK101 application. Current densities from BeWo cells treated with scrambled siRNA, TRPV4-siRNA2 and TRPV4-siRNA4 were 24.24±3.02, 5.47±2.86, and 24.24±3.02 pA/pF, respectively. Values represent mean ± SEM and statistics were done using one-way ANOVA followed by Tukey’s test (**: p<0.01 and ***: p<0.001, n=4–5).
Figure 2 with 1 supplement
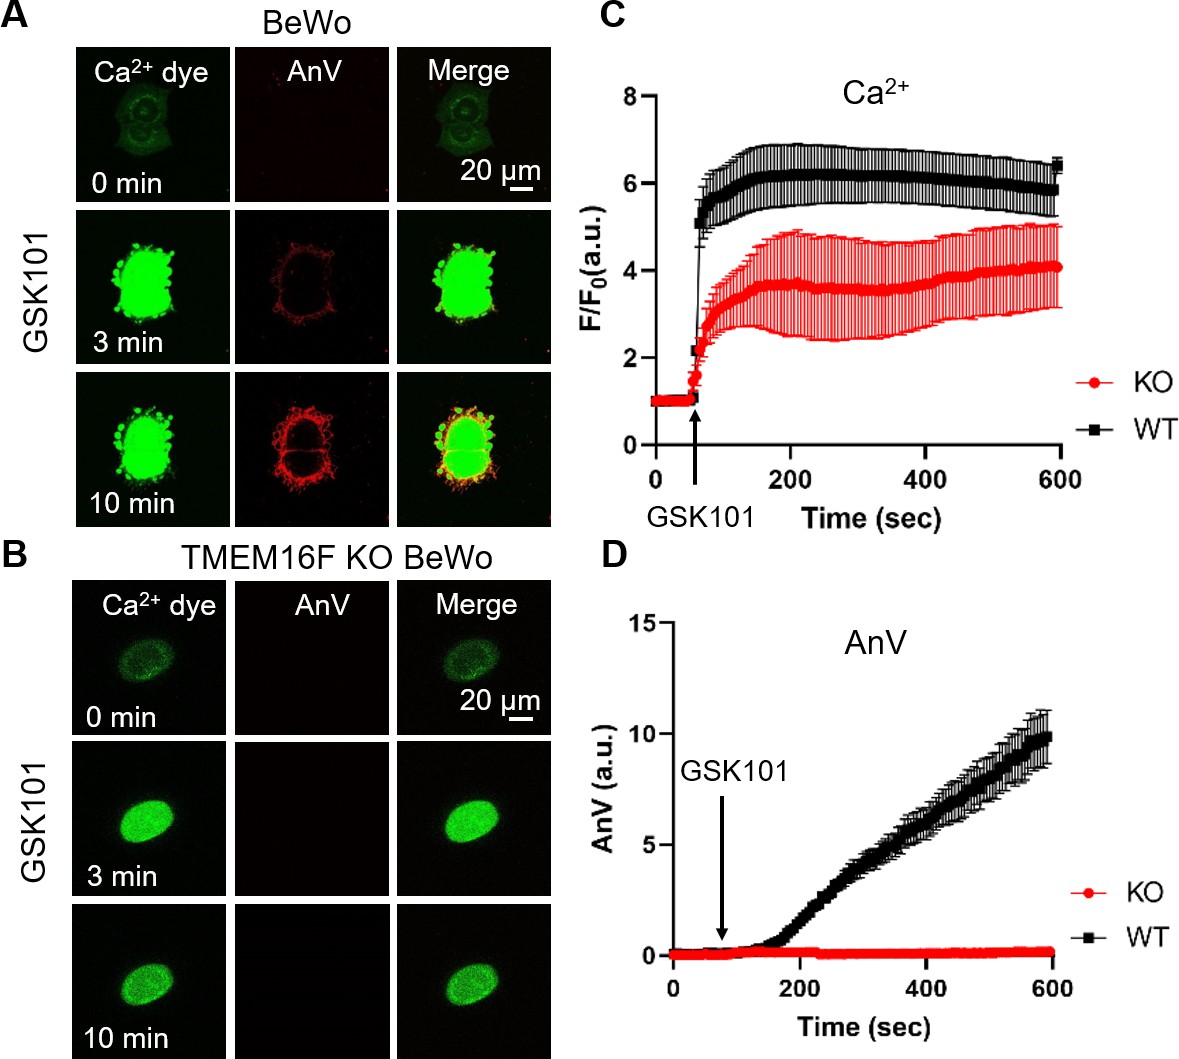
Ca2+ influx through TRPV4 activates TMEM16F scramblase in BeWo cells.
(A) 20 nM GSK101 triggers Ca2+ influx and PS exposure (labeled by AnV) in wild-type (WT) BeWo cells. (B) 20 nM GSK101 induces Ca2+ influx, but fails to trigger PS exposure in TMEM16F knockout (KO) BeWo cells. Ca2+ dye (Calbryte 520, green) and fluorescently tagged AnV (AnV-CF594, red) were used to monitor the dynamics of intracellular Ca2+ and PS externalization, respectively. (C–D) Time course of GSK101-triggered Ca2+ influx (C) and PS exposure (D) in BeWo WT (n=5) and TMEM16F KO cells (n=5). AnV, Annexin V.
-
Figure 2—source data 1
Source data for Figure 2 and Figure 2—figure supplement 1B.
- https://cdn.elifesciences.org/articles/78840/elife-78840-fig2-data1-v2.xlsx
Figure 2—figure supplement 1
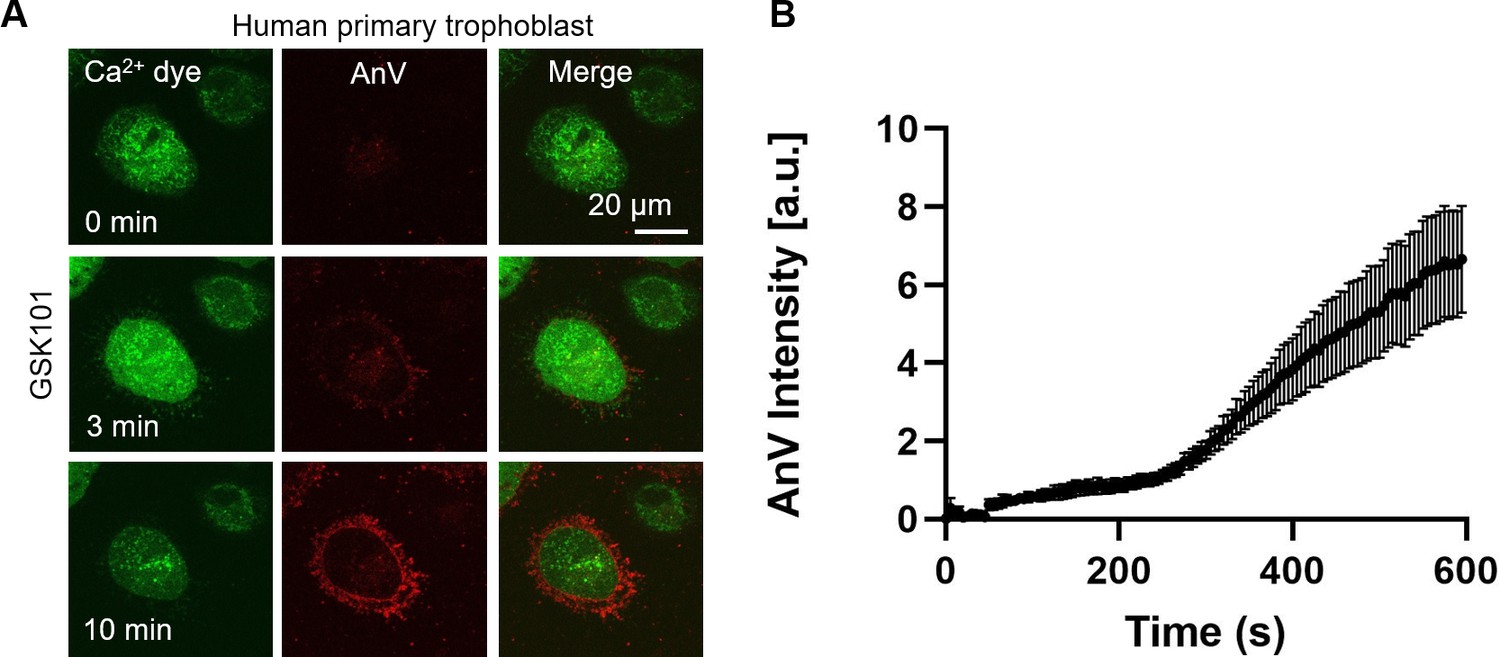
20 nM GSK101 triggers Ca2+ increase and subsequent CaPLSase activities in primary human placental trophoblasts.
(A) Ca2+ dye (Calbryte 520) and fluorescently tagged AnV (AnV-CF594) were used to measure the dynamics of intracellular Ca2+ and PS externalization, respectively. All fluorescence images are the representatives of at least three biological replicates. (B) Time course of GSK101 triggered PS exposure in primary human placental trophoblasts. n=6. Error bar represents ± SEM. AnV, Annexin V.
Figure 3 with 2 supplements
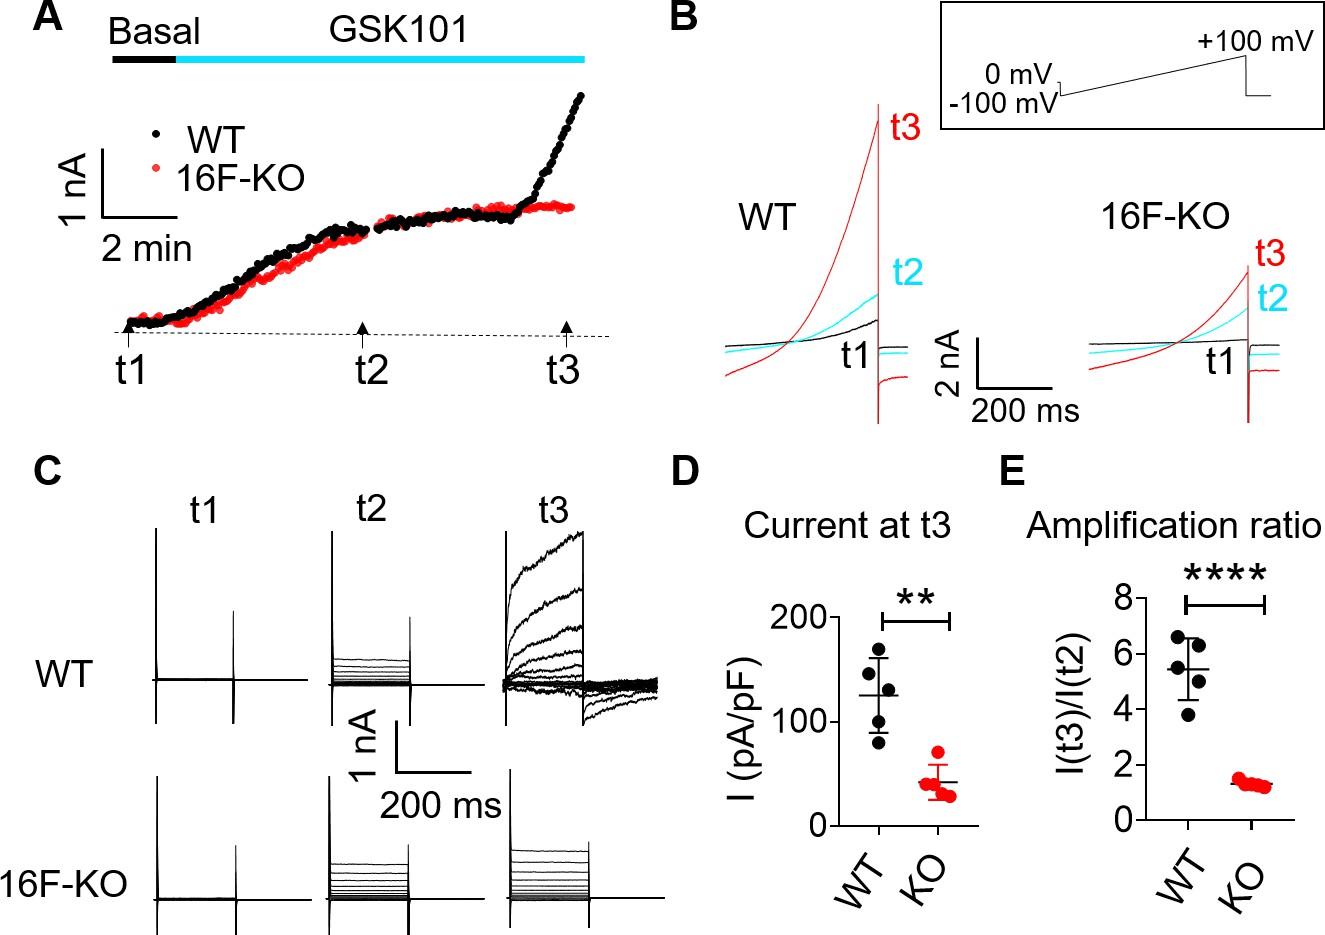
TRPV4 activation elicits TMEM16F current in BeWo cells.
(A, B) Time course of whole-cell currents in response to 30 nM GSK101 stimulation in WT and TMEM16F-KO BeWo cells. The currents were elicited with the ramp protocol shown in (B) (top). (A) The current amplitudes at +100 mV were plotted every 5 s. (B) Representative currents at three different time points as shown in (A). (C) Representative current traces elicited by a voltage step protocol (200 ms) from –100 to +140 mV at three different time points t1, t2, and t3 as indicated in (A). (D) Statistical analysis of current density (+100 mV) at t3 in WT and TMEM16F-KO BeWo cells. The current was elicited by the voltage steps shown in (C). Values represent mean ± SEM and statistics were done using Student’s t-test (n=5 for each group, **: p<0.01). (E) Statistical analysis of amplification ratio (current amplitude ratio at t3 and t2 in (C)) in WT and TMEM16F-KO BeWo cells. Values represent mean ± SEM and statistics were done using Student’s t-test (n=5 for each group, ****: p<0.0001). WT, wild-type.
-
Figure 3—source data 1
Source data for Figure 3 and Figure 3—figure supplement 1B,C,E,F.
- https://cdn.elifesciences.org/articles/78840/elife-78840-fig3-data1-v2.xlsx
Figure 3—figure supplement 1
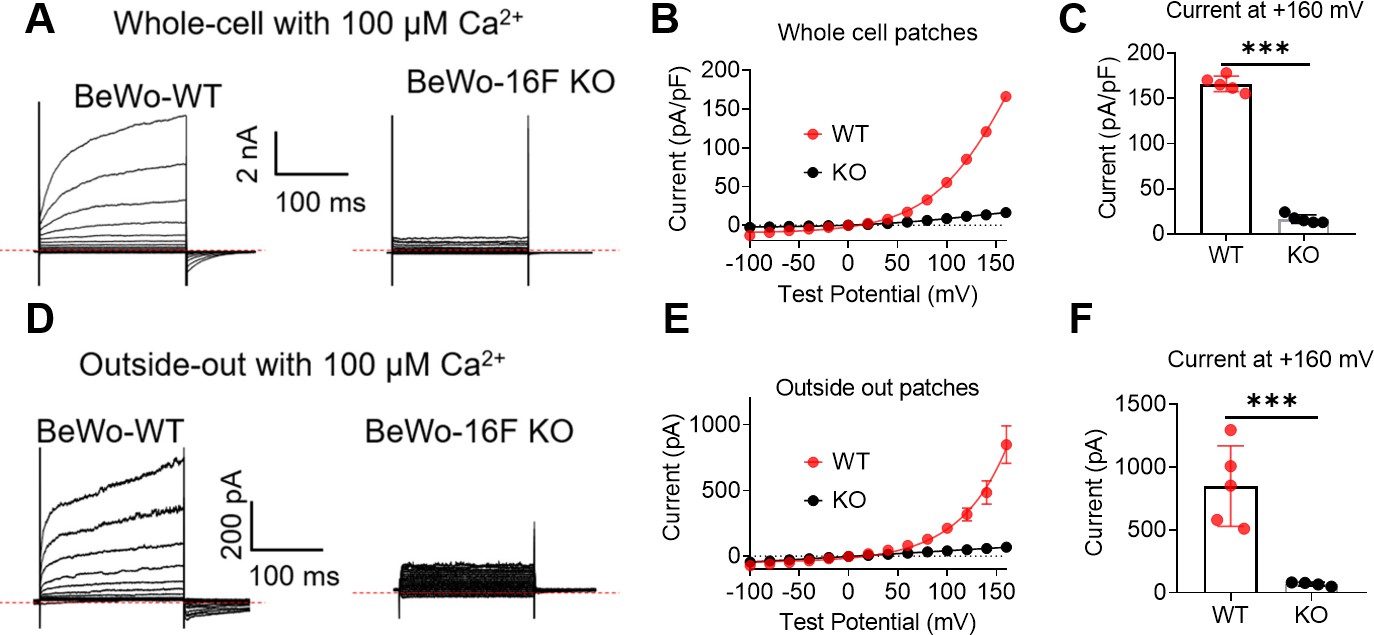
Ca2+-activated current in BeWo WT and TMEM16F KO BeWo cells.
(A) Representative whole cell recordings elicited by a voltage step protocol (200 ms) from –100 to +140 mV. The currents were recorded at ~7–10 min after whole-cell patches were formed. The free Ca2+ inside the pipette was 100 µM. (B) I-V relation of current recorded in WT and TMEM16F-KO BeWo cells under whole cell configuration. (C) Peak whole-cell current at +160 mV was compared with Student’s t-test (***p<0.001, n=5). (D) Representative outside-out patch recordings elicited by a voltage step protocol (200 ms) from –100 to +140 mV. The currents were recorded immediately after outside-out patches were formed. The free Ca2+ inside the pipette was 100 µM. (E) I-V relation of current recorded in WT and TMEM16F-KO BeWo cells under outside-out configuration. (F) Peak outside-out current at +160 mV was compared with Student’s t-test (***p<0.001, n=5 for WT and n=4 for TMEM16F-KO). WT, wild-type.
Figure 3—figure supplement 2
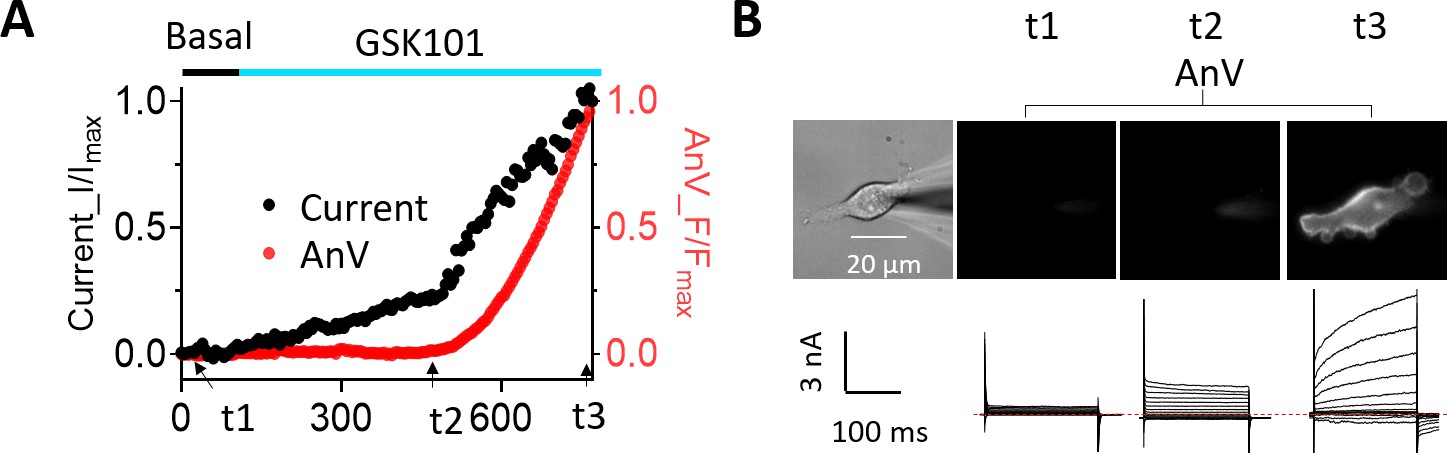
Simultaneous monitoring of GSK101-triggered channel and lipid scramblase activities in BeWo cells.
(A) Time course of 30 nM GSK101-induced current and PS exposure recorded using patch clamp-lipid scramblase fluorometry. (B) Representative data of PS exposure (top) and current traces (bottom) at different time points as indicated in (A). t1 was during baseline recording. t2 demarcates the time point right before the time-dependent, outward rectifying TMEM16F current started to develop. t3 was 10 min after GSK101 application. Current and AnV signal were both normalized to their maximum values at t3. n=4. AnV, Annexin V.
Figure 4 with 2 supplements
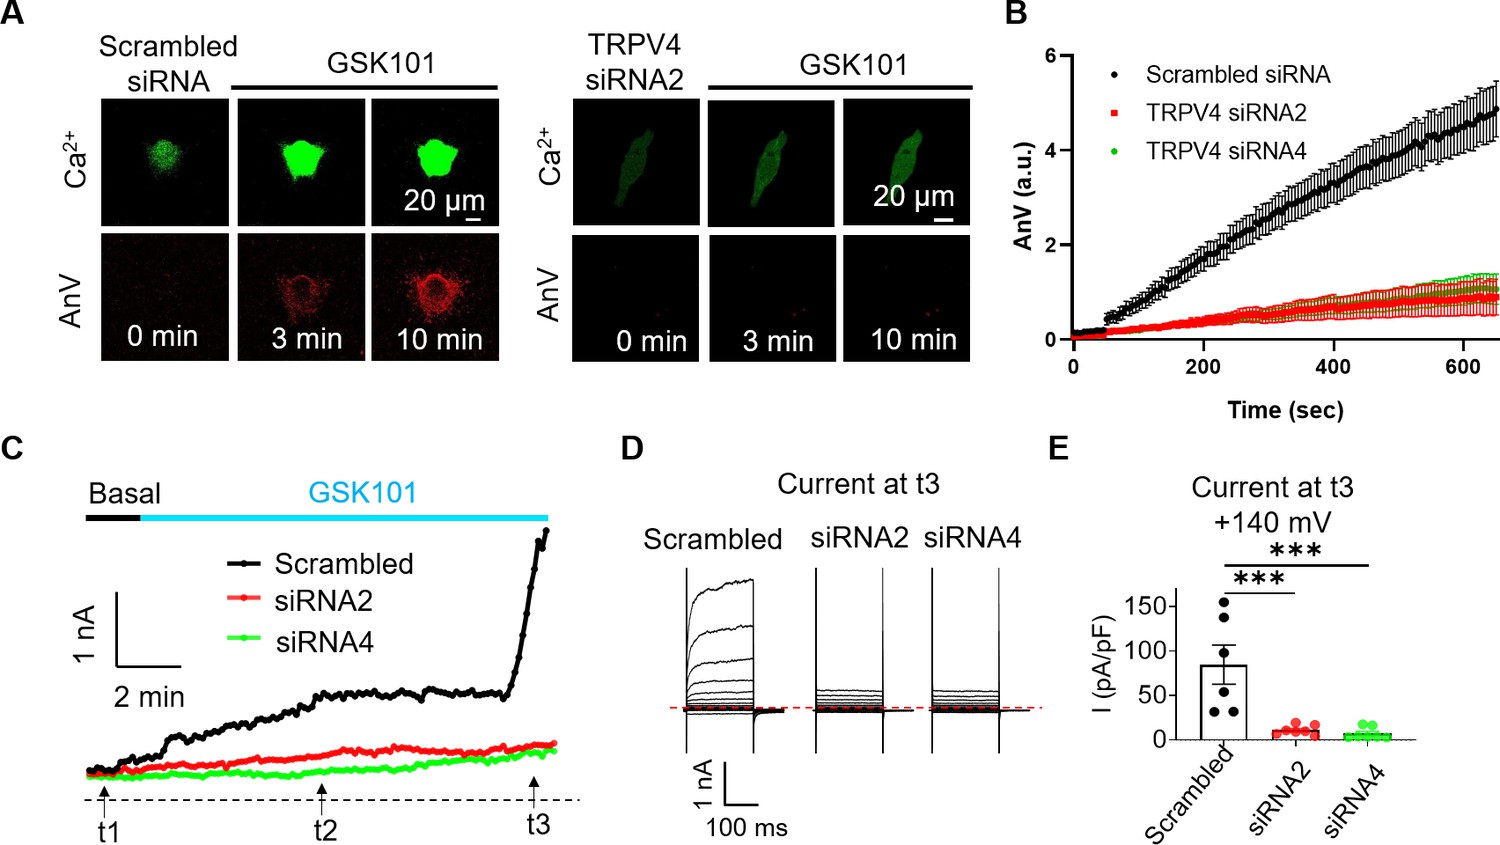
siRNA knockdown of TRPV4 abolishes GSK101-induced Ca2+ influx and subsequent TMEM16F CaPLSase activation in BeWo cells.
(A) Representative images of Ca2+ and AnV in scrambled siRNA and TRPV4 siRNA2 treated BeWo cells in response to 20 nM GSK101 stimulation. Fluorescently tagged AnV labels exposed PS, serving as an indicator of CaPLSase activity. (B) Time course of CaPLSase activities for scrambled siRNA (n=50), TRPV4 siRNA2 (n=55), and siRNA4 (n=51) treated BeWo cells. (C) Time course of whole-cell currents elicited in response to 30 nM GSK101 in scrambled siRNA or TRPV4 siRNAs treated BeWo cells. The currents were elicited with a ramp protocol from –100 to +100 mV and plotted every 5 s at +100 mV. (D) Representative current traces elicited by a voltage step protocol (200 ms) from –100 to +140 mV at three different time points t1, t2, and t3 as indicated in (C). (E) Statistical analysis of current density at t3 (+140 mV) in WT and TRPV4-siRNA knockdown BeWo cells. Current densities after scrambled siRNA, TRPV4-siRNA2, and TRPV4-siRNA4 treatment are 84.72±21.97, 11.12±2.03, and 7.32±2.53 pA/pF, respectively. Values represent mean ± SEM and statistics were done using Student’s t-test (n=6 for scrambled group and n=7 for TRPV4 siRNA groups, ***: p<0.001). AnV, Annexin V; WT, wild-type.
-
Figure 4—source data 1
Source data for Figure 4 and Figure 4—figure supplement 1.
- https://cdn.elifesciences.org/articles/78840/elife-78840-fig4-data1-v2.xlsx
Figure 4—figure supplement 1
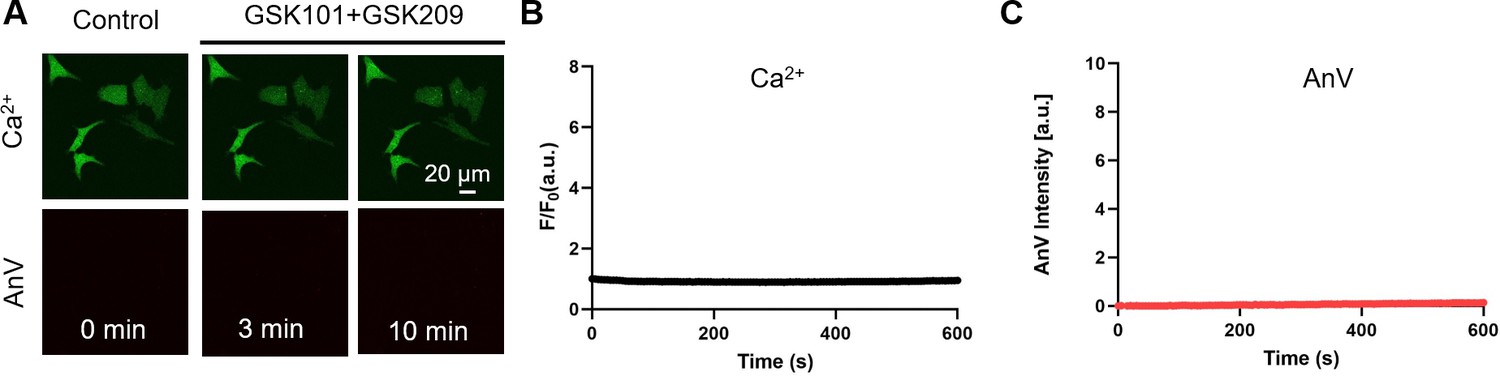
Pharmacological inhibition of TRPV4 abolishes GSK101-induced Ca2+ influx and subsequent TMEM16F activation in BeWo cells.
(A) Representative images Ca2+ and PS exposure in BeWo cells treated with 20 nM TRPV4 agonist GSK101 and by 500 nM TRPV4 antagonist GSK219. Ca2+ dye (Calbryte 488) and fluorescently tagged AnV proteins (AnV-CF594) were used to measure the dynamics of intracellular Ca2+ and PS externalization, respectively. (B, C) Time course of intracellular Ca2+ (B) and PS exposure (C) in BeWo cells treated with 20 nM GSK101 and by 500 nM GSK219. n=9. All fluorescence images are the representatives of at least three biological replicates. AnV, Annexin V.
Figure 4—figure supplement 2
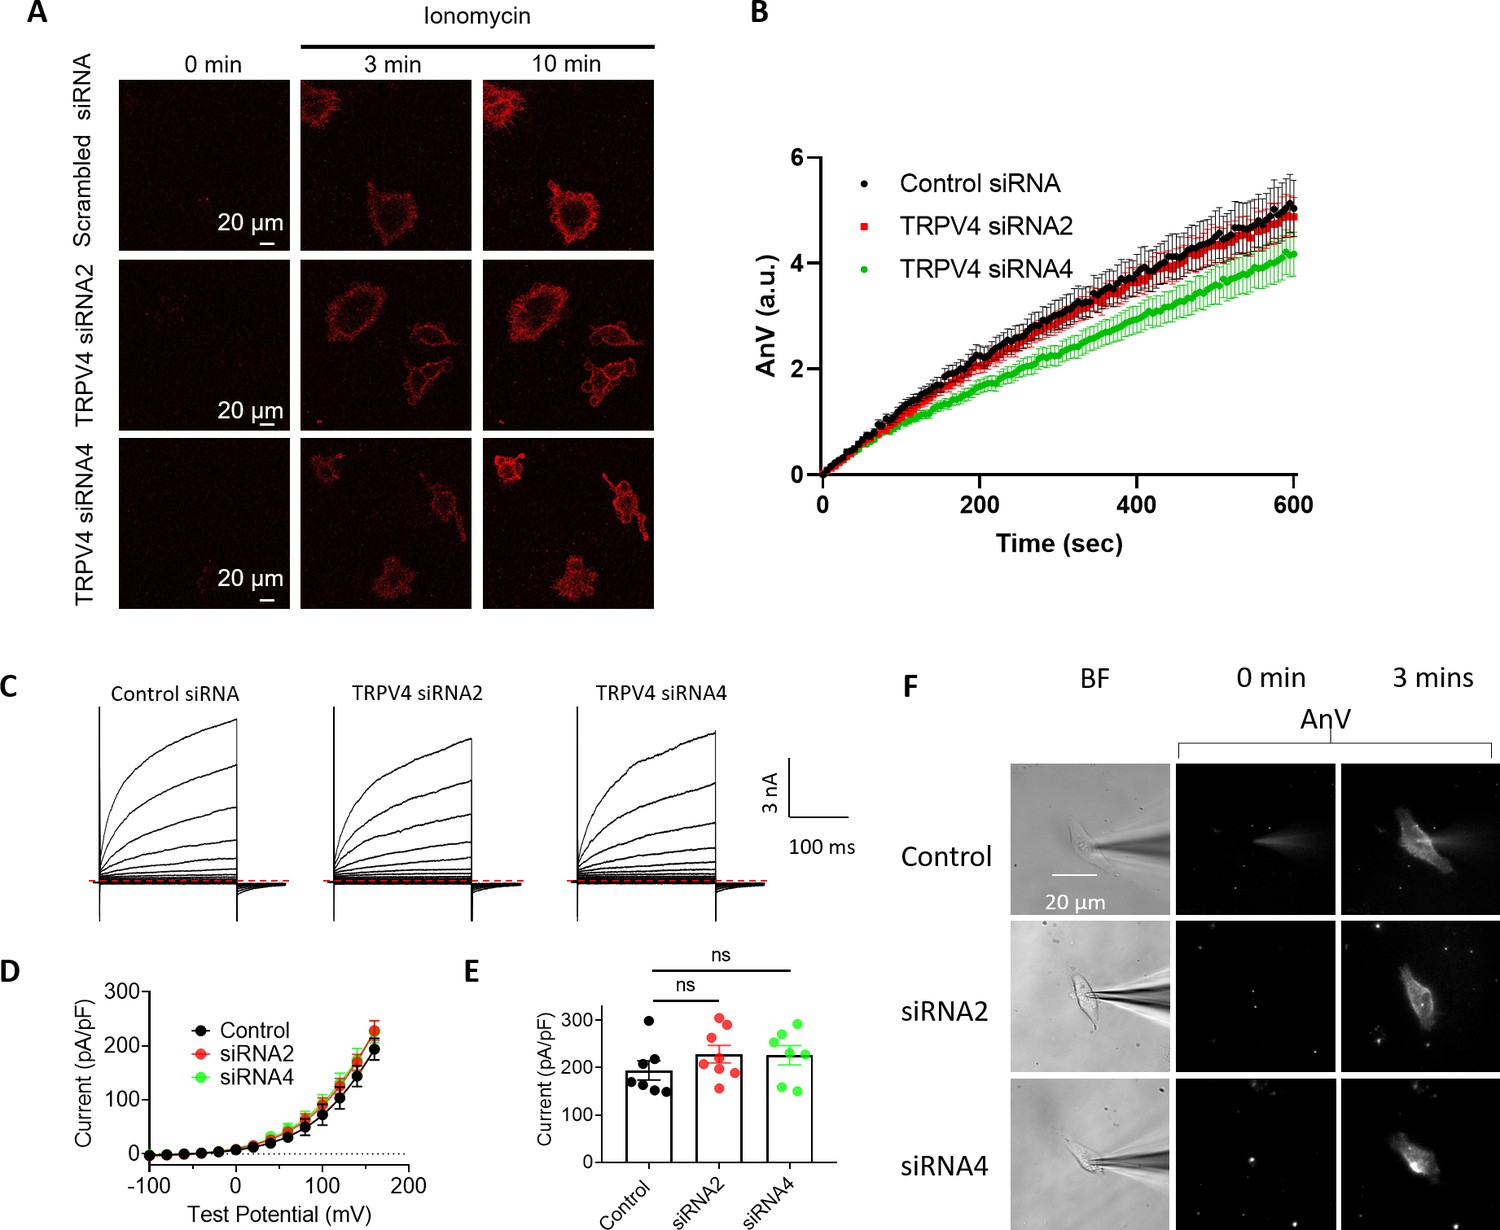
TMEM16F CaPLSase and channel activity in BeWo cells is not affected by TRPV4 knockdown.
(A) Representative images showing 5 μM ionomycin triggers similar levels of PS exposure in scrambled, TPRV4 siRNA2, and siRNA4 knockdown BeWo cells. (B) Quantification of ionomycin-induced AnV intensities increase in BeWo cells transfected with scrambled siRNA (n=25), TRPV4 siRNA2 (n=25), or siRNA4 (n=27). All fluorescence images are the representatives of at least three biological replicates. (C) Representative TMEM16F current traces from control siRNA and the TRPV4 siRNAs treated BeWo cells recorded with whole-cell patch clamp or patch clamp-lipid scrambling fluorometry (PCLSF). 1000 μM Ca2+ was included in the pipette solution, and the current was elicited by a voltage step protocol from –100 to +160 mV with holding potential at –60 mV. (D) I-V relation of TMEM16F current recorded from the control siRNA and the TRPV4 siRNAs treated BeWo cells. (E) Statistics of the TMEM16F current density at +160 mV shown in (D). Student’s t-test (ns: not significant, n=7 for control siRNA, n=8 for TRPV4 siRNA2, and n=7 for TRPV4 siRNA4). (F) Representative lipid scrambling activities recorded using PCLSF to simultaneously record TMEM16F channel and lipid scramblase activities. The cells are the same ones shown in (C). n=3. AnV, Annexin V.
Figure 5 with 1 supplement
TRPV4 and TMEM16F are functionally coupled within microdomain in BeWo cells.
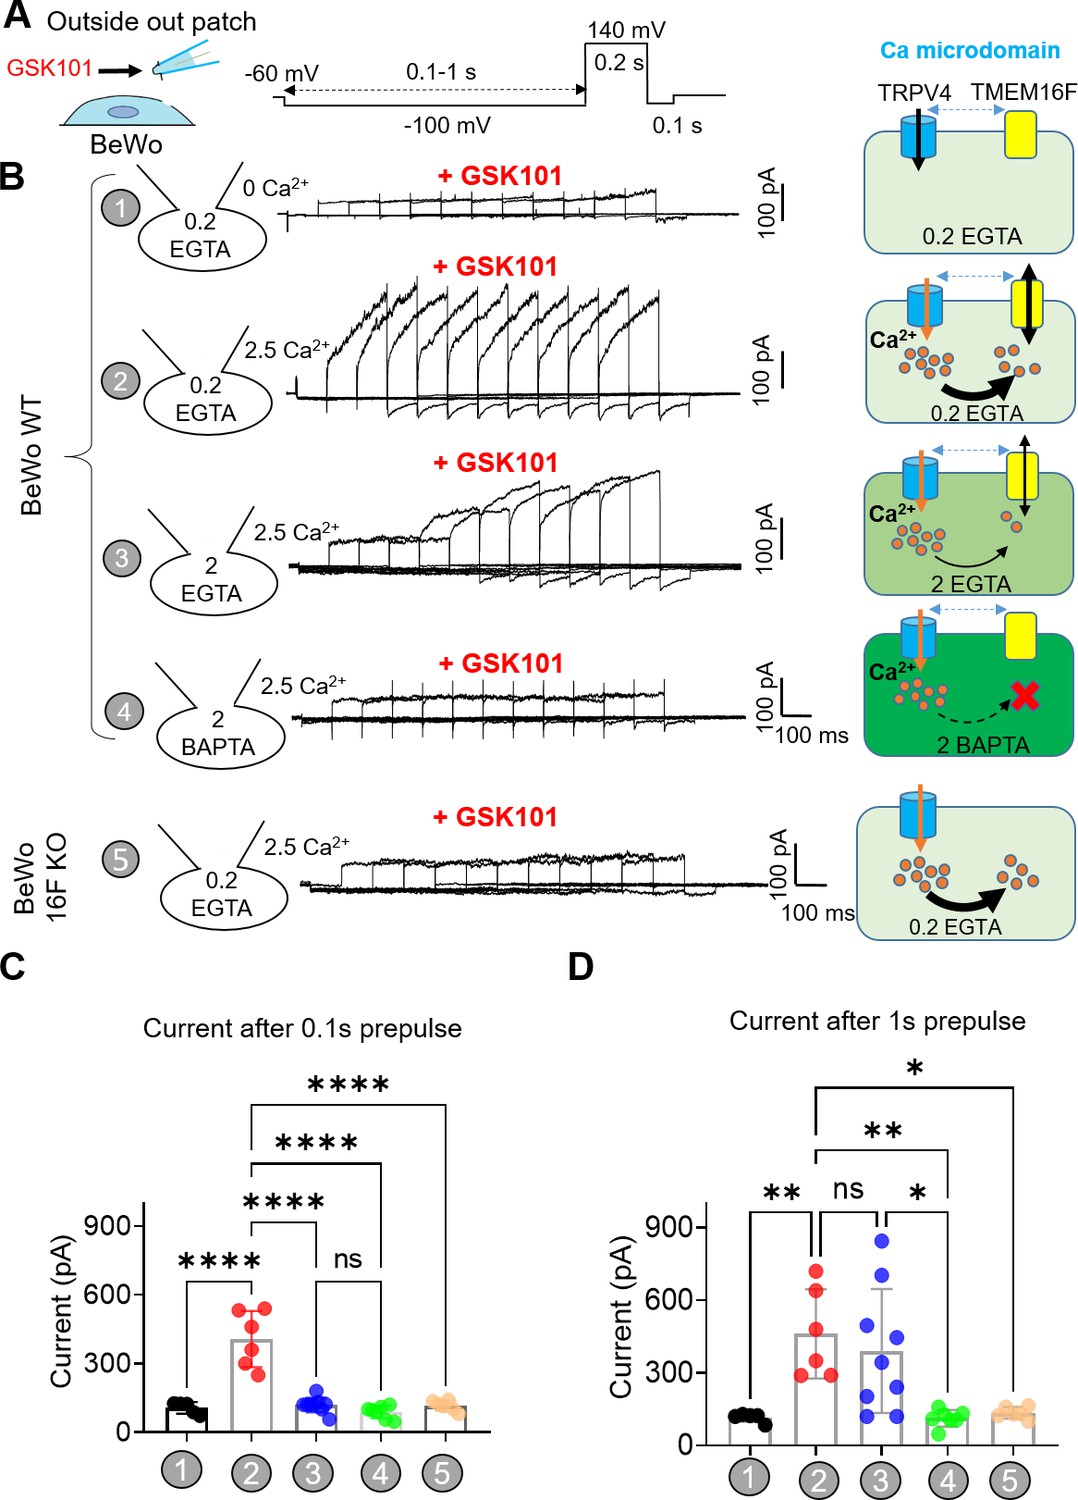
(A) Outside-out patch configuration and voltage protocols used to demonstrate TRPV4-TMEM16F coupling. The holding potential was set at –60 mV. (A) –100 mV pre-pulse with varied length from 0.1 to 1 s with 0.1-s increment was applied along with perfusion of 30 nM GSK101 to induce Ca2+ influx. Following the pre-pulse, a depolarized pulse with 0.2 s duration and 140 mV amplitude was applied to record TMEM16F current. (B) Left: Representative outside-out patch recordings from wild-type (WT) BeWo cells under different conditions: (1) intracellular 0.2 mM EGTA, extracellular 0 Ca2+ with 30 nM GSK101 (n=5); (2) intracellular 0.2 mM EGTA, extracellular 2.5 mM Ca2+ with 30 nM GSK101 (n=6); (3) intracellular 2 mM EGTA, extracellular 2.5 mM Ca2+ with 30 nM GSK101 (n=9); (4) intracellular 2 mM BAPTA, extracellular 2.5 mM Ca2+ with 30 nM GSK101 (n=7); and (5) Intracellular 0.2 mM EGTA, extracellular 2.5 mM Ca2+ with 30 nM GSK101 for TMEM16F-KO BeWo cells (n=6). Right: Diagrams demonstrating TRPV4-TMEM16F coupling under each condition on the left. The intensity of green color depicts Ca2+ chelating capacity and kinetics with BAPTA as the most efficient Ca2+ chalator. (C, D) Quantification of peak current amplitudes at +140 mV after 0.1 s pre-pulse (C) and 1 s pre-pulse (D). Values represent mean ± SEM and statistics were done using Student’s t-test (****: p<0.0001, **: p<0.01, *: p<0.05, ns: not significant).
-
Figure 5—source data 1
Source data for Figure 5 and Figure 5—figure supplement 1B-C.
- https://cdn.elifesciences.org/articles/78840/elife-78840-fig5-data1-v2.xlsx
Figure 5—figure supplement 1
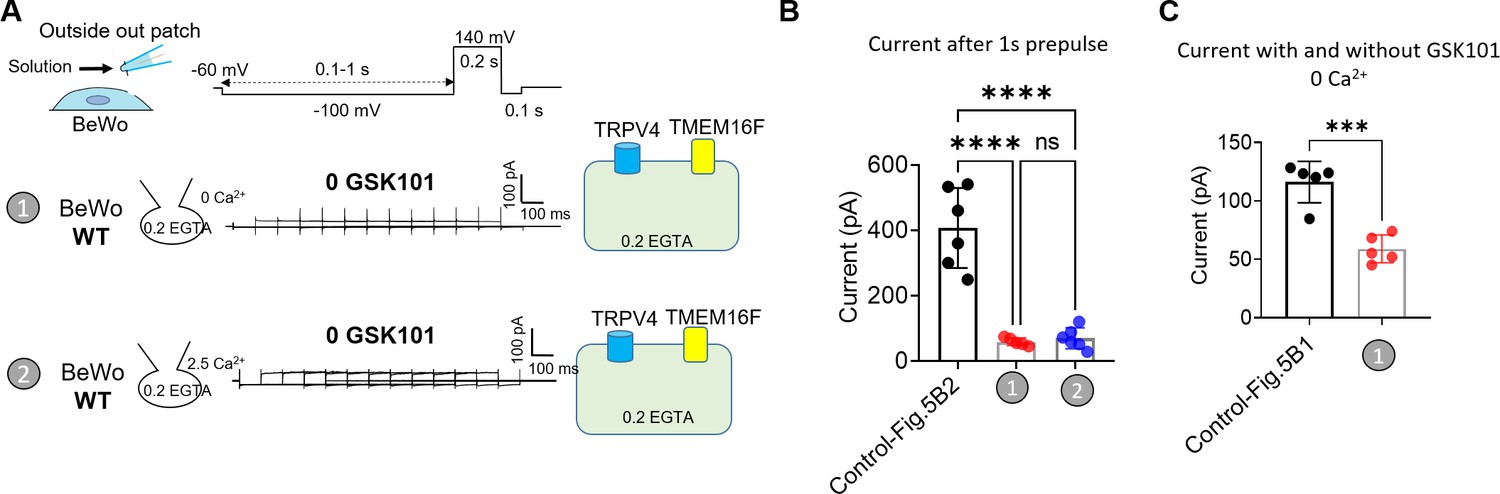
Lack of TRPV4-TMEM16F coupling in BeWo trophoblast cells in the absence of GSK101.
(A) Outside-out patch recording of BeWo cells in the absence of GSK101. (1) 0 extracellular Ca2+; (2) 2.5 mM extracellular Ca2+. 0.2 mM EGTA was included in the pipette. (B) Comparison of outside-out patch current with (Figure 5B, #2, with 2.5 mM Ca2+) and without GSK101 after 1 s of pre-pulse. (C) Comparison of outside-out patch current with (Figure 5B, #1, with 0 Ca2+) and without GSK101 after 1 s of pre-pulse. Values represent mean ± SEM and statistics were done using Student’s t-test (n=5, ****: p<0.0001, ***: p<0.001, ns: not significant).
Figure 6 with 1 supplement
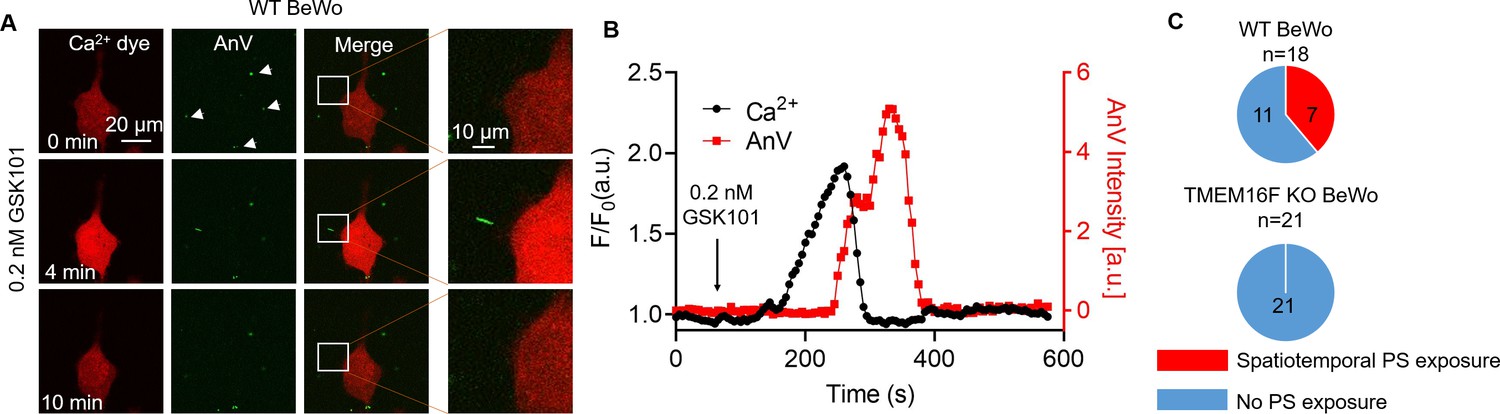
Transient Ca2+ influx through TRPV4 induces local PS exposure in BeWo cells.
(A) Representative images of Ca2+ and PS exposure from the BeWo cells stimulated with low concentration of GSK101 (0.2 nM). Ca2+ dye (Calbryte 594) and fluorescently tagged AnV proteins (AnV-CF488) were used to measure the dynamics of intracellular Ca2+ and PS externalization, respectively. The white box highlights transient and reversible PS exposure in a membrane process in response to TRPV4 stimulation. The arrow heads label the PS positive debris in the cell culture, which existed before TRPV4 stimulation. All fluorescence images are the representatives of at least three biological replicates. (B) The dynamics of global Ca2+ (black) and local AnV signal (red) upon 0.2 nM GSK101 stimulation in WT BeWo cells. (C) Quantification of WT (7/18) and TMEM16F KO (0/21) BeWo cells that showed local PS exposure in response to 0.2 nM GSK101. AnV, Annexin V; WT, wild-type.
-
Figure 6—source data 1
Source data for Figure 6 and Figure 6—figure supplement 1B.
- https://cdn.elifesciences.org/articles/78840/elife-78840-fig6-data1-v2.xlsx
Figure 6—figure supplement 1
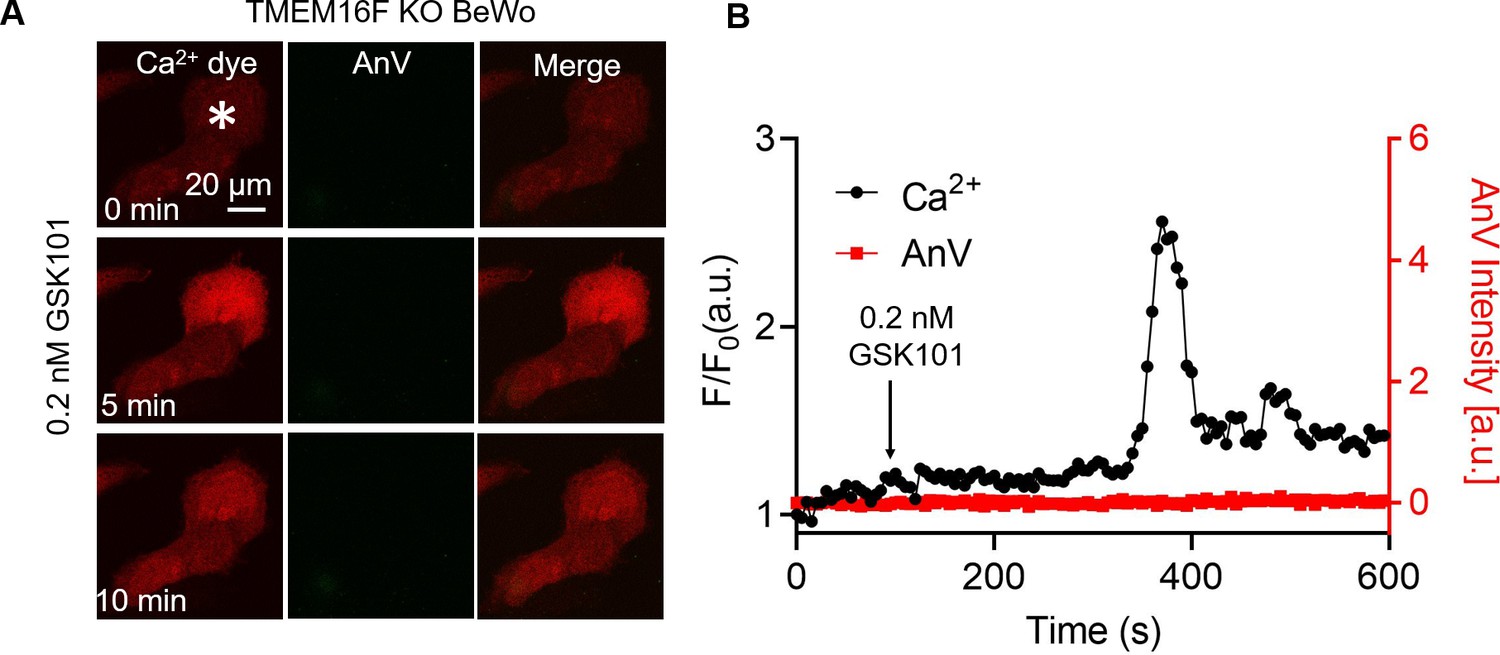
Simultaneous imaging of Ca2+ increase and phospholipid scrambling in TMEM16F knockout (KO) BeWo cells in response to low concentration GSK101.
(A) Stimulation of TRPV4 with low concentration of GSK101 (0.2 nM) triggers transient Ca2+ increase without spatiotemporal PS exposure in TMEM16F KO BeWo cells. Ca2+ dye (Calbryte 594) and fluorescently tagged AnV proteins (AnV-CF488) were used to measure the dynamics of intracellular Ca2+ and PS externalization, respectively. All fluorescence images are the representatives of at least three biological replicates. (B) The dynamics of Ca2+ (black) and AnV signal (red) of a TMEM16F KO BeWo cell in (A) (*). AnV, Annexin V.
Figure 7 with 1 supplement
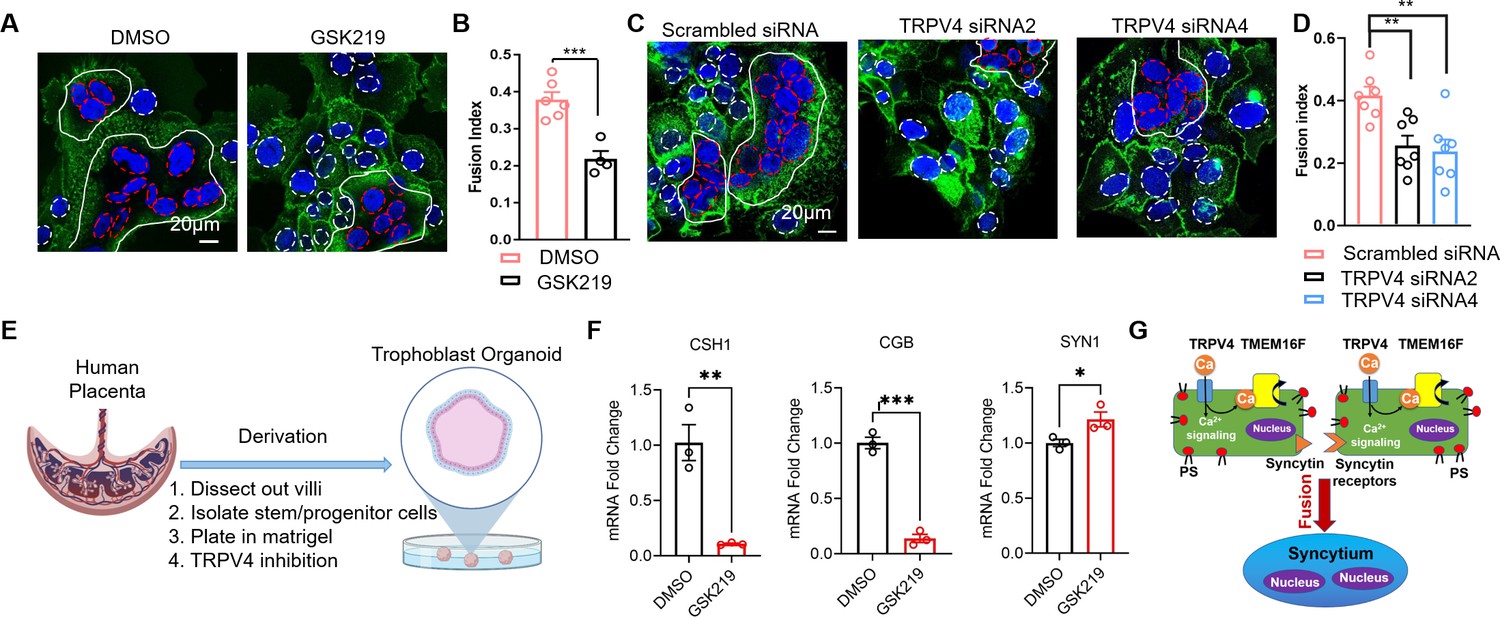
TRPV4 inhibition hinders human trophoblast fusion in vitro.
(A) Representative images of control and GSK219 treated BeWo cells after 48-hr forskolin treatment. Nuclei and membranes were labeled with Hoechst (blue) and Di-8-ANEPPS (green), respectively. (B) GSK219 inhibits forskolin-induced BeWo cell fusion. Unpaired two-sided Student’s t-test. ***: p<0.001. Error bars indicate ± SEM. Each dot represents the average of fusion indexes (FIs) of six random fields from one cover glass. (C) Representative images of control (scrambled siRNA) and TRPV4 knockdown (TRPV4 siRNA 2 and 4) BeWo cells after 48-hr forskolin treatment. (D) TRPV4 siRNA knockdown inhibits forskolin-induced BeWo cell fusion. Unpaired two-sided Student’s t-test. **: p<0.01. Error bars represent ± SEM. Each dot represents the average of FIs of six random fields from one cover glass (see Materials and methods for details). All fluorescence images are the representatives of at least three biological replicates. (E) Schematic of 3-D culture of human placenta trophoblast-derived organoid. (F) The mRNA changes of placental syncytiotrophoblast marker genes CSH1, CGB, and the fusogenic gene SYNCITIN-1(SYN1) after TRPV4 inhibition. n=3 for each group, Unpaired two-sided Student’s t-test. ***: p<0.001, **: p<0.01. *: p<0.05. Error bars indicate ± SEM. (G) A cartoon demonstration of TRPV4-TMEM16F coupling in regulating trophoblast fusion.
-
Figure 7—source data 1
This is IF staining results.
No quantification was involved.
- https://cdn.elifesciences.org/articles/78840/elife-78840-fig7-data1-v2.xlsx
Figure 7—figure supplement 1
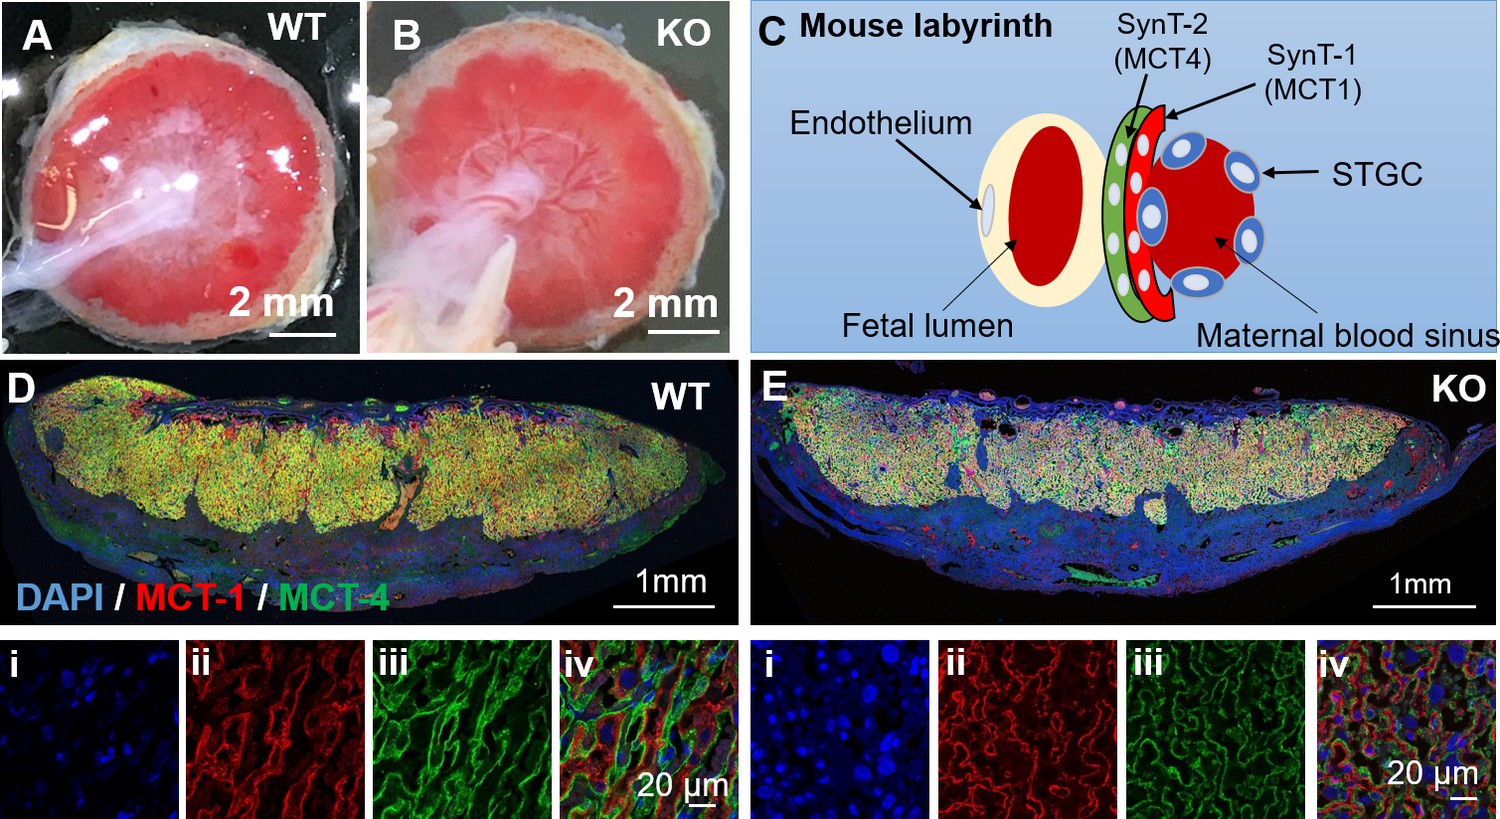
TRPV4 knockout (KO) placentas do not show obvious defects in trophoblast syncytialization in mice.
(A, B) Representative images of placentas from wild-type (WT) (A) and TRPV4 KO (B) mice at E18.5. (C) Anatomical diagram of fetomaternal exchange in mouse placentas. (D, E) MCT1 and MCT4 immunofluorescence staining of the TRPV4 WT (D) and KO (E) placentas at E18.5. MCT1 (red) specifically stains the SynT-1 layer that faces maternal blood sinuses, while MCT4 (green) specifically stains the SynT-2 layer that encloses fetal blood vessels. Panels (i–iv) at the bottom show enlarged views of the placentas on top. All fluorescence images are the representatives of at least three biological replicates.
Author response image 1
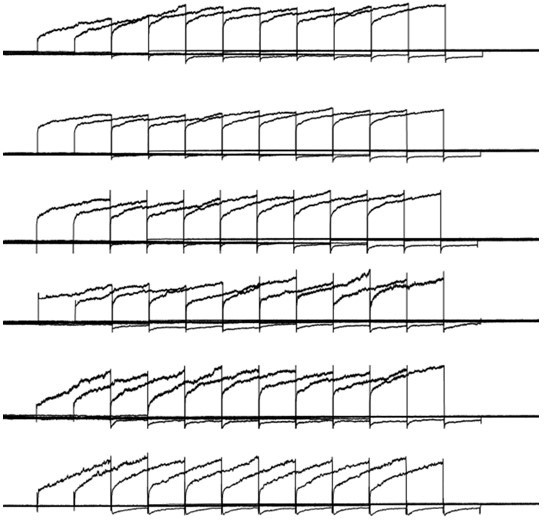
Six different outside-out patch recordings from wildtype (WT) BeWo cells with 0.
2 EGTA in the pipette and 2.5mM ca2+ in the extracellular solution. 30nM GSK101 was applied through a perfusion system, the protocol used here is the same as Figure 5A.
Author response image 2
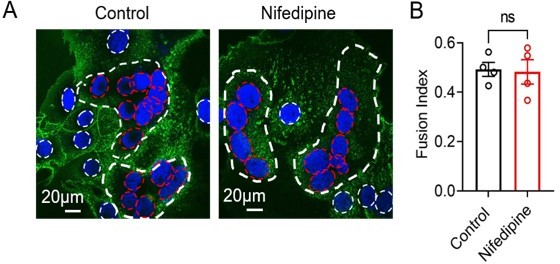
Nifedipine (1 µM) has no effect on forskolin-induced BeWo cell fusion.
(A) Representative images of control and nifedipine treated BeWo cells after 48-hour forskolin treatment. Nuclei and membranes were labelled with Hoechst (blue) and Di-8-ANEPPS (green), respectively. (B) Quantification of nifedipine effect on forskolin-induced BeWo cell fusion. Unpaired two-sided Student’s t-test. ns: not significant. Error bars indicate ± SEM. Each dot represents the average of fusion indexes of six random fields from one cover glass.
Author response image 3
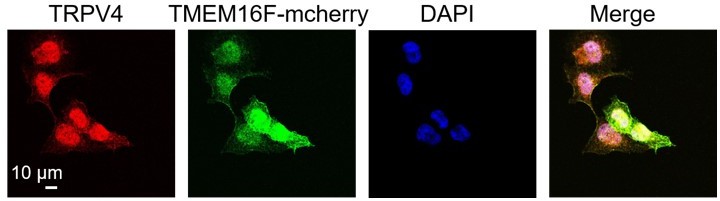
TRPV4 and TMEM16F are spatially close to each other on BeWo cell membrane.
Immunofluorescence of the endogenous TRPV4 (anti-TRPV4, red) and the heterologously expressed mCherry-tagged TMEM16F (anti-mCherry) in BeWo TMEM16F knockout cells.
Author response image 4
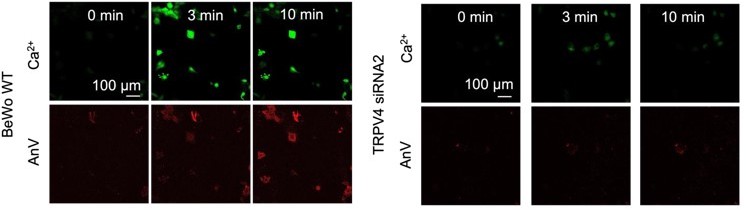
Ca2+ influx through TRPV4 activates TMEM16F scramblase (left) and siRNA knockdown of TRPV4 (right) abolishes GSK101-induced ca2+ influx and subsequent TMEM16F CaPLSase activation.
Videos
Video 1
Time lapse video showing wild-type BeWo cells in response to 20 nM GSK101 stimulation.
Ca2+ dye (Calbryte 520, green) and fluorescently tagged AnV (AnV-CF594, red) were used to monitor the dynamics of intracellular Ca2+ and PS externalization, respectively. Related to Figure 2A. AnV, Annexin V.
Video 2
Time lapse video showing TMEM16F knockout (KO) BeWo cells in response to 20 nM GSK101 stimulation.
Ca2+ dye (Calbryte 520, green) and fluorescently tagged AnV (AnV-CF594, red) were used to monitor the dynamics of intracellular Ca2+ and PS externalization, respectively. Related to Figure 2B. AnV, Annexin V.
Video 3
Time lapse video showing wild-type BeWo cells in response to 0.2 nM GSK101 stimulation.
Ca2+ dye (Calbryte 594, red) and fluorescently tagged AnV (AnV-CF488, green) were used to monitor the dynamics of intracellular Ca2+ and PS externalization, respectively. Related to Figure 6A. AnV, Annexin V.
Video 4
Time lapse video showing TMEM16F knockout (KO) BeWo cells in response to 0.2 nM GSK101 stimulation.
Ca2+ dye (Calbryte 594, red) and fluorescently tagged AnV (AnV-CF488, green) were used to monitor the dynamics of intracellular Ca2+ and PS externalization, respectively. Related to Figure 6—figure supplement 1. AnV, Annexin V.
Additional files
-
Supplementary file 1
qPCR primer list used in this study.
- https://cdn.elifesciences.org/articles/78840/elife-78840-supp1-v2.docx
-
MDAR checklist
- https://cdn.elifesciences.org/articles/78840/elife-78840-mdarchecklist1-v2.docx
Download links
A two-part list of links to download the article, or parts of the article, in various formats.
Downloads (link to download the article as PDF)
Open citations (links to open the citations from this article in various online reference manager services)
Cite this article (links to download the citations from this article in formats compatible with various reference manager tools)
Functional coupling between TRPV4 channel and TMEM16F modulates human trophoblast fusion
eLife 11:e78840.
https://doi.org/10.7554/eLife.78840


