Muscle calcium stress cleaves junctophilin1, unleashing a gene regulatory program predicted to correct glucose dysregulation
- Department of Physiology and Biophysics, Rush University, United States
- Department of Internal Medicine, Division of Nephrology, Rush University, United States
- Department of Anesthesia & Pain Management, University of Toronto, Canada
- Cell Biology Program, The Hospital for Sick Children, Canada
Figures
Figure 1 with 3 supplements
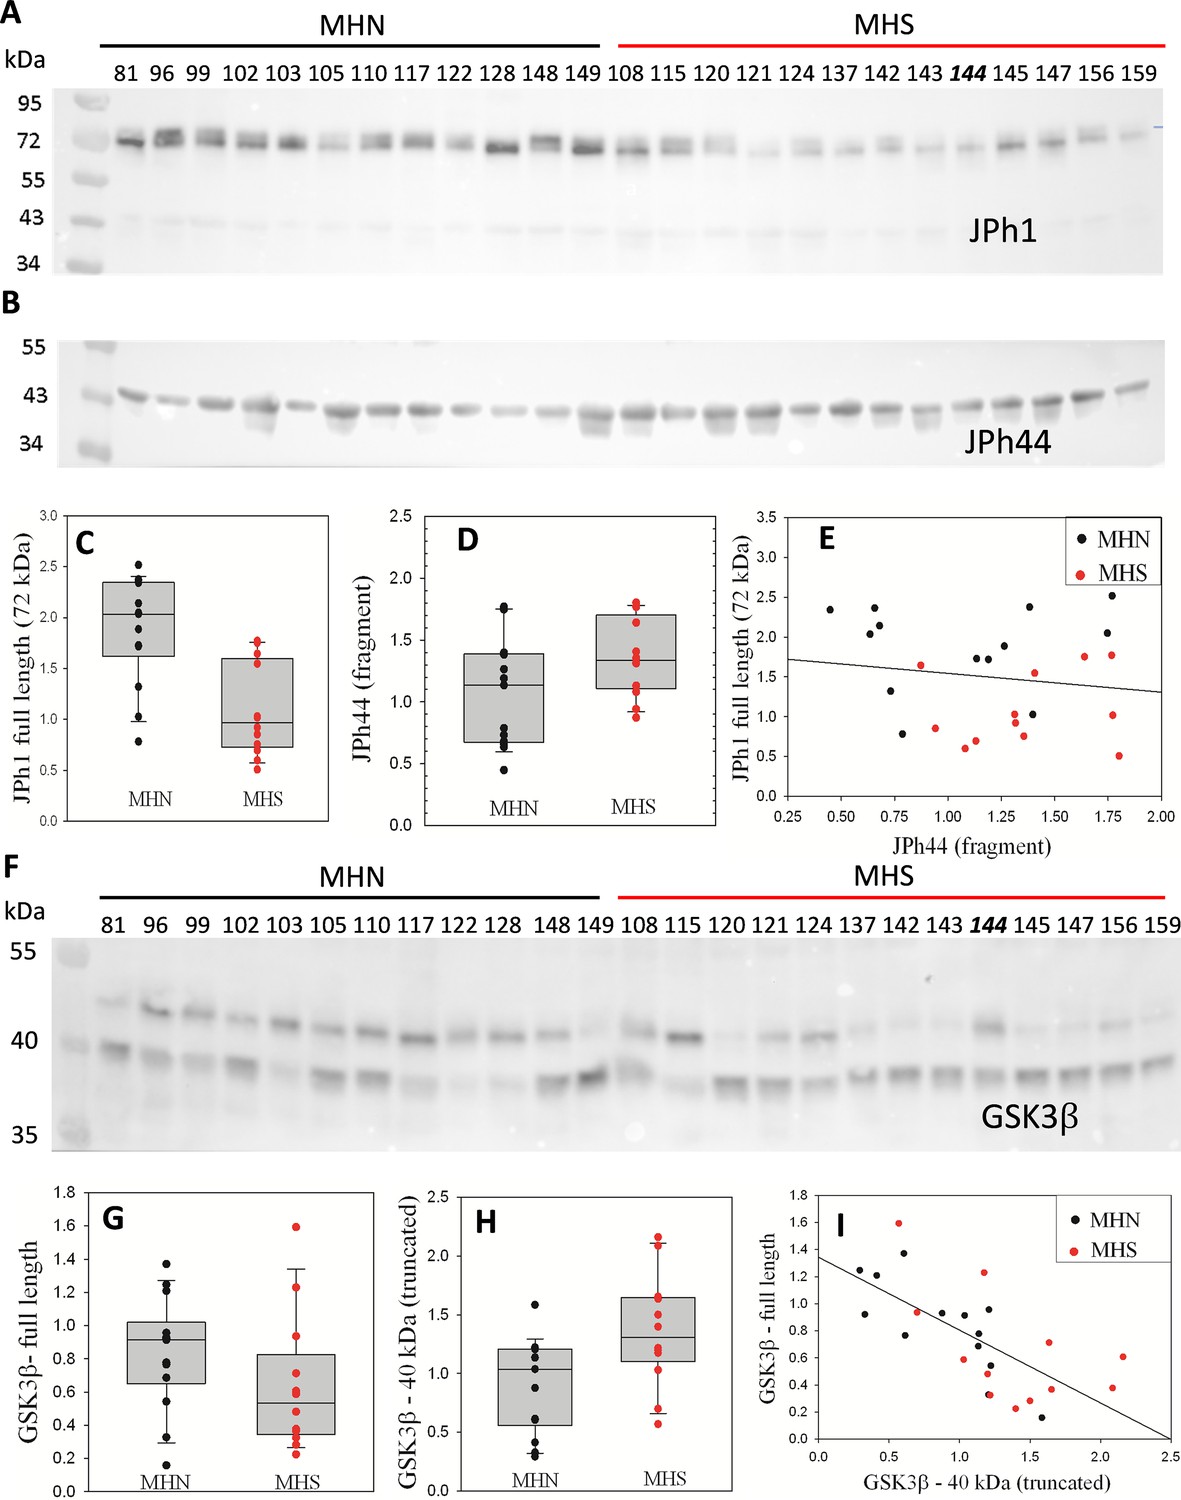
Fragmentation of proteins in MHS human muscle.
(A) Western blot (WB) of whole protein fraction from individual subjects’ biopsies, stained with antibody A. Subjects were diagnosed as MHN or MHS as indicated. Numbers identify individuals. (Sample #144, an MHN, is misplaced). (B) WB of a 2nd gel, using antibody B, which specifically stains JPh44 (see Figure 1—figure supplement 2). (C, D) Plots of signal in the 13 MHN and 12 MHS bands of panels A and B, respectively. p of no difference is <0.001 and 0.06, respectively for JPh1 and JPh44. (E) JPh1 vs JPh44 WB signals for all patients. The correlation is poor (R=–0.16). (F) WB of whole protein fraction from the same biopsies, stained for GSK3β. (G, H) Box plots of the signal in the ~47 and~40 kDa bands for MHN and MHS subjects. The difference is highly significant for the light band signal (p=0.015) but not for the 47 kDa band (P=0.14). (I) 40 kDa vs. 47 kDa signals for all patients. The correlation is highly significant (R=–0.69, p<0.001). Data trace. Raw data and statistical calculations in GSK3β graphs and statistics.JNB, sections 1 and 2 (all data in Harvard Dataverse described in Materials and methods). See also Figure 1—figure supplements 1–3.
-
Figure 1—source data 1
JPh1 raw blot shown in Figure 1A.
- https://cdn.elifesciences.org/articles/78874/elife-78874-fig1-data1-v1.zip
-
Figure 1—source data 2
Gel for JPh1 blot in Figure 1A.
- https://cdn.elifesciences.org/articles/78874/elife-78874-fig1-data2-v1.zip
-
Figure 1—source data 3
JPh44 raw blot shown in Figure 1B.
- https://cdn.elifesciences.org/articles/78874/elife-78874-fig1-data3-v1.zip
-
Figure 1—source data 4
Gel for JPh44 blot of Figure 1B.
- https://cdn.elifesciences.org/articles/78874/elife-78874-fig1-data4-v1.zip
-
Figure 1—source data 5
Raw blot in Figure 1F.
- https://cdn.elifesciences.org/articles/78874/elife-78874-fig1-data5-v1.zip
-
Figure 1—source data 6
Gel for blot of Figure 1F.
- https://cdn.elifesciences.org/articles/78874/elife-78874-fig1-data6-v1.zip
Figure 1—figure supplement 1
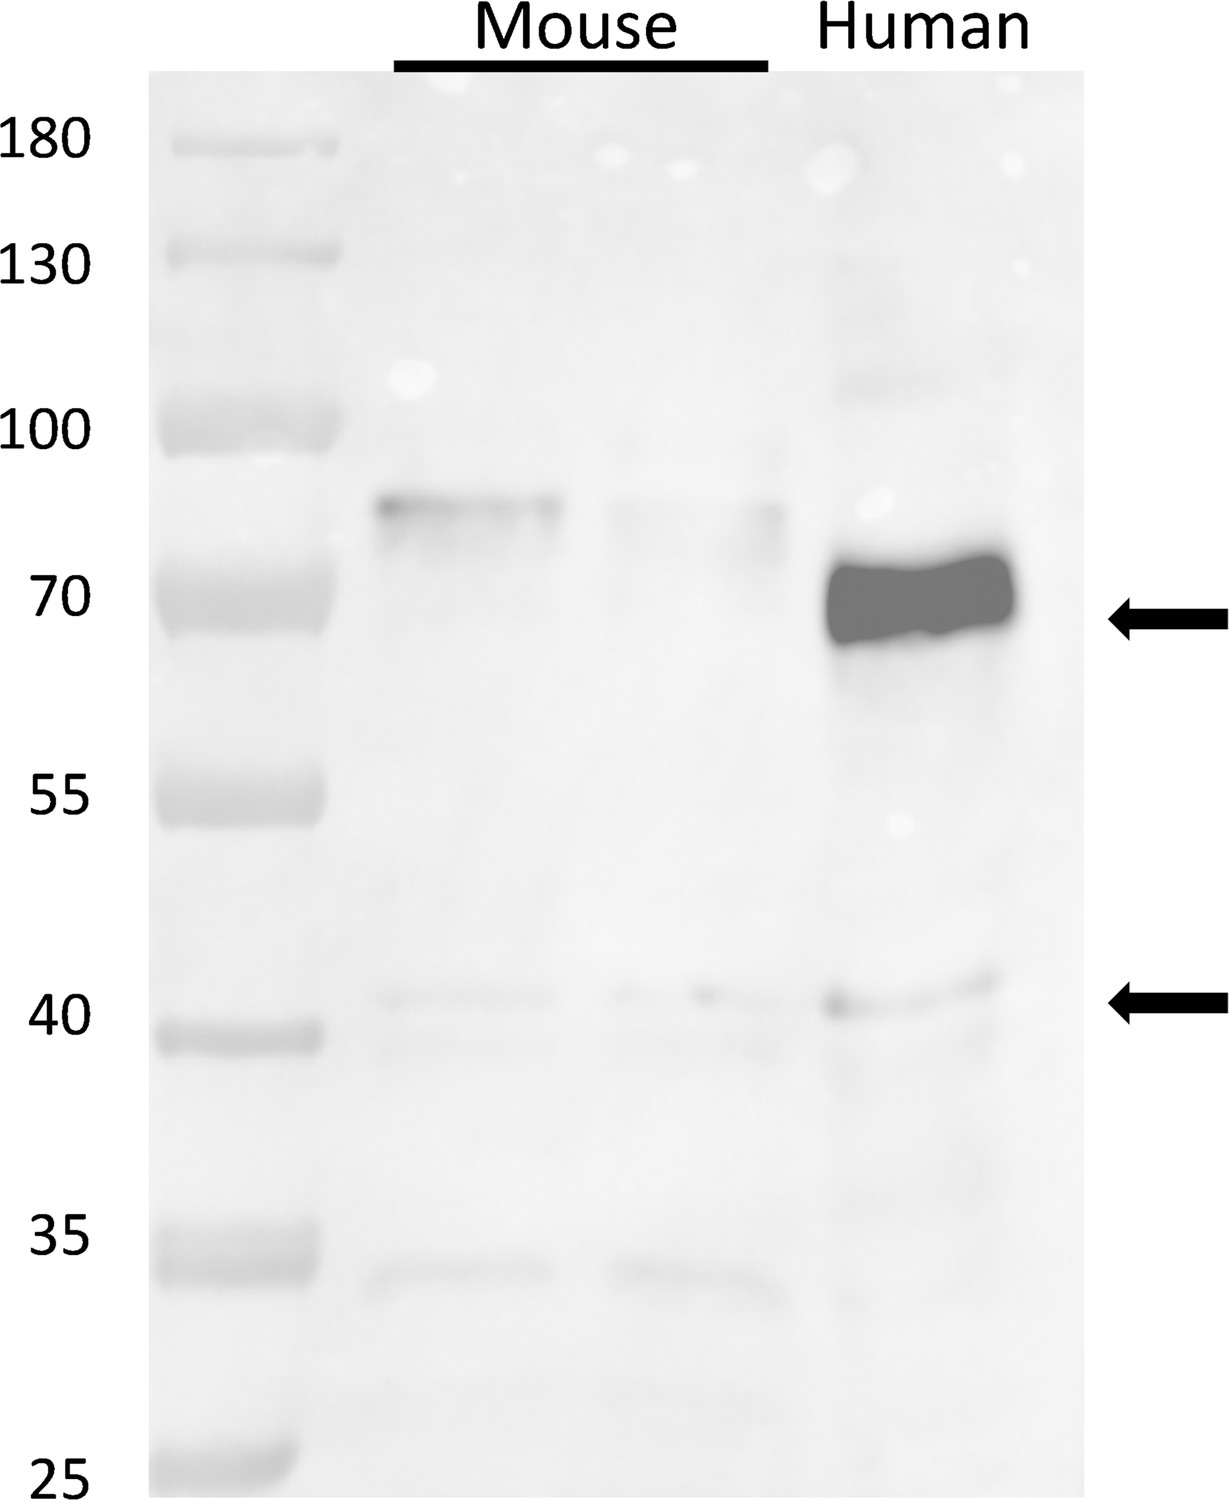
Staining of muscle extracts from mice and a human subject, by antibody A, raised against a human JPh1 immunogen (residues 387–512).
The antibody tags two proteins at ~72 and~44 kDa in the human sample, and at ~80 and 44 kDa in the mouse.
-
Figure 1—figure supplement 1—source data 1
Raw blot of JPh1 (abA).
- https://cdn.elifesciences.org/articles/78874/elife-78874-fig1-figsupp1-data1-v1.zip
-
Figure 1—figure supplement 1—source data 2
Originating gel (right half) for raw blot of JPh1.
- https://cdn.elifesciences.org/articles/78874/elife-78874-fig1-figsupp1-data2-v1.zip
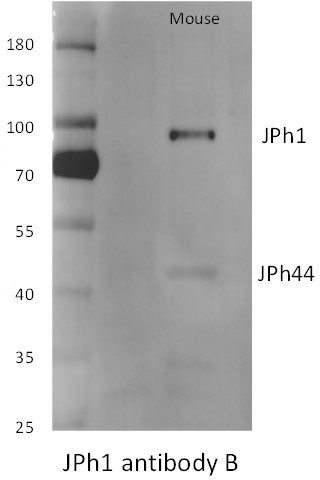
Figure 1—figure supplement 2
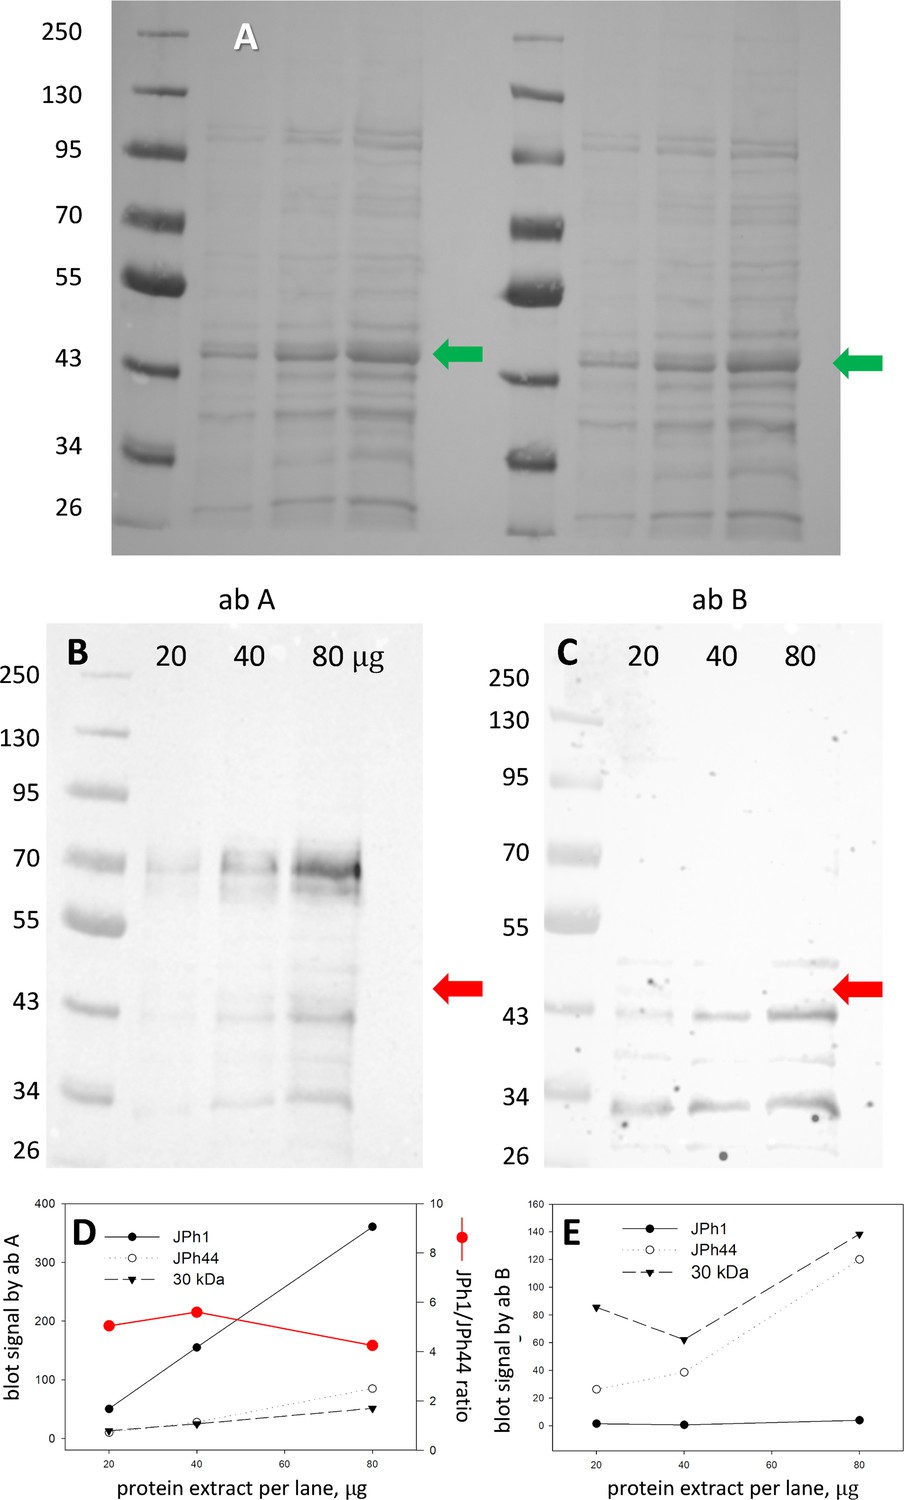
Specificity of junctophilin antibodies.
(A) Ponceau-stained gel. Human biopsied muscle was lysed in RIPA buffer. Protein extract was exposed for 5 min at room T to 0.3 U calpain/30 μg of total protein. The reaction was stopped with loading buffer. 20, 40, and 80 μg of boiled extract, at 2 μg/μl, was loaded into PAGE wells as shown. (B, C), Blots, from left and right halves of gel A, stained with junctophilin antibodies A and B. (D, E) Filled circle, signal in main band at ~70 kDa (‘JPh1’); open circle, band at ~43 kDa ‘JPh44’; triangle, at ~30 kDa. Red circle in D ratio of JPh1 to JPh44 signals, indicating rough proportionality of both ab A signals with well load. By contrast, ab B (panel E) does not react with JPh1. Due to its lack of proportionality with load, the signal at 30 kDa is difficult to assign. Arrows in A mark location of actin, recognizable by its abundance. Red arrows in B and C are transferred from panel A, to show that the blot signals at~43kDa mark a different protein. Data trace: images 103022a; subject ID #175 (MHS). Graphs in patient175byA_B_load.JNB.
-
Figure 1—figure supplement 2—source data 1
Different amounts of human muscle total extract, blot stained with Junctophilin abA as presented in Figure 1—figure supplement 2.
- https://cdn.elifesciences.org/articles/78874/elife-78874-fig1-figsupp2-data1-v1.zip
-
Figure 1—figure supplement 2—source data 2
Different amounts of human muscle total extract, blot with Junctophilin abB as presented in Figure 1—figure supplement 2.
- https://cdn.elifesciences.org/articles/78874/elife-78874-fig1-figsupp2-data2-v1.zip
-
Figure 1—figure supplement 2—source data 3
Originating gel for blots in Figure 1—figure supplement 2.
Junctophilin abA blot is obtained from the left half and abB blot is obtained from the right half of the membrane shown.
- https://cdn.elifesciences.org/articles/78874/elife-78874-fig1-figsupp2-data3-v1.zip
Figure 1—figure supplement 3
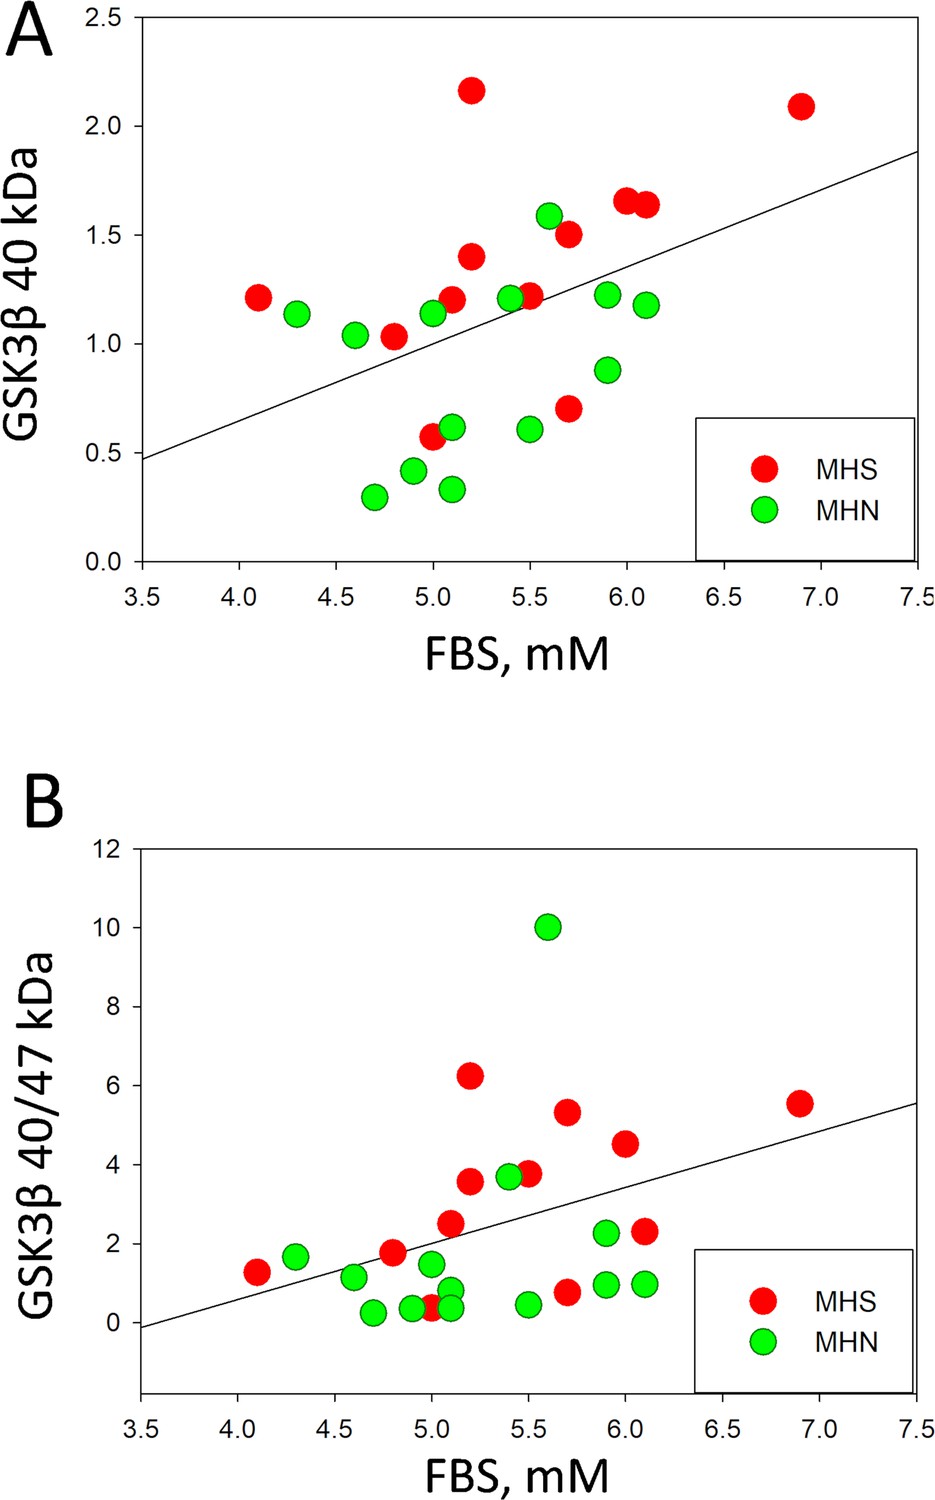
Plots of Fasting Blood Glucose (FBS) measured in the 25 patients with analysis of GSK3β analysis reported in Figure 1, vs. the normalized content of truncated (activated) GSK3β (panel A), or the truncated/full-size ratio of contents (panel B).
The variables are positively correlated; R=0.45 for panel A and 0.38 for panel B. The probabilities p of no correlation are 0.02 and 0.06, respectively.
Figure 2 with 6 supplements
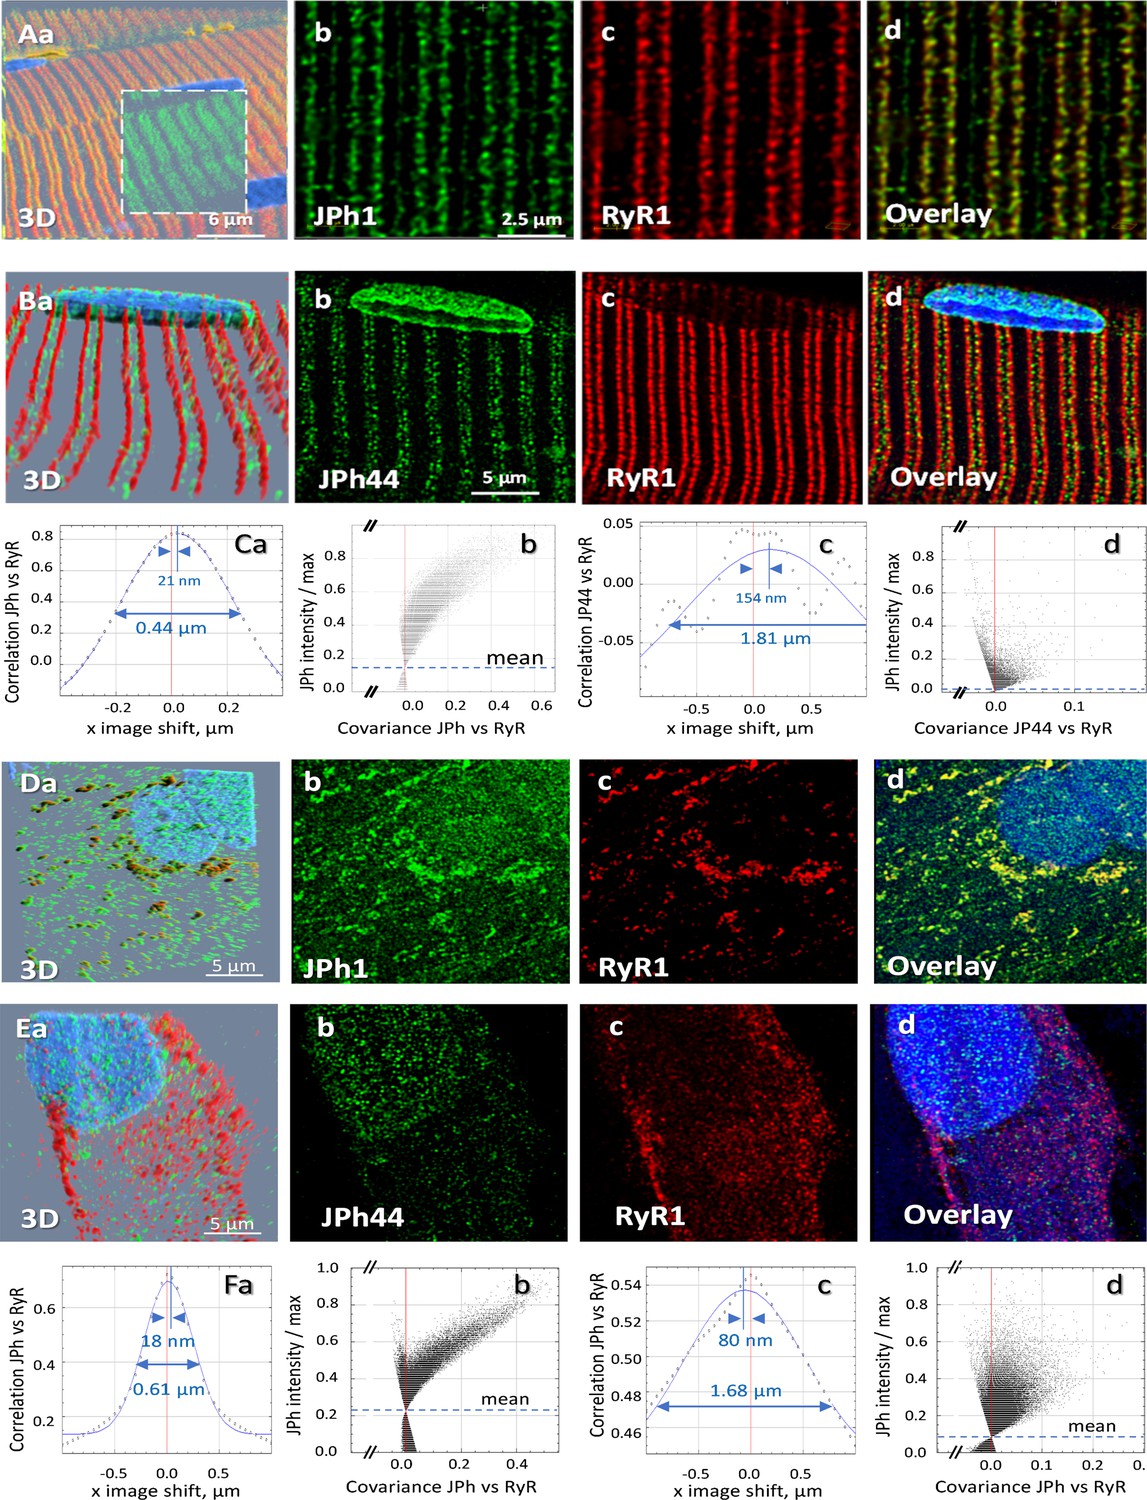
Location of two forms of junctophilin in human skeletal myofibers and myotubes.
(A, B) Images respectively stained with antibodies A and B, in cells co-stained for RyR1 (Overlay panels add nuclear staining). JPh1 (ab A) and Ryr1 (panels Ab, c) are highly colocalized at T-SR junctions. JPh44 (ab B) moves away into the I band (panels Bb, d). Colocalization between JPh1 and RyR1 is high, as demonstrated by the Van Steensel’s and Li’s analyses (panels Ca, b), leading to 4 measures (R, VS shift, FWHM and ICQ) listed in Table 1. As indicated in Ca, VS shift is 21 nm and FWHM is 0.44 µm. Colocalization of JPh44 and RyR2 is lost, as indicated by a VS shift of 154 nm, a FWHM of 1.8 µm defined on a Gaussian that fits poorly an oscillating VS plot and a Li plot characteristic of no colocalization and exclusion (compare panels Cb and Cd). (D, E) Primary myotubes derived from patients’ muscle, stained respectively with abs A and B, and co-stained for RyR1. Note in panels D, overlap of JPh1 (ab Al) with cytosolic RyR1. In (E) JPh44 (ab B) is largely intra-nuclear, with no colocalization with RyR1. Visual impression is supported by colocalization analyses (panels F, replication results in Table 1). Data trace. Average colocalization measures are listed in Table 2. Experiment identifiers: panel A, 102919La Series 010 (ID 167, HH); panel B, 102519 L Series 018; panels D, G, 072420Lb Series 002; panel E, 030120Lb Series 001. Data in Summary ratios.xlsx.
Figure 2—figure supplement 1
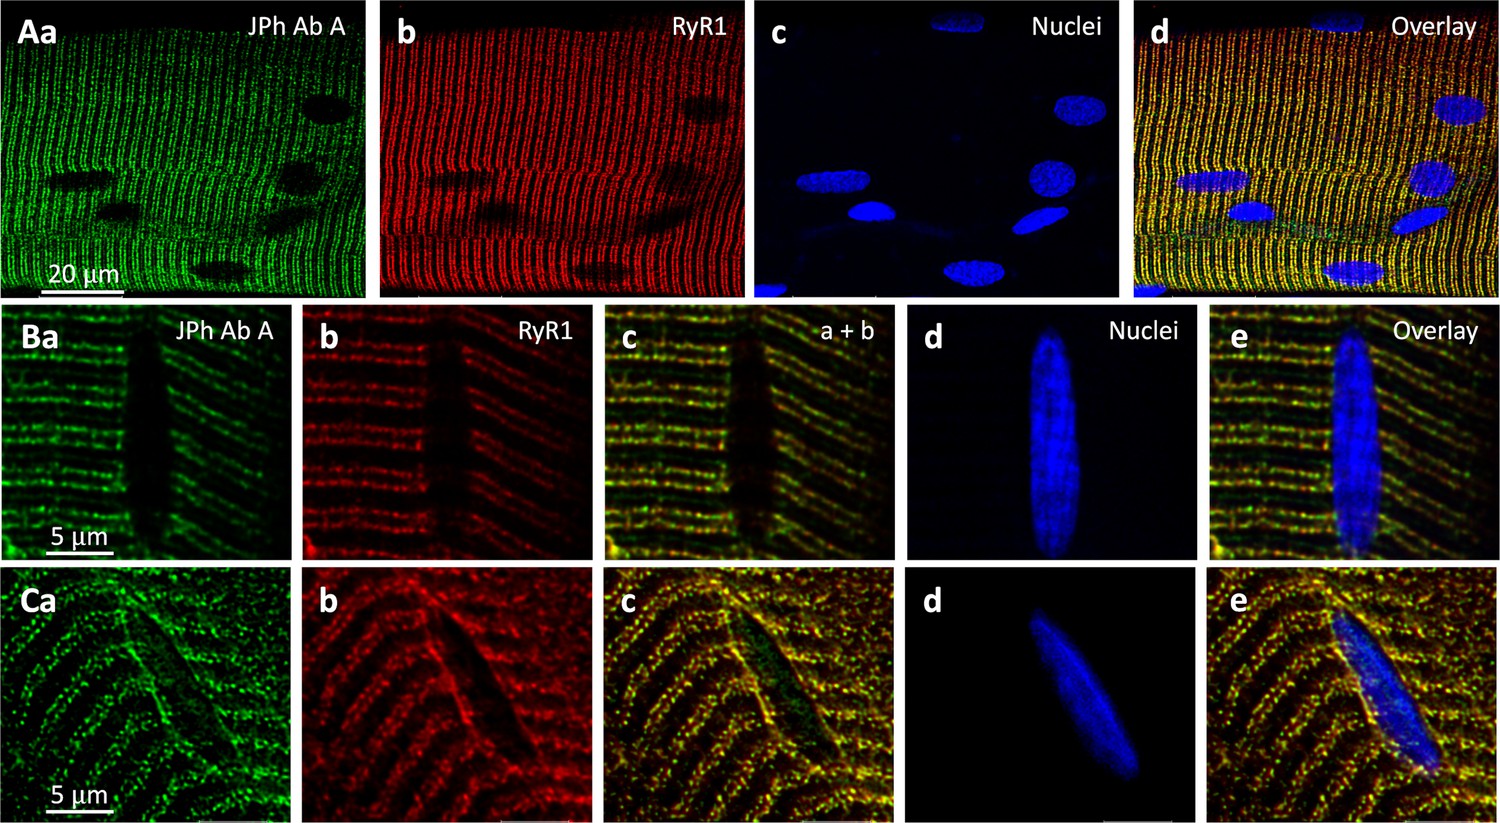
IF images from the human fiber bundle illustrated in Figure 2, stained with the anti-JPh1 ab A, and RyR1 and nuclear markers.
Row A shows strong colocalization of ab A and RyR1 signals, and weak or no staining at nuclei. B and C show detail in two regions of the same bundle: in B from a region with conserved structure and triad alignment, and no intra-nuclear ab A staining at this gain. In C, an area of disrupted structure, near visible damage, shows misaligned protein markers and ab A intra-nuclear staining. Based on the ab A signal, the intra-nuclear protein could be JPh1 or its 44 kDa fragment. The strong ab B signal inside nuclei (Figure 2) and its specificityfor JPh44 (Figure 1—figure supplements 1 and 2) identify the intranuclear signal in panel Ca as the JPh44 fragment. Data trace: Patient ID 167 (HH; same as in Figure 2), images in 102422La, series 003 (A), 005 (B) and 002 (C). All images from z stacks corrected for optical dispersion.
Figure 2—video 1
3D rendering of MHN muscle stained with Ab B and RyR1.
Figure 2—video 2
3D rendering of MHS muscle stained with Ab B and RyR1.
Figure 2—video 3
3D rendering of MHN muscle stained with Ab A and RyR1.
Figure 2—video 4
3D rendering of MHS muscle stained with Ab A and RyR1.
Figure 2—video 5
3D rendering of MHS muscle stained with Ab B and RyR1.
Figure 3 with 4 supplements
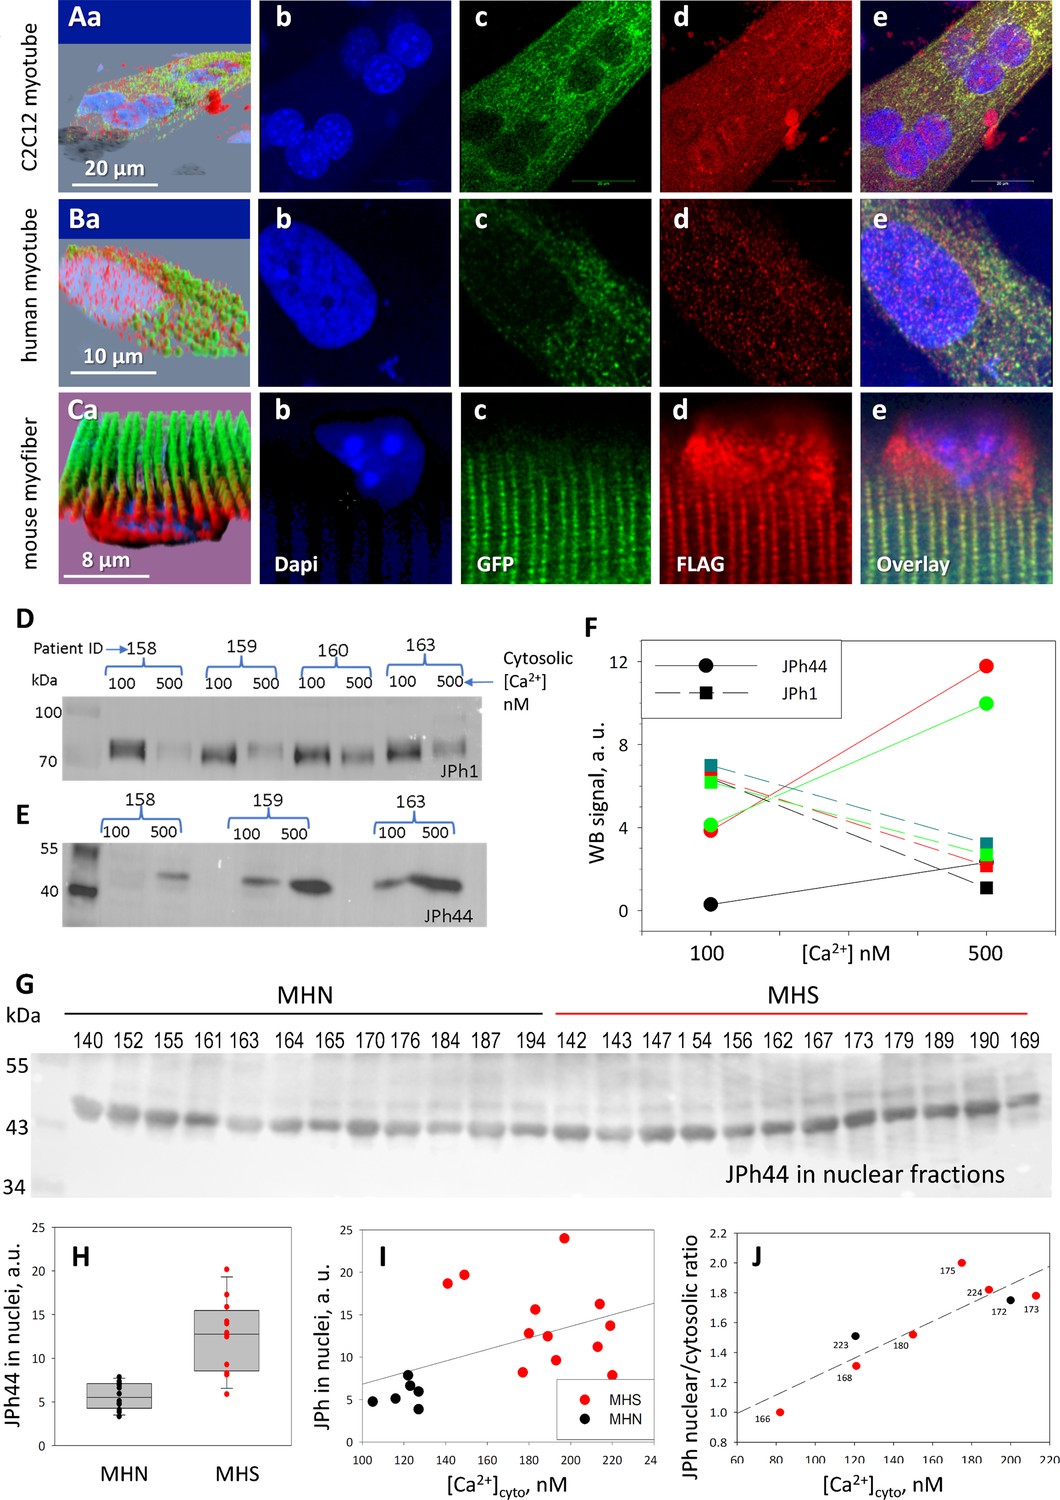
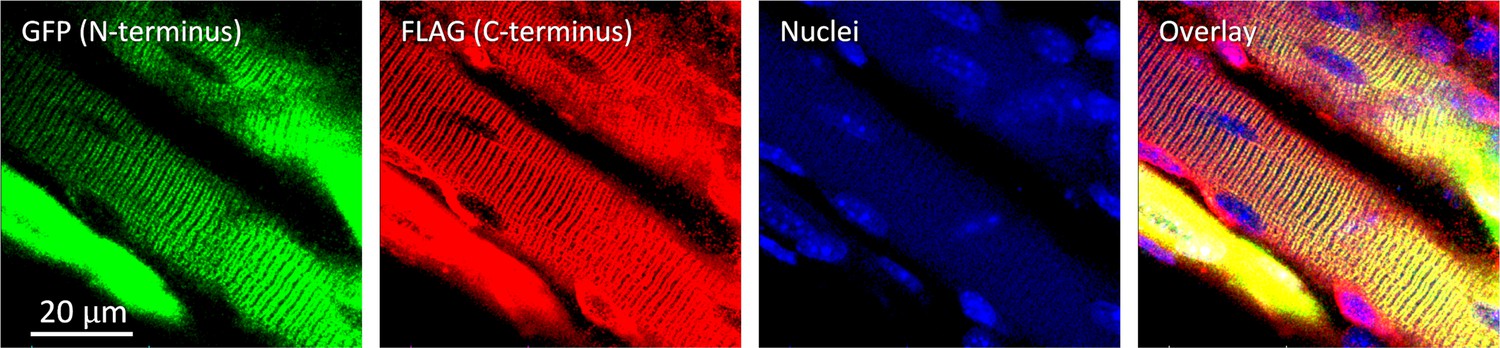
Distribution of a dually tagged JPh1 and its fragments.
(A-C) Confocal images of cells expressing the (N)GFP-JPh1-FLAG(C) construct. In myotubes (A, B), GFP is exclusively in the cytosol, while FLAG, marking the full-size protein and its C-terminal fragment(s), red, distributes widely, including inside nuclei. The different distribution is also evident in adult myofibers (panels C), with the additional observation of accumulation of the N-terminal fragment in perinuclear regions (Cd). Panels Aa, Ba and Ca -- 3D views of the image stacks -- show the intranuclear location of FLAG. Full stacks are viewable as Supp. videos to Figure 3. The distribution differences are highly significant (details in Table 3). (D-F) Effect of extracellular Ca2+ on JPh1 content of permeabilized muscle from four subjects. JPh1 (ab A) and the 44 kDa fragment (ab B) changed reciprocally in muscles exposed to 500 vs 100 nM [Ca2+]. (G) JPh44 (stained by ab B) in whole muscle nuclear fraction extracted from 12 MHN and 12 MHS individuals. H, the average content is more than twofold greater in MHS (p<0.001). (I) JPh44 content in nuclei (from WB in panel G) vs. [Ca2+]cyto in primary myotubes from the same muscle samples, showing a statistically significant positive correlation (R=0.48, p=0.04). (J) Ratio JPh content in nuclei / JPh in cytosol, in images of myotubes stained with ab A, vs. [Ca2+]cyto. The correlation is positive and statistically significant (R=0.88, p=0.004). Data trace: A: experimental record 091620 a Series 5 Lng; B: 091020 a Series 4 Lng, from patient MHN #179; C: 100520 a Series 2. F, H–J in JPh vs Ca and GSK3b vs FSB.JNB. F in Section 1, I in Section 2, J in Section 3.
-
Figure 3—source data 1
JPh1 raw blot in Figure 3D.
- https://cdn.elifesciences.org/articles/78874/elife-78874-fig3-data1-v1.zip
-
Figure 3—source data 2
Originating gel for blot in Figure 3D.
- https://cdn.elifesciences.org/articles/78874/elife-78874-fig3-data2-v1.zip
-
Figure 3—source data 3
Raw blot in Figure 3E (boxed region).
The bands of upper molecular weight (particularly at 70 kDa) result from earlier incubation of same membrane with JPh1 abA and its incomplete stripping. Last 3 lanes in the blot are unrelated to the experiment.
- https://cdn.elifesciences.org/articles/78874/elife-78874-fig3-data3-v1.zip
-
Figure 3—source data 4
Gel for Figure 3E.
- https://cdn.elifesciences.org/articles/78874/elife-78874-fig3-data4-v1.zip
-
Figure 3—source data 5
Raw blot for Figure 3G.
- https://cdn.elifesciences.org/articles/78874/elife-78874-fig3-data5-v1.zip
-
Figure 3—source data 6
Originating gel for blot in Figure 3G.
- https://cdn.elifesciences.org/articles/78874/elife-78874-fig3-data6-v1.zip
Figure 3—figure supplement 1
Muscle bundle from adult, presumably normal mouse expressing GFP-JPh1-FLAG.
Illustrates location of JPh and its fragments inside nuclei, null for N terminus and variable but scarce for C terminus. Data trace: 100520La_004.
Figure 3—video 1
The z-stack from which panels A in Figure 3 were derived, as animated series.
Figure 3—video 2
The z-stack from which panels B in Figure 3 were derived, as animated series.
Figure 3—video 3
The z-stack from which panels C in Figure 3 were derived, as animated series.
Figure 4 with 2 supplements

Activation and activity of calpain 1 in muscles of MHS patients.
(A) JPh1 sequence indicating conserved stretches and the two calpain cleavage sites with highest priority score, located between MORN motifs VI and VII. (B) The 5 top-priority cleavage sites predicted by GPS-CCD 1.0 (Li et al., 2004). (C) JPh1 secondary structure, showing location of the highest priority cleavage site (R240-S241), helix-turn-helix DNA interaction site and TMD in SR junctional membrane. (D) Conservation of the preferred cleavage sites R240-S241 and S233-S234 in mammalian orthologs, which produce in every case a C-terminal fragment of ~44 kDa. (E) WB of whole-tissue protein fraction in biopsied muscle of 13 MHN and 12 MHS patients, showing a dual band at ~80 kDa (details in Figure 4—figure supplement 1). (F) Box plot of full-size and 76 kDa truncated forms, compared in the MHN and MHS groups. (G) Distribution of ratios of 76/80 kDa forms. Median ratio in MHS (1.97) is 74% greater than that in MHN (1.13) with p=0.029 of no difference. Automatic quantification of the WB is in Figure 4—figure supplement 2. (H, I, J) Correlation of ratios of 76/80 kDa junctophilin 1 with contents of full-length JPh1 and GSK3β, and ratio of activated to full-length forms of GSK3β, derived by WB of the same muscle fractions used for the blot in panel E. The correlation coefficients R and p of no correlation are: for H –0.65 and <0.001; for I –064 and <0.001; for J 0.61 and 0.001. Data trace: Panels E-G and H-J respectively in sections 6 and 5 of Calpain files with correlations ER IDL. JNB.
-
Figure 4—source data 1
Raw blot for Figure 4D (boxed region).
Lower part of the blot, with calpain fragments of small molecular weight is shown in Figure 4—figure supplement 2.
- https://cdn.elifesciences.org/articles/78874/elife-78874-fig4-data1-v1.zip
-
Figure 4—source data 2
Originating gel for blot in Figure 4D.
- https://cdn.elifesciences.org/articles/78874/elife-78874-fig4-data2-v1.zip
Figure 4—figure supplement 1
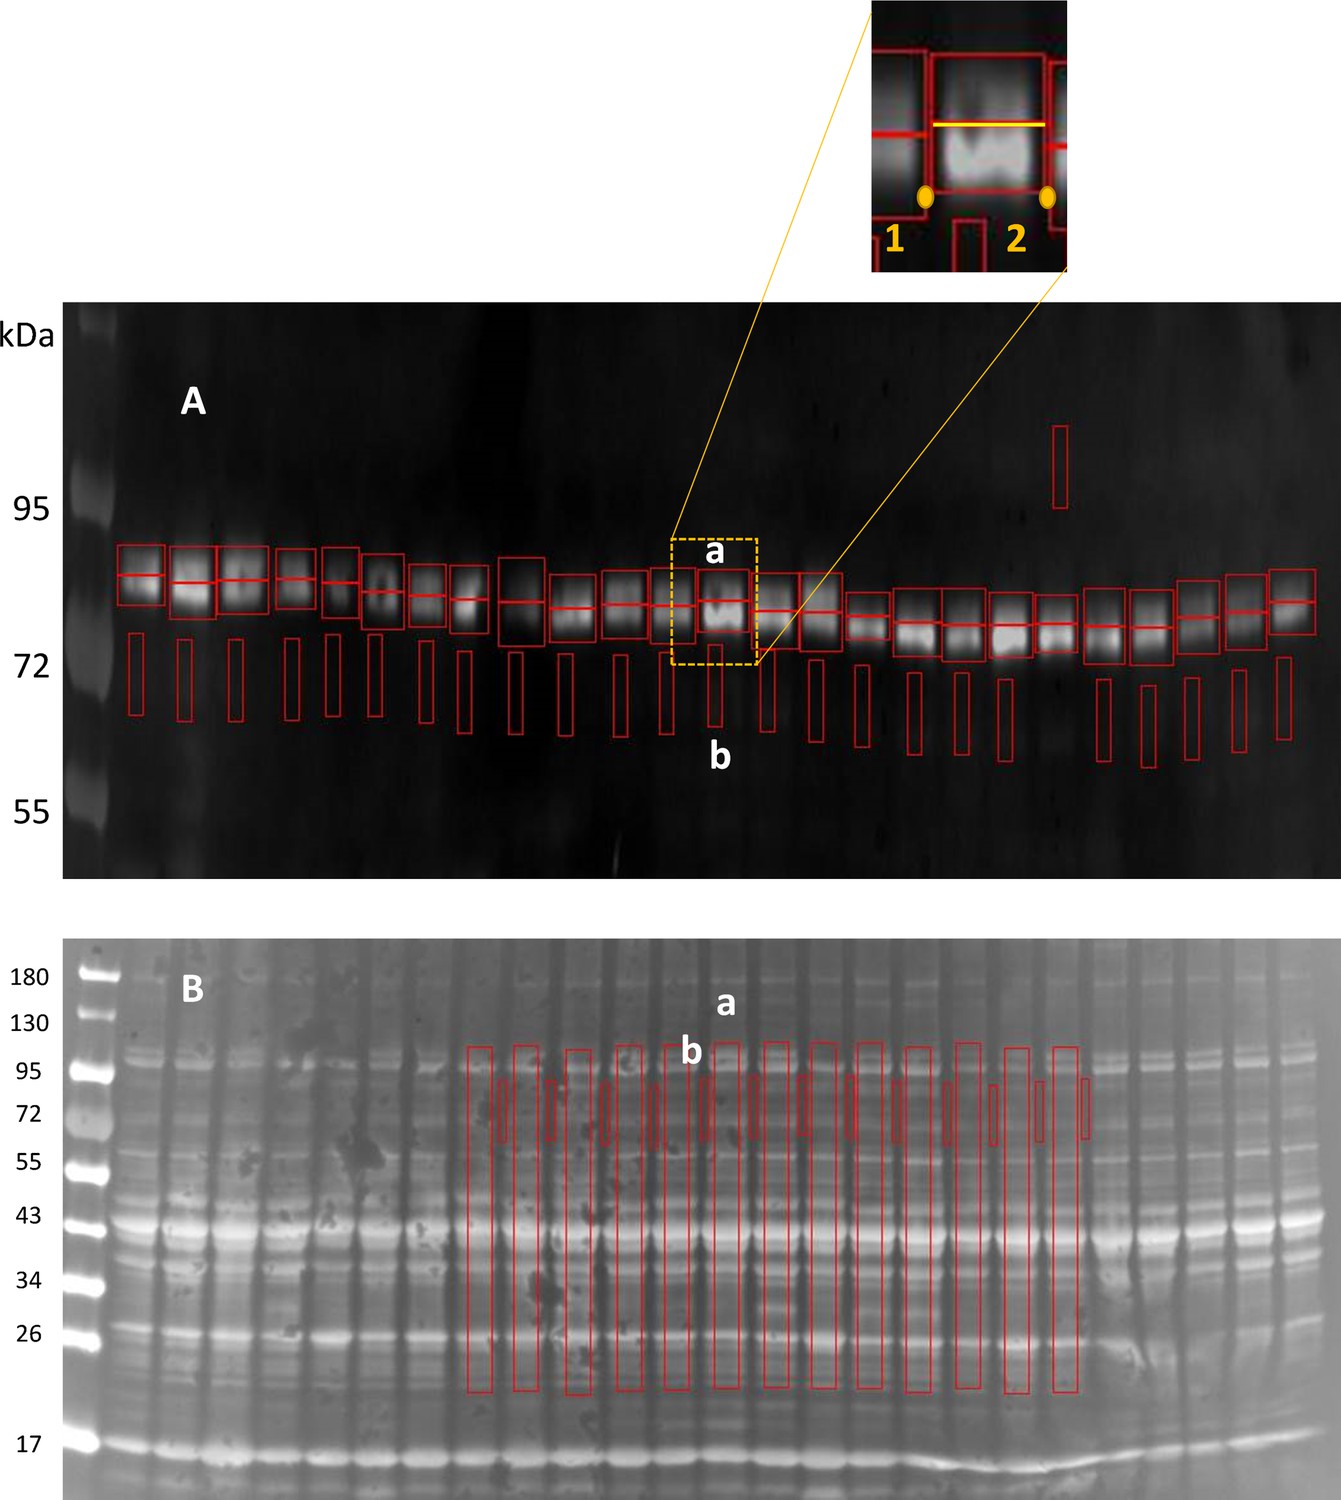
A streamlined method to quantify double bands in western blots.
The method introduced by Tammineni et al., 2020 was modified for objective analysis of closely placed double bands. (A) Western blot, stained for calpain1 (reproduced from Figure 4E, at ×4 magnification in the vertical direction, converted to ‘positive’, that is, with pixel values corresponding to reporter intensity signal), shows closely placed bands at approx. 80 and 76 kDa. (B) The originating gel, at the original magnification. On WB (panel A), working on one column at a time, the user selects a background region ‘b’ and starts the definition of two active region of interest (ROIs) ‘a’ by marking points 1 and 2 (inset), which define the width of the ROIs. The program then locates automatically a border between the two close bands (yellow segment), at the minimum of the bands signal, averaged in the horizontal direction. For columns where the minimum used to define the border in A is ill-defined, the user defines the lower ROI by clicking two diagonal corners, lower left and upper right; the border between the two bands is then defined by the upper corner. Two symmetrical ROIs (red rectangles) are thus defined, where the signals of the two bands are integrated. For normalization to total quantity of protein, the signals are then normalized by the total signal in the corresponding column of the Ponceau-stained gel, calculated as the difference between the signal integrated over active area ‘a’ (in B), after subtraction of background ‘b’. All ROIs ‘a’ in B have the same area. Program code, written in the IDL environment (Geospatiale, Paris, France), is attached as text file ‘Blot_n_rot_double.txt’.
Figure 4—figure supplement 2
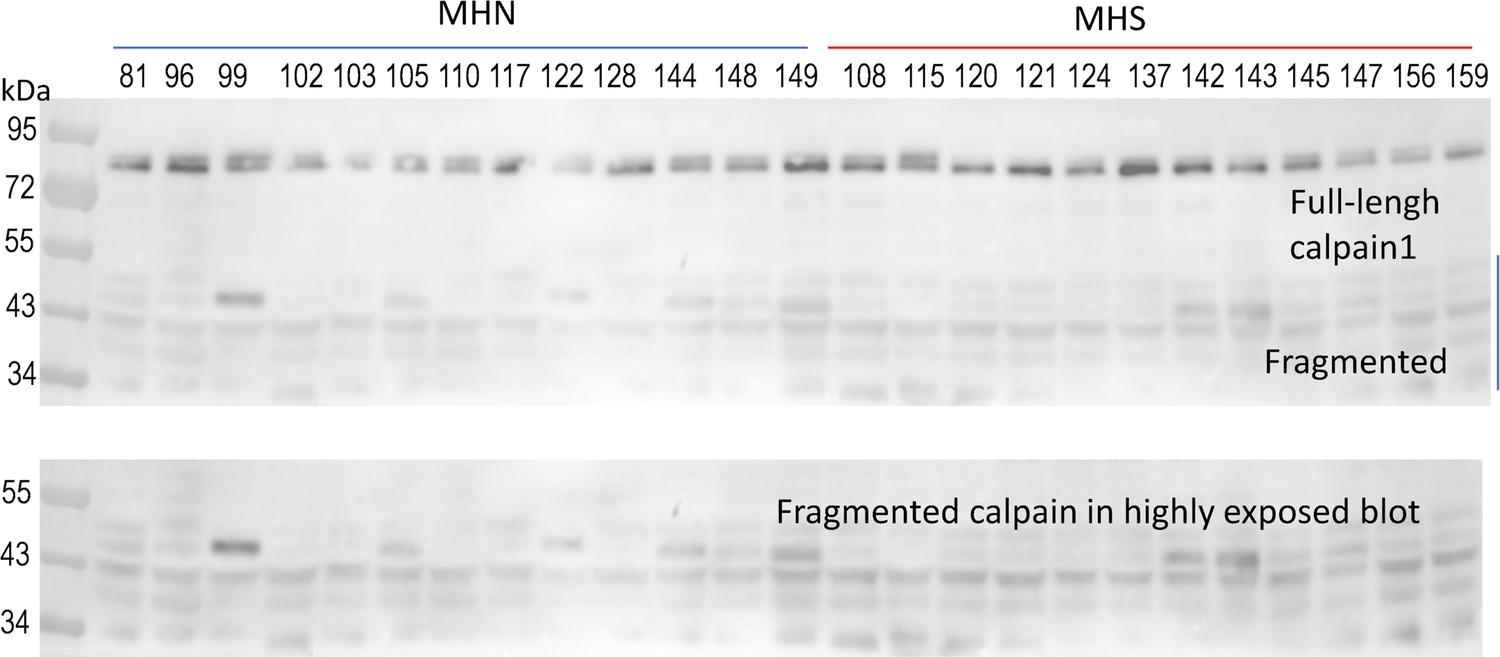
Western blot of calpain1 in whole-tissue protein of human subjects.
Same as in Figure 4E, extending range to show multiple low-weight fragments. The region of fragments is shown in the bottom panel, developed at higher exposure.
-
Figure 4—figure supplement 2—source data 1
Raw blot (boxed area in pdf document).
- https://cdn.elifesciences.org/articles/78874/elife-78874-fig4-figsupp2-data1-v1.zip
-
Figure 4—figure supplement 2—source data 2
Originating gel.
- https://cdn.elifesciences.org/articles/78874/elife-78874-fig4-figsupp2-data2-v1.zip
Figure 5 with 1 supplement
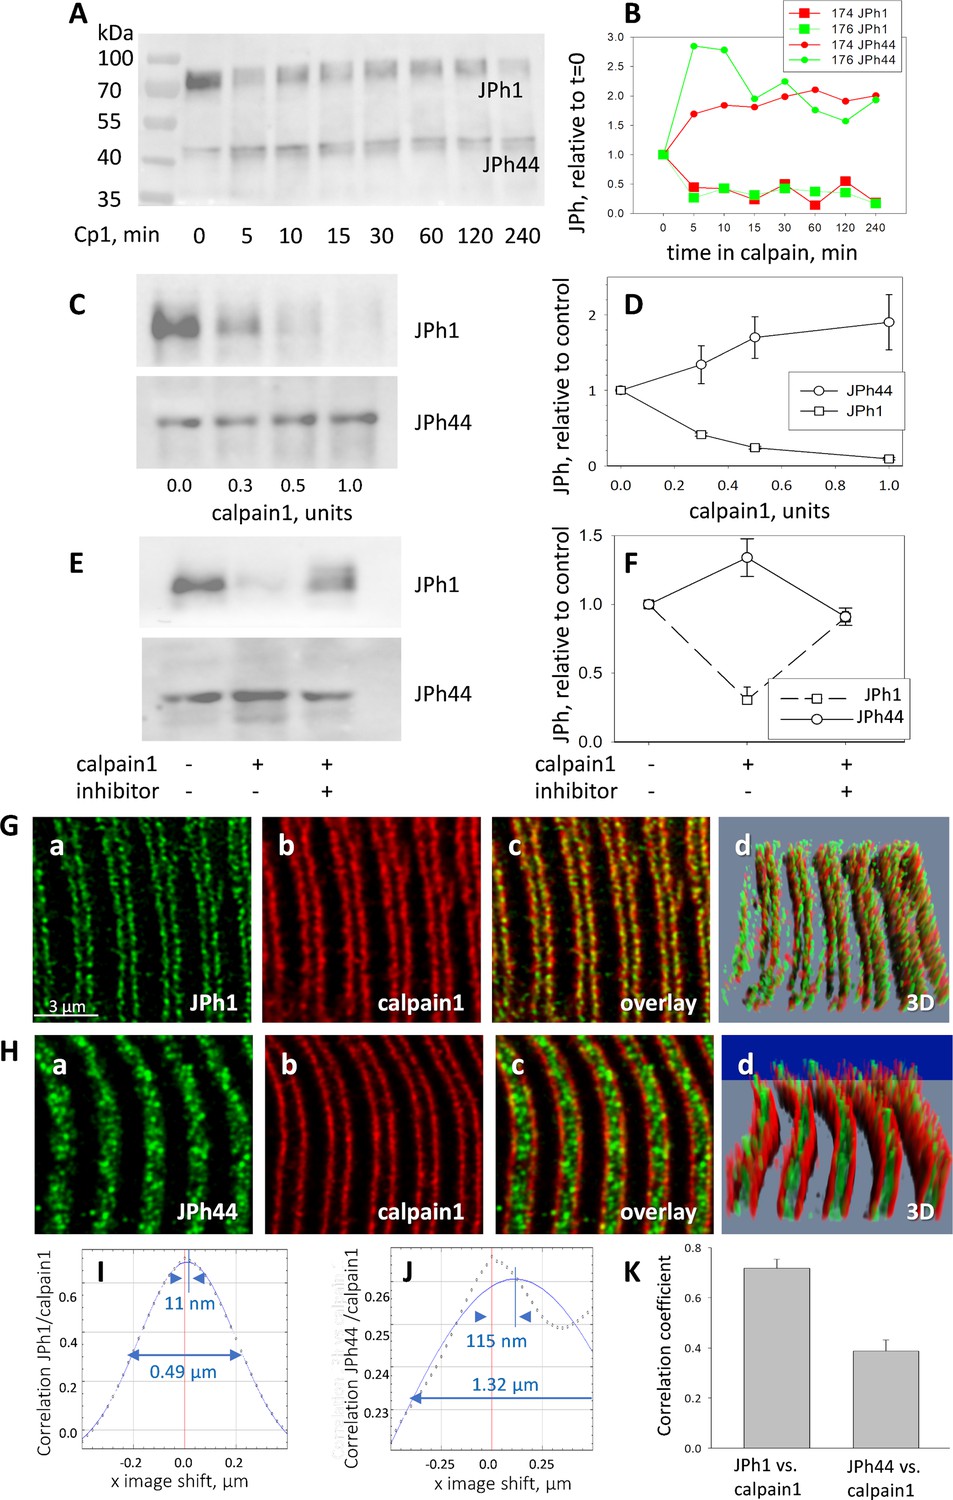
Calpain 1 effects and cellular location.
(A, B) time dependent changes in content of JPh1 and JPh44 in total protein extracts from patients’ muscle, incubated with 0.5 units of calpain1 for different intervals (ab A). (B) Quantities normalized to initial value. Colors represent different experiments, on tissue from different individuals (2 replicates). (C, D) Effect of different doses of calpain1 incubated 10 min with the same extract (n=5 replicates in extracts from 5 subjects). Bars depict SEM. (E, F) Effect of calpain at 0.5 units for 10 min, with or without MDL28170 (n=5). In C and E, ab B was used in the JPh44 blot. (G, H) Confocal images of JPh1 and JPh44 (abs A and B), in muscle co-stained for calpain 1. Gd and Hd are 3D representations of the full z-stack, showing movement of JPh44 away from T-SR junctions (the location of calpain) and into the I band. (I, J) Van Steensel’s plots show large differences in colocalization parameters VS shift and FWHM, quantifying movement of JPh44 away from calpain. (K) Correlation between calpain and JPh1 or JPh44 signals. As shown by statistical analysis of replicates in Table 5, the differences in colocalization parameters are highly significant. Data trace. A, B, and E, F in Calpain files with correlations ER IDL.JNB (sections 1 and 4). G, H, experiment 081020 a Series 5 and 081020b Series2, patient ID #183, MHS. IF images from a MHN subject, to show similar colocalization of JPh1 and calpain, are in Figure 5—figure supplement 1.
-
Figure 5—source data 1
JPh raw blot incubated with JPh abA shown in Figure 5A.
- https://cdn.elifesciences.org/articles/78874/elife-78874-fig5-data1-v1.zip
-
Figure 5—source data 2
originating gel for blot shown in Figure 5A.
- https://cdn.elifesciences.org/articles/78874/elife-78874-fig5-data2-v1.zip
-
Figure 5—source data 3
JPh1 raw blot in Figure 5C.
- https://cdn.elifesciences.org/articles/78874/elife-78874-fig5-data3-v1.zip
-
Figure 5—source data 4
JPh44 raw blot in Figure 5C.
- https://cdn.elifesciences.org/articles/78874/elife-78874-fig5-data4-v1.zip
-
Figure 5—source data 5
Originating gel for blots in Figure 5C.
- https://cdn.elifesciences.org/articles/78874/elife-78874-fig5-data5-v1.zip
-
Figure 5—source data 6
JPh1 blot in Figure 5E.
- https://cdn.elifesciences.org/articles/78874/elife-78874-fig5-data6-v1.zip
-
Figure 5—source data 7
JPh44 blot in Figure 5E.
- https://cdn.elifesciences.org/articles/78874/elife-78874-fig5-data7-v1.zip
-
Figure 5—source data 8
Originating gel for Figure 5E.
- https://cdn.elifesciences.org/articles/78874/elife-78874-fig5-data8-v1.zip
Figure 5—figure supplement 1
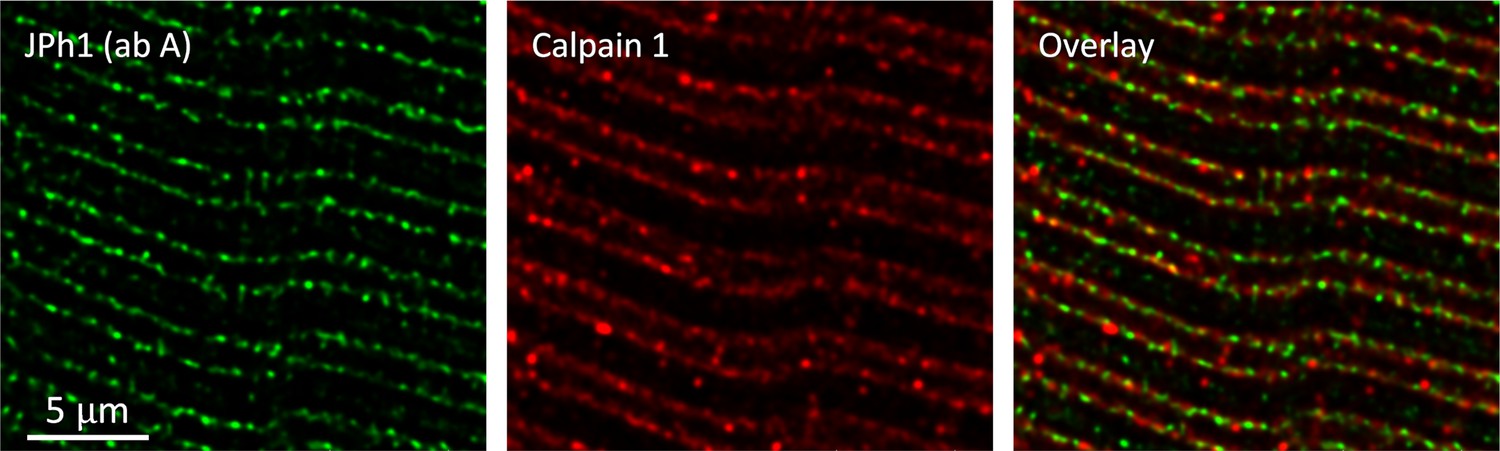
Distribution of calpain1 in myofibers from an MHN subject.
Muscle bundle co-stained with JPh1 ab A and calpain 1 antibody. Images from z-stacks after correction for optical dispersion. The location at triads and partial colocalization of both markers does not differ visibly from that in Figure 6, in muscle from an MHS patient. Data trace: 113021La_Series004. Subject ID #220.
Figure 6 with 1 supplement
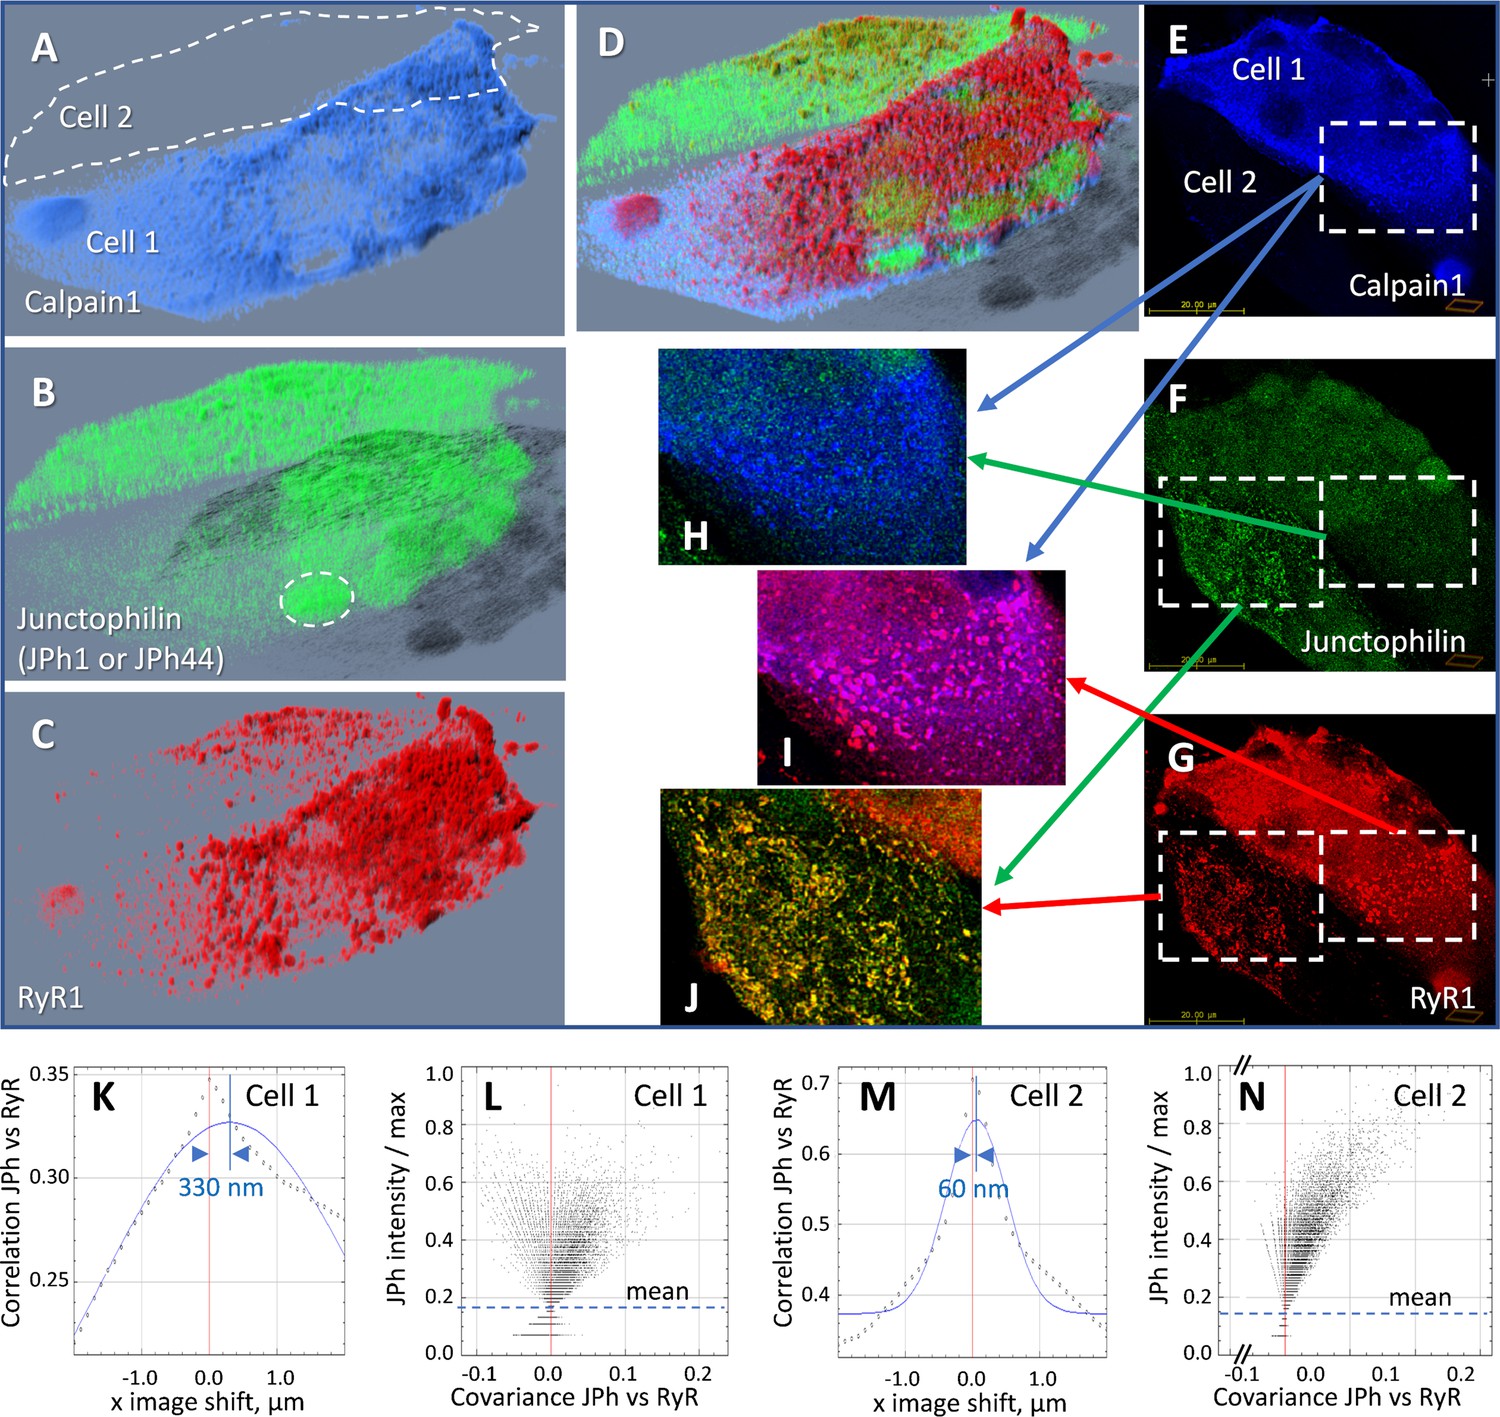
Effect of heterologous expression of calpain 1 on human-derived myotubes.
(A-D) 3D rendering of a z-stack of images from a culture of primary myotubes transfected with FLAG-calpain 1 (panel A), co-stained for junctophilin with antibody A, which tags both JPh1 and JPh44 (panel B) and RyR1 (panel C). While one of the myotubes (Cell 1) expresses calpain 1 abundantly, the other (Cell 2) does not. In Cell 1, junctophilin adopts a fine-grained appearance and occupies nuclei (e.g. ellipse in B), recognizable by the absence of RyR1 (C, D). In Cell 2 junctophilin is distributed in the cytoplasm, partly colocalized with RyR1. (E-G) An individual x-y image (slice) in the z-stack, with sub-sections magnified and superimposed to illustrate colocalization. (H) Calpain colocalizes poorly with ab A in Cell 1, as junctophilin is largely in cleaved, JPh44 form. (I) Calpain colocalizes highly with RyR1, forming clusters. (J) In Cell 2, which does not express calpain, ab A colocalizes highly with RyR1, indicating full-size JPh1. (K-N) Van Steensel’s and Li’s plots, showing poor colocalization of the junctophilin antibody and RyR1 in Cell 1 (K, L), contrasting with that in Cell 2 (M, N). Statistics of colocalization measures, comparing cultures with and without calpain, are in Table 6. Further evidence of the effect of calpain is provided with Figure 6—figure supplement 1. Data trace: Experiment 073020La Series 5. Myotubes derived from patient #180, tested as MHN. Data in ColocalizJp44andRyR.JNB sections 5 and 11.
Figure 6—figure supplement 1
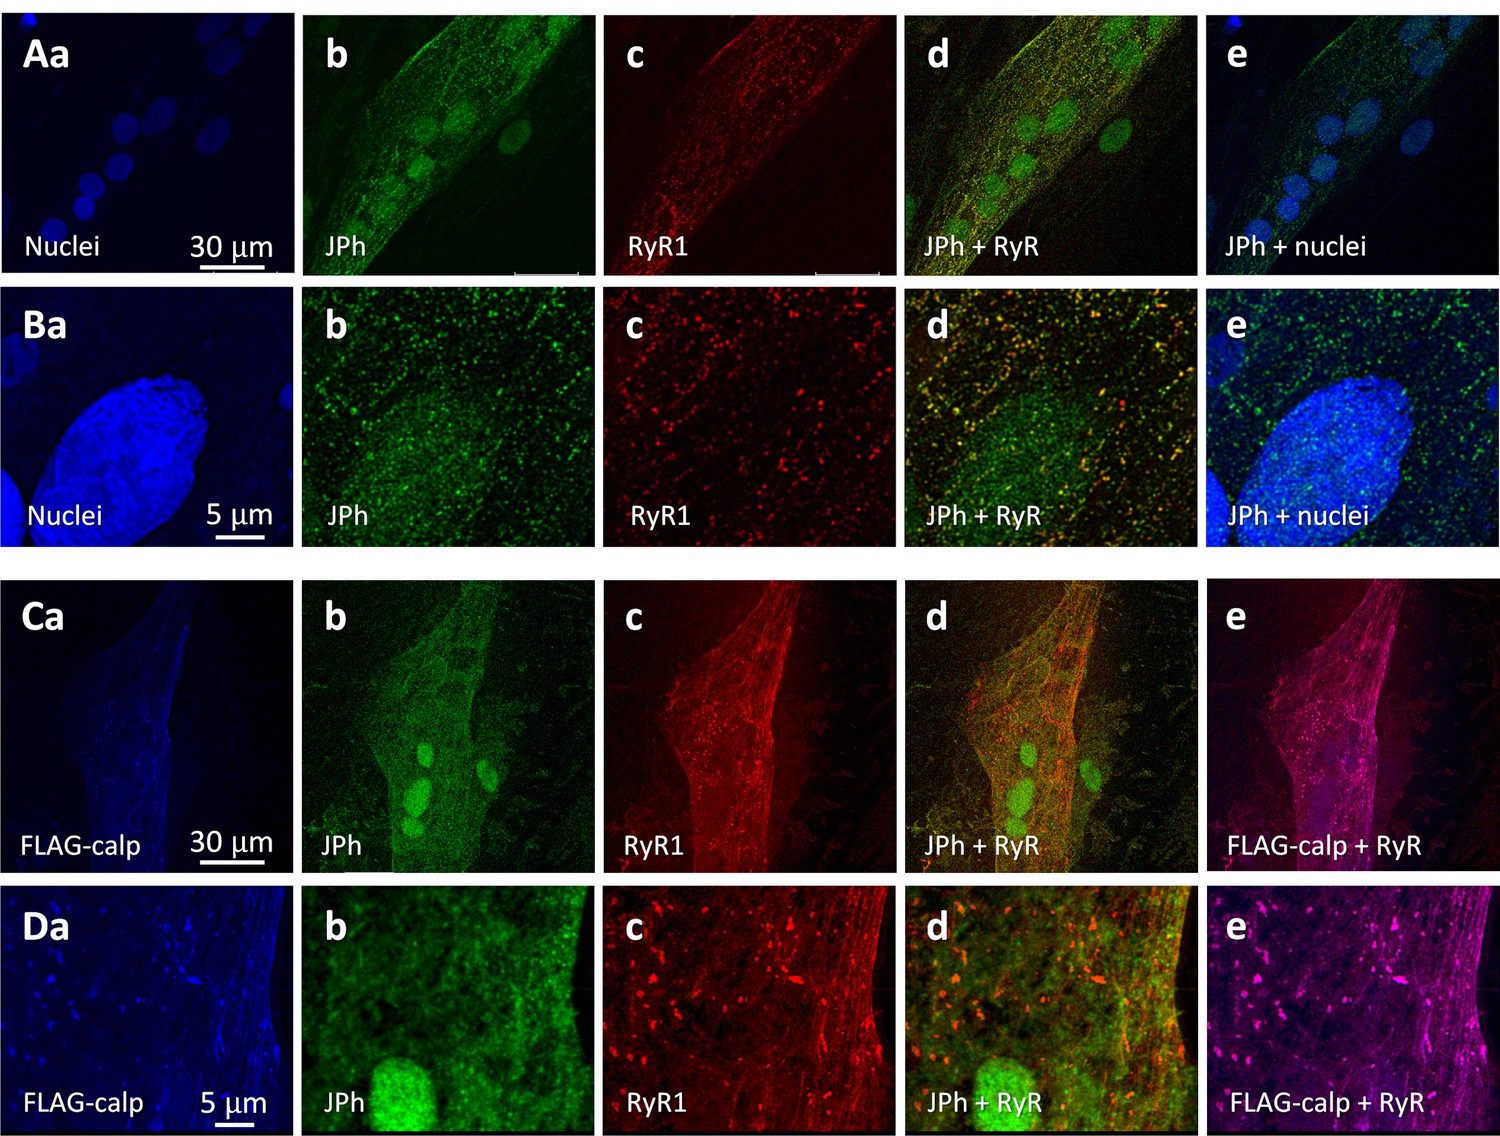
Calpain drives nuclear localization of JPh.
(A, B) Primary myotubes derived from subject # 180 (MHN) were stained with nuclear and RyR1 markers, and JPh1 ab A. JPh1 distributed both in cytosol and nuclei (Ab, e, Bb, e). JPh puncta in cytosol likely corresponds to JPh1, as they colocalized with RyR1. (C, D) Myotubes of the same individual, transfected with FLAG-calpain 1. Note loss of the JPh punctated pattern in cytosol and intense JPh ab A signals, of diffuse pattern, inside nuclei. FLAG-calpain is colocalized with RyR in puncta or clusters that likely correspond to developing junctions (Dd, e). As observed in Figure 6, expression of calpain seems to improve expression and clustering of RyR1. Data trace: (A) 073020Lb series 011; (B) 073020Lb series 012; (C) 073020La series 002; (D) 073020La series 003. All images taken from z-stacks corrected for optical dispersion.
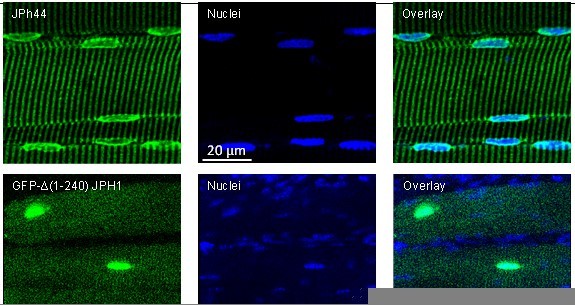
Figure 7
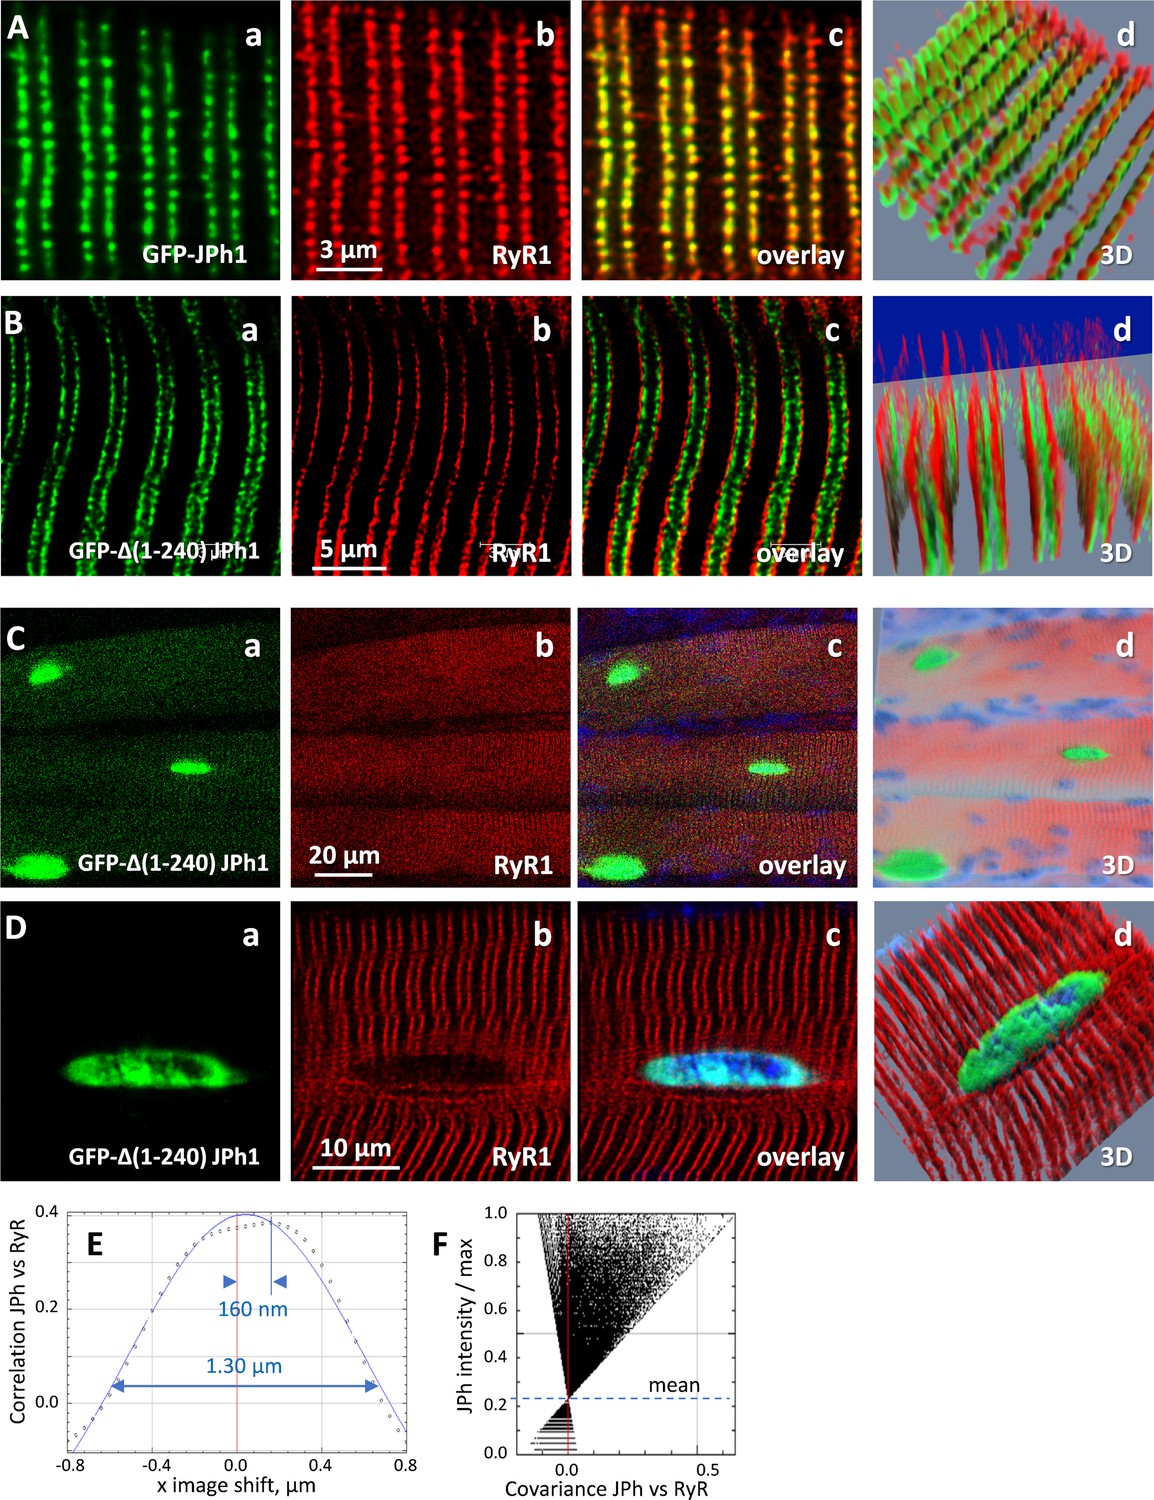
Expression of GFP-∆(1-240) JPH1 and GFP-JPh1 in adult mouse muscle.
(A) Confocal images of mouse FDB myofibers electroporated with plasmids encoding GFP-tagged, full-length JPh1, co-stained for RyR1. (B) Mouse FDB myofibers electroporated with plasmids encoding GFP-∆(1-240) JPh1. (C, D) Demonstrate the nuclear distribution of the protein upon electroporation of GFP-JPh1 ∆(1-240). (E, F) Van Steensel and Li plots, showing absence of colocalization between the exogenous construct and RyR1. Statistics of colocalization measures are in Table 7. Data trace: Source files: A, experiment 111220Lb, Series 1. B-D, 110920La, Series 1, 8, 9.
Figure 8 with 1 supplement

Regulation of transcription in C2C12 myoblasts.
(A) Confocal images of cells transfected with GFP-∆(1-240) JPh1 vector (‘∆-construct’) showing the expressed protein inside nucleus. (B) Heat map of significantly altered genes in myoblasts expressing GFP-empty vector or ∆-construct. (C) KEGG pathway enrichment analysis of transcripts significantly altered by the construct (analysis by LC Sciences, Houston, TX, USA). (D) Validation of 4 results in B by PCR in our laboratory. Samples from cultures transfected with ∆-construct. Significant differences for GSK3β, p=0.007; TRAF3, p=0.012; NGRF, pP=0.015. For Repin1, p=0.053. (E) Western blot of GSK3β in total cell extracts from cells expressing GFP-empty vector or ∆ construct. (F) GSK3β protein signal in WB of panel E. (G) Confocal image of GSk3β immuno-fluorescence (red), in C2C12 cells transfected with GFP-empty vector, to compare cells that expressed the marker (green) with those that did not. (H) Image for similar comparison of GSK3β content in cultures transfected with ∆ construct, showing deficit of GSK3β in expressing cells (green). (J) Comparison of ratios of GSK3 β signal in cells showing the GFP tag over those not expressing it. Statistics in Table 8 shows high significance of the difference. Data trace. Source files: A, 110121La series 003. B, C, gene expression profiling data in Dropbox / JPh / manuscript / F9 panels. D, in D:/Jph/ manuscript /f9 panels/ qPCR.JNB. E, uncropped blots and gels in raw western blots and gels.doc. F, in GSK3B levels.JNB in D:/JPh /manuscript/ F9 panels. G, 102921La series9. H, 110321 Lb series7. J, D:/Jph/manuscript/Fig1/GSK3B graphs and statistics.JNB, section 4.
-
Figure 8—source data 1
GSK3b raw blot for Figure 8E.
- https://cdn.elifesciences.org/articles/78874/elife-78874-fig8-data1-v1.zip
-
Figure 8—source data 2
GFP-∆(1-240) JPh1 blot for Figure 8E.
- https://cdn.elifesciences.org/articles/78874/elife-78874-fig8-data2-v1.zip
-
Figure 8—source data 3
Originating gel for blots in Figure 8.
GSK3B blot is derived from the left part and JPh from right part of the membrane.
- https://cdn.elifesciences.org/articles/78874/elife-78874-fig8-data3-v1.zip
Figure 8—figure supplement 1
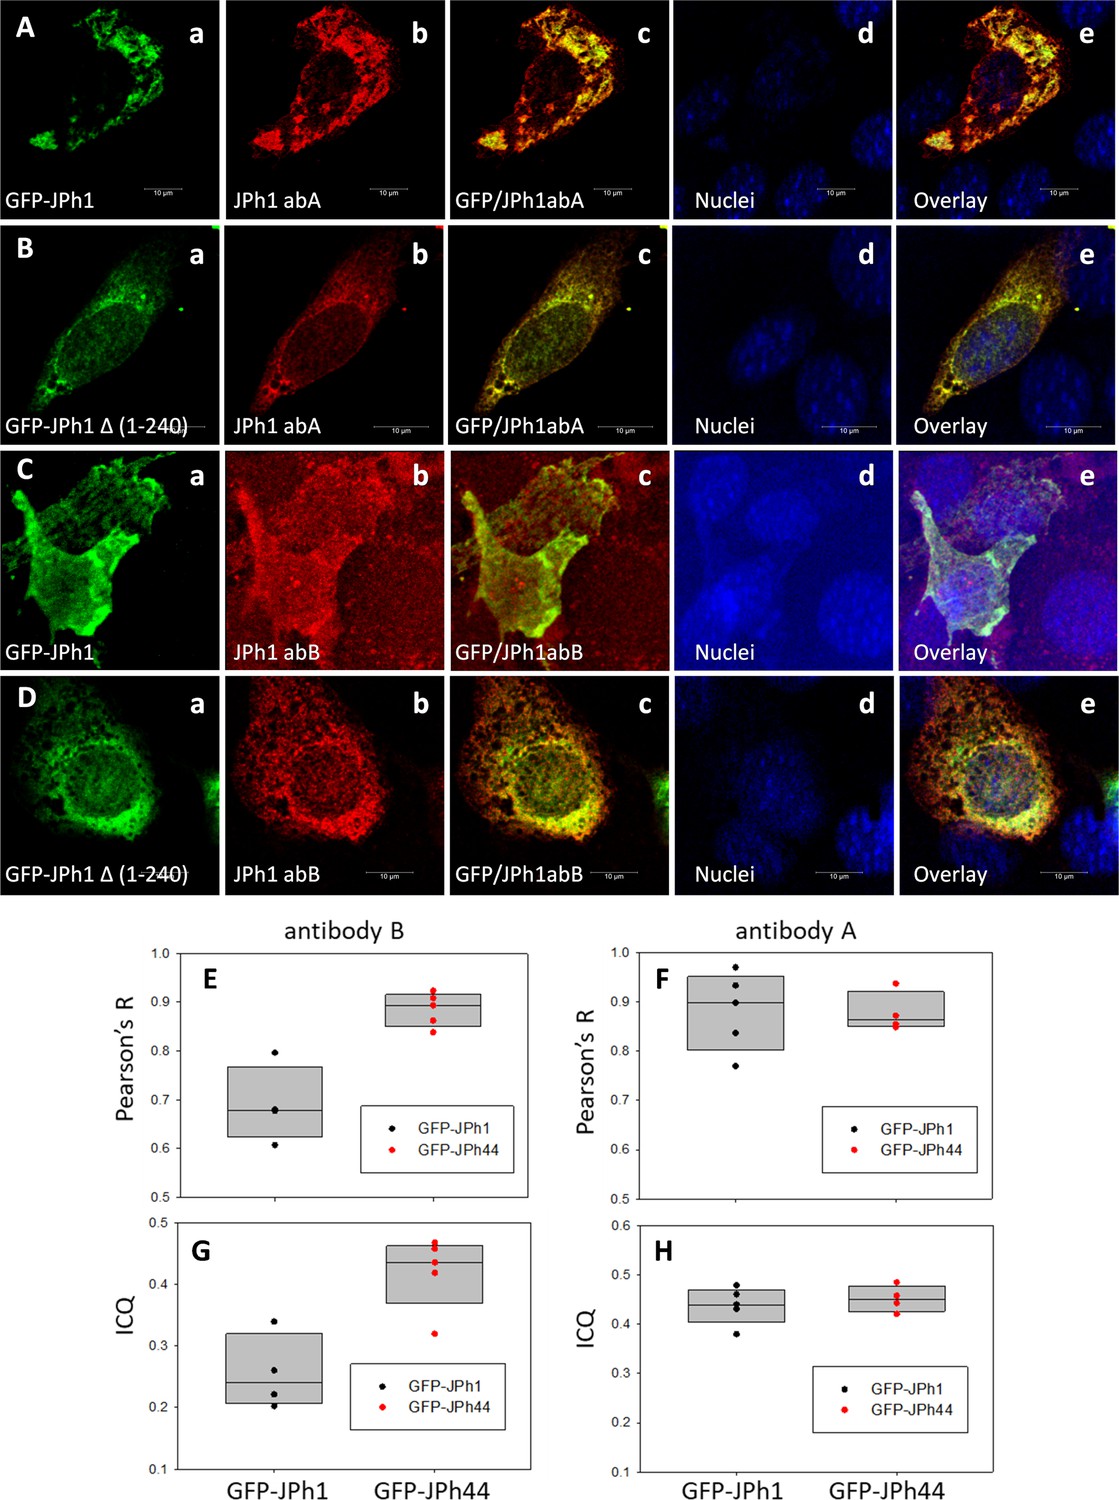
Expression of tagged JPh1 and a JPh44 stand-in.
(A-D) Immunofluorescence images of fields of C2C12 cultures expressing either GFP-JPh1 (full-size, rows A, C) or GFP-JPh1 Δ (1-240) (B, D) and stained with ab A (rows A, B) or ab B (C, D). Images show respectively GFP fluorescence, the signal with abs A or B, the overlay of GFP and ab signal, nuclear staining and the triple overlay. Images are single slices from ‘z-stacks’ of 45 x-y images at 60 nm interval, after correction for optical dispersion. Note the lesser colocalization of ab B with GFP in GFP-JPh1-transfected cells (Cc and e). E-H. Colocalization analysis of IF images in A-D. Two measures of colocalization, the correlation coefficient R and the Intensity Correlation Quotient were calculated (Methods). The plots compare their distributions between cultures expressing the two fusion proteins (n=4 or 5 fields). For brevity, the GFP- JPh1 Δ (1-240) data is labeled ‘GFP-JPh44’. Ab B (E, G) colocalized with GFP-JPh1 much more than with GFP-JPh44 (p=0.001 for R, 0.005 for ICQ). Ab A (F, H) did not show preference for either construct (p=0.941 for R and 0.564 for ICQ. two-tailed t-tests in all cases). Note also that the colocalization values of ab B with the JPh44 construct are similar to those of ab A with either construct. Data trace: A, 100522Lc_Series005_Lng_adaptSnap1. B, 100722La_Series004_Lng_adaptSnap1. C, 100522Lb_ series001_Lng_adapt#22. D, 100522La_Series004_Lng_adaptSnap6. Graphs in JPh/C2C12 JPh1 and 44 by abs B and A.
Figure 9
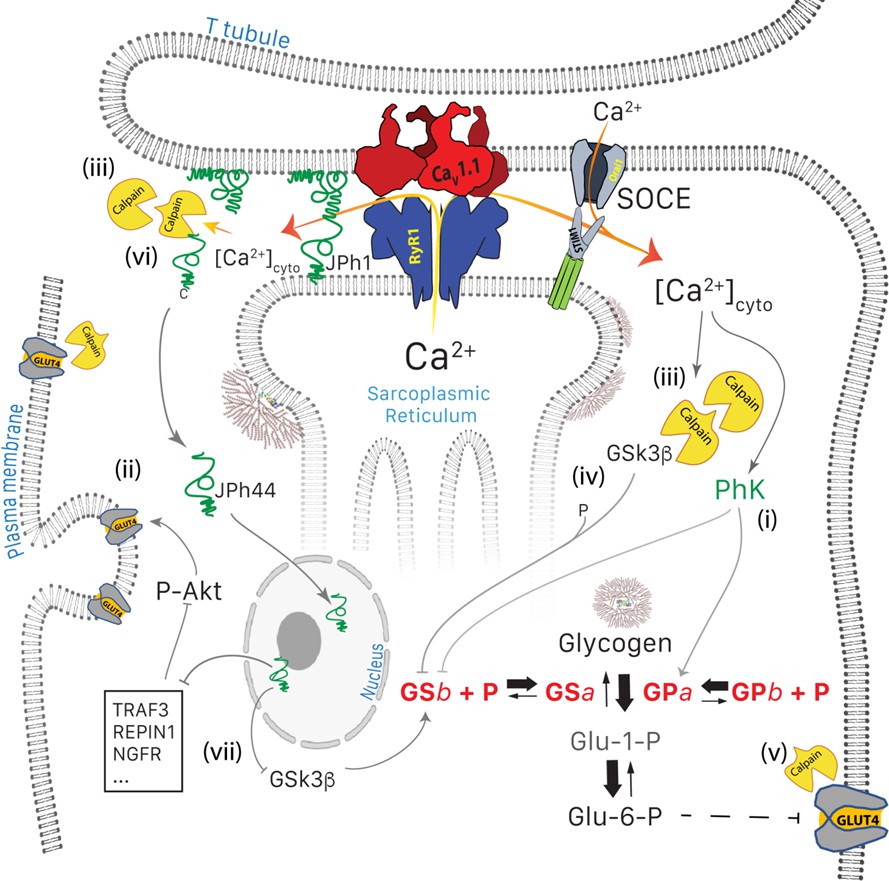
Glucose pathways of muscle and their alterations under calcium stress.
Glycogen, resident in the intermyofibrillar space in the form of granules or SR-bound, is synthesized from transported glucose or broken down to glucose-1-phosphate (Glc-1-P). Sustained elevation of [Ca2+]cyto induces multiple changes: (i) PhK is activated, which increases phosphorylation of GP and GS, to respectively enhance the breakdown and decrease the synthesis of glycogen. (ii) Expression and membrane insertion of the glucose transporter GLUT4 decrease (Place et al., 2015). (i) and (ii) contribute to reducing glucose utilization. To these effects, established by Tammineni et al., 2020, the present study adds five mechanisms: (iii), activation of calpain1, associated with autolysis; (iv) cleavage of GSK3β, which activates the kinase to phosphorylate and thereby inhibit GS; (v) lysis of GLUT4, which together with (iv) depress glucose utilization further, and (vi), cleavage of JPh1 to JPh44, which enters nuclei to modulate expression of multiple genes (vii). Mechanisms (i) to (v) contribute to the disease phenotype. While cleavage of JPh (vi) should be deleterious to structural stability, the downstream effects of JPh44 are predictive of beneficial consequences, adaptive to the condition of stress.
Author response image 1
ab B reacts with the large protein in mice but not human extracts (see Figure 1—figure supplement 1 in revised version).
Note also that the large, presumably full-size JPh1 from mice migrates at higher molecular weight markings than the human protein.
Author response image 2
Top: human muscle stained with ab B and Hoechst nuclear marker.
Bottom: mouse muscle transfected with the deletion JPh construct. The GFP signal is imaged as saturation levels, to capture the distribution in the cytosol. Data trace: top; 122619L_Series025, patient #169 (HH); bottom; 110920La_Series008. Images from z-stacks corrected for optical dispersion.
Tables
Table 1
Colocalization of JPh1 (as reported by the ab A signal) and its fragment (ab B) with RyR1 in muscle or muscle-derived myotubes.
Col. 1: Pearson’s pixel-by-pixel correlation coefficient. 2: Van Steensel’s shift in the x direction (parallel to fiber axis, arbitrary direction for myotubes). 3: Van Steensel’s FWHM of Gaussian fit. 4: Li’s Intensity Correlation Quotient. Definitions in Materials and methods. p, probability of no difference between values for JPh44 and JPh1. There was no statistically significant difference between colocalization measures of the same protein in myotubes vs myofibers (p’s not shown). Data trace: raw data and statistics. In JPh/manuscript /ColocalizJP44andRyR.JNB.
| 1 | 2 | 3 | |||||
|---|---|---|---|---|---|---|---|
| N subjects | N, fibers or myotubes | R | ICQ | VS shift, nm | FWHM, µm | ||
| JPh44 in myofibers | average | 3 | 10 | 0.31 | 0.22 | 66 | 0.56 |
| median | 0.26 | 0.23 | 54 | 0.50 | |||
| S.E.M. | 0.04 | 0.02 | 15 | 0.19 | |||
| JPh1 in myofibers | average | 3 | 8 | 0.88 | 0.4 | 16 | 0.42 |
| median | 0.9 | 0.42 | 12 | 0.40 | |||
| S.E.M. | 0.03 | 0.02 | 3 | 0.07 | |||
| p | <0.001 | <0.001 | <0.001 | 0.06 | |||
| JPh44 in myotubes | average | 2 | 9 | 0.37 | 0.22 | 168 | 1.74 |
| median | 0.36 | 0.22 | 164 | 1.69 | |||
| S.E.M. | 0.05 | 0.03 | 36 | 0.17 | |||
| JPh1 in myotubes | average | 3 | 29 | 0.73 | 0.32 | 38 | 0.55 |
| median | 0.77 | 0.32 | 38 | 0.50 | |||
| S.E.M. | 0.02 | 0.01 | 4 | 0.03 | |||
| p | <0.001 | 0.003 | <0.001 | <0.001 | |||
Table 2
Fate of doubly tagged protein GFP (N) – JPh1 – FLAG (C).
Distribution of GFP (N terminal) and FLAG (C-terminal) in different preparations, quantified by the ratio of densities in extranuclear (‘cytosol’) and nuclear areas. N, numbers of culture experiments, patients or mice. n, numbers of images. nn, numbers of nuclei included in calculations. p, probability of no difference between GFP and FLAG distributions in two-tailed t tests. To correct for data clustering (or pseudoreplication), average and dispersion parameters in mouse myofibers were derived by hierarchical analysis. Data trace: Raw data listed in depository under the following identifiers: C2C12: 091620 a. Series 2, 5, 7. Patient-derived myotubes: 091020 a. Series 1–4. Mice: 092420 a, 100520 a, 100520b. All series. Murine in summary flag-gfp.JNB. Patient in ColocalizJP44and RyR.JNB in JPh/Manuscript Data2.
| Cytosolic/ nuclear density | GFP | FLAG | ||||
|---|---|---|---|---|---|---|
| C2C12 | Patient-derived myotubes | Murine myofibers | C2C12myotubes | Patient-derived myotubes | Murine myofibers | |
| avg | 2.32 | 3.13 | 139 | 0.84 | 1.44 | 0.15 |
| median | 2.47 | 2.62 | 45.5 | 0.87 | 1.4 | 0.09 |
| sem | 0.47 | 0.59 | 38.5 | 0.12 | 0.26 | 0.03 |
| N, n, nn | 1, 3, 6 | 1, 4, 38 | 3, 16, 20 | 1, 3, 6 | 1, 4, 38 | 3, 16, 20 |
| P | 0.039 | 0.028 | <0.001 | |||
Table 3
Colocalization measures of junctophilin vs calpain in patients’ myofibers.
p: probabilities in two-tailed t test or * non-parametric difference of medians. Data trace: images of experiments 051220, 113020, 081020 a (JPh1) & 081120b & 120121 (JPh44). Data trace: Section 3 in colocalizationJPhandRyR.JNB.
| R | VS shift, nm | FWHM,µm | ICQ | N, subjects n, stacks | |||
|---|---|---|---|---|---|---|---|
| longitudinal | transversal | ||||||
| JPh1 vs calpain | mean | 0.718 | 31.67 | 44.67 | 0.63 | 0.297 | 3 9 |
| median | 0.701 | 28.00 | 39.00 | 0.62 | 0.29 | ||
| sem | 0.036 | 6.41 | 6.18 | 0.02 | 0.012 | ||
| JPh44 vs calpain | mean | 0.387 | 66.14 | 103.86 | 1.89 | 0.191 | 2 7 |
| median | 0.42 | 60.00 | 89.00 | 1.30 | 0.2 | ||
| sem | 0.045 | 18.19 | 23.24 | 0.77 | 0.028 | ||
| p | *<0.001 | *0.151 | *0.08 | 0.02 | 0.007 | ||
Table 4
Effect of FLAG-calpain expression on location of JPh1 antibody A (which detects full-size and 44 kDa fragment) in patient-derived myotubes.
Location evaluated as ratio of nuclear/cytosolic density of antibody signal. Data trace: Section 5 in colocalizationJPhandRyR.JNB.
| With FLAG-calpain | Reference | |
|---|---|---|
| Average | 3.7411 | 1.1816 |
| Median | 3.4118 | 1.1839 |
| SEM | 0.3292 | 0.0923 |
| p | <0.001 | |
| Subjects, z-stacks | 3, 19 | 4, 18 |
Table 5
Effect of heterologous calpain on colocalization of JPh (detected with antibody A) and RyR1 in human-derived myotubes.
p calculated by Mann-Whitney Rank Sum Test. Data trace: Experiments 073020 a (calpain) & b (reference). 010422 a (calpain). 010422 a (reference). Data in colocalizationJPhRyR.JNB, Section #11.
| N, subjects | n, cells | R | VS shift, nm | FWHM, µm | ICQ | ||
|---|---|---|---|---|---|---|---|
| Expressing FLAG-Cp1 | 2 | 13 | avg | 0.44 | 278 | 3.49 | 0.22 |
| median | 0.42 | 130 | 2.24 | 0.23 | |||
| sem | 0.05 | 127 | 0.96 | 0.03 | |||
| Reference | 2 | 16 | avg | 0.72 | 44 | 0.58 | 0.30 |
| median | 0.73 | 48 | 0.52 | 0.30 | |||
| sem | 0.03 | 5 | 0.04 | 0.01 | |||
| p* | <0.001 | 0.008 | <0.001 | 0.023 | |||
Table 6
Colocalization of JPh and calpain (Cp1) with RyR1 in human-derived myotubes expressing FLAG calpain.
Patient #180 MHN. 073020 a. * p calculated by Mann-Whitney Rank Sum Test. Data trace: in ColocalizJP44 and RyR.JNB section 9. 073020b. 010422 a.
| Colocalizationwith RyR1 | N, subjects | n, cells | R | VS shift, nm | FWHM,µm | ICQ | |
|---|---|---|---|---|---|---|---|
| JPh | avg | 2 | 10 | 0.72 | 44 | 0.58 | 0.30 |
| median | 0.73 | 48 | 0.52 | 0.30 | |||
| sem | 0.03 | 5 | 0.04 | 0.03 | |||
| Cp1 | avg | 2 | 14 | 0.76 | 126 | 1.13 | 0.34 |
| median | 0.76 | 120 | 0.95 | 0.36 | |||
| sem | 0.03 | 25 | 0.15 | 0.03 | |||
| p* | 0.336 | 0.01 | <0.001 | 0.206 | |||
Table 7
Colocalization of exogenous GFP-Δ(1-240) JPh1 with RyR1 in muscle of adult mice.
For ease of comparison, the table includes values of JPh1 and JPh44 in human muscle, from Table 1. Bottom row: p of no difference between values for fragments vs. JPh1 (Mann Whitney Rank Sum for all but ICQ). Data trace: in ColocalizJP44andRyR.JNB.
| N subjects | n fibers | R | VS shift, nm | FWHM, | ||
|---|---|---|---|---|---|---|
| JPh1 | average | 3 | 8 | 0.88 | 16 | 0.42 |
| median | 0.9 | 12 | 0.40 | |||
| S.E.M. | 0.03 | 3 | 0.07 | |||
| JPh44 | average | 3 | 10 | 0.31 | 66 | 0.56 |
| median | 0.26 | 54 | 0.50 | |||
| S.E.M. | 0.04 | 15 | 0.19 | |||
| p | <0.001 | <0.001 | 0.06 | |||
| GFP- D(1-240) JPh1 | average | 1 | 6 | 0.54 | 50 | 0.89 |
| median | 0.53 | 36 | 0.80 | |||
| S.E.M. | 0.09 | 23 | 0.09 | |||
| p | 0.001 | 0.057 | <0.001 | |||
Table 8
Effect of expression of GFP-Δ(1-240) JPh1 (Δ construct) on density of GSK3β in C2C12 myoblasts.
The reference, in Cols 4–6, is a culture transfected with the empty vector (GFP-EV). The numbers are averages of densities and their ratios calculated individually for 10 and 8 images, respectively for Δ construct and empty vector. The number of expressing cells per image varied between 1 and 3; that of non-expressing cells between 6 and 10. p is the probability of a ratio of 1, that is, no effect of the expression, based on a two-tailed t-test on the sample of 10 or 8 ratios. An alternative t-test (of paired differences in density between non-expressing and expressing areas) yielded a p of no difference = 0.002 and 0.930 respectively for the Δ construct and the empty vector. Data trace: in GSK3B graphs and statistics.JNB.
| 1 | 2 | 3 | 4 | 5 | 6 | |
|---|---|---|---|---|---|---|
| GSK3β density, a. u. | Cells expressing Δ construct | Cells not expressing Δ construct | Ratio col1/col2 | Cells expressing GFP-EV | Cells not expressing GFP-EV | Ratio col4/col5 |
| avg | 441 | 729 | 0.62 | 1548 | 1553 | 1.00 |
| median | 353 | 547 | 0.61 | 1513 | 1355 | 1.03 |
| sem | 75.1 | 138 | 0.03 | 268 | 281 | 0.05 |
| N, images | 10 | 10 | 10 | 8 | 8 | 8 |
| n, cells | 15 | 73 | 11 | 42 | ||
| p | <0.001 | 0.958 | ||||
Key resources table
| Reagent type (species) or resource | Designation | Source or reference | Identifiers | Additional information |
|---|---|---|---|---|
| Antibody | Anti-JPh1‘antibodyA’ (Rabbit Polyclonal) | Thermo Fisher scientific | Catalog # PA5-52639 | Dilution: IF: (1:200), WB: (1:1000) |
| Antibody | Anti- JPh1‘antibody’ (Rabbit Polyclonal) | Thermo Fisher scientific | Catalog #40–5100, | Dilution: IF: (1:200), WB: (1:1000) |
| Antibody | Anti- GSK3β (Rabbit Monoclonal) | Cell Signaling Technology | Catalog #9315 | Dilution: WB: 1:1000 |
| Antibody | Anti- calpain1 (Mouse Monoclonal) | Thermo Fisher Scientific | Catalog # MA1-12434 | Dilution: IF: (1:100), WB: (1:1000) |
| Antibody | Anti-Ryr1 (Mouse polyclonal) | Invitrogen | Catalog #MA3-925 | Dilution: IF: 1:200 |
| Antibody | Anti-FLAG (Mouse Monoclonal) | Thermo Fisher Scientific | Catalog #MA1-91878 | Dilution: IF: 1:200 |
| Recombinant DNA reagent | GFP-JPh1-FLAG Plasmid | OriGene Technologies | ||
| Recombinant DNA reagent | GFP-∆(1-240) JPh1 Plasmid | OriGene | ||
| Recombinant DNA reagent | p3XFlag-CAPN1 plasmid | Addgene | Catalog # #60941 | |
| Biological sample (Homo-sapiens) | Gracilis muscle | Toronto General Hospital | ||
| Sequence-based reagent | Primers (5’ to 3’) Fw: ATGGACTGA TTATGGACAGGACTG Rev: TCCAGCAGGT CAGCAAAGAAC | IDT | Hprt | |
| Sequence-based reagent | Primers (5’ to 3’) Fw: GAGCCACTGA TTACACGTCCAG Rev: CCAACTGATC CACACCACTGTC | IDT | Gsk3b | |
| Sequence-based reagent | Primers (5’ to 3’) Fw: CCCATGATCA AACTGCAGAAAC Rev: GCACTCAAC TCACTCCTTAGAA | IDT | Traf3 | |
| Sequence-based reagent | Primers (5’ to 3’) Fw: GTCTTCAGG CAGAGGAAGAAC Rev: GATTTGCCCT GGTACCTCAA | IDT | Repin1 | |
| Sequence-based reagent | Primers (5’ to 3’) Fw: CTGACAACCT CATTCCTGTCTATT Rev: CTTGCAGCT GTTCCATCTC | IDT | Ngfr | |
| Cell lines | C2C12 Myoblasts | ATCC | CRL-1722 | |
| Protein | Calpain 1 protein from human Erythrocytes | Millipore Sigma | Catalog # 208713 | |
| Drug | Calpain Inhibitor MDL-28170 | Cayman | Item No #14283 |
Additional files
-
Supplementary file 1
Demographic information for all patients whose samples were analyzed for this study.
- https://cdn.elifesciences.org/articles/78874/elife-78874-supp1-v1.docx
-
Transparent reporting form
- https://cdn.elifesciences.org/articles/78874/elife-78874-transrepform1-v1.pdf
-
Source code 1
A program implementing quantitative evaluation of double bands in Western blots.
- https://cdn.elifesciences.org/articles/78874/elife-78874-code1-v1.zip
Download links
A two-part list of links to download the article, or parts of the article, in various formats.
Downloads (link to download the article as PDF)
Open citations (links to open the citations from this article in various online reference manager services)
Cite this article (links to download the citations from this article in formats compatible with various reference manager tools)
Muscle calcium stress cleaves junctophilin1, unleashing a gene regulatory program predicted to correct glucose dysregulation
eLife 12:e78874.
https://doi.org/10.7554/eLife.78874


