Recruitment of clathrin to intracellular membranes is sufficient for vesicle formation
- Centre for Mechanochemical Cell Biology and Division of Biomedical Cell Biology, Warwick Medical School, University of Warwick, United Kingdom
Figures
Figure 1 with 2 supplements
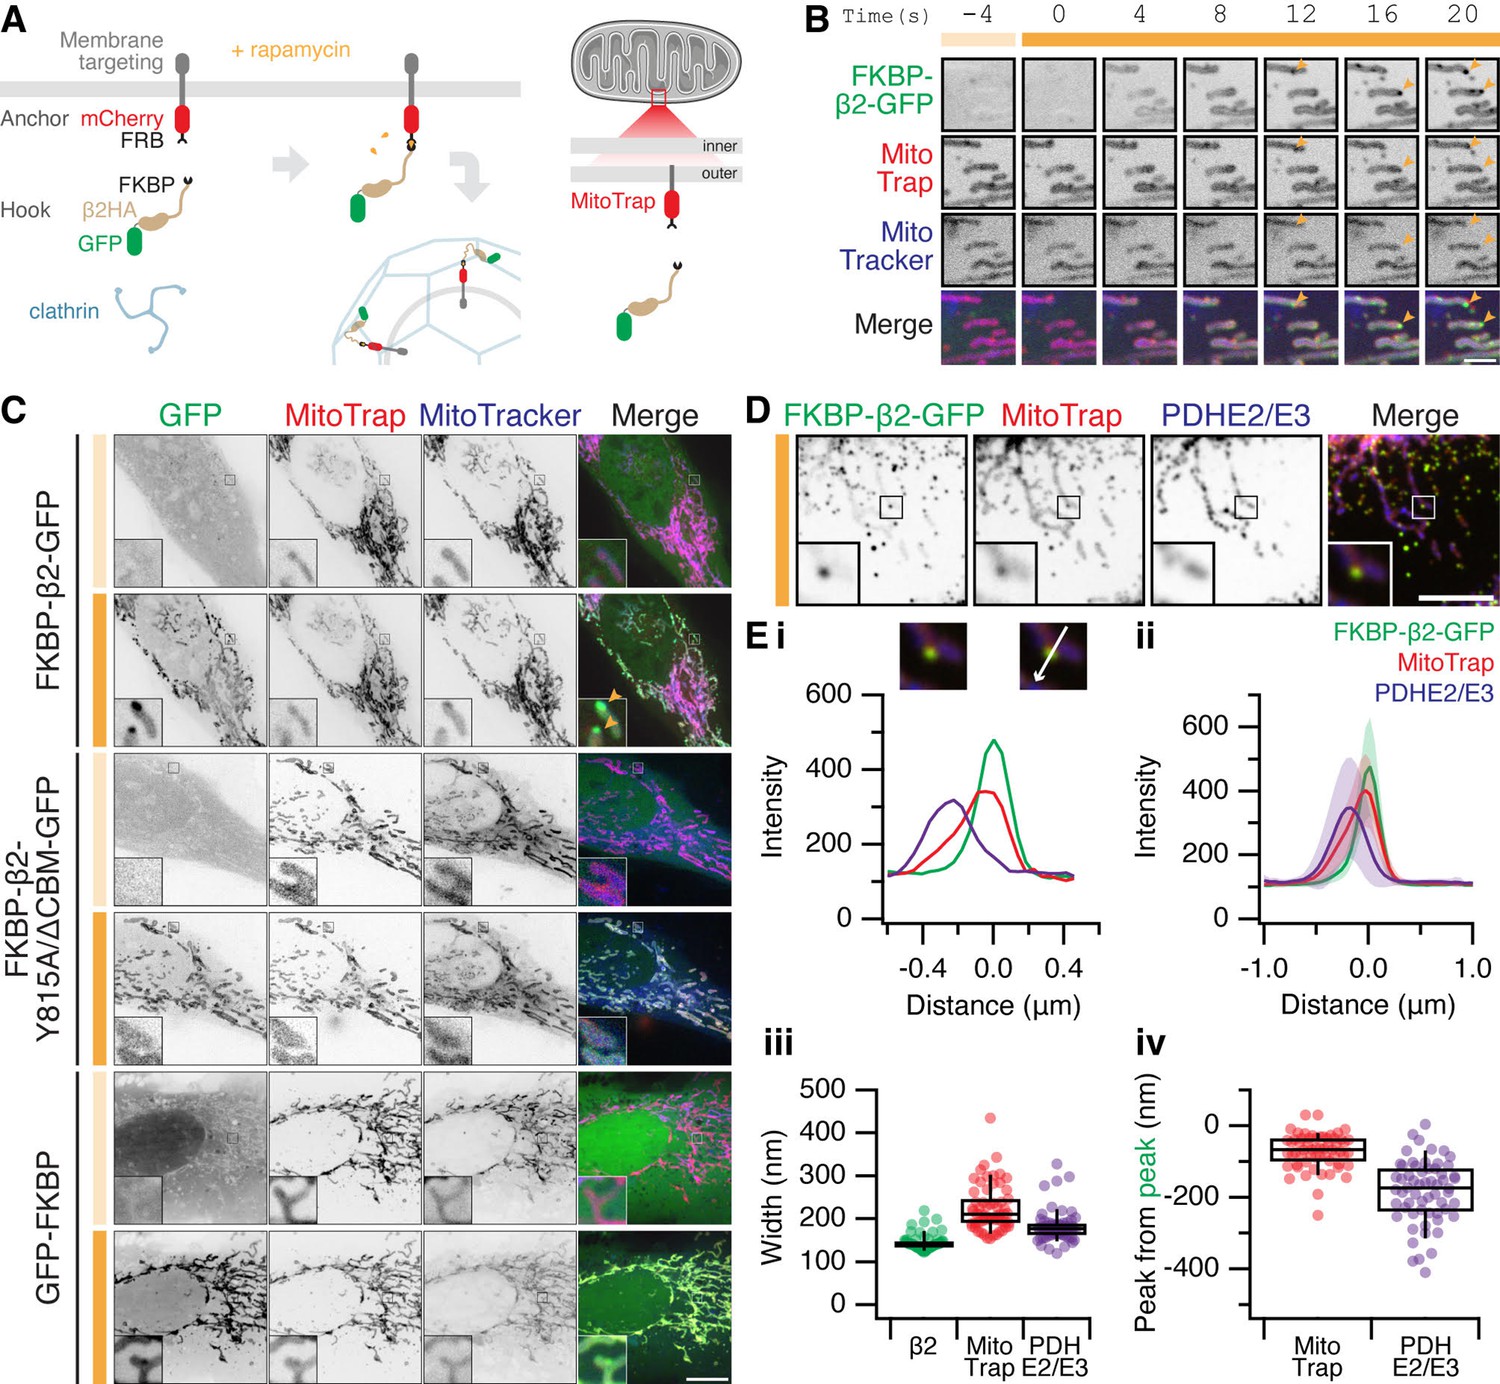
The formation of MitoPits.
(A) Schematic representation of clathrin-coated pit induction. The system, triggered by rapamycin, consists of a membrane anchor (mCherry-FRB fused to a membrane targeting domain) and a clathrin hook (clathrin-binding protein fused to FKBP and GFP). Targeting the anchor to mitochondria using Tom70p in MitoTrap. (B) Stills from live cell imaging of a HeLa cell expressing FKBP-β2-GFP (green), and the anchor, MitoTrap (red), treated with 200 nM rapamycin as indicated (orange bar). Scale bar, 2 µm. See Figure 1—video 1. (C) Representative confocal micrographs of HeLa cells before (light orange bar) and 2 min after 200 nM rapamycin treatment (dark orange bar). Cells expressing MitoTrap (red) with either our standard clathrin hook (FKBP-β2-GFP), clathrin-binding deficient mutant (FKBP-β2-Y815A/∆CBM-GFP), or GFP-FKBP. In B and C, mitochondria were also labeled with MitoTracker Deep Red (blue) and orange arrowheads indicate MitoPits, where present. Inset, ×5 zoom. Scale bar, 10 µm. (D) Typical confocal micrograph of cells expressing FKBP-β2-GFP (green) and MitoTrap (red), treated with rapamycin (200 nM), fixed and stained with anti-PDHE2/E3 (blue). Inset, ×3 zoom. Scale bar, 5 µm. (E) Analysis of the spatial organization of MitoPits. (i) Line profile through the MitoPit shown in D, aligned to the FKBP-β2-GFP peak at 0 µm. Each of three channels is shown. (ii) Spatially averaged line profiles, aligned to the FKBP-β2-GFP peak at 0 µm, mean ± standard deviation (SD) is shown. (iii) Width of profiles for each channel in the dataset. (iv) Relative distance from the peak of FKBP-β2-GFP to the peak of MitoTrap (red) or PDHE2/3 (blue) for each profile in the dataset. Box plots indicate median, IQR, 9th and 91st percentiles. Each dot represents a profile.
Figure 1—figure supplement 1
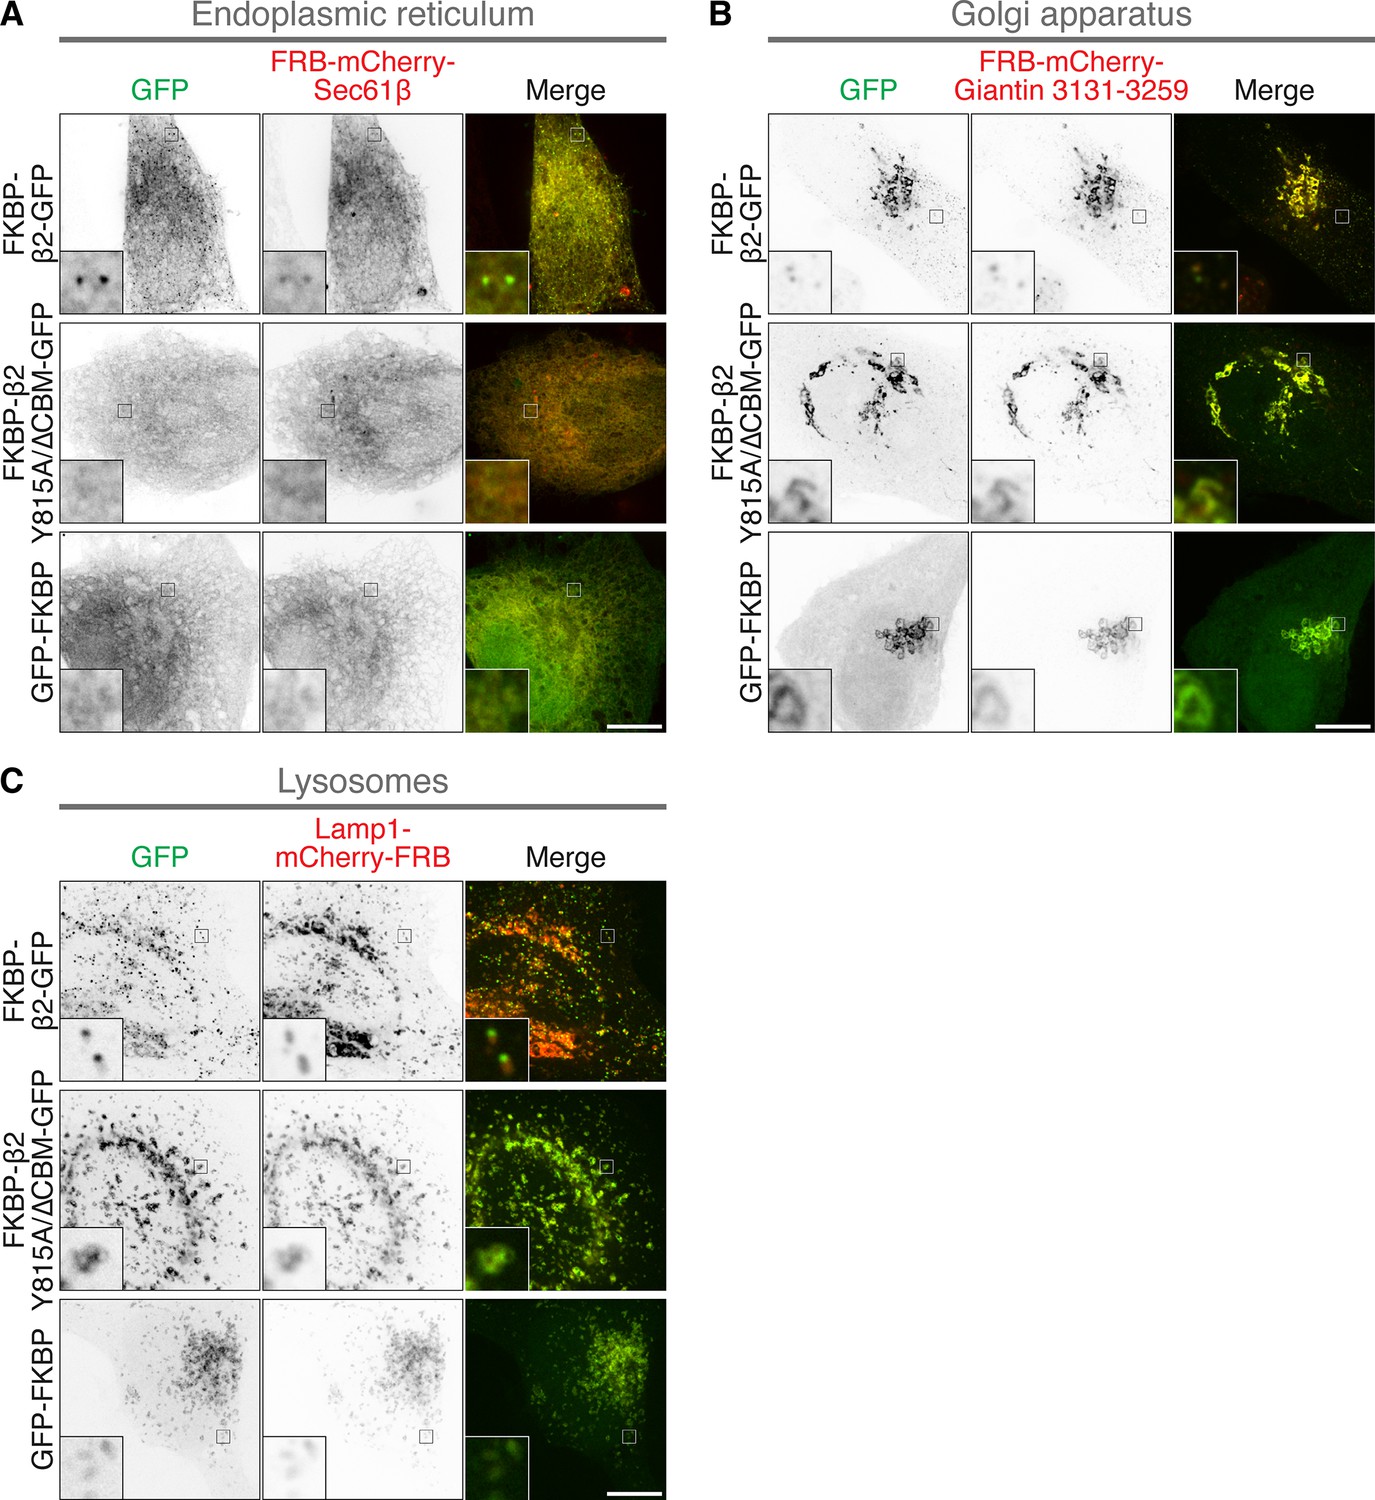
Clathrin-coated pit formation on the ER, Golgi apparatus, and lysosomes.
Representative confocal micrographs of HeLa cells coexpressing the indicated anchor protein together with FKBP-β2-GFP, FKBP-β2(Y815A/∆CBM)-GFP, or GFP-FKBP and treated with 200 nM rapamycin. The following anchors were used: (A) FRB-mCherry-Sec61β (ER), (B) FRB-mCherry-Giantin(3131–3259) (Golgi), and (C) Lamp1-mCherry-FRB (lysosomes), Insets, ×5 zoom. Scale bar, 10 µm.
Figure 1—video 1
The formation of MitoPits.
Live cell imaging (zoomed view) of a HeLa cell expressing FKBP-β2-GFP (green) and MitoTrap (red). Rapamycin (200 nM) is added after 8 s. Note the formation of MitoPits (green spots) and the significant motion of some spots. Playback is 6 fps. Time, mm:ss. Scale bar, 1 µm.
Figure 2
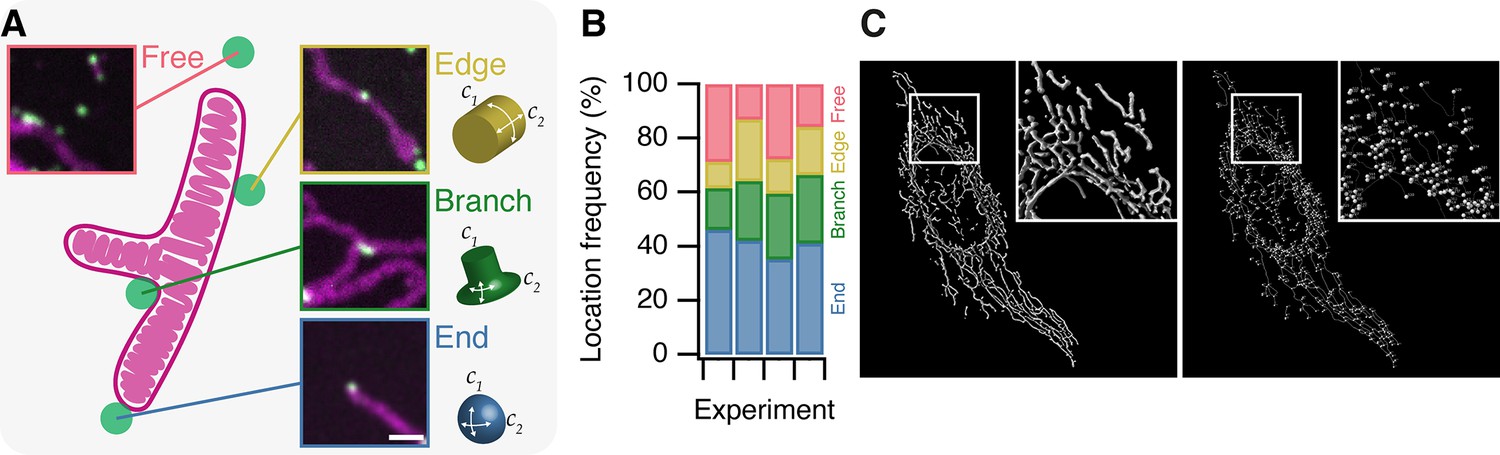
MitoPits form preferentially at mitochondria ends.
(A) Schematic representation of a single-branched mitochondrion with representative micrographs of MitoPits that have formed at the indicated location in HeLa cells expressing FKBP-β2-GFP (green) and MitoTrap (red), treated with 200 nM rapamycin. Endpoints have positive curvature in two axes (C1 and C2), edges have only positive C1 curvature, branchpoints have positive C1 and negative C2 curvature. Scale bar, 1 µm. (B) Frequency of MitoPits at each of the four locations across four independent experiments. Nspots = 293, 223, 173, 297. (C) Typical MitoGraph from a HeLa cell expressing MitoTrap. 3D segmentation of the mitochondrial network (left) and network of edges and nodes (branchpoints and endpoints, right).
Figure 3 with 1 supplement

MitoPits are clathrin-coated pits.
(A) Representative confocal micrographs of HeLa cells expressing dark MitoTrap with either clathrin hook (FKBP-β2-GFP), clathrin-binding deficient mutant hook (FKBP-β2-Y815A/∆CBM-GFP), or GFP-FKBP. Cells were treated with 200 nM rapamycin before staining for clathrin heavy chain (CHC, red). Inset, ×5 zoom. Scale bar, 10 µm. (B) SuperPlots comparing colocalization (above) and spot density (below) for the conditions shown in A. Colors indicate the two independent experimental replicates. Each dot represents a cell, black outlined dots indicate the means of replicates. Spots of GFP or CHC were detected and quantified. Colocalization is shown as the percentage of GFP spots that coincided with CHC spots (left), or the percentage of CHC spots that coincided with GFP spots (right). Note, that this colocalization measure is likely an underestimate, but sufficient for comparison between conditions (see Materials and methods). (C) Waffle plots to visualize the median number of spots per 100 µm2 that were positive for GFP only (green), clathrin only (red) or both (yellow), gray places indicate no spot. (D) SuperPlot to show the total number of FKBP-β2-GFP spots per cell after rapamycin addition in control (GL2, siCtrl) and CHC (siCHC) knockdown cells. Each dot represents a cell, black outlined dots indicate the means of replicates. p value is from Student’s t-test with Welch’s correction, n = 3.
Figure 3—figure supplement 1
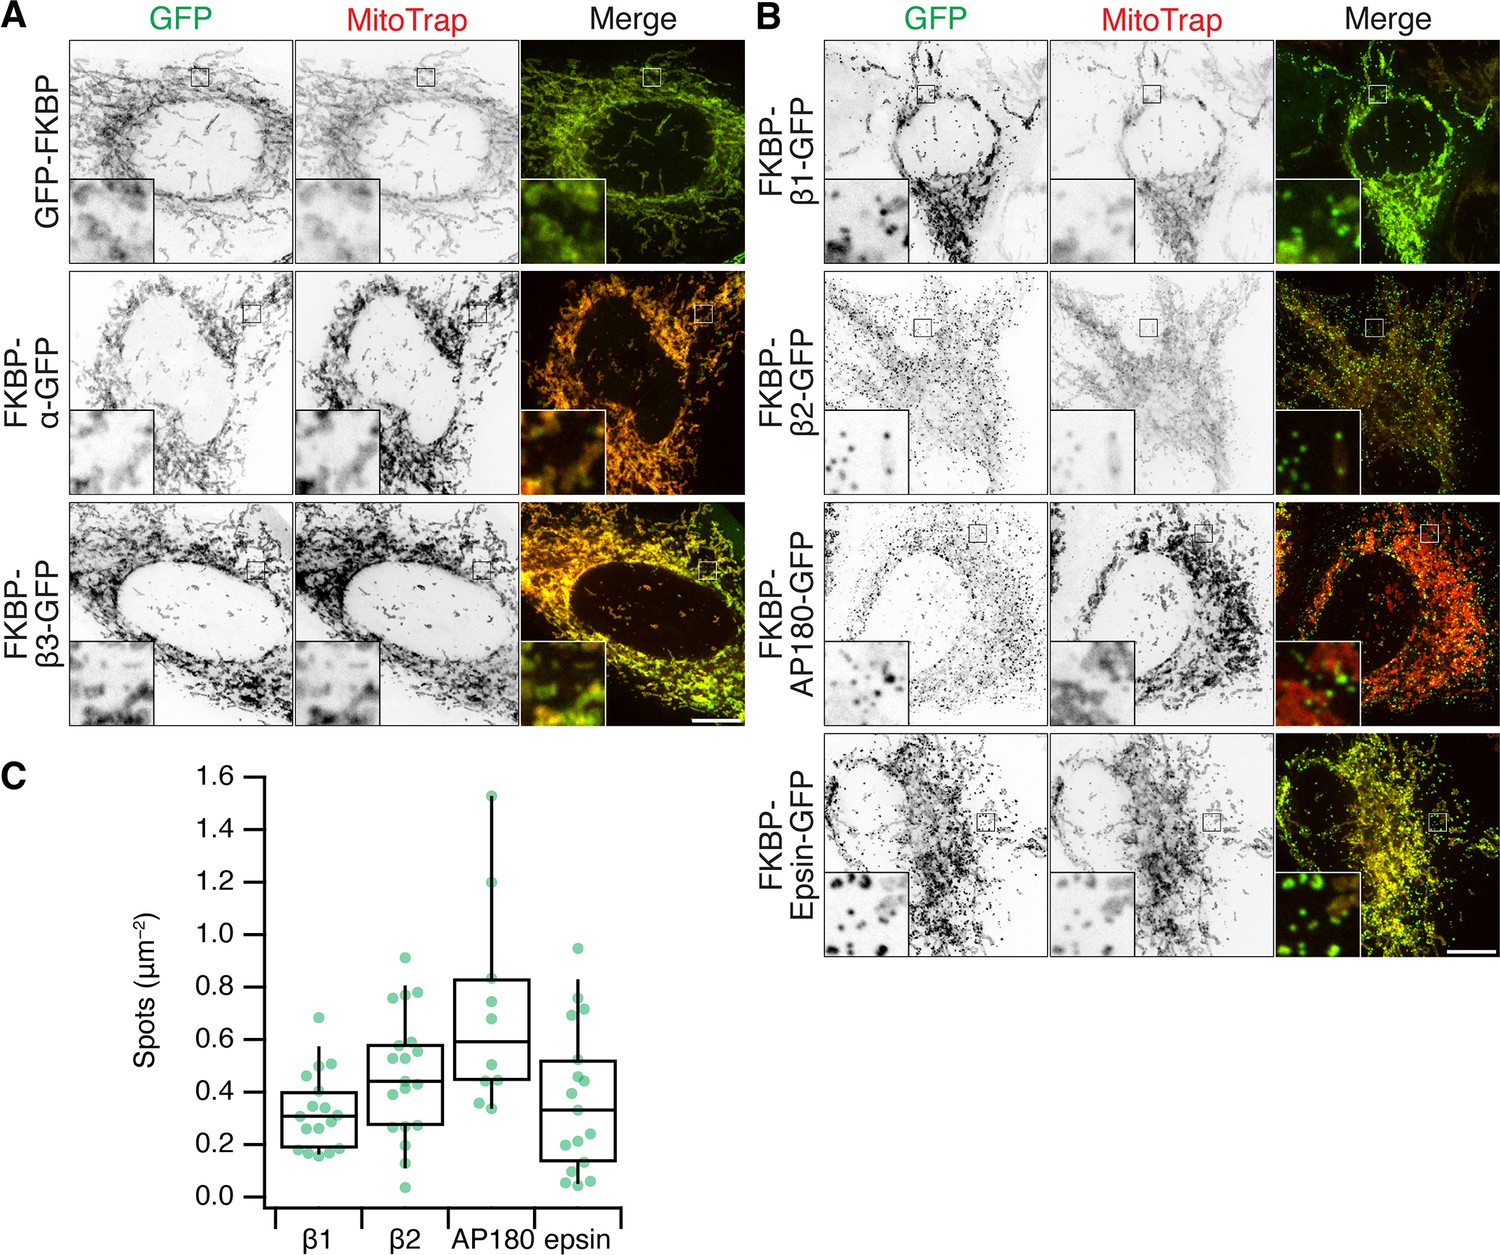
MitoPits can be formed using diverse clathrin hooks.
(A, B) Representative confocal micrographs of mitoPit formation in HeLa cells using a variety of clathrin hooks and MitoTrap. (A) No MitoPits were observed with GFP-FKBP, FKBP-α-GFP, or FKBP-β3-GFP. (B) Robust MitoPit formation was seen with FKBP-β1-GFP (human AP1B1 617–949), FKBP-β2-GFP (human AP2B1 616–951), FKBP-AP180-GFP (Rat AP180 616–951), or FKBP-epsin-GFP (Mouse epsin-1 144–575). All cells were treated with 200 nM rapamycin. Insets, ×5 zoom. Scale bars, 10 µm. (C) Box plot to quantify the density of MitoPits formed with FKBP-β1-GFP (β1), FKBP-β2-GFP (β2), FKBP-AP180-GFP (AP180), or FKBP-epsin-GFP (epsin). FKBP-AP180-GFP was the most potent at triggering MitoPit formation, significantly more so than FKBP-β1-GFP (p = 2.7 × 10⁻³), FKBP-epsin-GFP (p = 1.0 × 10⁻³) but not FKBP-β2-GFP (p = 9.2 × 10⁻²). Each dot represents a cell. Box plots indicate median, IQR, 9th and 91st percentiles.
Figure 4 with 1 supplement
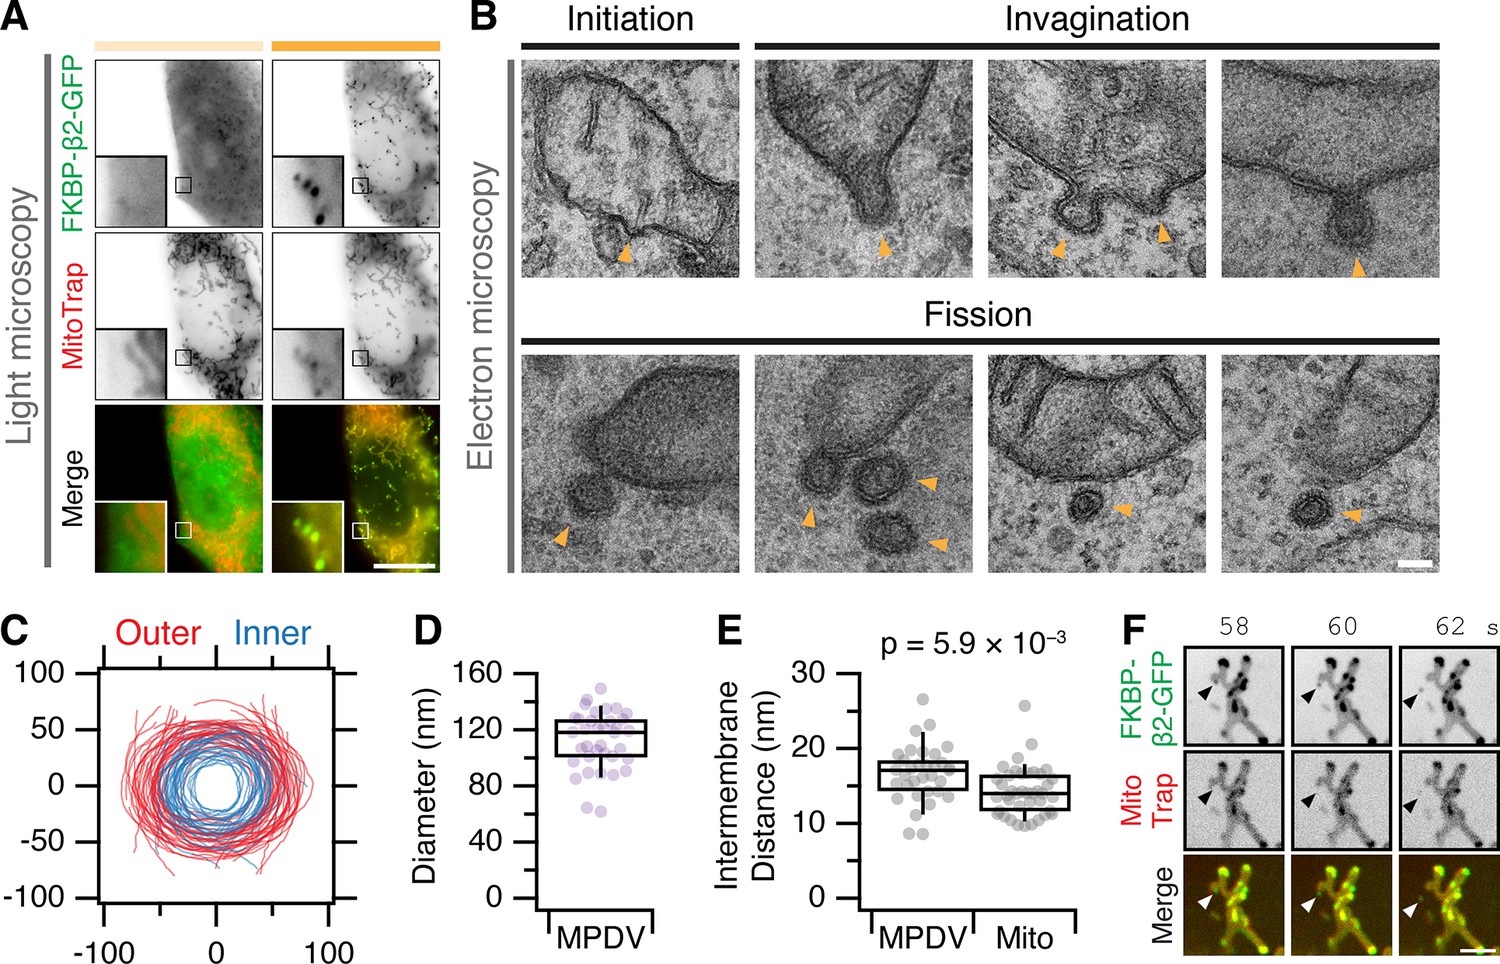
MitoPits are clathrin coated and can bud to form vesicles.
(A) Fluorescence micrographs of a HeLa cell expressing FKBP-β2-GFP (green) and MitoTrap (magenta), before (left) and after (right) treatment with 200 nM rapamycin. Insets, ×5 zoom. Scale bar, 10 µm. (B) Electron micrographs of ultrathin (80 nm) sections taken from the cell shown in A. All morphological stages of clathrin-coated pit formation were observed (indicated by arrowheads) including evidence of fission of MitoPit-derived vesicles (MPDVs). Scale bar, 100 nm. (C) Membrane profiles of 36 MPDVs rotated so that the major axis of the outer membrane is at y = 0. (D, E) Box plots to show the average outer diameter and the intermembrane distance of MPDVs. Each dot represents a MPDV, taken from three cells. Box plots indicate median, IQR, 9th and 91st percentiles. p value from Student’s t-test. (F) Stills from a live cell imaging experiment (see Figure 4—video 1). MitoPit formation was induced by 200 nM rapamycin addition after 8 s. Arrowheads show the formation of a MitoPit that buds to form a distinct vesicle. Scale bar, 1 µm.
Figure 4—video 1
Budding of MitoPit-derived vesicles.
Live cell imaging (zoomed view) of a HeLa cell expressing FKBP-β2-GFP (green) and MitoTrap (red). Rapamycin (200 nM) is added after 8 s. Playback is 10 fps. Time, mm:ss. Scale bar, 1 µm.
Figure 5 with 2 supplements
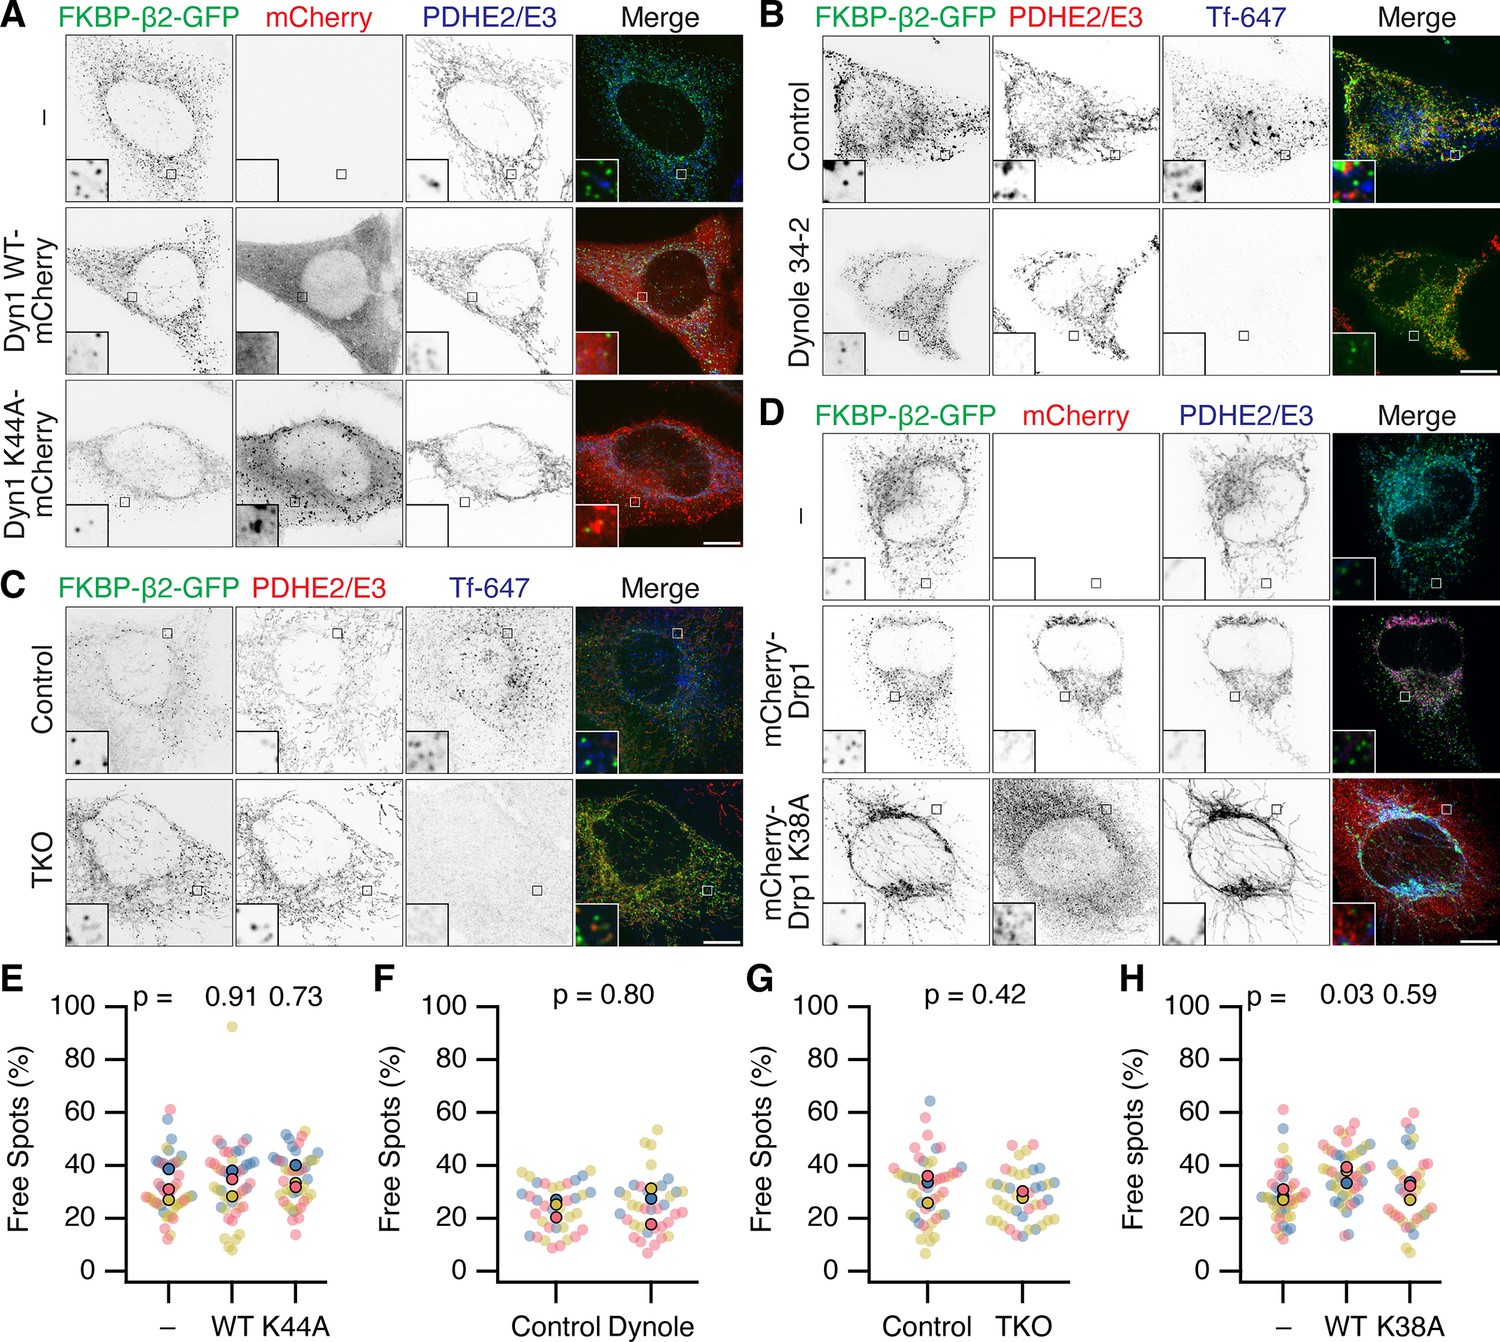
Neither Dynamin nor Drp1 activity is required for scission of MitoPit-derived vesicles.
(A–D) Representative confocal micrographs of MitoPit-derived vesicle formation under different approaches to inhibit dynamin or Drp1 function. (A) Dominant-negative dynamin-1: HeLa cells expressing dark MitoTrap and FKBP-β2-GFP (green) alone (–) or in combination with either Dyn1 WT-mCherry WT or Dyn1 K44A-mCherry (red), treated with rapamycin (200 nM, 30 min), stained with anti-PDHE2/E3 (blue). (B) Chemical inhibition: HeLa cells expressing dark MitoTrap and FKBP-β2-GFP (green), treated with control compound (Dynole 31–2, 30 µM) or Dynole 34–2 (30 µM) for 25 min and rapamycin (200 nM) for the final 10 min. Fluorescent human transferrin (Tfn 647, blue) indicates endocytic activity, mitochondrial matrix was stained with anti-PDHE2/E3 (red). (C) Dynamin triple knockout: inducible dynamin TKO mouse embryonic fibroblasts expressing dark MitoTrap and FKBP-β2-GFP (green), treated with vehicle (Control) or 3 µM Tamoxifen (TKO) for 2 days prior to transfection and with rapamycin (200 nM, 10 min) for clathrin-coated pit (CCP) induction. Fluorescent human transferrin (Tfn 647, blue) indicates endocytic activity, mitochondrial matrix was stained with anti-PDHE2/E3 (red). (D) Dominant-negative Drp1: HeLa cells expressing dark MitoTrap and FKBP-β2-GFP (green) alone (–) or in combination with either mCherry-Drp1 WT or mCherry-Drp1 K38A (red), treated with rapamycin (200 nM, 30 min), stained with anti-PDHE2/E3 (blue). Insets, ×5 zoom. Scale bars, 10 µm. (E–H) SuperPlots showing the percentage of free spots for each condition. Colors represent replicates, dots represent cells, solid dots represent the mean of each replicate. Indicated p values from Dunnett’s post hoc test (E, H) or Student’s t-test (F, G).
Figure 5—figure supplement 1
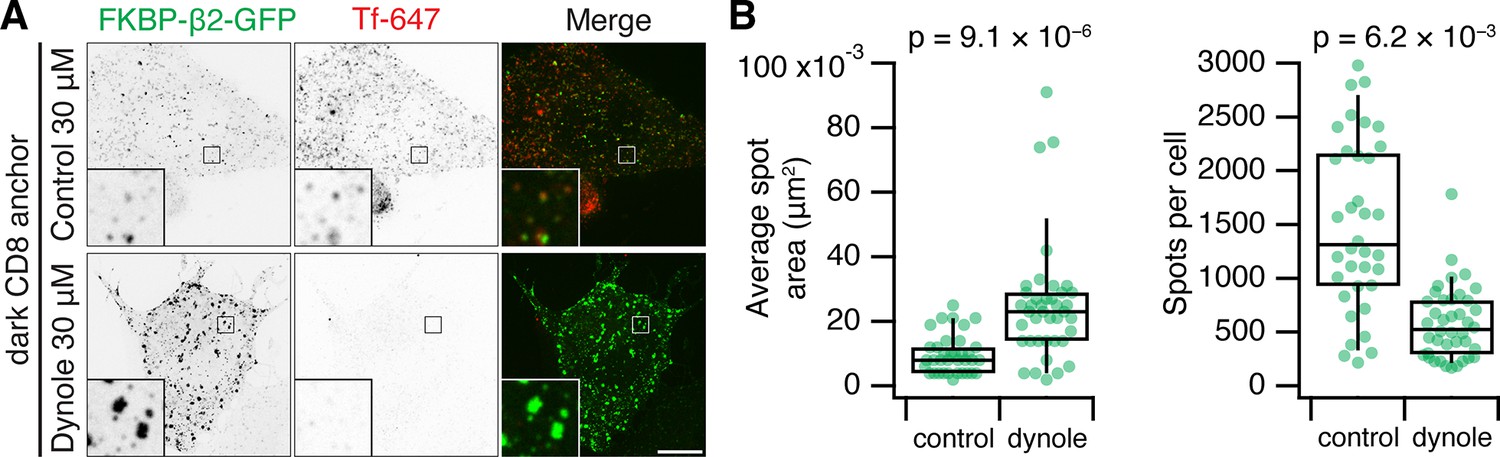
Hot-wired endocytosis requires dynamin activity.
(A) Representative confocal micrographs of HeLa cells expressing dark plasma membrane anchor (CD8-dCherry-FRB) and FKBP-β2-GFP, treated with 200 nM rapamycin. Fluorescent human transferrin (Tfn 647, red) indicates consititutive endocytic activity. Insets, ×5 zoom. Scale bars, 10 µm. (B) Box plots to show the average spot area and the total number of spots per cell. Each dot represents a cell. Box plots indicate median, IQR, 9th and 91st percentiles.
Figure 5—figure supplement 2
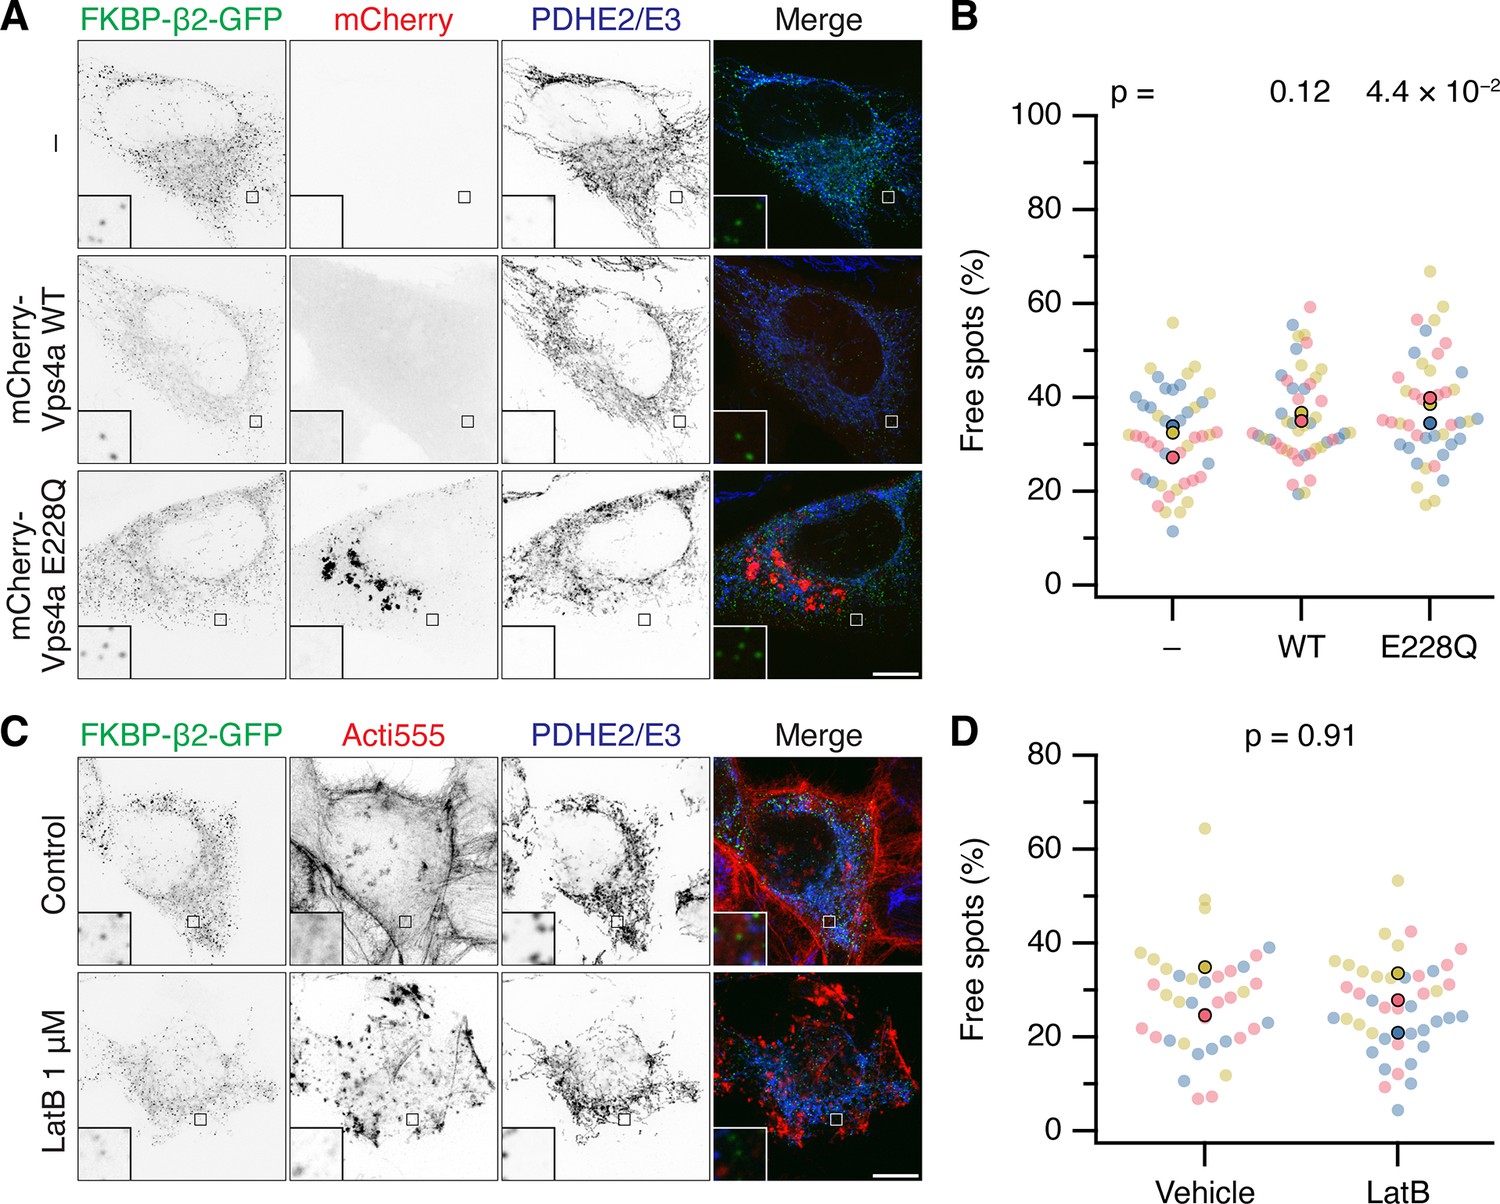
No evidence for ESCRTIII or actin involvement in fission of MitoPits.
(A) Representative confocal micrographs of MitoPit-derived vesicle formation in cells expressing dark MitoTrap and FKBP-β2-GFP (green) alone (–) or in combination with either mCherry-Vps4a WT or E228Q mutant (red), treated with rapamycin (200 nM, 30 min), stained with anti-PDHE2/E3 (blue). (C) Representative confocal micrographs of MitoPit-derived vesicle formation in cells expressing dark MitoTrap and FKBP-β2-GFP (green) pre-treated with Latrunculin B (1 µM) or control as indicated. Cells were treated with rapamycin (200 nM, 30 min), and stained with Acti-stain 555 (red) and anti-PDHE2/E3 (blue). Insets, ×5 zoom. Scale bars, 10 µm. (B, D) SuperPlots showing the percentage of free spots for each condition in A and C. Colors represent replicates, dots represent cells, solid dots represent the mean of each replicate. Indicated p values from Student’s t-test.
Figure 6 with 1 supplement
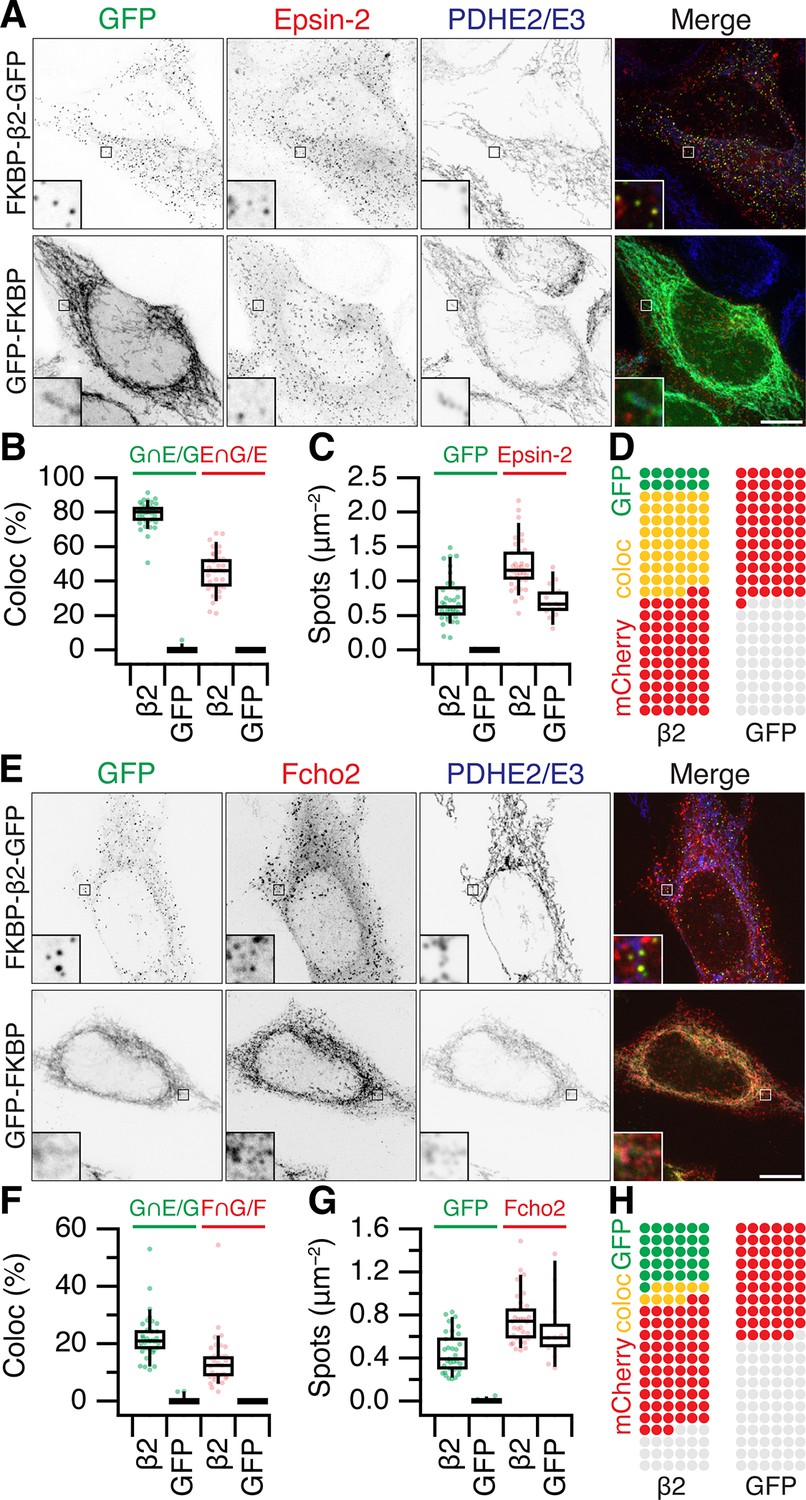
Accessory protein recruitment to MitoPits.
Representative confocal micrographs of HeLa cells expressing dark MitoTrap and mCherry- Epsin-2 (A) or mCherry-Fcho2 (E) (red) with either clathrin hook (FKBP-β2-GFP) or GFP-FKBP (green). Cells were treated with 200 nM rapamycin before staining for PDHE2/E3 (blue). Inset, ×5 zoom. Scale bars, 10 μm. Box plots to compare colocalization (B, F) and spot density (C, G). Each dot represents a cell. Box plots indicate median, IQR, 9th and 91st percentiles. Spots of GFP and mCherry were detected and quantified. Colocalization is shown as the percentage of GFP spots that coincided with Epsin-2 or Fcho2 spots (left), or the percentage of Epsin-2 or Fcho2 spots that coincided with GFP spots (right). (D, H) Waffle plots to visualize the median number of spots per 100 μm2 that were positive for GFP only (green), clathrin only (red), or both (yellow).
Figure 6—figure supplement 1
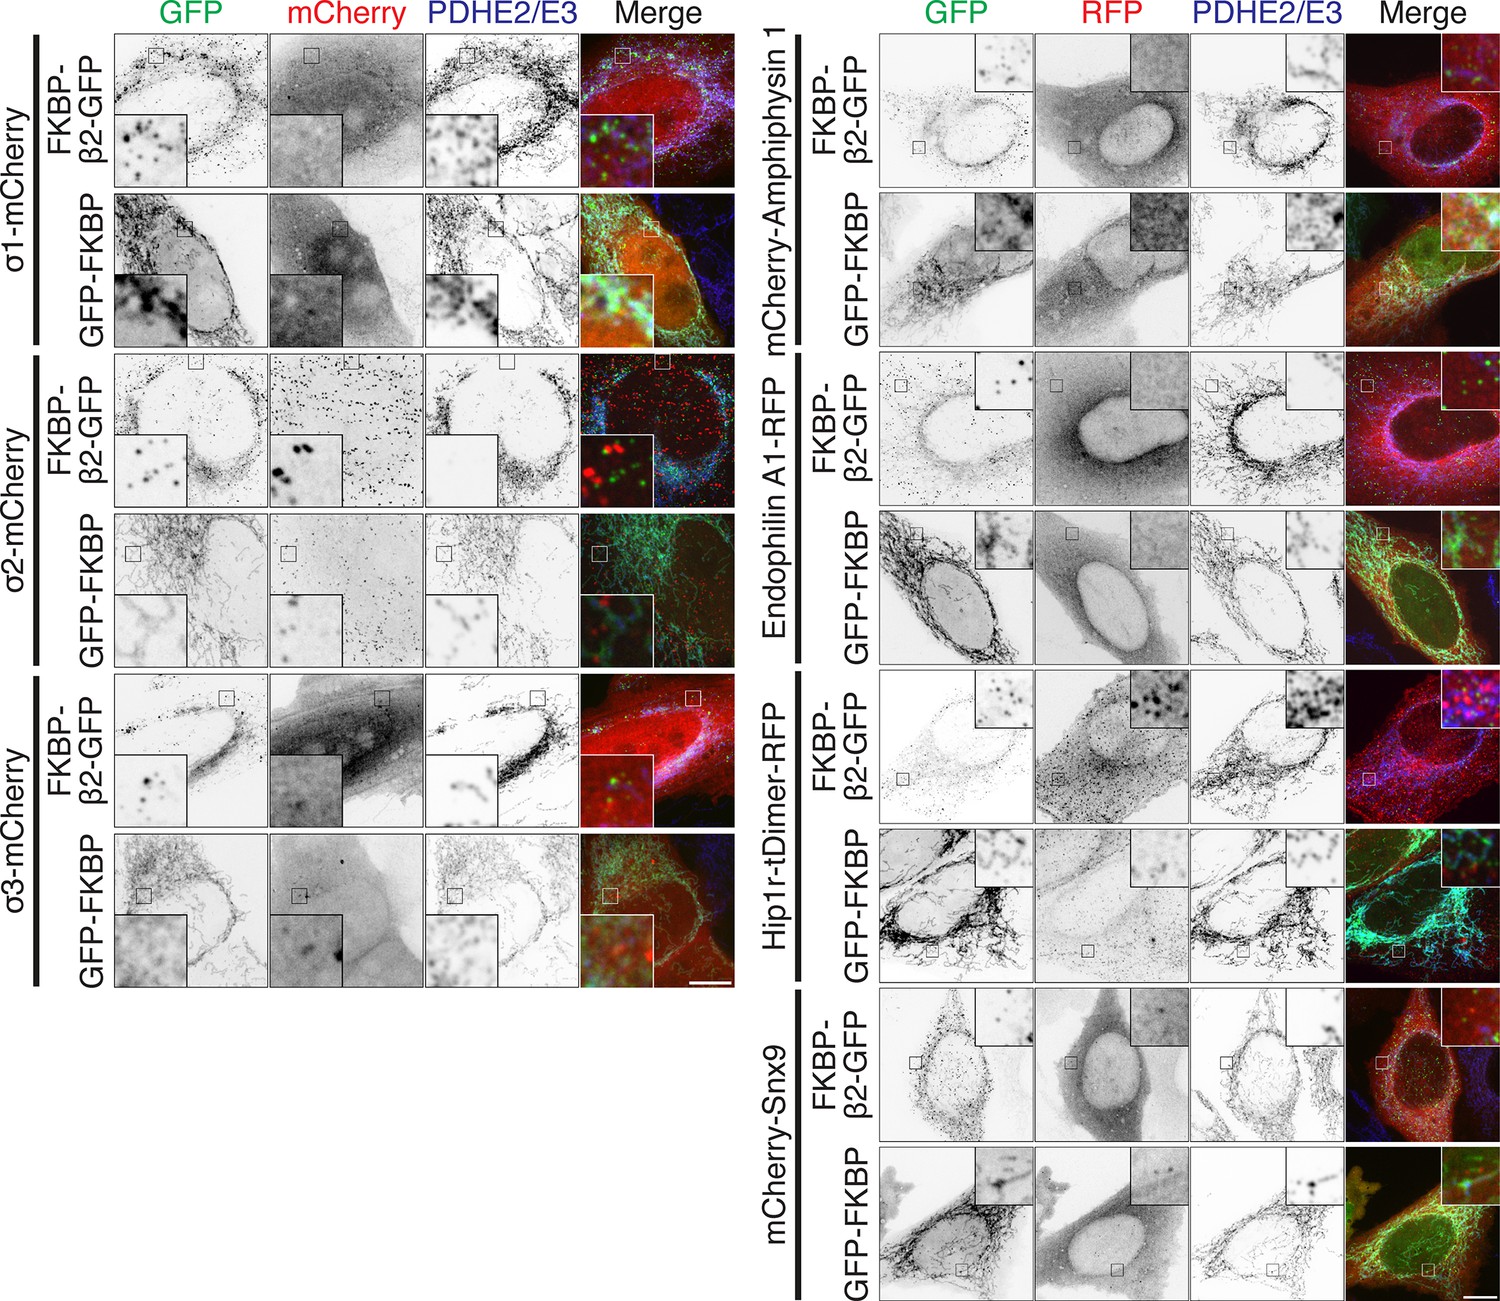
MitoPits do not recruit AP1, AP2, AP3, amphiphysin-1, endophilin-1, Hip1R, or SNX9.
Representative confocal micrographs of HeLa cells coexpressing a red fluorescent protein-tagged accessory protein together with dark MitoTrap and either FKBP-β2-GFP or GFP-FKBP control. Cells were treated with 200 nM rapamycin and immunostained with anti-PDHE2/E3/A647. Accessory proteins were sigma subunits of the AP1, AP2, and AP3 complexes (σ1-mCherry, σ2-mCherry, or σ3-mCherry, left) or mCherry-amphiphysin 1, Endophilin-FL-RFP, Hip1R-tDimer-RFP, or mCherry-SNX9, as indicated. Insets, ×5 zoom. Scale bars, 10 µm.
Figure 7
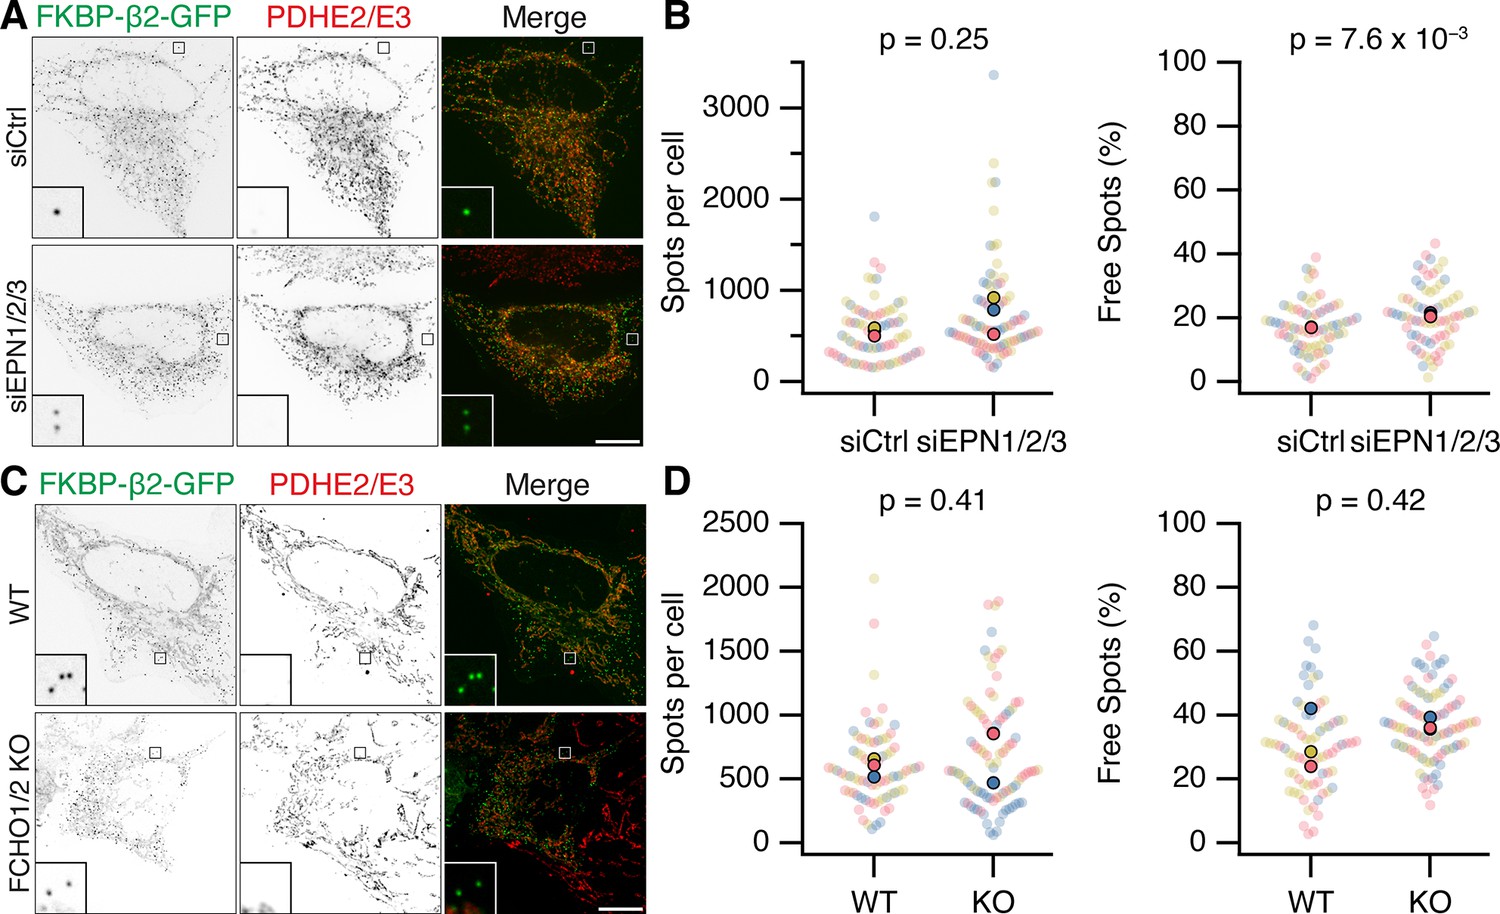
Epsins and FCHO proteins are dispensable for MitoPit formation and vesicle generation.
(A, C) Representative confocal micrographs of HeLa cells expressing dark MitoTrap and clathrin hook (FKBP-β2-GFP, green). In A, cells were transfected with control (siCtrl) or triple Epsin (siEPN1/2/3) siRNAs; in C, either wild-type or FCHO1/2 knockout (KO) HeLa cells were used. Cells were treated with 200 nM rapamycin before staining for PDHE2/E2 (red). Inset, ×5 zoom. Scale bars, 10 µm. (B, D) SuperPlots showing the spots per cell or the percentage of free spots for each condition. Colors represent replicates, dots represent cells, solid dots represent the mean of each replicate. Indicated p values from Student’s t-test.
Author response image 1
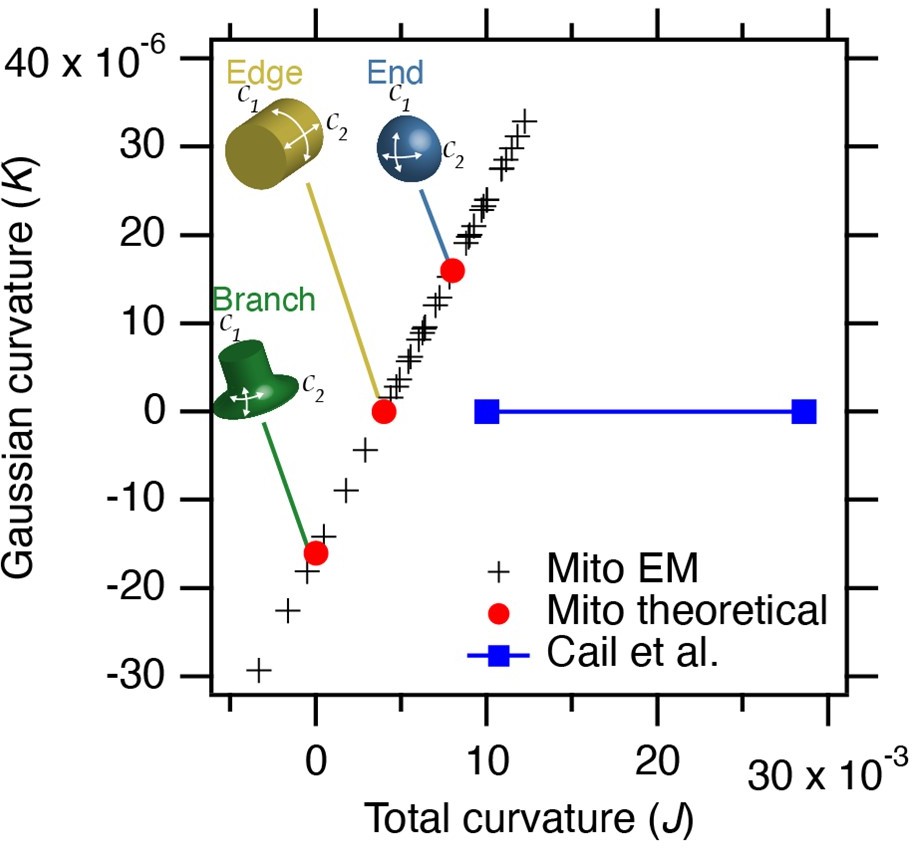
Estimated curvature at mitochondria bearing MitoPits.
Plot to show Gaussian curvature (K, product of two curvatures) versus total curvature (J, sum of two curvatures). Crosses show our measurements compared to theoretical values (red circles). The range of curvatures that show enrichment in the work of Cail et al. 2022 (Figure 1D) are indicated (blue). Note that our measured values lie on a line due to the substitution of 1/250 for curvature in the 3rd dimension.
Author response image 2
mCherry-Epsin2 recruitment to MitoPits.
Lower colocalisation is seen using a Y815A/Y888A mutant form of FKBP-beta2-GFP to form MitoPits compared to wild type.
Author response image 3
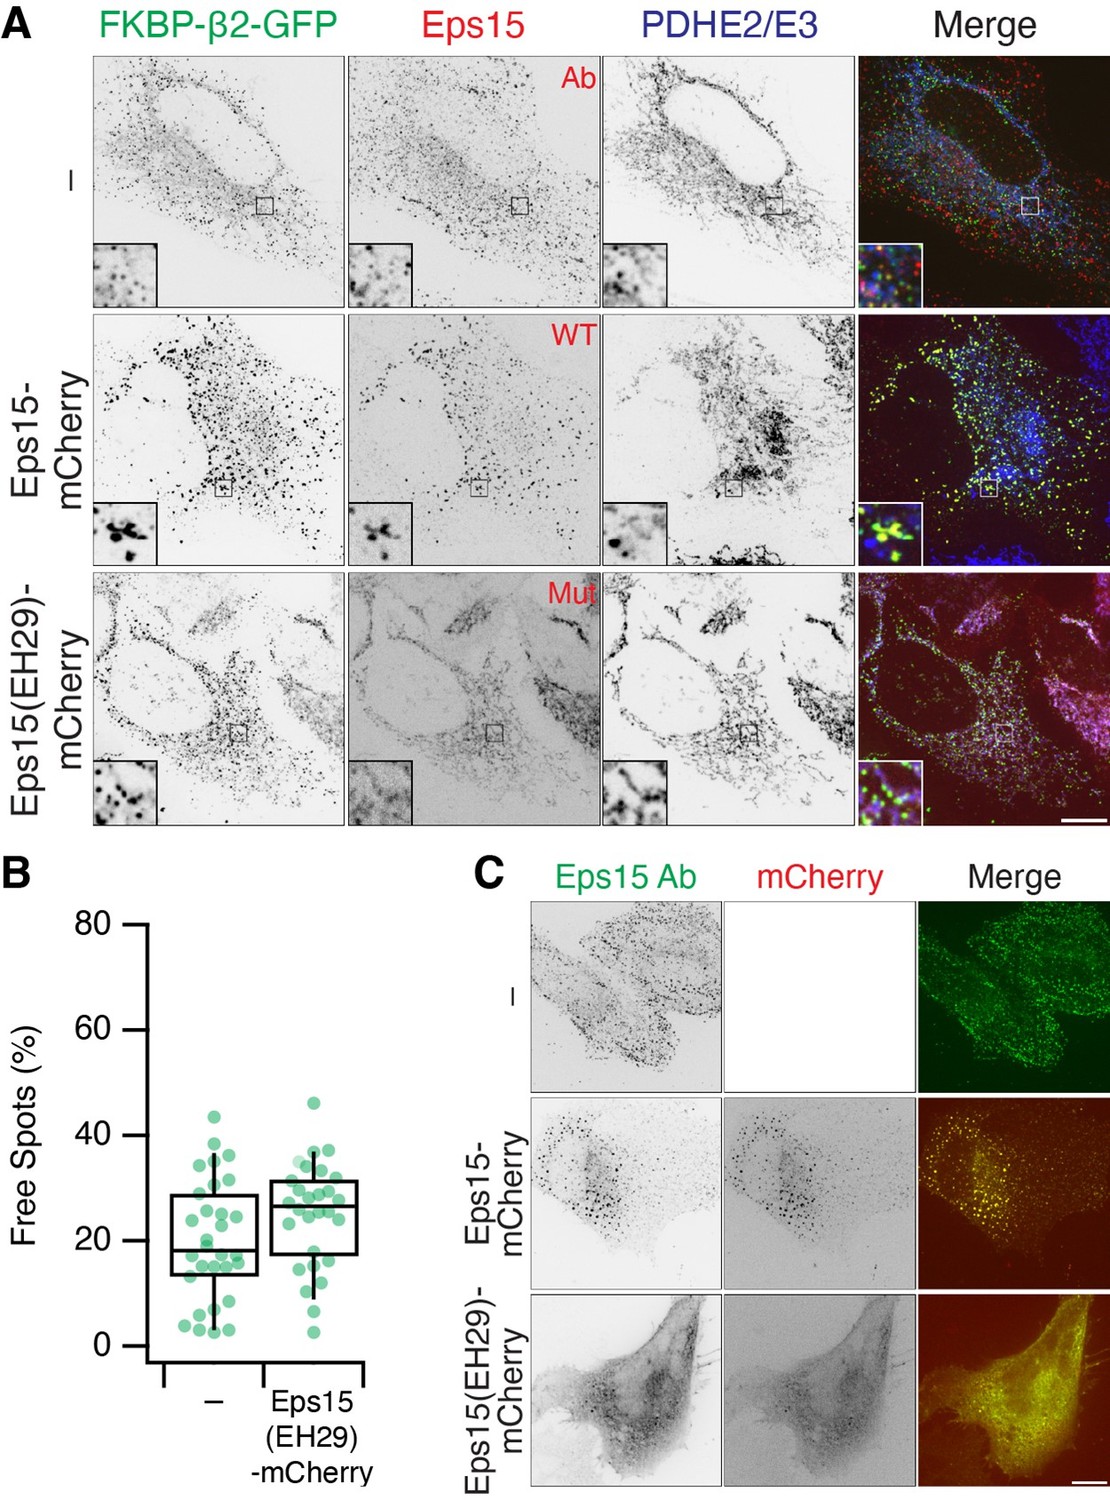
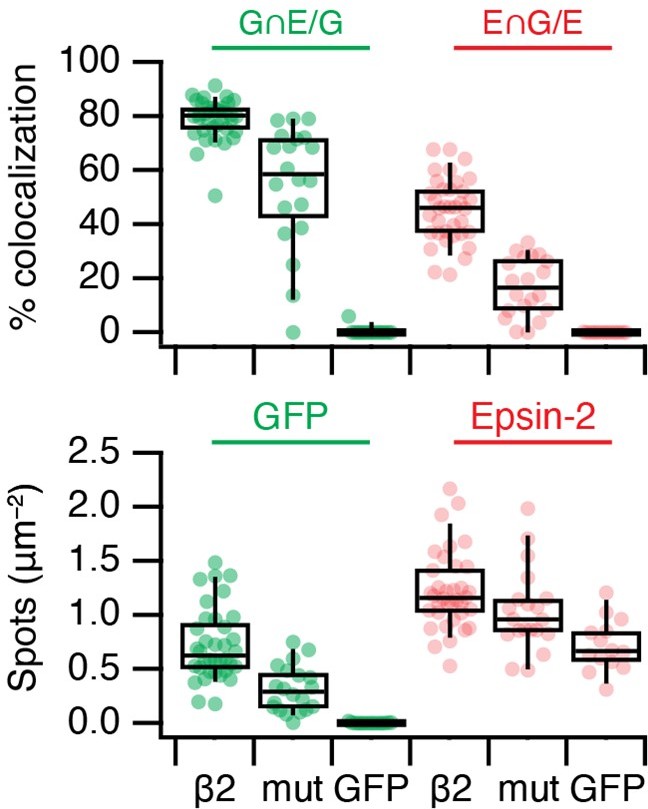
Eps15 recruitment to MitoPits.
(A) MitoPit formation in the presence of Eps15-mCherry or mutant EH29. Endogenous Eps15 (detected by IF) is recruited to MitoPits. (B) The fraction of Free Spots (MPDVs) is unaffected by co-expression of EH29. (C) Expression of EH29 mislocalises Eps15. Note that overexpression of Eps15-mCherry causes aggregation of large Eps15 structures and MitoPits.
Tables
Key resources table
| Reagent type (species) or resource | Designation | Source or reference | Identifiers | Additional information |
|---|---|---|---|---|
| Antibody | Anti-clathrin heavy chain (X22). Mouse monoclonal | ATCC | RRID:CVCL_F814 | 1:1000 |
| Antibody | Pyruvate dehydrogenase E2/E3bp antibody. Mouse monoclonal | Abcam | RRID:AB_10862029 | 1 µg/ml |
| Cell line (H. sapiens) | FCHO1/2 KO HeLa | Umasankar et al., 2014 | #64/1.E | |
| Cell line (M. musculus) | Dynamin triple knockout cells | Park et al., 2013 | DNM TKO | |
| Chemical compound, drug | Acti-stain 555 phalloidin | Cytoskeleton, Inc. | #PHDH1-A | Final 1:1000 |
| Chemical compound, drug | Dynamin Inhibitors: Dynole Series Kit | Abcam | ab120474 | 30 µM |
| Chemical compound, drug | Latrunculin B | Sigma-Aldrich | #428,020 | 1 µM |
| Chemical compound, drug | Rapamycin | Alfa Aesar | J62473 | 200 nM |
| Other | MitoTracker Deep Red FM | Thermo Fisher | M22426 | 1:15,000 |
| Other | Transferrin From Human Serum, Alexa Fluor 647 Conjugate | Thermo Fisher | T23366 | 100 µg/ml |
| Recombinant DNA reagent | CD8-dCherry-FRB | Wood et al., 2017 | RRID:Addgene_100739 | |
| Recombinant DNA reagent | Dyn1 K44A-mCherry | This paper | - | See Materials and methods - Molecular Biology section. Modification of Addgene plasmid #34681. GFP replaced by mCherry. Available from the corresponding author. |
| Recombinant DNA reagent | Dyn1 WT-mCherry | This paper | - | See Materials and methods - Molecular Biology section. Modification of Addgene plasmid #34680. GFP replaced by mCherry. Available from the corresponding author. |
| Recombinant DNA reagent | Endophilin-1–247-RFP | L.Lagnado, University of Sussex | - | |
| Recombinant DNA reagent | FKBP-AP180-GFP | This paper | RRID:Addgene_186577 | see Materials and methods - Molecular Biology section |
| Recombinant DNA reagent | FKBP-epsin-GFP | Wood et al., 2017 | RRID:Addgene_100733 | |
| Recombinant DNA reagent | FKBP-α-GFP | Wood et al., 2017 | RRID:Addgene_100731 | |
| Recombinant DNA reagent | FKBP-β1-GFP | Wood et al., 2017 | RRID:Addgene_100732 | |
| Recombinant DNA reagent | FKBP-β2 Y815A/∆CBM-GFP | Wood et al., 2017 | RRID:Addgene_100729 | |
| Recombinant DNA reagent | FKBP-β2-GFP | Wood et al., 2017 | RRID:Addgene_100726 | |
| Recombinant DNA reagent | FKBP-β3-GFP | Wood et al., 2017 | RRID:Addgene_100734 | |
| Recombinant DNA reagent | FRB-mCherry-Giantin | This paper | RRID:Addgene_186575 | see Materials and methods - Molecular Biology section |
| Recombinant DNA reagent | FRB-mCherry-Sec61β | This paper | RRID:Addgene_186574 | see Materials and methods - Molecular Biology section |
| Recombinant DNA reagent | GFP-FKBP | Wood et al., 2017 | - | |
| Recombinant DNA reagent | Hip1R-tDimer-RFP | Addgene | RRID:Addgene_27700 | |
| Recombinant DNA reagent | Lamp1-mCherry-FRB | This paper | RRID:Addgene_186576 | see Materials and methods - Molecular Biology section |
| Recombinant DNA reagent | mCherry-amphiphysin 1 | Addgene | RRID:Addgene_27692 | |
| Recombinant DNA reagent | mCherry-Drp1 | Addgene | RRID:Addgene_49152 | |
| Recombinant DNA reagent | mCherry-Drp1 K38A | This paper | - | See Materials and methods - Molecular Biology section. Modification of Addgene plasmid. K38A mutation introduced into mCherry-Drp1. Available from the corresponding author. |
| Recombinant DNA reagent | mCherry-epsin2 | Addgene | RRID:Addgene_27673 | |
| Recombinant DNA reagent | mCherry-FCHo2 | Addgene | RRID:Addgene_27686 | |
| Recombinant DNA reagent | mCherry-SNX9 | Addgene | RRID:Addgene_27678 | |
| Recombinant DNA reagent | mCherry-Vps4a E228Q | This paper | - | See Materials and methods - Molecular Biology section. mCherry-tagged Vps4a E228Q (converted from GFP-Vps4a E228Q). Available from the corresponding author. |
| Recombinant DNA reagent | mCherry-Vps4a WT | This paper | - | See Materials and methods - Molecular Biology section. mCherry-tagged Vps4a (converted from GFP-Vps4a). Available from the corresponding author. |
| Recombinant DNA reagent | pMito-dCherry-FRB | This paper | RRID:Addgene_186573 | see Materials and methods - Molecular Biology section |
| Recombinant DNA reagent | pMito-mCherry-FRB | Wood et al., 2017 | RRID:Addgene_59352 | see Materials and methods - Molecular Biology section |
| Recombinant DNA reagent | σ1-mCherry | This paper | RRID:Addgene_186578 | see Materials and methods - Molecular Biology section |
| Recombinant DNA reagent | σ2-mCherry | Willox and Royle, 2012 | RRID:Addgene_186579 | |
| Recombinant DNA reagent | σ3-mCherry | This paper | RRID:Addgene_186580 | see Materials and methods - Molecular Biology section |
Additional files
Download links
A two-part list of links to download the article, or parts of the article, in various formats.
Downloads (link to download the article as PDF)
Open citations (links to open the citations from this article in various online reference manager services)
Cite this article (links to download the citations from this article in formats compatible with various reference manager tools)
Recruitment of clathrin to intracellular membranes is sufficient for vesicle formation
eLife 11:e78929.
https://doi.org/10.7554/eLife.78929


