Rapid encoding of task regularities in the human hippocampus guides sensorimotor timing
- Kavli Institute for Systems Neuroscience, Centre for Neural Computation, The Egil and Pauline Braathen and Fred Kavli Centre for Cortical Microcircuits, Jebsen Centre for Alzheimer’s Disease, Norwegian University of Science and Technology, Norway
- Max Planck Institute for Human Cognitive and Brain Sciences, Germany
- Department of Basic Psychology, Clinical Psychology, and Psychobiology, Universitat Jaume I, Spain
- CEA DRF/Joliot, NeuroSpin; INSERM, Cognitive Neuroimaging Unit; CNRS, Université Paris-Saclay, France
- Wilhelm Wundt Institute of Psychology, Leipzig University, Germany
Figures
Figure 1 with 2 supplements
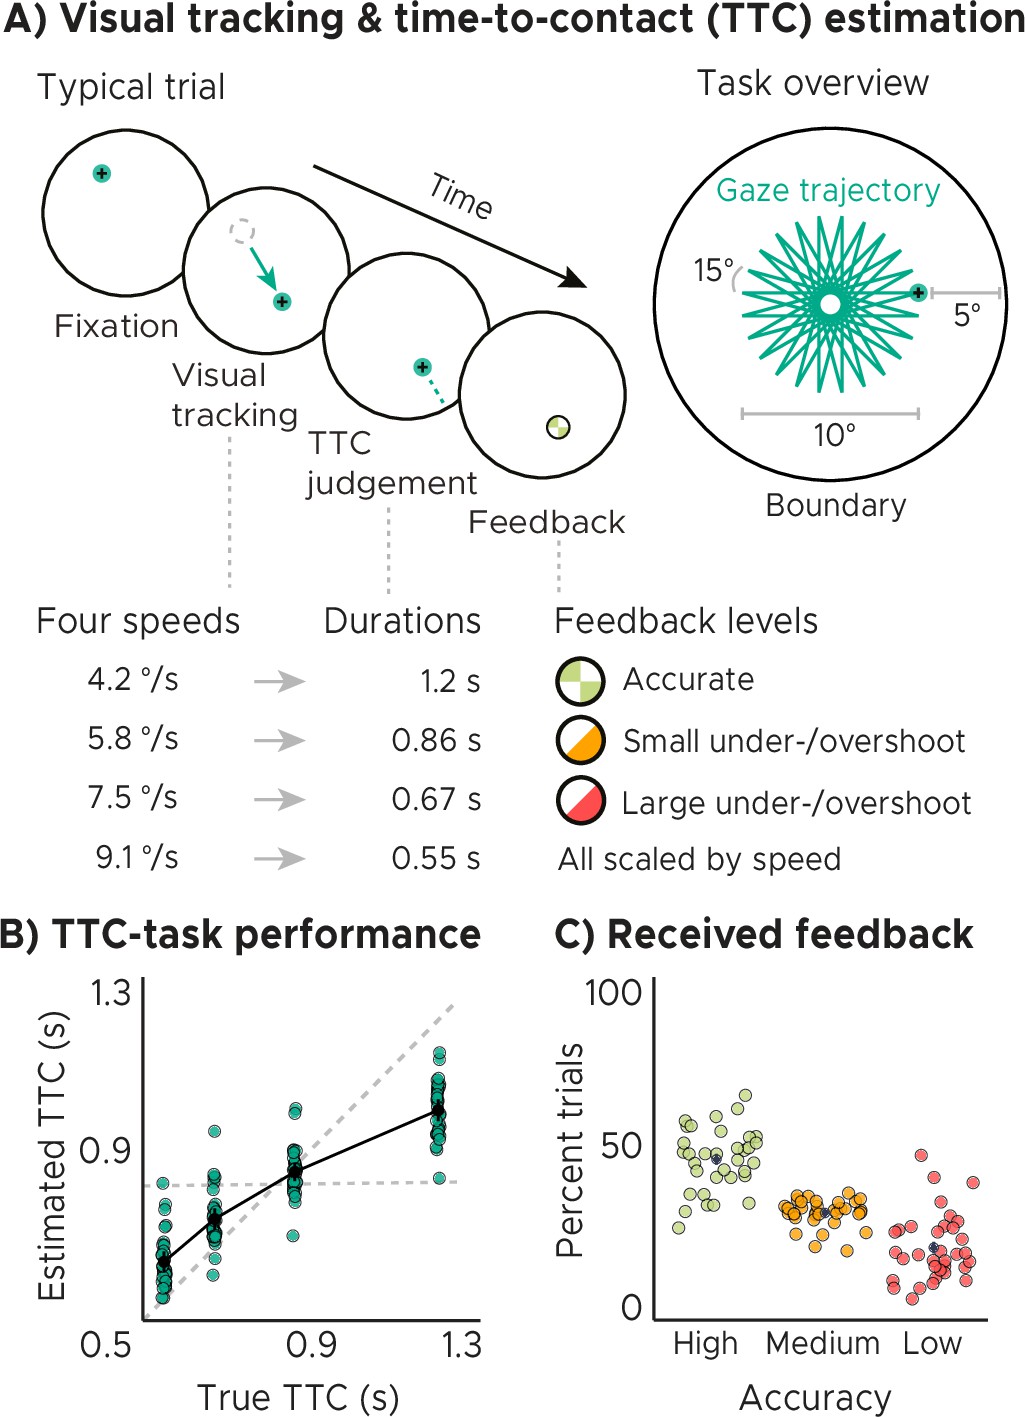
Visual tracking and Time-To-Contact (TTC) estimation task.
(A) Task design. In each trial during fMRI scanning, participants fixated a target (phase 1), which started moving at one of 4 possible speeds and in one of 24 possible directions for 10° visual angle (phase 2). After the target stopped moving, participants kept fixating and estimated when the fixation target would have hit a boundary 5° visual angle apart (phase 3). After pressing a button at the estimated TTC, participants received feedback (phase 4) according to their performance. Feedback was scaled relative to target TTC. (B) Task performance. True and estimated TTC were correlated, showing that participants performed the task well. However, they overestimated short TTCs and underestimated long TTCs. Their estimates regressed towards the grand-mean of the TTC distribution (horizontal dashed line), away from the line of equality (diagonal dashed line). (C) Feedback. On average, participants received high-accuracy feedback on half of the trials (also see Figure 1—figure supplement 1B, Figure 1—figure supplement 1C). (BC) We plot the mean and SEM (black dots and lines) as well as single-participant data as dots (n=34). Feedback levels are color coded.
Figure 1—figure supplement 1
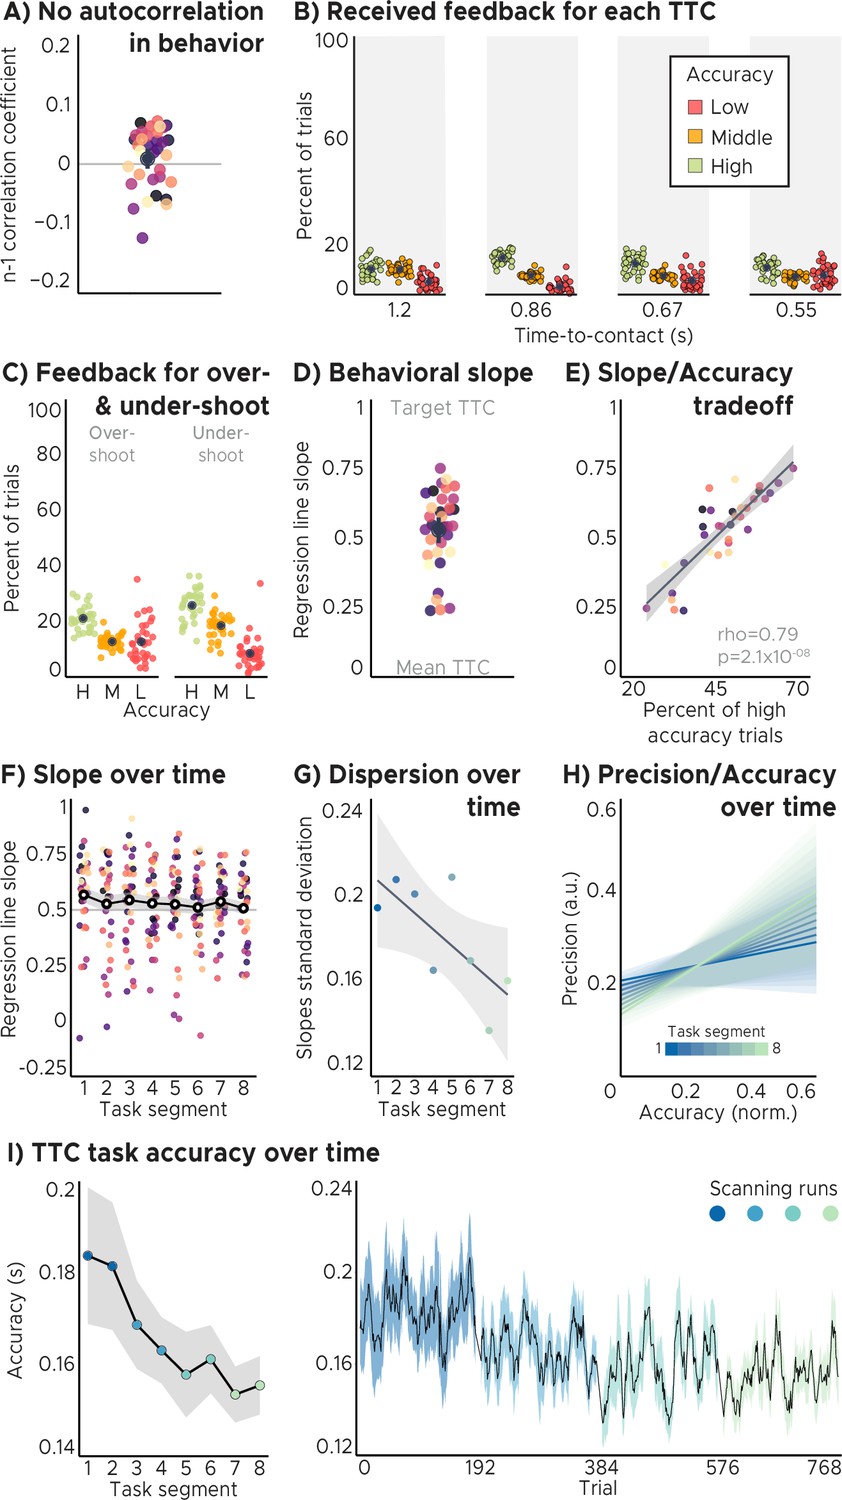
Behavioral analyses.
(A) No autocorrelation in the behavioral feedback over trials. The feedback in one trial did not predict feedback in the following trial. Displayed values correspond to the Pearson n-1 correlation coefficient. (B) Feedback distributions for all speed levels. Participants received approximately the same feedback for all speed levels/target TTCs. (C) Feedback distribution for over- and under-shoot trials. Participants received approximately the same feedback for both type of TTC response patterns. (D) Behavioral regression effect. We plot linear regression-line slopes predicting estimated TTCs as a function of target TTCs for each participant. A slope of 1 indicates perfect performance. A slope of 0 indicates that participants always gave the same response independent of the target TTC. We found that the slope coefficients clustered at around 0.5, suggesting that participants’ responses were biased toward the mean of the sampled intervals. (ABCD) Depicted are the mean and SEM across participants (black dot and line) overlaid on single participant data (dots; n=34). (E) Performance trade-off between the regression effect and TTC accuracy. Participants with higher TTC accuracy exhibited a weaker regression effect, reflected in larger regression-line slopes (same data as in D). Each dot represents a single participant (n=34). Regression line (black) and SEM (gray shade) were added. (F) Behavioral regression effect over time. Participants’ slope coefficients converged towards the value of 0.5 as they progressed through the task. Each dot represents a single participant (n=34). Mean (black and white dot) and SEM (gray shade) were added. (ADEF) Participants were color coded. (G) Behavioral regression slopes dispersion over time. The dispersion of the regression slope coefficients across participants (measured as standard deviation) decreased over time. Regression line (black) and SEM (gray shade) were added. (H) Precision vs. Accuracy over time. The tradeoff between Precision and Accuracy increases as participants progress through the TTC task as evidenced by a steady increase in the slope value over time. Lower values represent better Precision and Accuracy. Colored shades represent mixed-effects model linear fits’ 95% confidence interval range. (GH) Task segments were color coded. (I) TTC task accuracy over time. Left panel: Across-trial-average accuracy over task segments. Right panel: task accuracy over trials. We plot the mean (black line) and SEM (shaded area) across participants (n=34). Run identity color coded. Participants’ task accuracy improved over time.
Figure 1—figure supplement 2
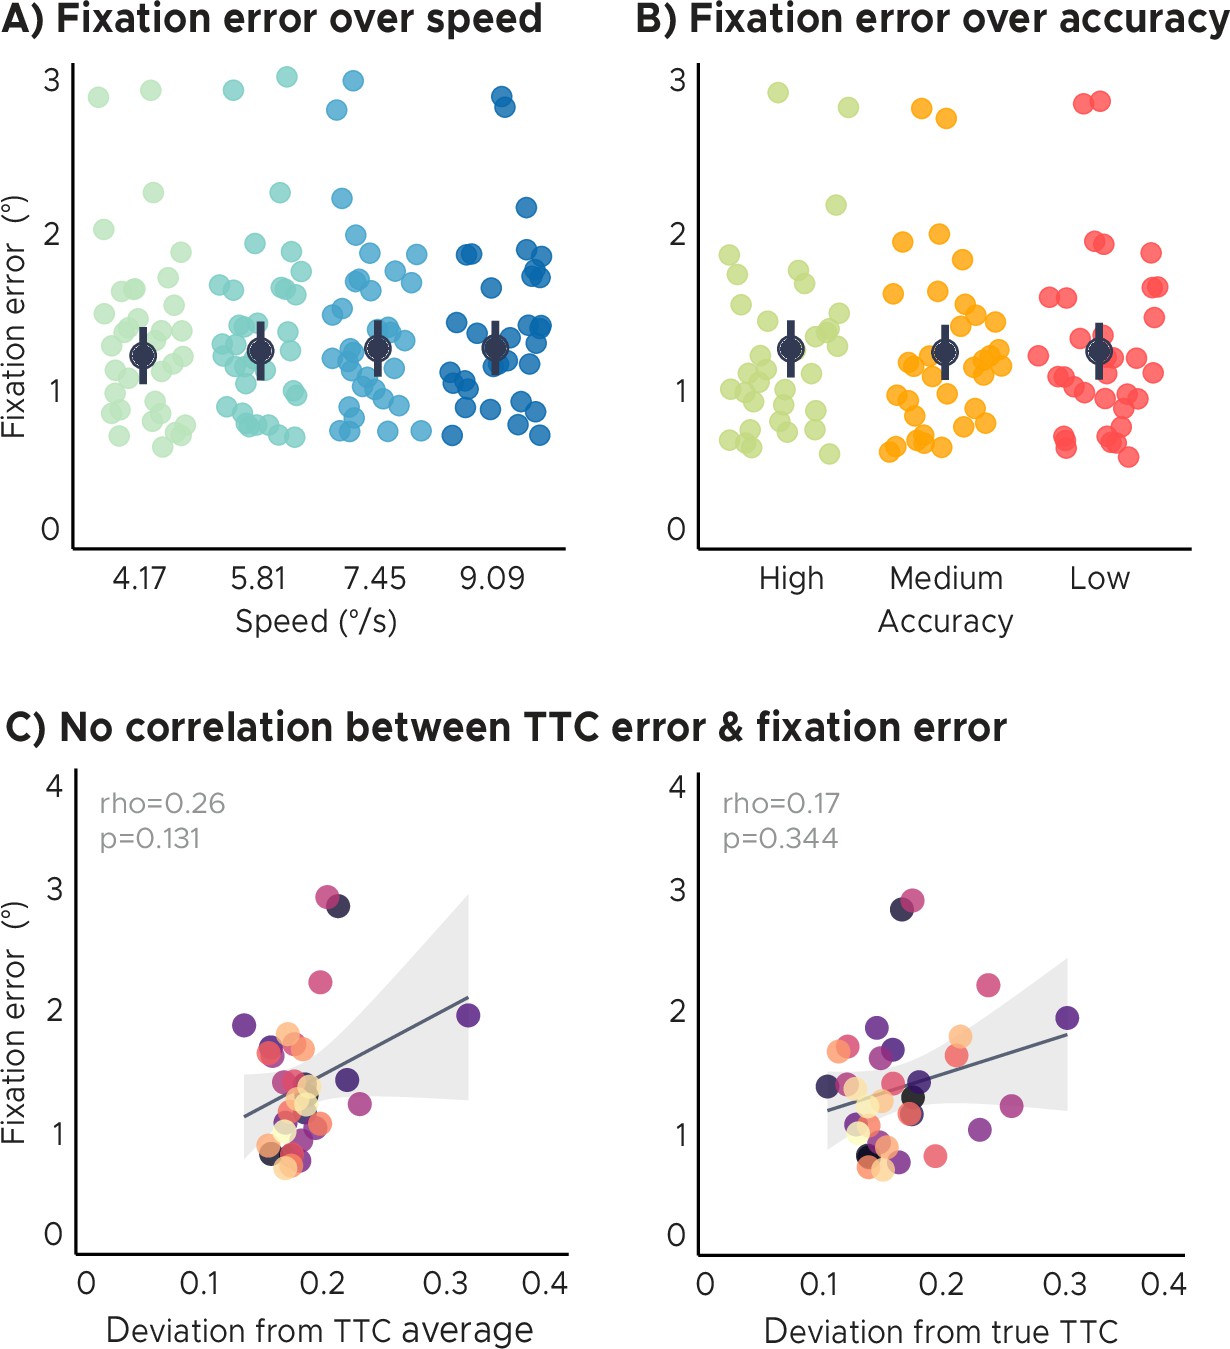
Eye tracking analyses.
(A) Fixation error over speed. There were no significant differences in fixation error across speed levels/target TTC’s. (B) Fixation error over TTC-task accuracy. There were no significant differences in fixation error across TTC-task accuracy levels. (C) No correlation of the behavioral regression-to-the-mean effect or TTC-task performance with fixation error. Fixation quality does not affect the interpretation of the imaging results presented in this study. Each dot represents a single participant (n=34). Participants were color coded. Regression line (black) and standard error (gray shade). (AB) Group-level mean and SEM depicted as black dot and line overlaid on single participant data (n=34).
Figure 2 with 4 supplements
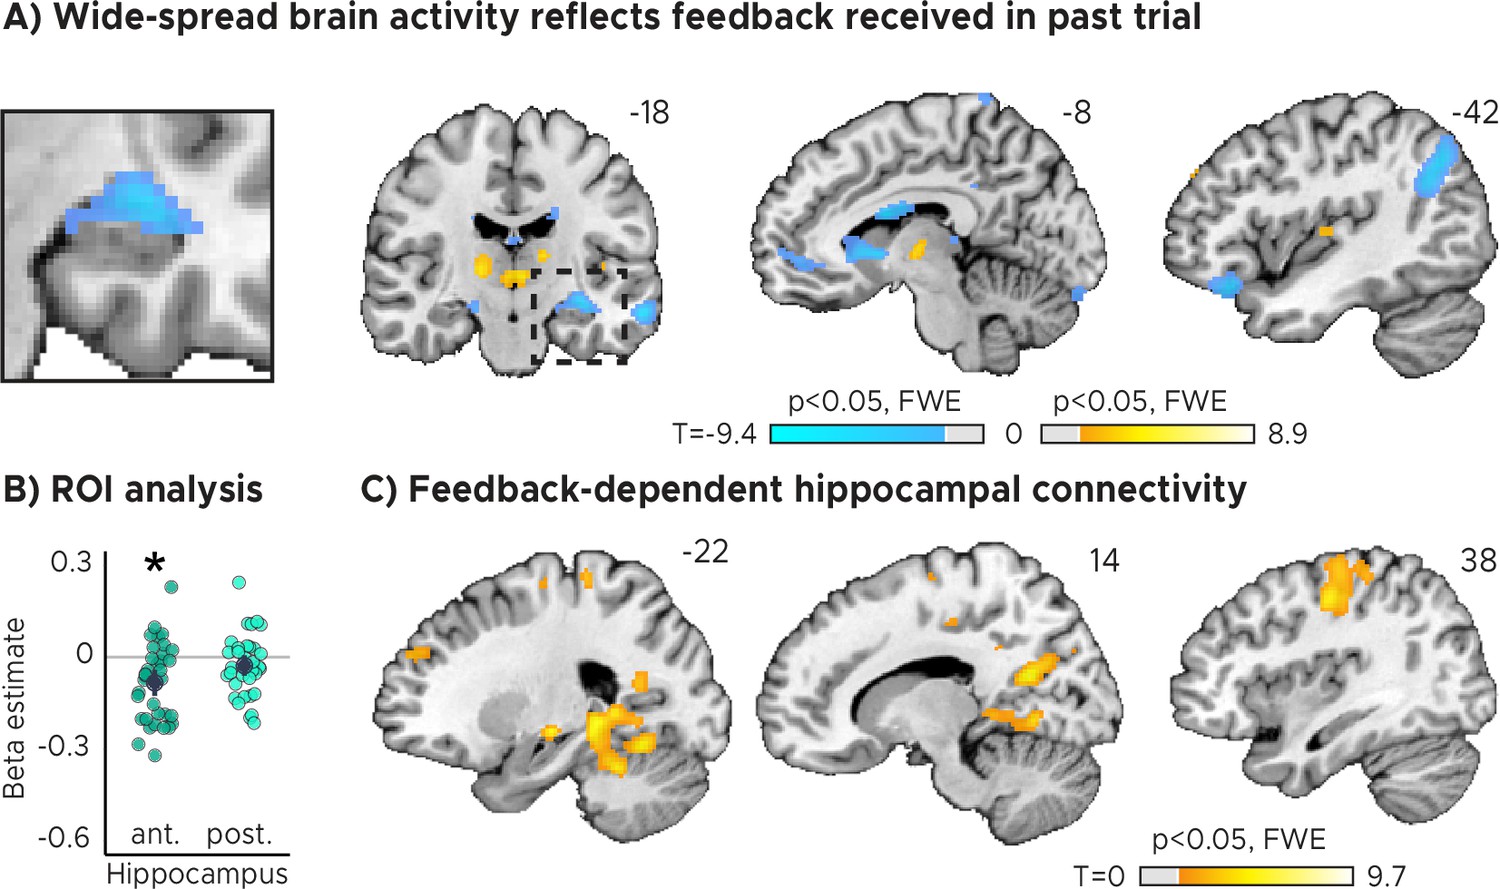
Feedback on the previous trial (n-1) modulates network-wide activity and hippocampal connectivity in subsequent trials (n).
(A) Voxel-wise analysis. Activity in each trial was modeled with a separate regressor as a function of feedback received in the previous trial. Insert zooming in on hippocampus added. (B) Independent regions-of-interest analysis for the anterior (ant.) and posterior (post.) hippocampus. We plot the beta estimates obtained for the contrast between low-accuracy vs. high-accuracy feedback. Negative values indicate that smaller errors, and higher-accuracy feedback, led to stronger activity. Depicted are the mean and SEM across participants (black dot and line) overlaid on single participant data (coloured dots; n=34). Activity in the anterior hippocampus is modulated by feedback received in previous trial. Statistics reflect p<0.05 at Bonferroni-corrected levels (*) obtained using a group-level two-tailed one-sample t-test against zero. (C) Feedback-dependent hippocampal connectivity. We plot results of a psychophysiological interactions (PPI) analysis conducted using the hippocampal peak effects in (A) as a seed for low vs. high-accuracy feedback. (AC) We plot thresholded t-test results at 1 mm resolution overlaid on a structural template brain. MNI coordinates added. Hippocampal activity and connectivity is modulated by feedback received in the previous trial.
Figure 2—figure supplement 1
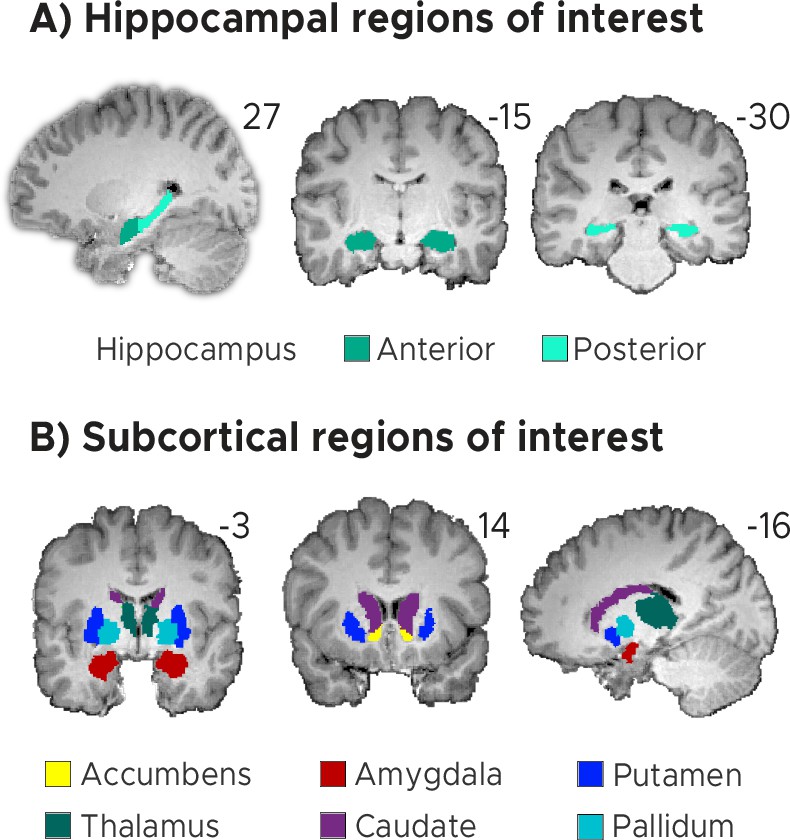
Regions of interest (ROIs).
(A) Anterior and posterior hippocampal ROIs. (B) Subcortical regions-of-interest (ROIs) for the nucleus accumbens, the amygdala, the thalamus, the caudate, the putamen and the pallidum. (AB) ROIs shown for a sample participant superimposed onto the skull-stripped structural T1-scan of that participant. These masks were created using FreeSurfer’s cortical and subcortical parcellation.
Figure 2—figure supplement 2
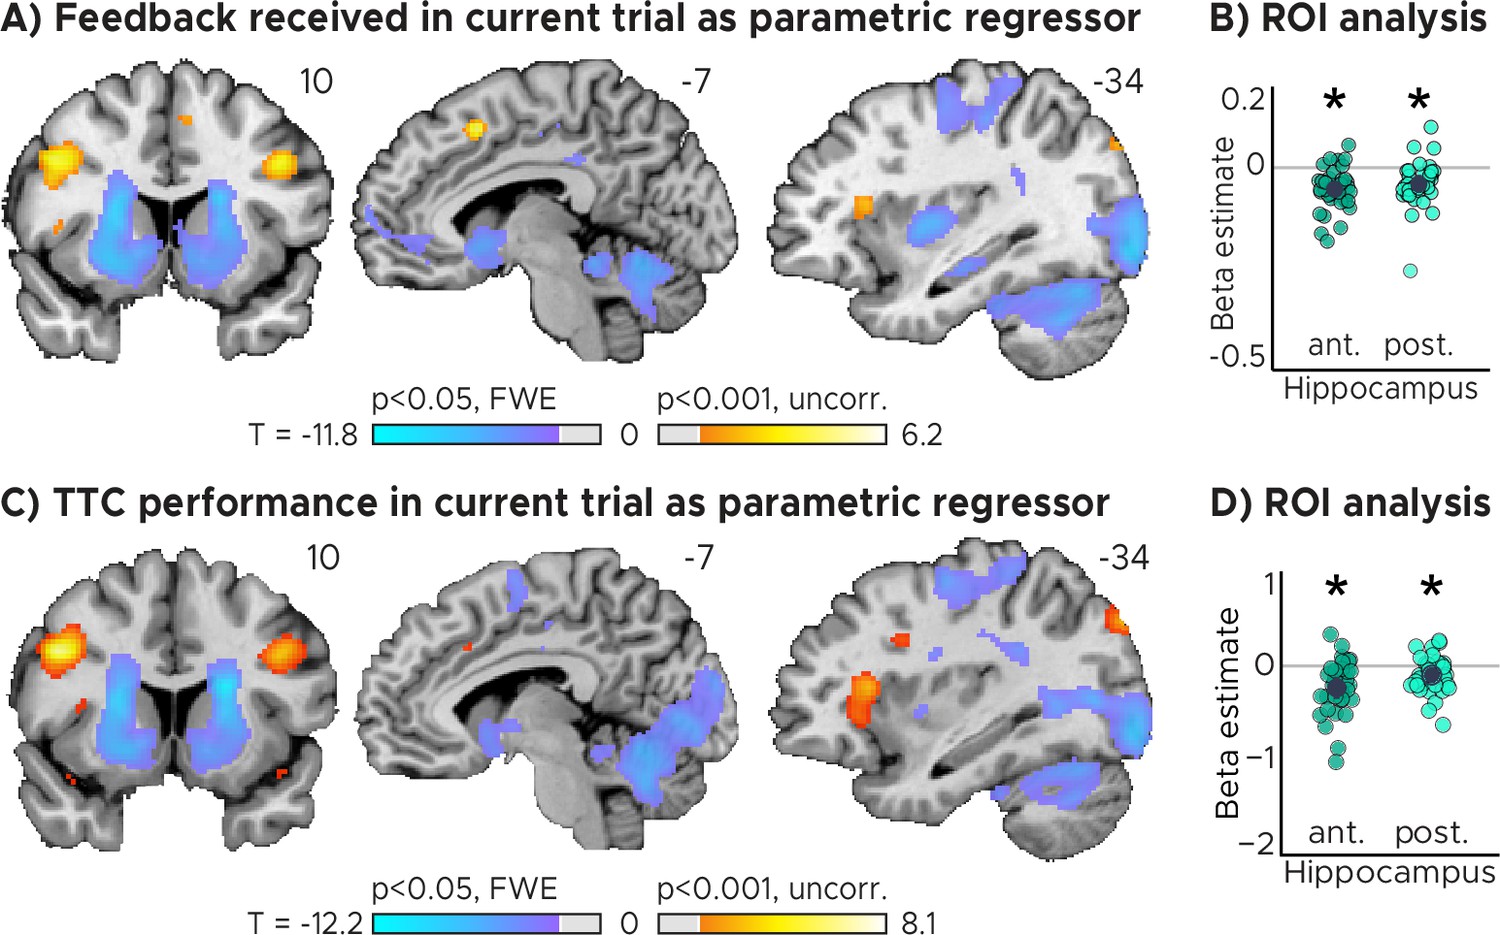
Current trial effects.
(A) Brain regions signaling behavioral feedback in current trial. Activity in each trial was modeled parametrically as a function of the feedback received at the end of the trial. (B) Independent regions-of-interest analysis for the anterior (ant.) and posterior (post.) hippocampus. We plot the beta estimate obtained for the parametric modulator modeling trial-wise activity as a function of feedback received at the end of the trial. Negative values indicate that smaller errors, and higher-accuracy feedback, led to stronger activity. (C) Brain regions signaling task performance in current trial. Activity in each trial was modeled parametrically as a function of the absolute difference between estimated and true TTC. (D) Independent regions-of-interest analysis for the anterior (ant.) and posterior (post.) hippocampus. We plot the beta estimate obtained for the parametric modulator modeling trial-wise activity as a function of task performance. Negative values indicate that better task performance led to stronger activity. (AC) Voxel-wise analysis. We plot thresholded t-test results at 1 mm resolution overlaid on a structural template brain. MNI coordinates added. (BD) Depicted are the means and SEM across participants (black dot and line) overlaid on single participant data (coloured dots; n=34). Statistics reflect p<0.05 at Bonferroni-corrected levels (*) obtained using a group-level two-tailed one-sample t-test against zero.
Figure 2—figure supplement 3
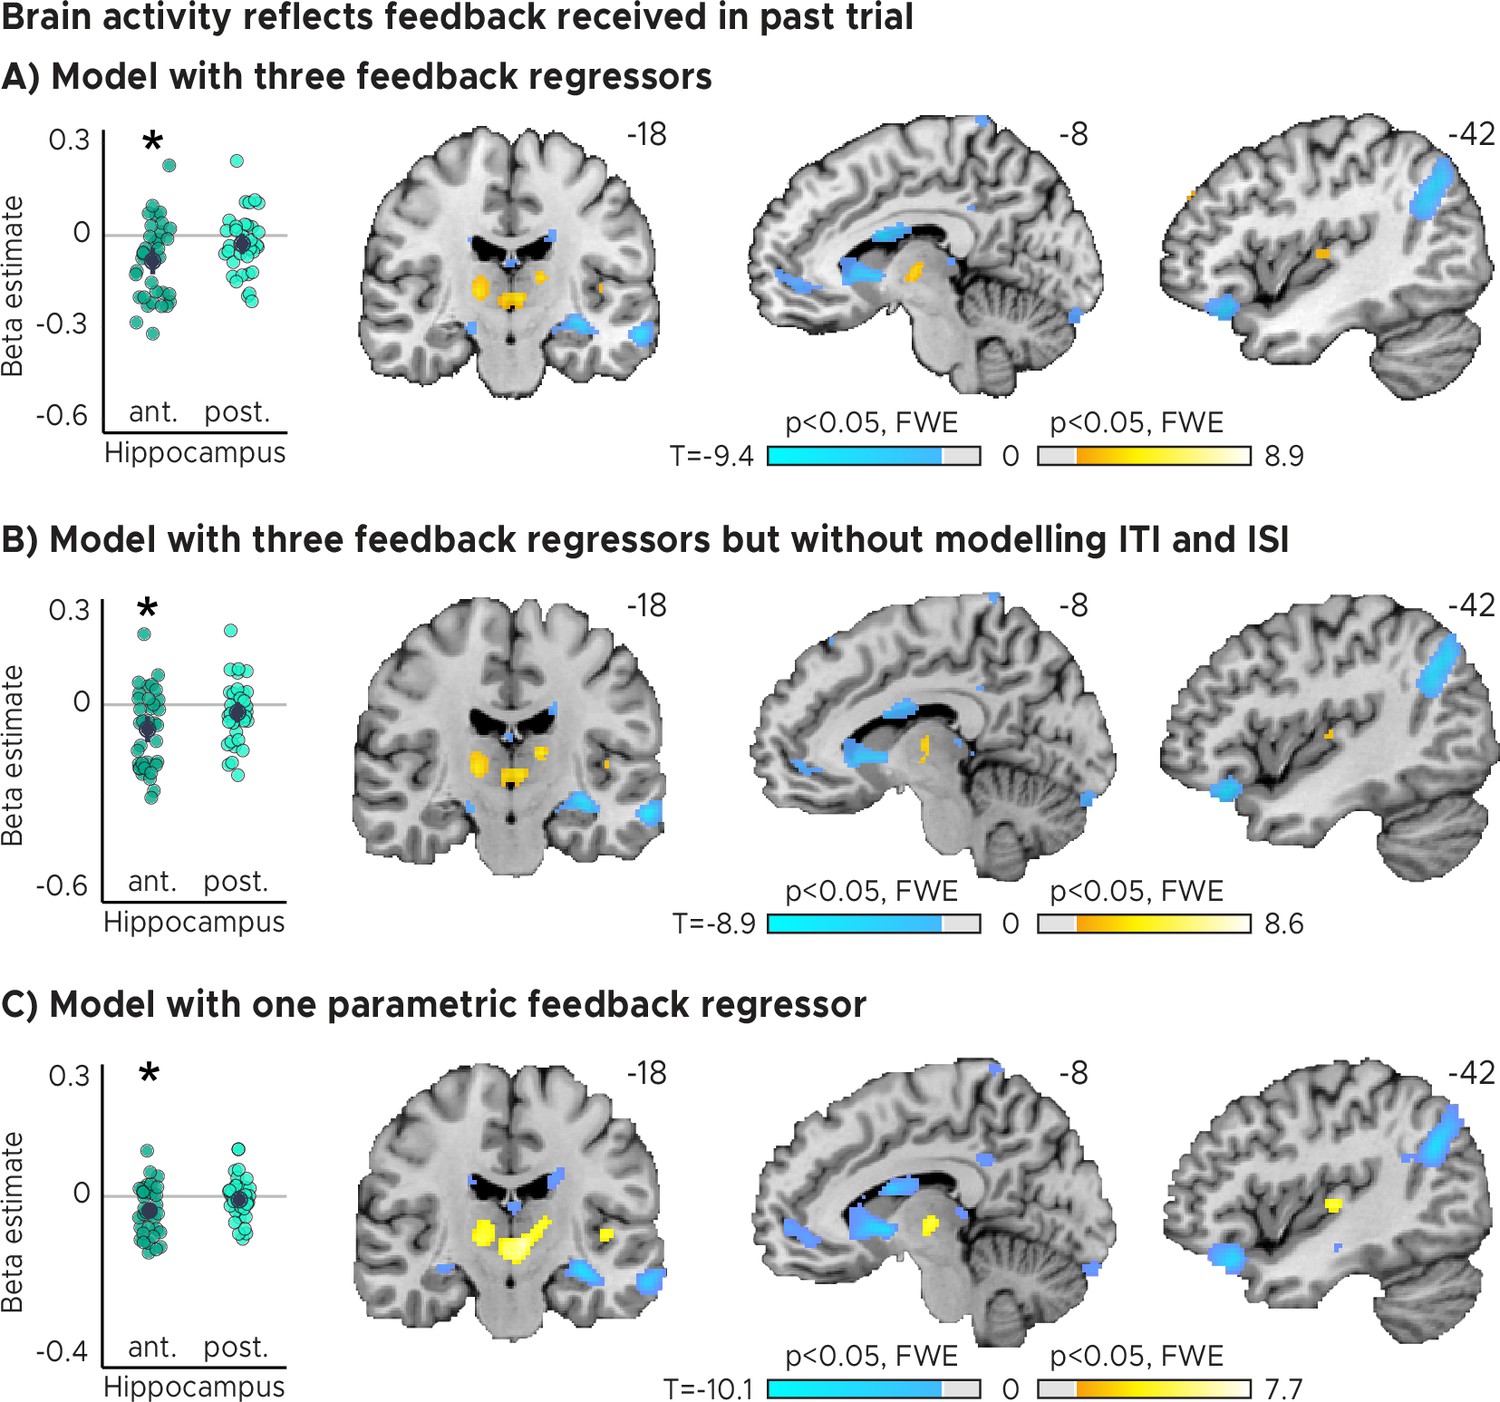
Brain activity reflects feedback received in past trial.
(A) Activity in each trial was modeled with three separate regressors for each feedback level received in the previous trial. Left: Independent regions-of-interest analysis for the anterior (ant.) and posterior (post.) hippocampus. We plot the beta estimates obtained for the contrast between low-accuracy vs. high-accuracy feedback. Negative values indicate that smaller errors, and higher-accuracy feedback, led to stronger activity. Depicted are the mean and SEM across participants (black dot and line) overlaid on single participant data (coloured dots; n=34). Statistics reflect p<0.05 at Bonferroni-corrected levels (*) obtained using a group-level two-tailed one-sample t-test against zero. Right: Voxel-wise analysis. (B) Same as in A, but without modeling Inter-Trial-Intervals (ITI) and Inter-Session-Intervals (ISI). (C) Same as in A, but modeling the three previous trial feedback levels with one parametric regressor. (ABC) We plot thresholded t-test results at 1 mm resolution overlaid on a structural template brain. MNI coordinates added.
Figure 2—figure supplement 4
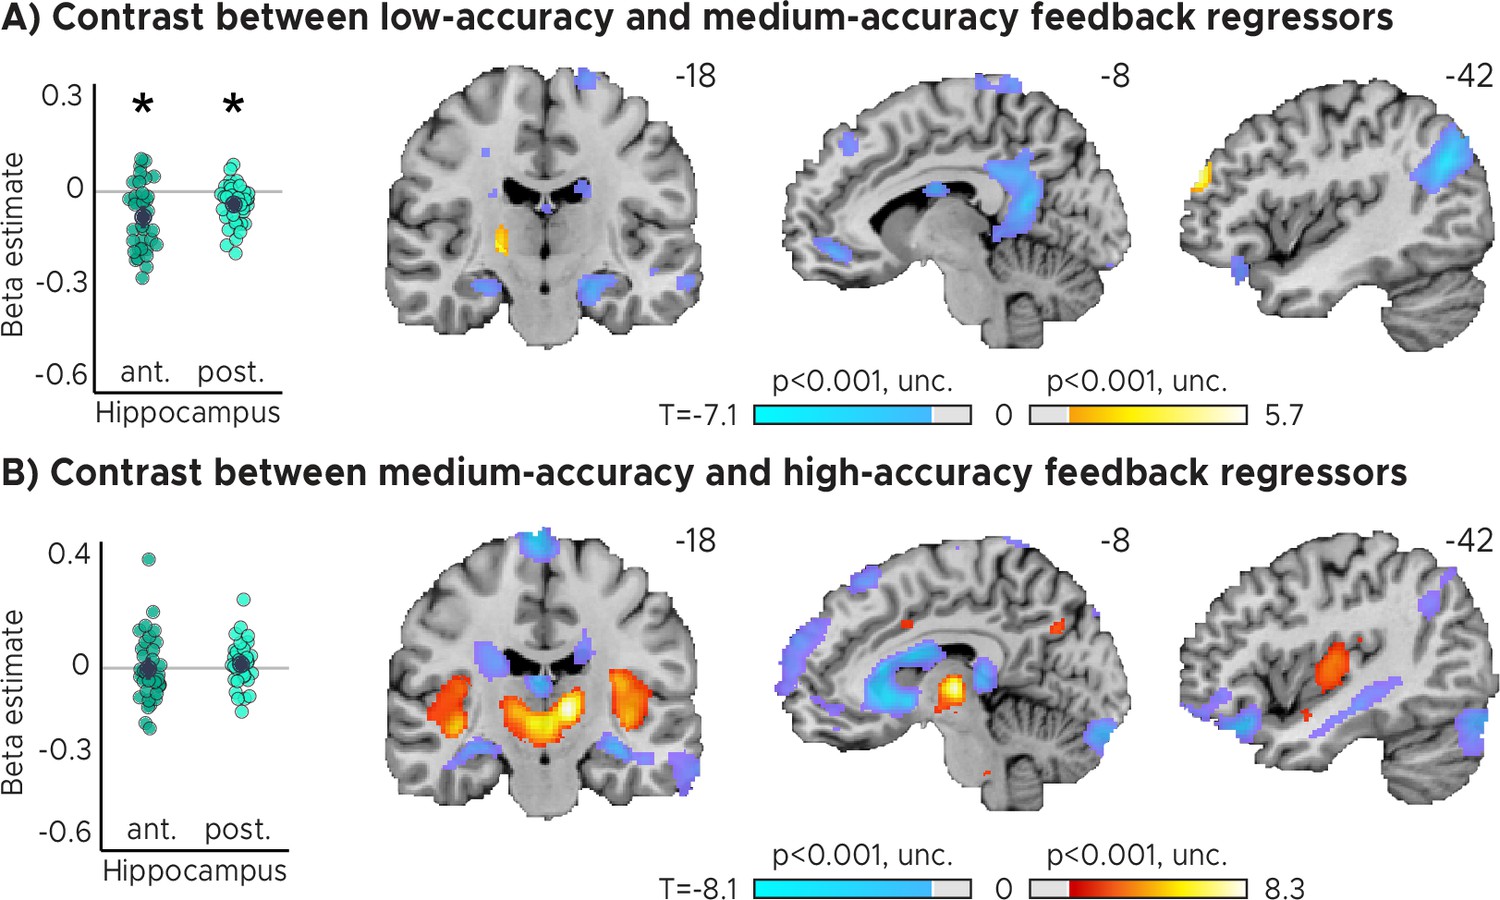
Remaining contrasts from Figure 2A, Figure 2B.
Activity in each trial was modeled with three separate regressors for each feedback level received in the previous trial. (A) Left: Independent regions-of-interest analysis for the anterior (ant.) and posterior (post.) hippocampus. We plot the beta estimates obtained for the contrast between low-accuracy vs. medium-accuracy feedback. Negative values indicate that medium errors, and medium-accuracy feedback, led to stronger activity. Depicted are the mean and SEM across participants (black dot and line) overlaid on single participant data (coloured dots; n=34). Statistics reflect p<0.05 at Bonferroni-corrected levels (*) obtained using a group-level two-tailed one-sample t-test against zero. Right: Voxel-wise analysis. (B) Left: Same as in A, but we plot instead the beta estimates obtained for the contrast between medium-accuracy vs. high-accuracy feedback. Negative values indicate that smaller errors, and high-accuracy feedback, led to stronger activity. Right: Voxel-wise analysis. (AB) We plot thresholded t-test results at 1 mm resolution overlaid on a structural template brain. MNI coordinates added.
Figure 3 with 2 supplements
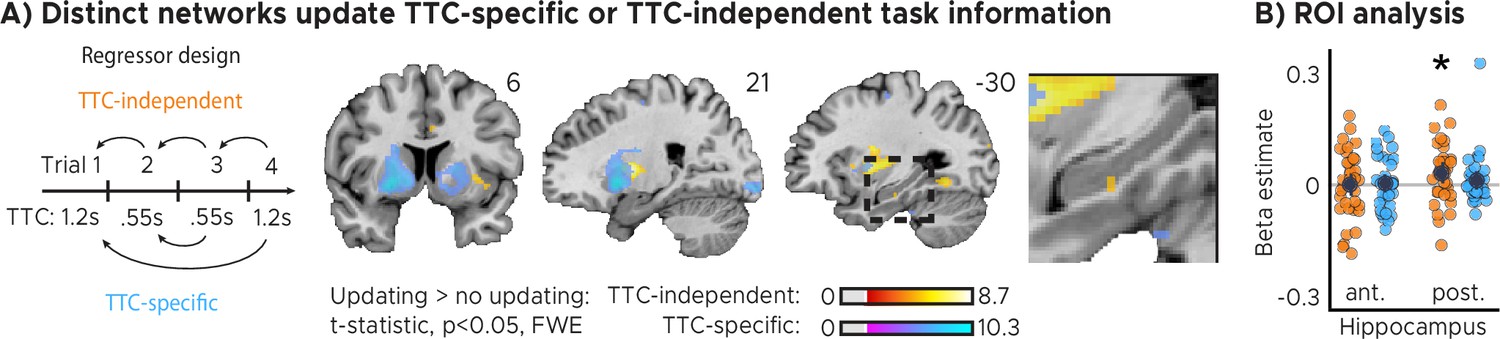
Distinct cortical and subcortical networks signal the updating of TTC-specific and TTC-independent task information.
(A) Left panel: Visual depiction of parametric modulator design. Two regressors per run modeled the improvement in behavioral performance since the last trial independent of the tested TTC (Regressor 1: TTC-independent) or the improvement since the last trial when the same target TTC was tested (Regressor 2: TTC-specific). Right panel: Voxel-wise analysis results for TTC-specific and TTC-independent regressors. We plot thresholded t-test results at 1 mm resolution at p<0.05 whole-brain Family-wise-error (FWE) corrected levels overlaid on a structural template brain. Insert zooming in on hippocampus and MNI coordinates added. (B) Independent regions-of-interest analysis for the anterior (ant.) and posterior (post.) hippocampus. We plot the beta estimates obtained for TTC-independent in orange and TTC-specific regressors in blue. Depicted are the mean and SEM across participants (black dot and line) overlaid on single participant data as dots (n=34). Statistics reflect p<0.05 at Bonferroni-corrected levels (*) obtained using a group-level one-tailed one-sample t-test against zero.
Figure 3—figure supplement 1
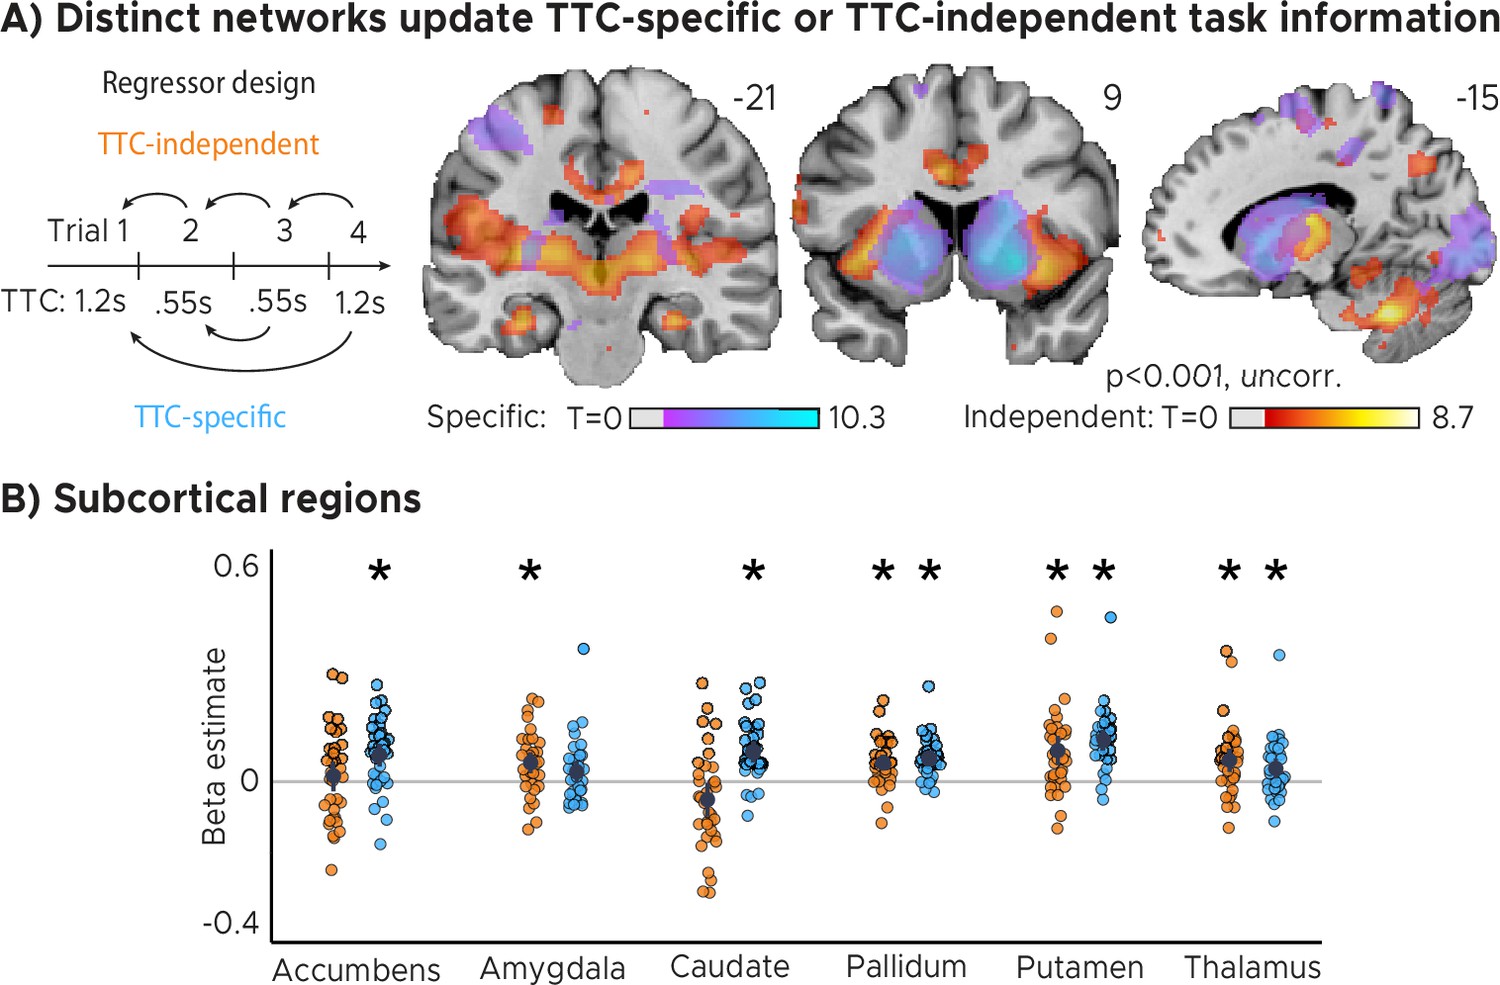
Distinct networks support TTC-specific and TTC-independent updating.
(A) Voxel-wise mass-univariate GLM results for TTC-independent and TTC-specific parametric regressors. We plot thresholded t-test results at 1 mm resolution. Activity maps were overlaid on a structural template brain. Positive t-scores indicate a relationship between brain activity and the updating of either TTC-specific or TTC-independent information respectively. (B) ROI-analysis results for subcortical regions for TTC-independent (orange dots) and TTC-specific regressors (blue dots). Depicted are the mean and SEM across participants (black dot and line) overlaid on single participant data (n=34). Statistics reflect p<0.05 at Bonferroni-corrected levels (*) obtained using a group-level one-tailed one-sample t-test against zero.
Figure 3—figure supplement 2
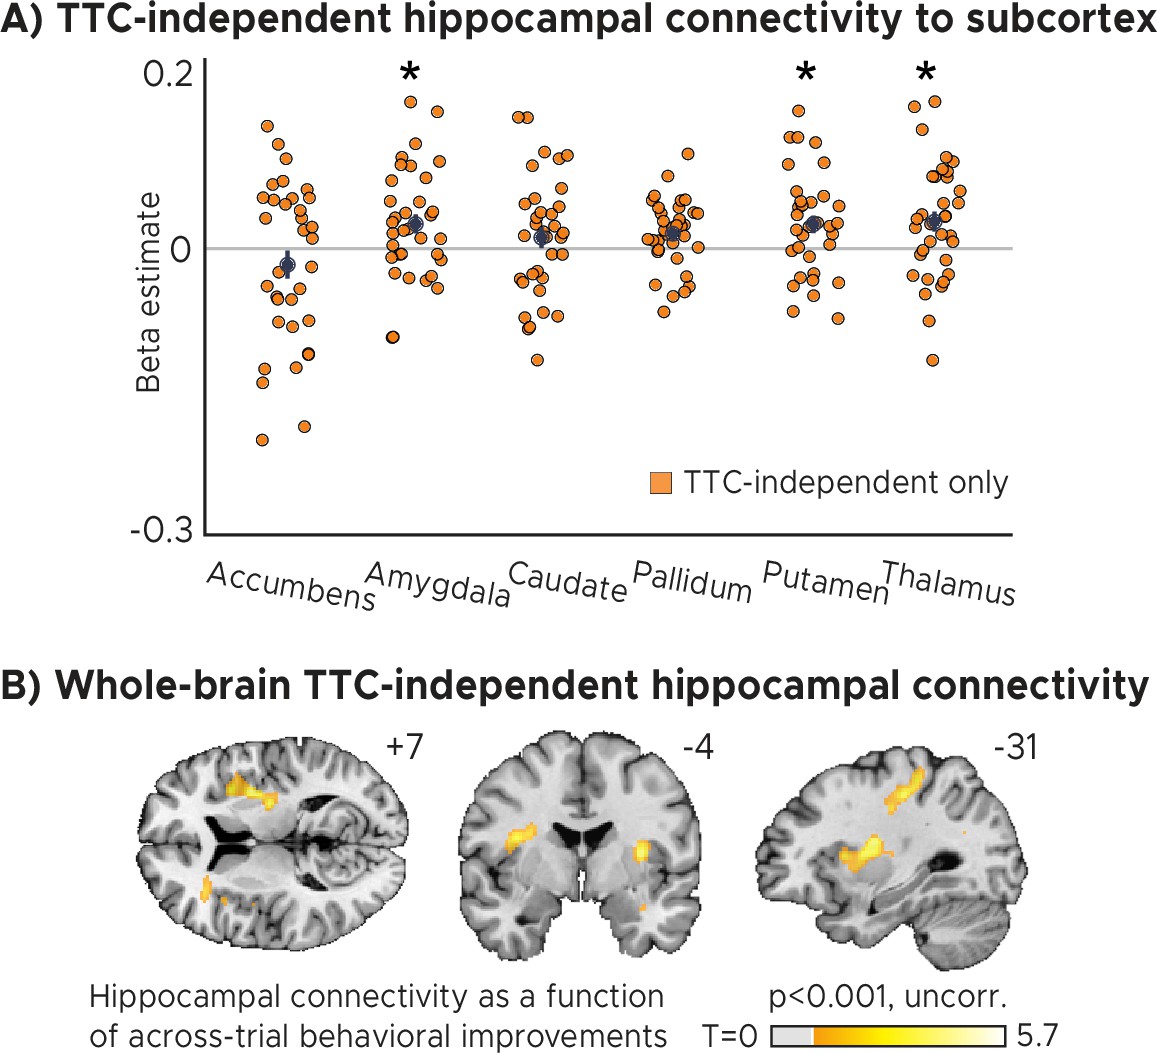
TTC-independent hippocampal connectivity.
(A) Regions of interest analysis for subcortical regions estimated using a Psychophysiological-interactions (PPI) analysis conducted using the hippocampal effect in Figure 3A as a seed. Positive beta estimates indicate that functional connectivity between each ROI and the hippocampal seed depended on how much participants TTC-task performance improved across trials. Depicted are the mean and SEM across participants (black dot and line) overlaid on single participant data (n=34) for the nucleus accumbens, the amygdala, the caudate, the globus pallidum, the putamen and the thalamus. Statistics reflect P<0.05 at Bonferroni-corrected levels (*) obtained using a group-level one-tailed one-sample t-test against zero. (B) Whole-brain voxel-wise t-test results for the TTC-independent hippocampal connectivity overlaid on a structural template brain at 1 mm resolution. MNI coordinates added.
Figure 4
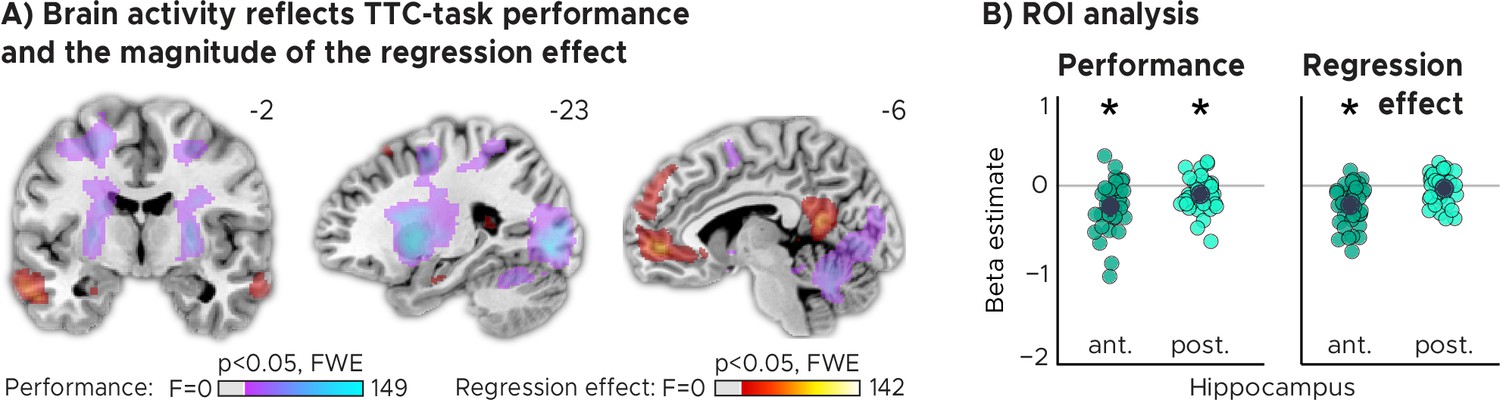
TTC-task performance vs. behavioral regression effect.
(A) Voxel-wise analysis. We plot thresholded F-test results for the task-performance regressor and the regression-to-the-mean regressor at 1 mm resolution overlaid on a structural template brain. MNI coordinates added. Distinct networks reflect task performance and the magnitude of the regression effect. (B) Independent regions-of-interest analysis for the anterior (ant.) and posterior (post.) hippocampus. We plot the beta estimates obtained for each participant for each of the two regressors. Negative values indicate a linear increase between hippocampal activity and either task performance (left, Performance) or the magnitude of the regression effect (right, Regression effect). Depicted are the mean and SEM across participants (black dot and line) overlaid on single participant data (colored dots; n=34). Statistics reflect p<0.05 at Bonferroni-corrected levels (*) obtained using a group-level two-tailed one-sample t-test against zero.
Author response image 1
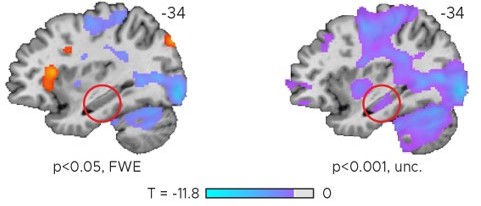
Left: Effect of task performance modeled with one parametric regressor (Figure 2—figure supplement 2).
Right: Same data as on the left but plotted at a more liberal, uncorrected threshold. Only negative t-scores shown on the right.
Tables
Table 1
Target TTCs’ response windows for each feedback level.
| Target TTC = 0.55 s | |
| Accuracy | Response window (s) |
| High | 0.47–0.63 |
| Medium | 0.38–0.47 | 0.63–0.71 |
| Low | <0.38 | >0.71 |
| Target TTC = 0.67 s | |
| Accuracy | Response window (s) |
| High | 0.57–0.77 |
| Medium | 0.47–0.57 | 0.77–0.87 |
| Low | <0.47 | >0.87 |
| Target TTC = 0.86 s | |
| Accuracy | Response window (s) |
| High | 0.73–0.99 |
| Medium | 0.60–0.73 | 0.99–1.12 |
| Low | <0.60 | >1.12 |
| Target TTC = 1.2 s | |
| Accuracy | Response window (s) |
| High | 1.02–1.38 |
| Medium | 0.84–1.02 | 1.38–1.56 |
| Low | <0.84 | >1.56 |
Additional files
Download links
A two-part list of links to download the article, or parts of the article, in various formats.
Downloads (link to download the article as PDF)
Open citations (links to open the citations from this article in various online reference manager services)
Cite this article (links to download the citations from this article in formats compatible with various reference manager tools)
Rapid encoding of task regularities in the human hippocampus guides sensorimotor timing
eLife 11:e79027.
https://doi.org/10.7554/eLife.79027


