Neural representations of naturalistic events are updated as our understanding of the past changes
- Department of Psychology, Columbia University, United States
- Princeton Neuroscience Institute and Department of Psychology, Princeton University, United States
- Department of Psychological and Brain Sciences, Johns Hopkins University, United States
Figures
Figure 1

Experimental design.
(A) Participants watched edited versions of the movie and performed a scene-by-scene cued verbal recall task in the scanner. (B) Experimental groups. Red boxes refer to the Ghost interpretation, and blue boxes refer to the Doctor interpretation. The ‘twist’ group (middle row) is the main experimental group that encodes the movie with Doctor interpretation (left blue box) but recalls it with Ghost interpretation (right red box)—essentially following the narrative as intended by the filmmaker. The two additional groups keep the same interpretation across the encoding and recall: the ‘spoiled’ group receives a spoiler at the beginning, thus encoding the movie and performing the recall task with the red Ghost interpretation, whereas the ‘no-twist’ group never receives the twist and therefore encodes the movie and performs the recall task under the blue Doctor interpretation.
Figure 2

Brain regions coding for story interpretation at encoding and recall.
‘Prediction legends’ depict the predicted pattern of correlations between groups based on our hypotheses. (A) Areas with significantly greater intersubject pattern correlation between groups who encoded the movie with the same interpretation (Doctor). (B) Areas with significantly greater intersubject pattern correlation between groups who recalled the movie with the same interpretation (Ghost). (C) Areas with a significant interaction effect, indicating a change in interpretation between encoding and recall (see ‘Intersubject pattern correlation (pISC) analysis’ in Methods). Statistical significance was assessed using a nonparametric randomization test, FDR corrected p<0.05.
Figure 3
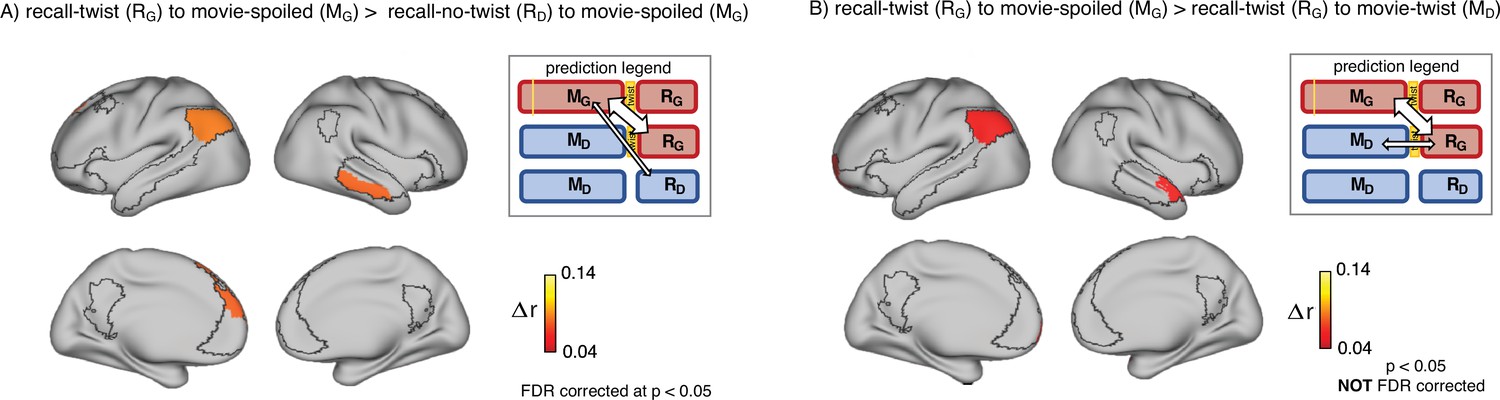
Encoding-retrieval similarity analyses to test our memory updating predictions.
“Prediction legends” depict the predicted pattern of correlations between groups based on our hypotheses. (A) Areas where intersubject pattern correlations were significantly greater when comparing updated recall (RG) to spoiled encoding (MG) than when comparing naive recalls (RD) to spoiled encoding (MG). (B) Areas where intersubject pattern correlations between updated recall (RG) and spoiled encoding (MG) were greater than between updated recall (RG) and naive encoding (MD); note that these results were not significant after correction for multiple tests.
Figure 4
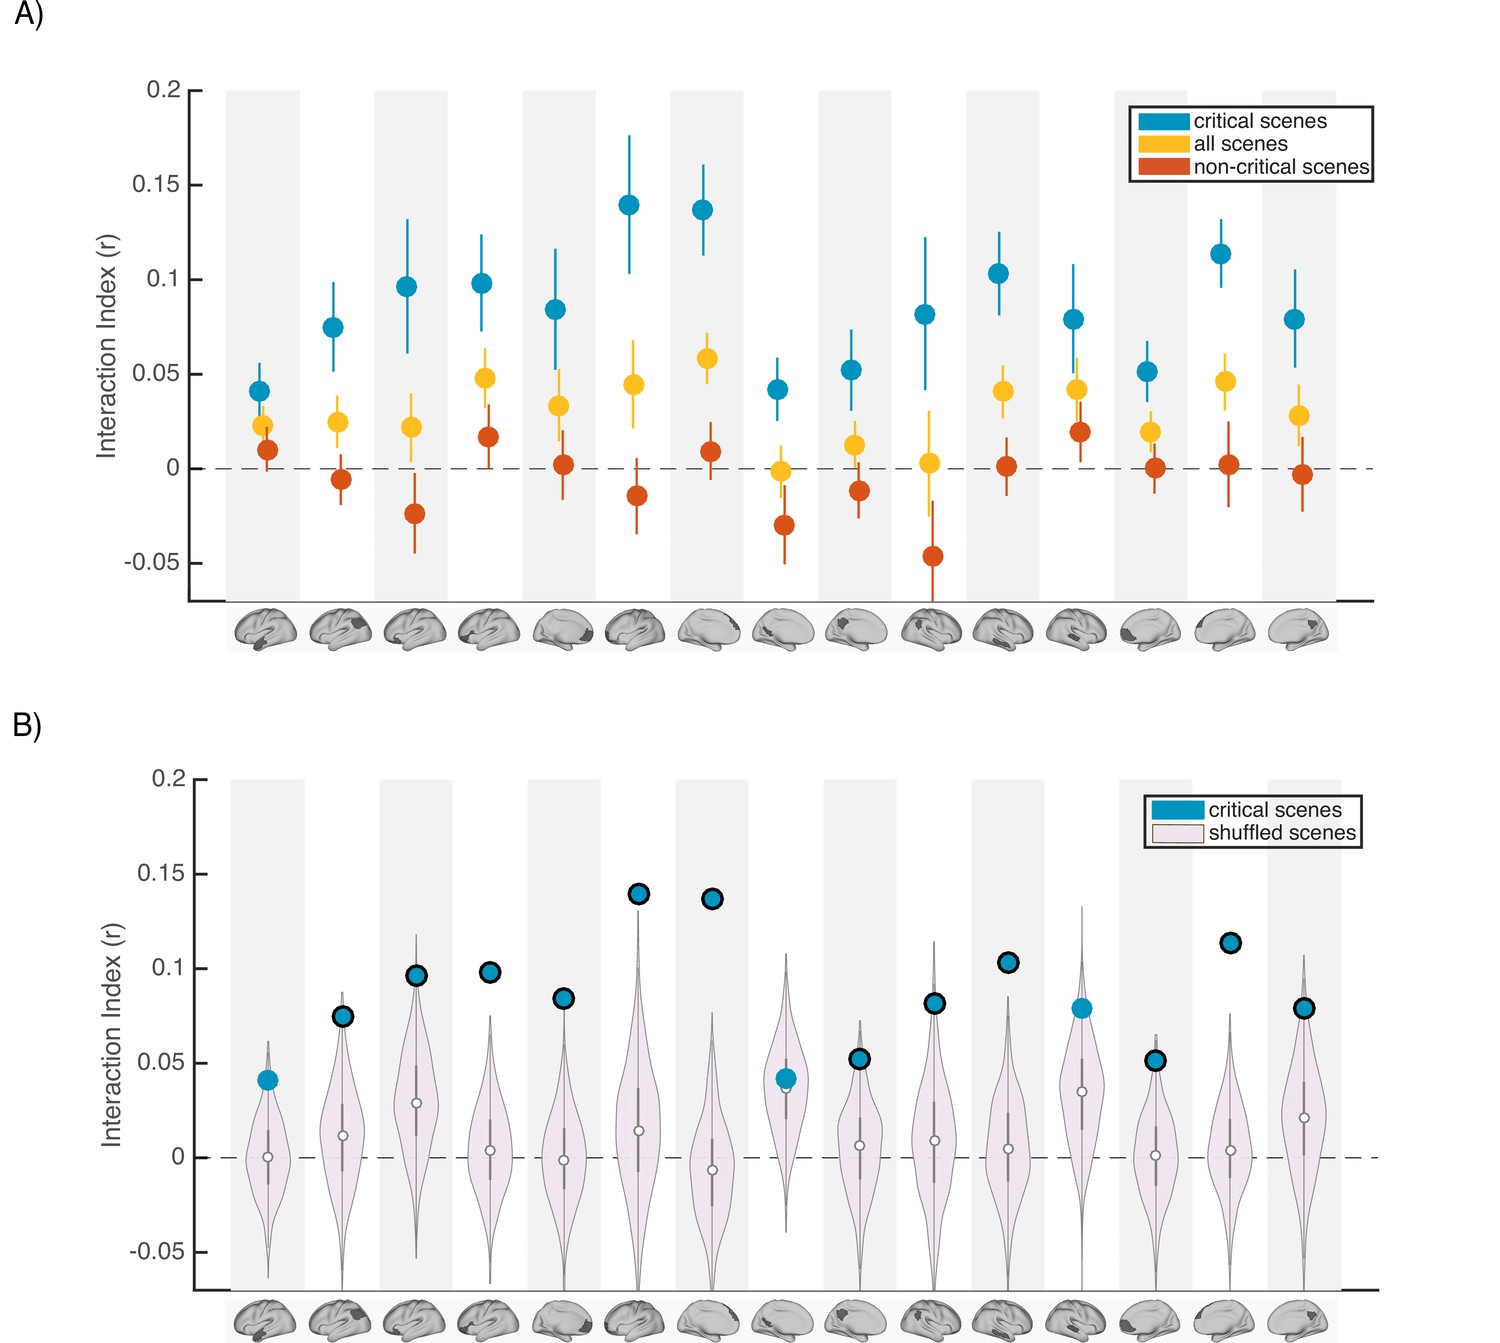
Scence content analyses.
Interaction indices for 15 regions with meaningful results in the original interaction analysis (Figure 2C). Note that the analyses were performed in all 24 DMN regions and this set is selected for visualization, to facilitate comparison with the prior analysis. (A) Interaction indices were computed separately for ‘critical scenes’ (blue dots), ‘non-critical scenes’ (red dots), or all scenes (yellow dots). Error bars depict standard error of mean (N = 19). (B) Light magenta distributions depict interaction values calculated after shuffling critical scene labels 1000 times. Blue dots indicate the actual (non-shuffled) interaction index; blue dots marked with black borders are statistically significant based on the null distribution (FDR controlled at q<0.05).
Appendix 1—figure 1
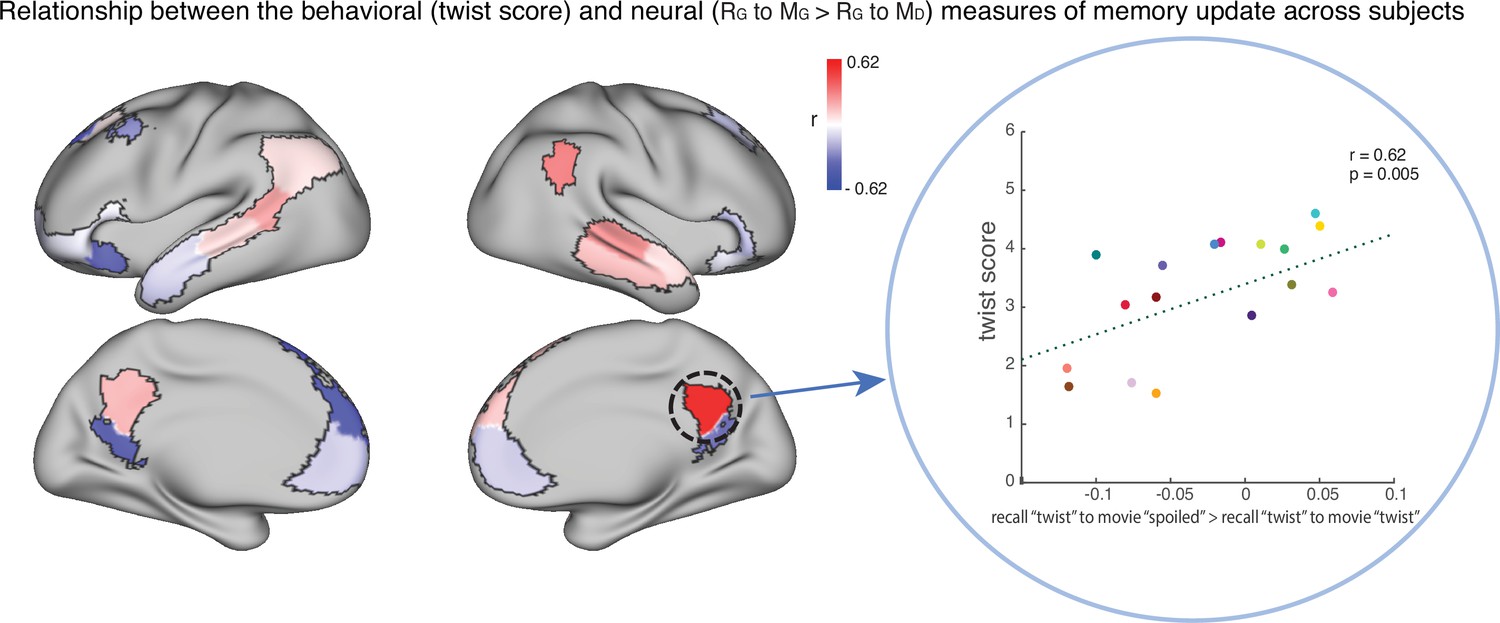
The relationship between the behavioral (twist score) and neural (recall ‘twist’ to movie ‘spoiled’>recall ‘twist’ to movie ‘twist’) measures of memory update in each DMN ROI.
The panel on the right depicts the correlation in the precuneus. Each dot is a participant in the ‘twist’ group (N=19). Note that the example at right was selected post-hoc for high correlation and is not significant after correction for multiple tests.
Appendix 1—figure 2
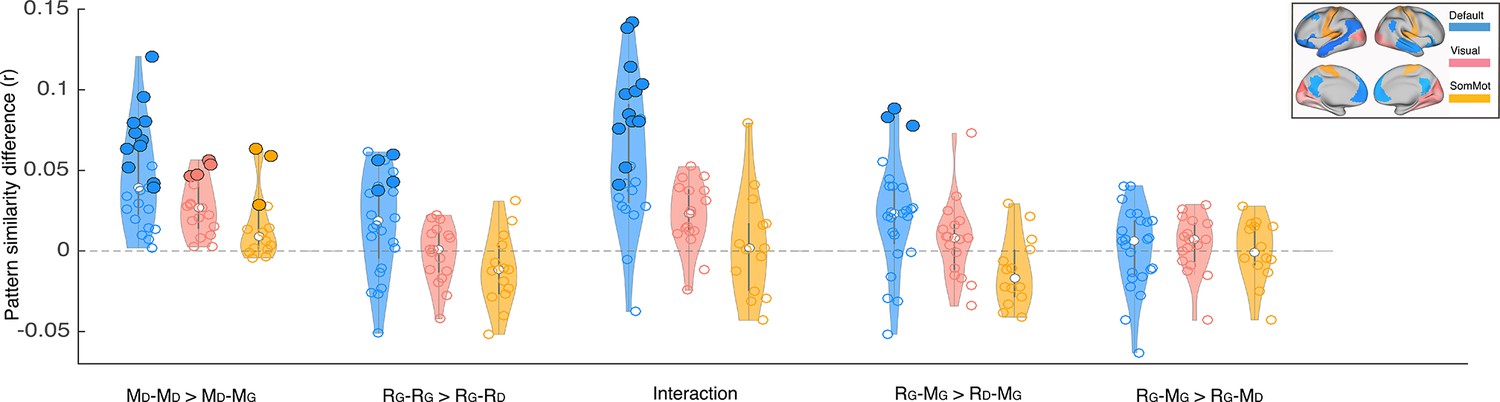
Depiction of pattern similarity differences calculated in the main analyses (Figures 2–3) in three resting state networks.
Blue graphs depict the results in the default mode network. Light red represents the visual network, and yellow shows the somatosensory network. Each dot on the violin graphs shows the effect size in one of the regions on interest in the corresponding network. White dots depict median values. Significance levels have been calculated for each ROI separately (the same as the main analysis). Bold dots depict ROIs with p<0.01 (uncorrected). Labels on x axis: D subscript denotes Doctor interpretation and G subscript denotes Ghost interpretation. MD–MD >MD–MG denotes greater pISC when comparing naive encoding in ‘twist’ group (MD) to naive encoding in ‘no-twist’ group (MD) than when comparing naive encoding in ‘twist’ group (MD) to spoiled encoding in ‘spoiled’ group (MG) (similar comparison as in Figure 2A and Appendix 1—figure 3A). RG–RG >RG–RD denotes greater pISC when comparing recall in ‘twist’ group (RG) to recall in ‘spoiled’ group (RG) than when comparing recall in ‘twist’ group (RG) to naive recall in ‘no-twist’ group (RD) (similar comparison as in Figure 2B and Appendix 1—figure 3B). Interaction corresponds to the same analysis in Figure 2C and Figure Appendix 1—figure 3C. RG–MG >RD–MG denotes greater pISC when comparing updated recall in ‘twist’ group (RG) to spoiled encoding in ‘spoiled’ group (MG) than when comparing naive recalls in ‘no-twist’ group (RD) to spoiled encoding in ‘spoiled’ group (MG) (similar comparison as in Figure 3A and Appendix 1—figure 3D). RG–MG >RG–MD denotes greater pISC when comparing updated recall in ‘twist’ group (RG) and spoiled encoding in spoiled group (MG) than when comparing updated recall in ‘twist’ group (RG) and naive encoding in ‘twist’ group (MD) (similar comparison as in Figure 3B and Appendix 1—figure 3E).
Appendix 1—figure 3

Depiction of the same set of results as in Figure 2 (upper row) and Figure 3 (lower row) in the whole brain (not restricted to DMN).
The maps show ROIs with p<0.01 calculated by nonparametric randomization test without correction (areas missing on these maps compared to the original maps had p values greater than 0.01). (A) Areas with significantly greater intersubject pattern correlation between groups who encoded the movie with the same interpretation (Doctor). (B) Areas with significantly greater intersubject pattern correlation between groups who recalled the movie with the same interpretation (Ghost). (C) Areas with a significant interaction effect, indicating a change in interpretation between encoding and recall (see ‘Pattern similarity analysis’ in Methods). (D) Areas where intersubject pattern correlations are significantly greater when comparing updated recall (RG) to spoiled encoding (MG) than when comparing naive recalls (RD) to spoiled encoding (MG). (E) Areas where intersubject pattern correlations between updated recall (RG) and spoiled encoding (MG) are greater than between updated recall (RG) and naive encoding (MD).
Appendix 1—figure 4
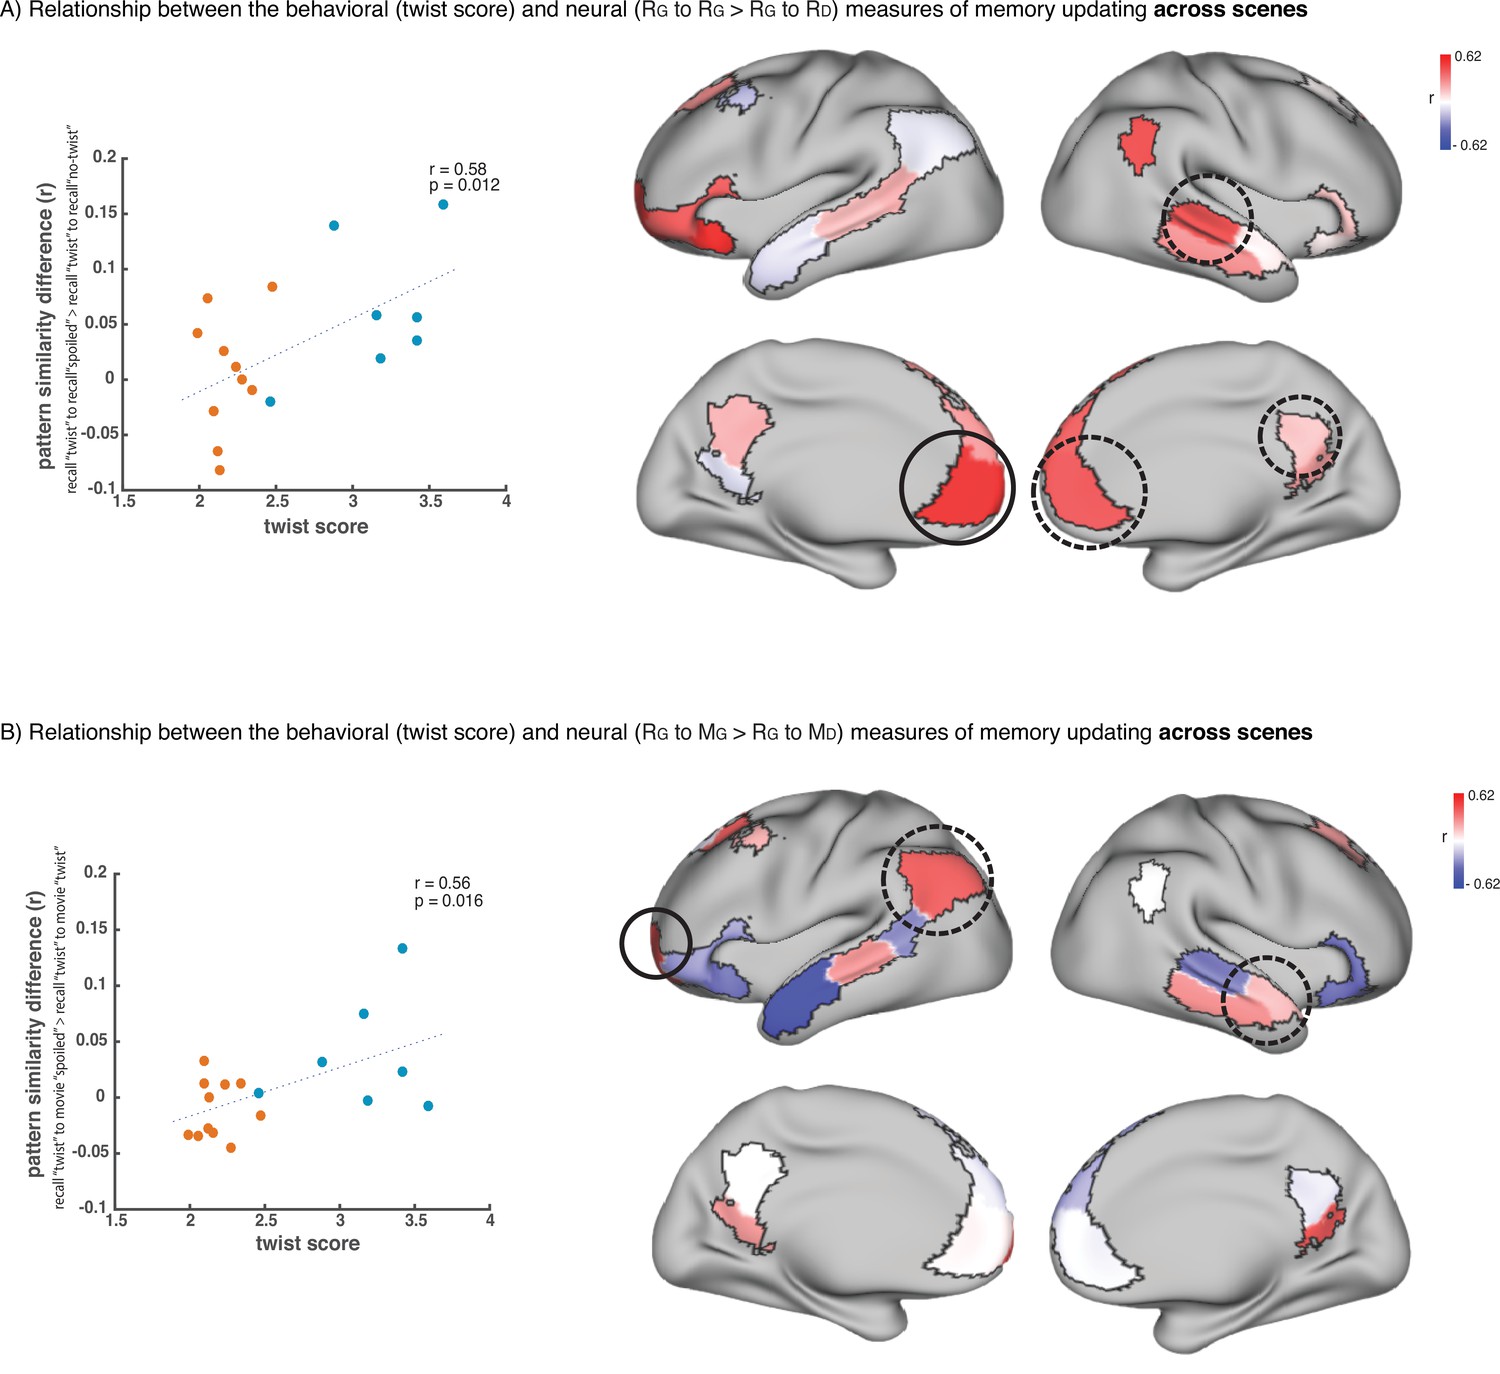
Relationship across scenes between our behavioral measure of memory updating (twist score) and neural measures of memory updating (pISC difference).
(A) shows the results when we operationalize memory updating based on the difference between pISC for recall ‘twist’ to recall ‘spoiled’ and pISC for recall ‘twist’ to recall ‘no-twist’. Correlation values for each DMN region are shown as colors on the map. Red shade indicates higher correlation. Circled areas highlight the regions that showed significant effects in the main recall-recall analysis across subjects (Figure 2B), where pISC for recall ‘twist’ to recall ‘spoiled’ was greater than pISC for recall ‘twist’ to recall ‘no-twist’. The area with the highest correlation among these areas (which is the highest correlation in the entire map as well) is highlighted with a black continuous-line circle. The scatter plot on the left depicts the correlation in this area. ‘Critical scenes’ that were used in the main analyses (Figures 2–3) are shown in blue on the scatter plot. The rest of the scenes are shown in red. Correlation was calculated across all 18 scenes. (B) shows the results when we operationalize memory updating based on the difference between pISC for recall ‘twist’ to movie ‘spoiled’ and pISC for recall ‘twist’ to movie ‘twist’. Circled areas highlight the regions that showed significant effects in the encoding-recall analysis across subjects (Figure 3B), where pISC for recall ‘twist’ to movie ‘spoiled’ was greater than pISC for recall ‘twist’ to movie ‘twist’. The area with the highest correlation among these areas (which is the highest correlation in the entire map as well) is highlighted with a black continuous-line circle. The scatter plot on the left depicts the correlation in this area. ‘Critical scenes’ that were used in the main analyses (Figures 2–3) are shown in blue on the scatter plot. The rest of the scenes are shown in red. Correlation was calculated across all 18 scenes.
Tables
Appendix 1—table 1
The output of condition x group ANOVA in each ROI (each row).
‘Condition’ columns showthe average of the univariate response in each ROI for a given condition. Statistics corresponding to eacheffect are shown in the five right columns. p Values marked as significant (*) did not pass correction formultiple comparison.
| condition: | movie | condition: | recall | no-twist | DFn | DFd | F | p | effect | ||
|---|---|---|---|---|---|---|---|---|---|---|---|
| spoiled | twist | no-twist | spoiled | twist | |||||||
| LH_Default_Temp_1 | –0.02 | –0.025 | –0.038 | 0.188 | 0.106 | 0.117 | 2 | 54 | 1.237 | 0.298 | group |
| 2 | 54 | 0.628 | 0.537 | group x condition | |||||||
| LH_Default_Temp_4 | –0.002 | –0.033 | –0.024 | 0.131 | 0.148 | –0.034 | 2 | 54 | 3.649 | 0.033 * | group |
| 2 | 54 | 3.279 | 0.045 * | group x condition | |||||||
| LH_Default_PFC_1 | –0.005 | –0.005 | –0.024 | 0.106 | 0.067 | 0.054 | 2 | 54 | 0.434 | 0.65 | group |
| 2 | 54 | 0.125 | 0.883 | group x condition | |||||||
| LH_Default_PFC_2 | –0.027 | –0.043 | –0.053 | 0.088 | 0.006 | 0.006 | 2 | 54 | 1.432 | 0.248 | group |
| 2 | 54 | 0.526 | 0.594 | group x condition | |||||||
| LH_Default_PFC_3 | 0.002 | –0.005 | –0.014 | 0.088 | 0.116 | 0.055 | 2 | 54 | 0.5 | 0.609 | group |
| 2 | 54 | 0.237 | 0.789 | group x condition | |||||||
| LH_Default_PFC_4 | 0.002 | –0.02 | –0.02 | 0.031 | 0.034 | –0.008 | 2 | 54 | 0.611 | 0.546 | group |
| 2 | 54 | 0.281 | 0.755 | group x condition | |||||||
| LH_Default_PFC_5 | –0.011 | –0.03 | –0.033 | 0.138 | 0.09 | 0.056 | 2 | 54 | 0.97 | 0.385 | group |
| 2 | 54 | 0.318 | 0.728 | group x condition | |||||||
| LH_Default_PCC_1 | 0.018 | 0.015 | 0.013 | 0.21 | 0.201 | 0.153 | 2 | 54 | 0.381 | 0.684 | group |
| 2 | 54 | 0.26 | 0.771 | group x condition | |||||||
| LH_Default_PCC_2 | 0.008 | –0.017 | –0.005 | 0.178 | 0.163 | 0.023 | 2 | 54 | 2.231 | 0.117 | group |
| 2 | 54 | 2.013 | 0.143 | group x condition | |||||||
| RH_Default_Par_1 | 0.037 | 0.025 | 0.013 | 0.172 | 0.252 | 0.043 | 2 | 54 | 3.151 | 0.0507~ | group |
| 2 | 54 | 2.373 | 0.102 | group x condition | |||||||
| RH_Default_Temp_1 | –0.001 | –0.024 | –0.025 | 0.135 | 0.13 | 0.078 | 2 | 54 | 0.76 | 0.472 | group |
| 2 | 54 | 0.249 | 0.78 | group x condition | |||||||
| RH_Default_Temp_3 | –0.014 | –0.024 | –0.026 | 0.242 | 0.239 | 0.188 | 2 | 54 | 0.374 | 0.689 | group |
| 2 | 54 | 0.184 | 0.831 | group x condition | |||||||
| RH_Default_PFCm_1 | 0.006 | 0.003 | –0.005 | 0.102 | 0.126 | 0.067 | 2 | 54 | 0.437 | 0.648 | group |
| 2 | 54 | 0.214 | 0.807 | group x condition | |||||||
| RH_Default_PFCm_2 | 0.009 | –0.004 | –0.014 | 0.138 | 0.12 | 0.074 | 2 | 54 | 0.693 | 0.504 | group |
| 2 | 54 | 0.169 | 0.844 | group x condition | |||||||
| RH_Default_PCC_2 | 0.031 | 0.005 | 0.005 | 0.219 | 0.214 | 0.073 | 2 | 54 | 2.41 | 0.099 | group |
| 2 | 54 | 1.579 | 0.215 | group x condition | |||||||
Additional files
Download links
A two-part list of links to download the article, or parts of the article, in various formats.
Downloads (link to download the article as PDF)
Open citations (links to open the citations from this article in various online reference manager services)
Cite this article (links to download the citations from this article in formats compatible with various reference manager tools)
Neural representations of naturalistic events are updated as our understanding of the past changes
eLife 11:e79045.
https://doi.org/10.7554/eLife.79045


