Cell detoxification of secondary metabolites by P4-ATPase-mediated vesicle transport
- Biotechnology Research Center, Southwest University, China
- Department of Microbiology and Cell Science, Institute of Food and Agricultural Sciences, University of Florida, United States
Figures
Figure 1 with 3 supplements
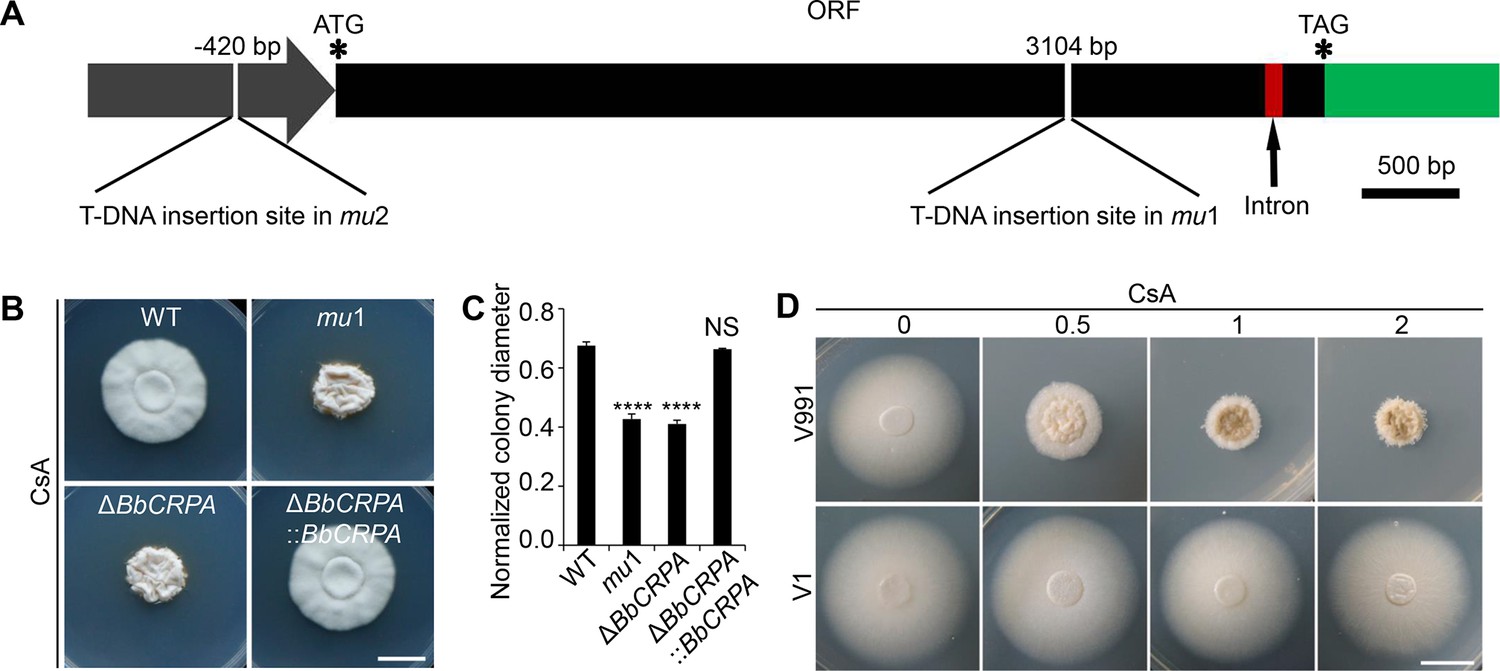
BbCrpa confers the resistance of Beauveria bassiana and Verticillium dahliae to CsA.
(A) Schematic diagram of T-DNA insertion in mu1 and mu2. The two T-DNA insertions took place in same gene at different regions: in mu1, the insertion site located in the coding region (3104 bp); in mu2, the site was in the promoter region (–420 bp). The gene codes for a putative phospholipid-translocating P-type ATPase (P4-ATPase), named BbCrpa (cyclosporine resistance P4-ATPase) that has a 4080 bp ORF and an intron (73 bp) near its 3′ end. (B and C) Disruption of BbCRPA makes B. bassiana sensitive to CsA. The wild-type, mu1, BbCRPA gene-knockout (ΔBbCRPA), and complemented (ΔBbCRPA::BbCRPA) strains were grown on CZP +CsA (20 μg/ml). (D) Ectopic expression of BbCRPA in V. dahliae increases the resistance of CsA. Wild-type V. dahliae (V991) and V1 (expressing BbCRPA in V. dahliae V991) were grown on PDA and PDA +CsA (0.5 μg/ml, 1 μg/ml, and 2 μg/ml). For CsA sensitivity analysis, plates were spot inoculated with 3 μl conidial suspensions (1×10⁷ conidia/ml) and incubated at 26℃ for about 10 days. The variation in growth rates was shown as [colony diameter CZP supplemented with CsA]/[colony diameter CZP]. All experiments were performed in triplicate (n = 3). Data are represented as the mean ± SD. ****p<0.0001 from Student′s t-test. NS, not significant. Scale bars, 1 cm for (B and D).
-
Figure 1—source data 1
Growth of the target strains on CZP supplemented with CsA normalized to growth on CZP.
The variation in growth rates was shown as [colony diameter CZP supplemented with CsA]/[colony diameter CZP]. All experiments were performed in triplicate. Data are represented as the mean ± SD. ****p<0.0001 from Student′s t-test. File for the primary data corresponding to Figure 1C.
- https://cdn.elifesciences.org/articles/79179/elife-79179-fig1-data1-v1.xlsx
Figure 1—figure supplement 1
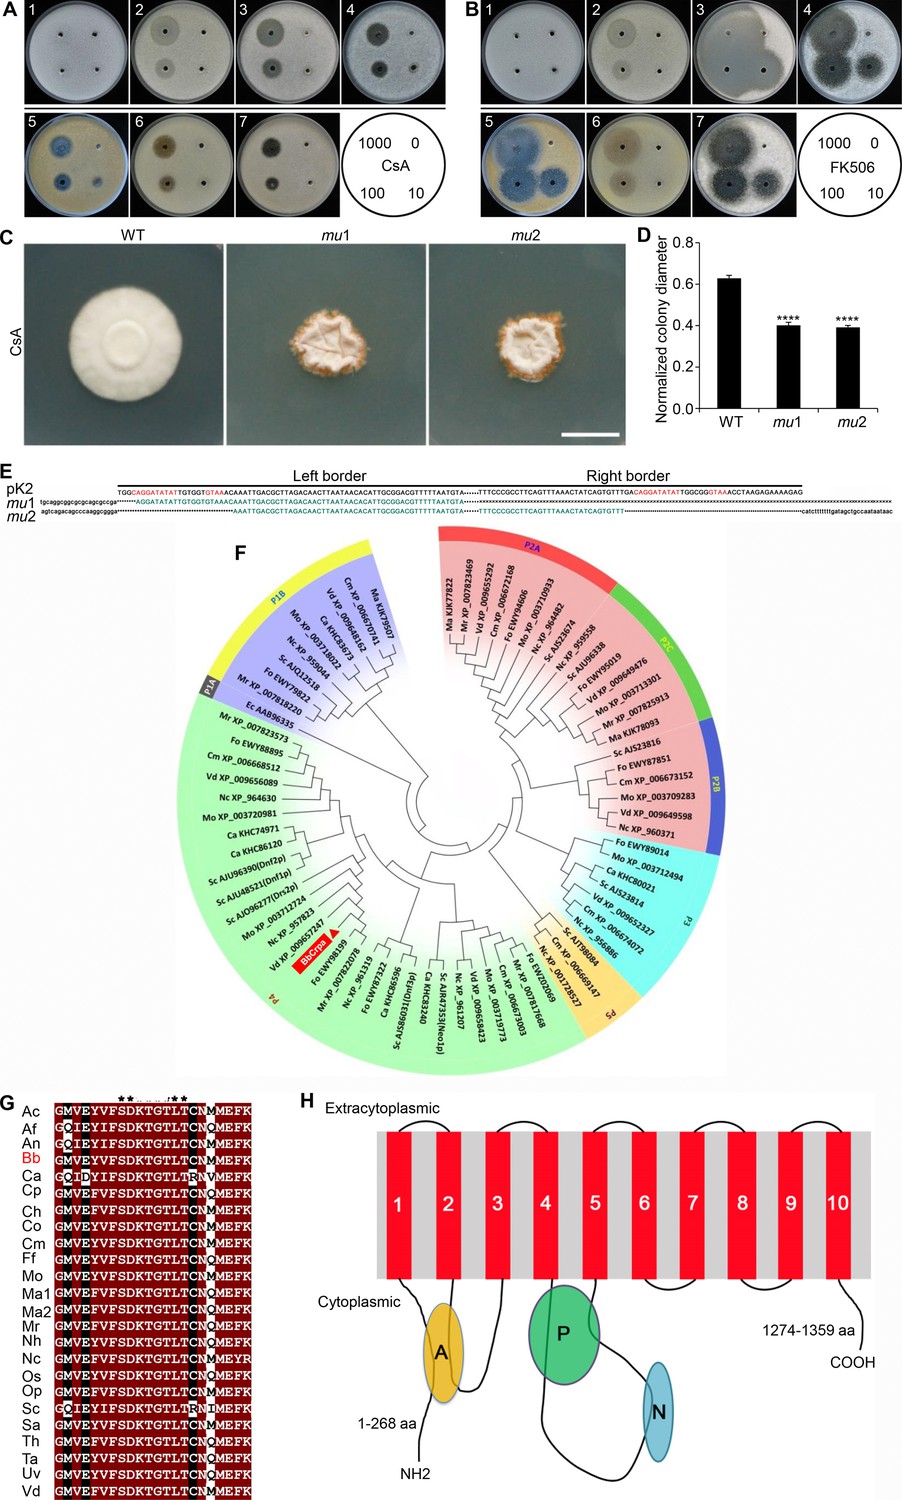
B. bassiana shows resistance to CsA and FK506 and identification of CsA-sensitivity mutants, mu1 and mu2.
(A and B). B. bassiana shows resistance to CsA (A) and FK506 (B), while some other filamentous fungi tested show sensitivity to them. 1, B. bassiana; 2, Metarhizium anisopliae; 3, Botrytis cinerea; 4, Alternaria brassicae; 5, Alternaria brassicicola; 6, Aspergillus nidulans; 7, Alternaria solani. CsA/FK506 was diluted with dimethyl sulfoxide (DMSO) in the concentrations of 1000 μg/ml, 100 μg/ml, 10 μg/ml, 0 μg/ml. Petri-dishes (90 mm) containing PDA (20 ml) mixed with 100 μl conidial suspensions (1×10⁷ conidia/ml in 0.05% Tween-80) were incubated at 26℃ for 4–7 days. Each hole (5 mm diameter) was filled with 5 μl different concentrations of CsA/FK506. All inhibition assays were performed thrice. (C and D) mu1 and mu2 show sensitivity to CsA. The wild-type, mu1, and mu2 strains were grown on CZP +CsA (20 μg/ml). Plates were spot inoculated with 3 μl conidial suspensions (1×10⁷ conidia/ml) and incubated at 26℃ for about 10 days. The variation in growth rates were shown as [colony diameter CZP supplemented with CsA]/[colony diameter CZP]. All experiments were performed in triplicate (n = 3). Scale bar, 1 cm. Data are represented as the mean ± SD. ****p<0.0001 from Student′s t-test. (E) Sequencing of the T-DNA insertion junctions in CsA-sensitive mutant mu1 and mu2. The top line shows the left and the right border sequences of T-DNA from plasmid vector pK2, respectively; the red uppercase letters denote nucleotides of T-DNA border conserved sequences; the green uppercase letters denote overlapping sequences; flanking genomic sequences are indicated by lowercase letters; ‘…’ denotes Bar::Gus element in T-DNA, ‘*’ denotes the T-DNA border imperfect sequences; sequence data for mu1 (right border) was not obtained, and is indicated by ‘×’. (F) Cluster analysis indicates that BbCrpa belongs to P-type ATPase superfamily of P4 branch (P4-ATPases). BbCrpa orthologues were aligned with CLUSTALW (MEGA5.2) based on its amino acid sequences. Ca, Candida albicans; Cm, Cordyceps militaris; Ec, Escherichia coli; Fo, Fusarium oxysporum; Ma, Metarhizium anisopliae; Mo, Magnaporthe oryzae; Mr, Metarhizium robertsii; Nc, Neurospora crassa; Sc, Saccharomyces cerevisiae; Vd, Verticillium dahliae. (G) The phosphorylated Asp in BbCrpa (red) is situated in the conserved sequence DKTG as other P4-ATPases. Aa, Acremonium chrysogenum; Af, Aspergillus fumigatus; An, Aspergillus nidulans; Bb, Beauveria bassiana; Ca, Candida albicans; Cp, Claviceps purpurea; Ch, Colletotrichum higginsianum; Co, Colletotrichum orbiculare; Cm, Cordyceps militaris; Ff, Fusarium fujikuroi; Mo, Magnaporthe oryzae; Ma1, Metarhizium acridum; Ma2, Metarhizium anisopliae; Mr, Metarhizium robertsii; Nh, Nectria haematococca; Nc, Neurospora crassa; Os, Ophiocordyceps sinensis; Op, Ophiostoma piceae; Sc, Saccharomyces cerevisiae; Sa, Scedosporium apiospermum; Th, Torrubiella hemipterigena; Ta, Trichoderma atroviride; Uv, Ustilaginoidea virens; Vd, Verticillium dahliae. (H) Predicted topological model of BbCrpa. The topological map was forecasted by https://embnet.vital-it.ch/software/TMPRED_form.html and https://services.healthtech.dtu.dk/service.php?TMHMM-2.0. BbCrpa consists of 10 transmembrane-spanning segments. A-domain, actuator domain; P-domain, phosphorylation domain; N-domain, nucleotide binding domain; aa, amino acid.
-
Figure 1—figure supplement 1—source data 1
Growth of wild-type stran, mu1 and mu2 at CZP supplemented with CsA normalized to growth at CZP.
The variation in growth rates were shown as [colony diameter CZP supplemented with CsA]/[colony diameter CZP]. All experiments were performed in triplicate. Data are represented as the mean ± SD. ****p<0.0001 from Student′s t-test. File for the primary data corresponding to Figure 1—figure supplement 1D.
- https://cdn.elifesciences.org/articles/79179/elife-79179-fig1-figsupp1-data1-v1.xlsx
Figure 1—figure supplement 2
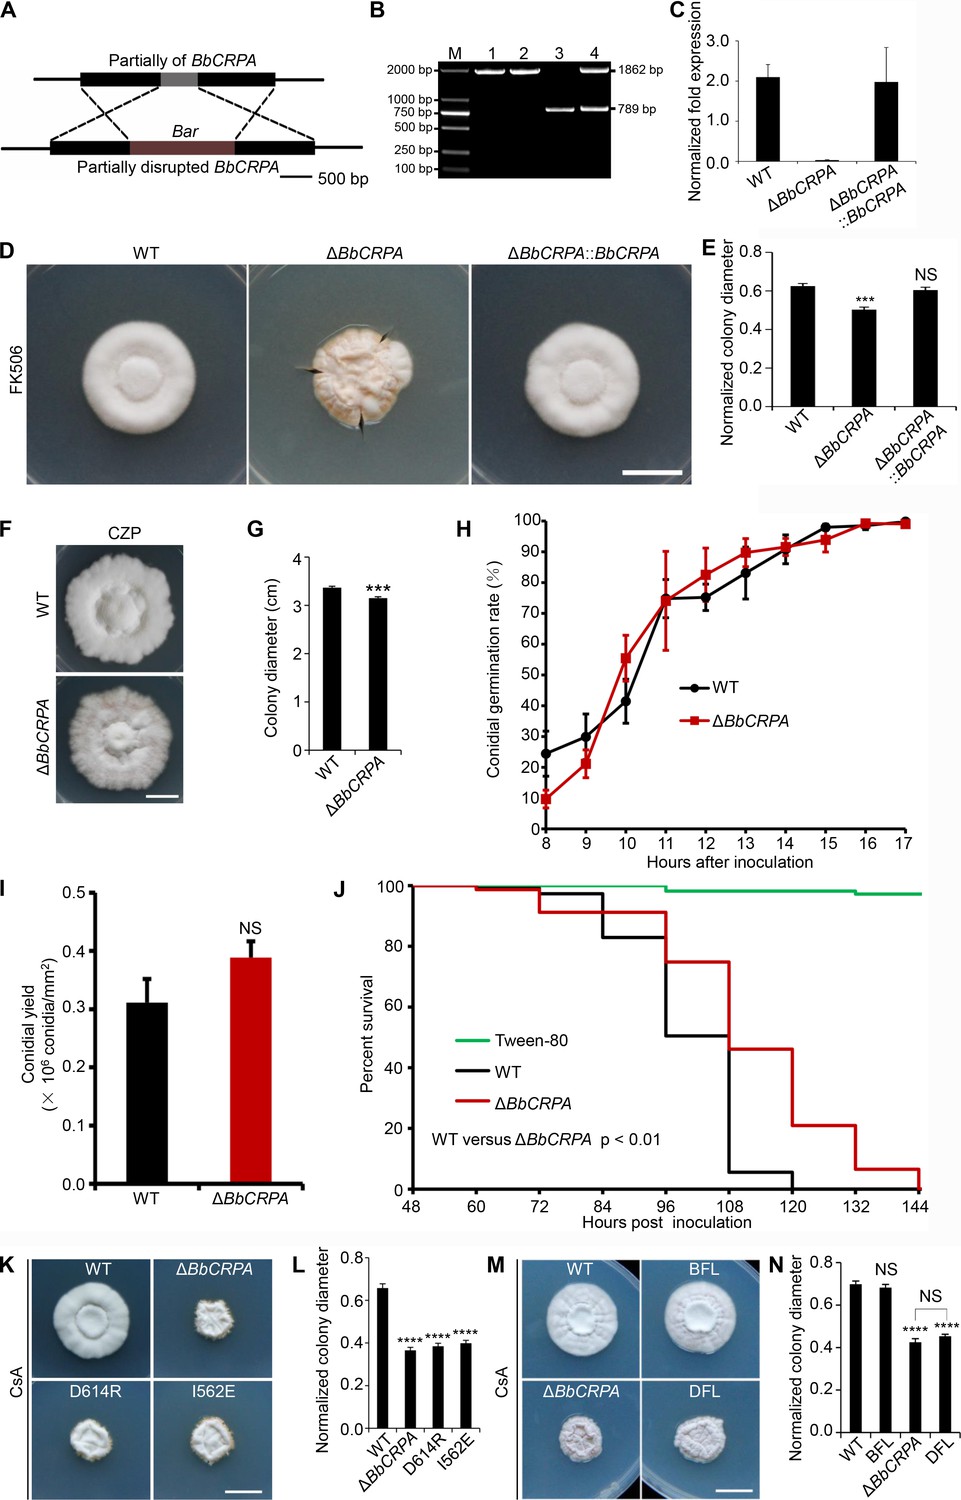
Construction and Identification of BbCRPA disruption strain.
(A) Schematic model of construction for BbCRPA gene replacement vector. (B) PCR analysis of BbCRPA disruption mutant (M, DNA Marker DL2000; 1, PCR product of plasmid vector; 2, PCR product of BbCRPA disruption mutant (ΔBbCRPA); 3, PCR product of wide-type B.bassiana (WT); 4, PCR product of heterologous recombinant mutant). (C) The expression level of BbCRPA in the wild-type, ΔBbCRPA and the complementary strain (ΔBbCRPA::BbCRPA). All experiments were performed in triplicate (n = 3). Data are represented as the mean ± SD. (D and E) Disruption of BbCRPA makes B. bassiana sensitive to FK506. (F and G) Disruption of BbCRPA renders growth defect of B. bassiana. All experiments were performed in triplicate (n = 3). Data are represented as the mean ± SD. ***p<0.001 from Student′s t-test. (H) Knock out BbCRPA has no significant effect on the conidial germination rate of B.bassiana. Conidial germination was monitored via microscopic analysis. Conidia were considered germinated when the germ tube was equal in length to the half diameter of the conidia. About 300 conidia were examined for the wide-type and ΔBbCRPA. All experiments were performed in triplicate (n = 3) on CZP medium. Data are represented as the mean ± SD. (I) Loss of BbCRPA has no significant effect on the conidial yield of B.bassiana. Conidia of the fungal strains on CZA medium were harvested after 14 days at 26℃. All experiments were performed in triplicate (n = 3). Data are represented as the mean ± SD. Student′s t-test. NS, not significant. (J) Knock out BbCRPA reduces the virulence of B.bassiana. Survival of Galleria mellonella larvae treated with suspensions (2×10⁷ conidia/ml in 0.05% tween-80) derived from the wild-type, BbCRPA disruption mutant. Control was treated with tween-80 alone. Survival curves were plotted by using the Kaplan-Meier method and a log rank-test was used to analyse the difference between ΔBbCRPA and the wild-type. (K and L) Converting Ile to Glu at the site of 562 and Asp to Arg at the site of 614 both disrupt the function of BbCrpa. (M and N) Expression DRS2 in ΔBbCRPA was unable to recover the resistance of B. bassiana to CsA. For CsA/FK506 sensitivity analysis, plates were spot inoculated with 3 μl conidial suspensions (1×10⁷ conidia/ml) and incubated at 26℃ for about 10 days. The variation in growth rates were shown as [colony diameter CZP supplemented with CsA]/[colony diameter CZP]. All experiments were performed in triplicate (n = 3). Scale bars, 1 cm for (D, F, K, and M). Data are represented as the mean ± SD. ***p<0.001, ****p<0.0001 from Student′s t-test. NS, not significant.
-
Figure 1—figure supplement 2—source data 1
qRT-PCR experiments, conidial yield, and growth of target strains at CZP supplemented with CsA normalized to growth at CZP.
For CsA/FK506 sensitivity analysis, the variation in growth rates were shown as [colony diameter CZP supplemented with CsA]/[colony diameter CZP]. All experiments were performed in triplicate. Data are represented as the mean ± SD. ***p<0.001, ****p<0.0001 from Student′s t-test. File for the primary data corresponding to Figure 1—figure supplement 2C, E and G, I, L, N.
- https://cdn.elifesciences.org/articles/79179/elife-79179-fig1-figsupp2-data1-v1.xlsx
-
Figure 1—figure supplement 2—source data 2
PCR analysis of BbCRPA disruption mutant.
M, DNA Marker DL2000; 1, PCR product of plasmid vector; 2, PCR product of BbCRPA disruption mutant (ΔBbCRPA); 3, PCR product of wide-type B.bassiana (WT); 4, PCR product of heterologous recombinant mutant. File for the primary data corresponding to Figure 1—figure supplement 2B.
- https://cdn.elifesciences.org/articles/79179/elife-79179-fig1-figsupp2-data2-v1.zip
Figure 1—figure supplement 3
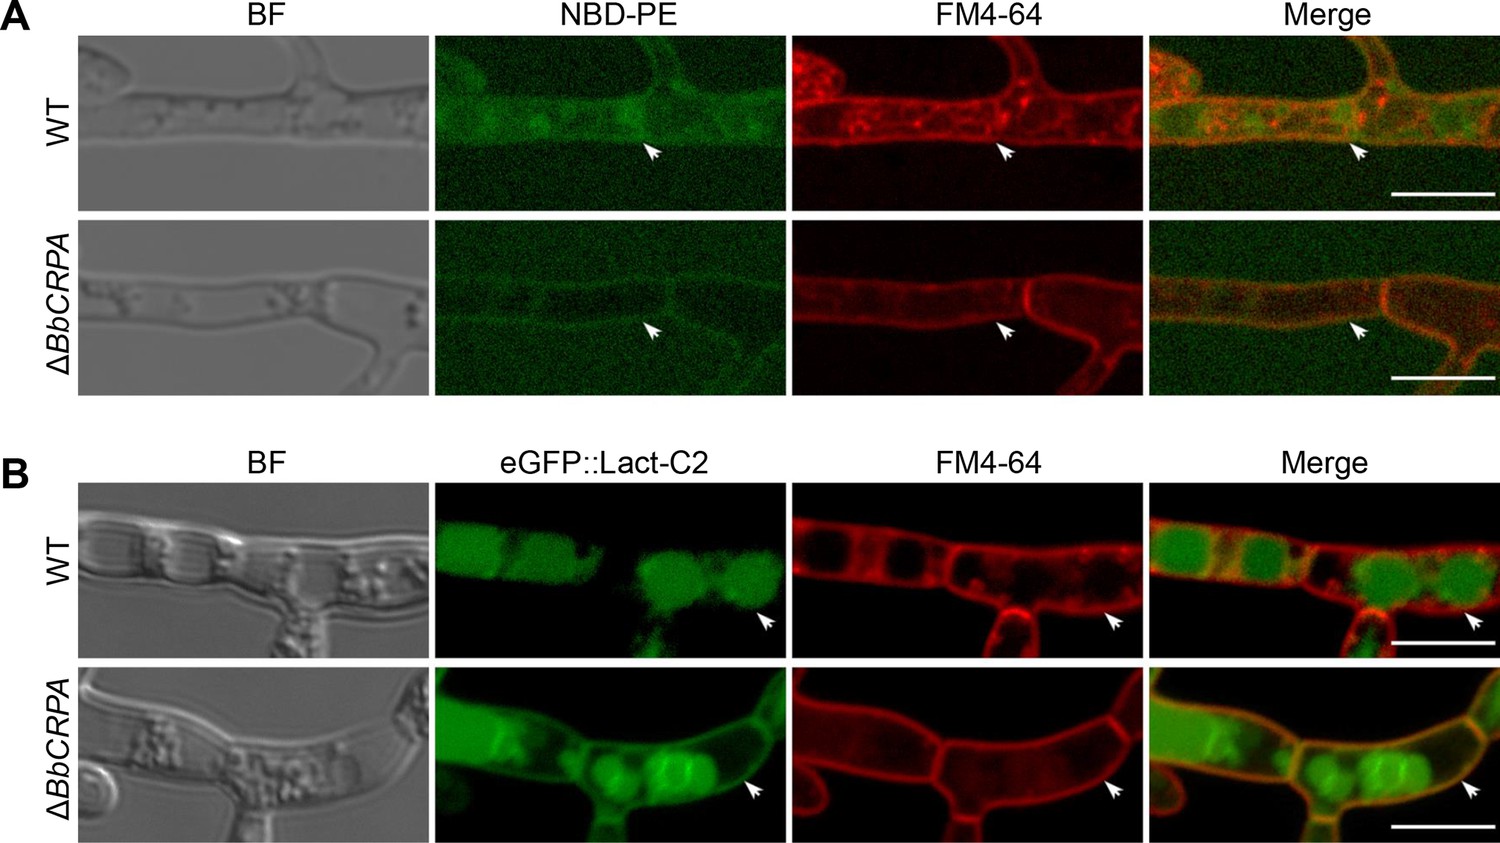
Distribution of phosphatidylserine (PS) and phosphatidylethanolamine (PE) in the wild-type and ΔBbCRPA.
B. bassiana hyphae were treated with 40 μM NBD-PE for 3 hr at 26℃. PS was indicated by eGFP::Lact-C2. Scale bars, 5 μm.
Figure 2 with 2 supplements
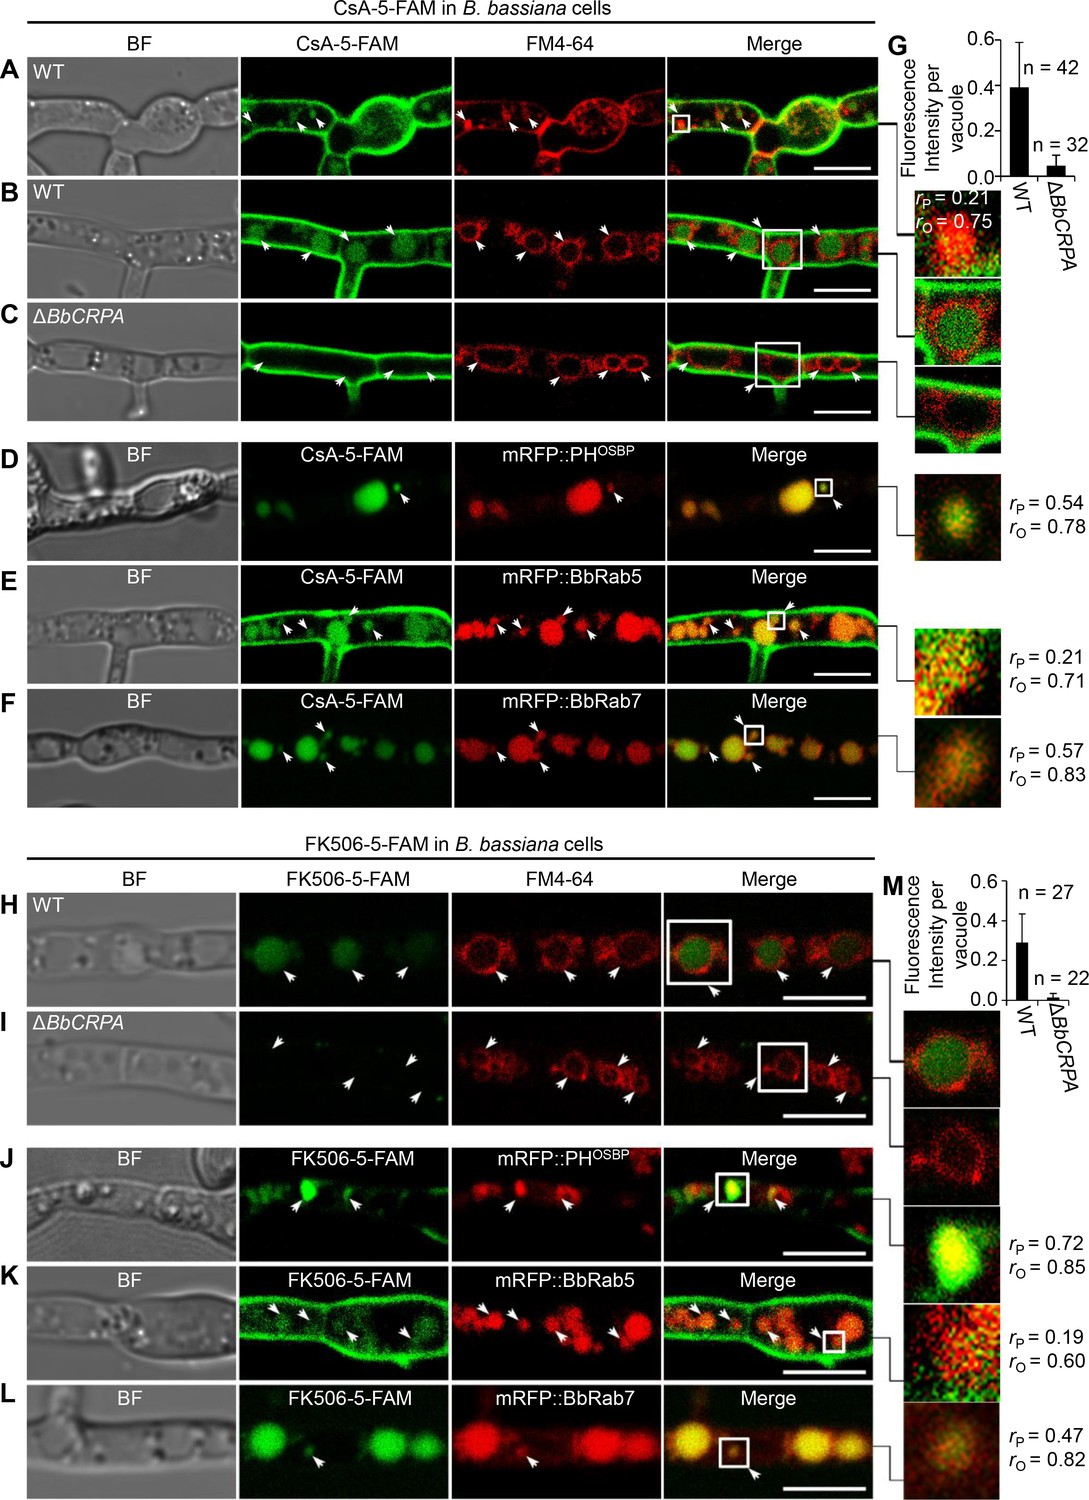
Distribution of fluorescein-labeled CsA and FK506 in the wild-type and ΔBbCRPA cells.
(A–G) Distribution of fluorescein-labeled CsA. In the wild-type cells, fluorescein-labeled CsA (CsA-5-FAM) appeared in vesicles/endosomes (arrows, stained by FM4-64) (A), TGN (arrows, marked by mRFP::PHOSBP) (D), EEs (arrows, marked by mRFP::BbRab5) (E), and LEs (arrows, marked by mRFP::BbRab7) (F), and accumulated in vacuoles (arrows, stained by FM4-64) (B); while in ΔBbCRPA cells, the fluorescein signal was nearly undetectable in the vacuoles (arrows) (C). The fluorescent intensity within the wild-type (B) and ΔBbCRPA (C) cells was measured by ImageJ (G). (H–M) Distribution of fluorescein-labeled FK506. In the wild-type cells, FK506-5-FAM appeared in TGN (J, arrows), EEs (K, arrows), and LEs (L, arrows), and accumulated in vacuoles (H, arrows); while in ΔBbCRPA cells, the fluorescein signal was nearly undetectable in the vacuoles (I, arrows). The fluorescent intensity within the wide-type and ΔBbCRPA cells was measured by ImageJ (M). The value of Pearson (rP) and Overlap (rO) correlation coefficient shows the extent of colocalization between the two target molecules. The values range between +1 (positive correlation) and –1 (negative correlation). Data are represented as the mean ± SD for (G and M). Scale bars, 5 μm for (A–F, H–L).
-
Figure 2—source data 1
CsA-5-FAM/FK506-5-FAM fluorescent intensity within the wild-type and ΔBbCRPA cells.
The fluorescent intensity was measured by ImageJ. Corrected IntDen (integrated density)=IntDen Area×Mean (background). File for the primary data corresponding to Figure 2G and M.
- https://cdn.elifesciences.org/articles/79179/elife-79179-fig2-data1-v1.xlsx
Figure 2—figure supplement 1
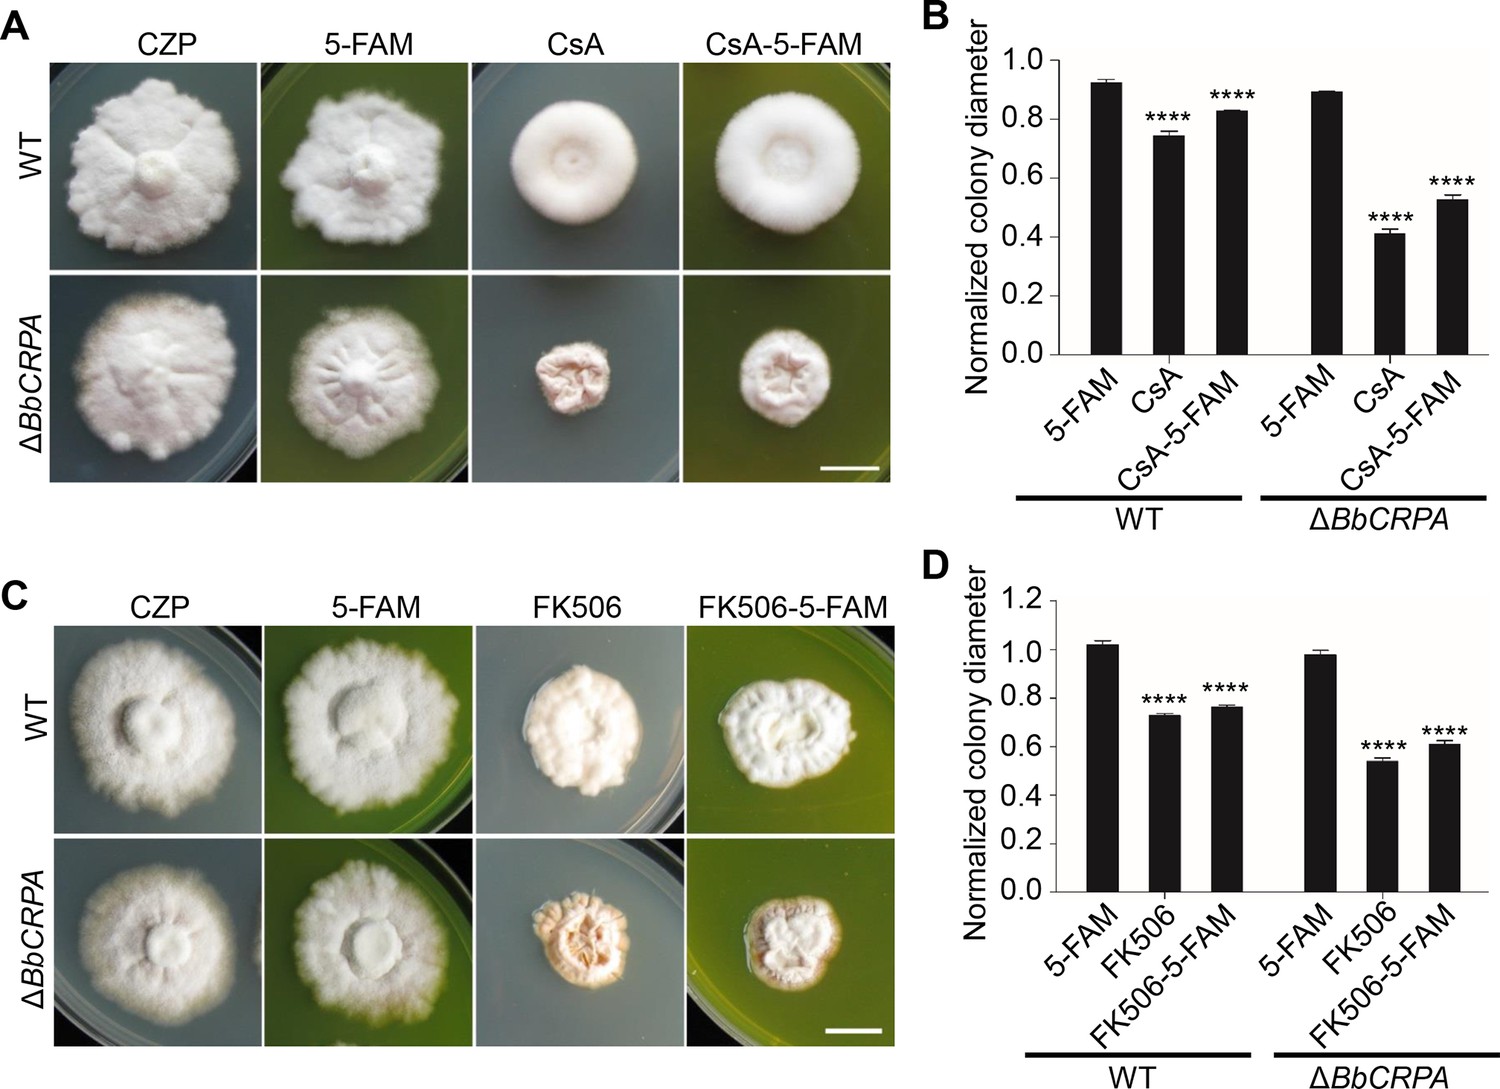
Fluorescent-labeled CsA and FK506 maintain their toxic activity.
(A and B) The fluorescein-labeled CsA (CsA-5-FAM) maintains biological activity. The wild-type and ΔBbCRPA strains were grown on CZP, CZP +5 FAM (32.7 μM), CZP +CsA (32.7 μM), CZP +CsA-5-FAM (32.7 μM). (C and D) The fluorescein-labeled FK506 (FK506-5-FAM) maintains biological activity. The wild-type and ΔBbCRPA strains were grown on CZP, CZP +5 FAM (42.4 μM), CZP +FK506 (42.4 μM), CZP +FK506-5 FAM (42.4 μM). For CsA-5-FAM/FK506-5-FAM sensitivity analysis, plates were spot inoculated with 3 μl conidial suspensions (1×10⁷ conidia/ml) and incubated at 26℃ for about 10 days. Different strains showed variation in growth rates and the data were shown as [colony diameter CZP supplemented with CsA/FK506/5-FAM/CsA-5-FAM/FK506-5-FAM]/[colony diameter CZP]. Scale bars, 1 cm for (A and C). All experiments were performed in triplicate (n = 3). Data are represented as the mean ± SD. ****p<0.0001 from Student′s t-test.
-
Figure 2—figure supplement 1—source data 1
Growth of the target strains at CZP supplemented with 5-FAM/CsA/FK506/CsA-5-FAM/FK506-5-FAM normalized to growth at CZP.
Different fungal strains exhited variation in growth rates which were shown as [colony diameter CZP supplemented with CsA/FK506/5-FAM/CsA-5-FAM/FK506-5-FAM]/[colony diameter CZP]. Data are represented as the mean ± SD. ****p<0.0001 from Student′s t-test. File for the primary data corresponding to Figure 2—figure supplement 1B and D.
- https://cdn.elifesciences.org/articles/79179/elife-79179-fig2-figsupp1-data1-v1.xlsx
Figure 2—figure supplement 2
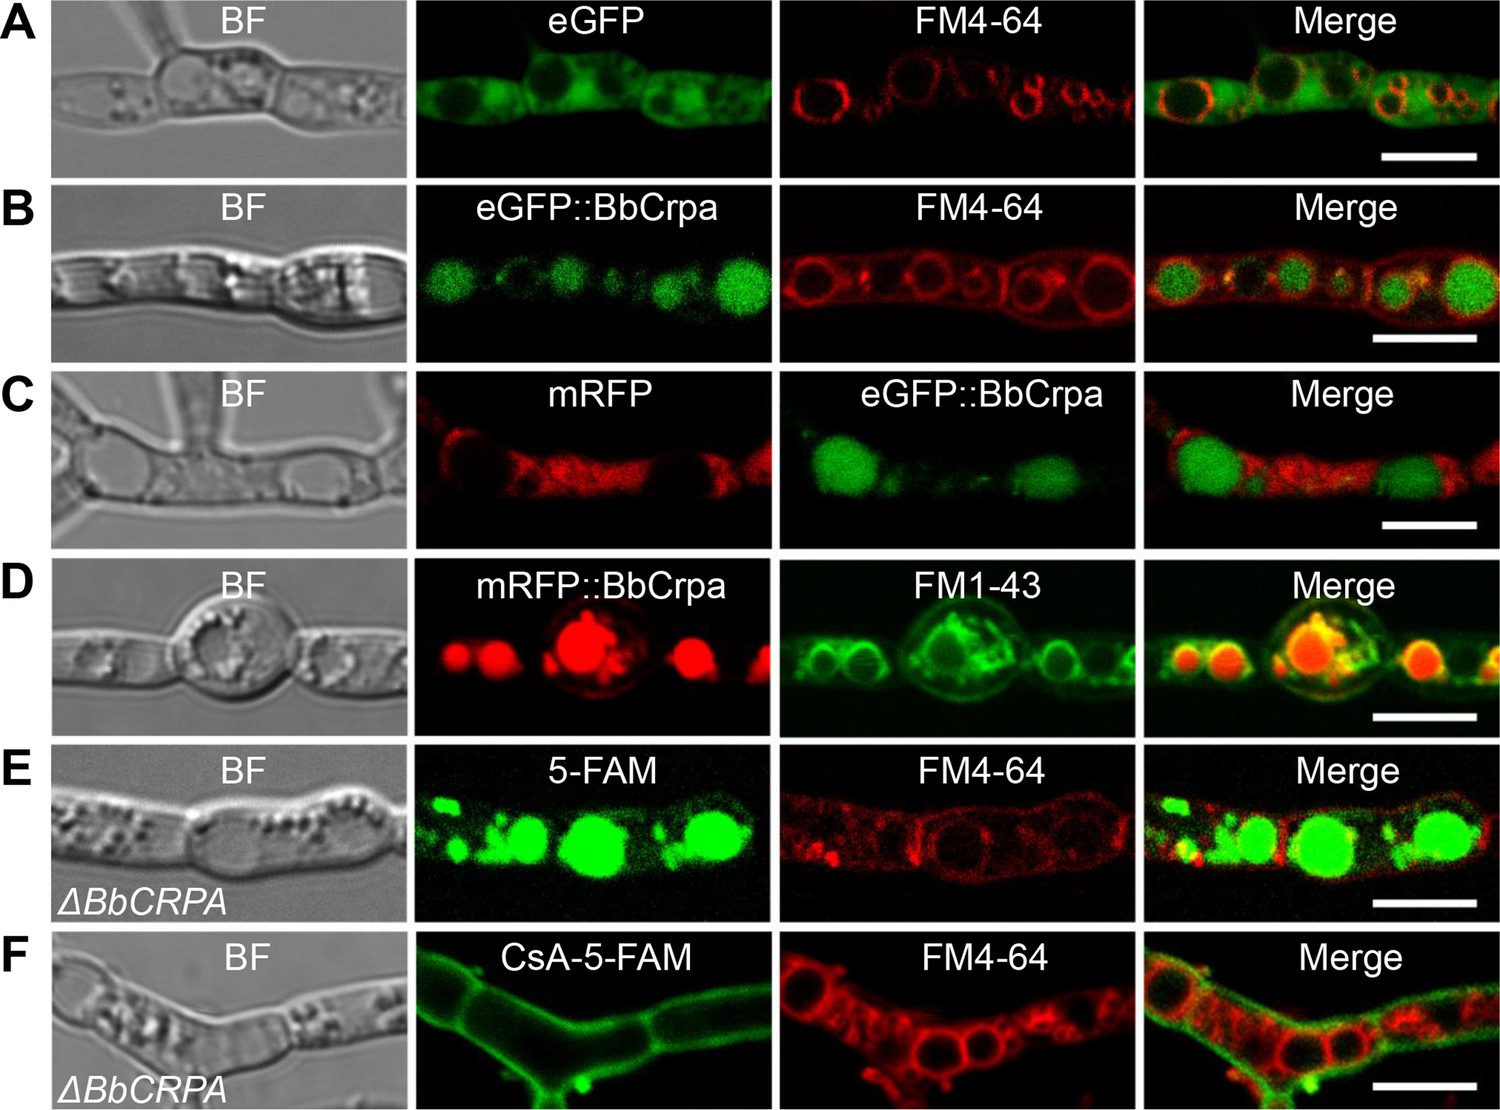
Distribution comparison of eGFP/MRFP and 5-FAM alone with that of eGFP/mRFP::BbCrpa and CsA-5-FAM.
(A) eGFP fluorescence was observed in the cytosol of B. bassiana cells, while almost no significant signal was observed in vacuoles. (B) eGFP::BbCrpa was accumulated in vacuoles. (C) mRFP fluorescence was observed in the cytosol of the cells, while almost no significant signal was observed in vacuoles. (D) mRFP::BbCrpa was accumulated in vacuoles. (E and F) Distribution of 5-FAM and CsA-5-FAM in ΔBbCRPA cells. Stong fluorescence of 5-FAM was observed in vacuoles, while almost no significant signal was observed in the cytosol and vacuoles in the ΔBbCRPA cells. Vacuoles were indicated by FM4-64 or FM1-43. Scale bars, 5 μm.
Figure 3 with 4 supplements
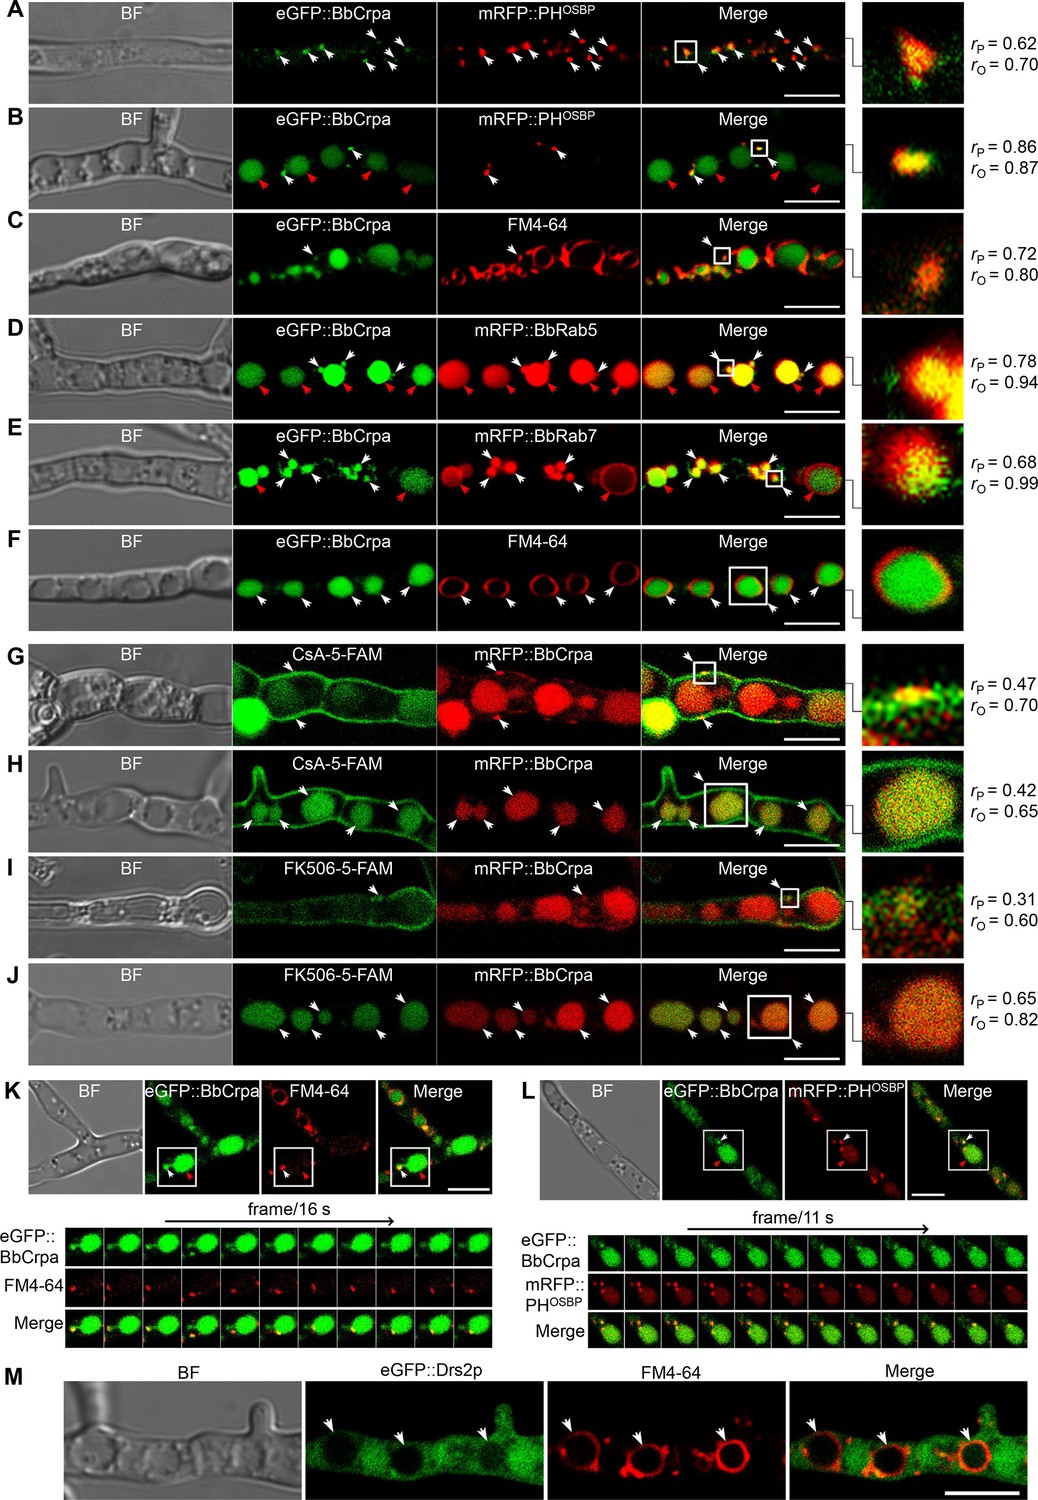
Subcellular localization and dynamic trafficking of BbCrpa.
(A and B) eGFP::BbCrpa colocalizes with mRFP::PHOSBP at TGN (white arrows) and accumulates in vacuoles (red arrows, see also that in (F, white arrows)). (C) eGFP::BbCrpa accumulates in vesicle (white arrows) that was stained by FM4-64. (D) eGFP::BbCrpa colocalizes with mRFP::BbRab5 in (EEs, white arrows) and then accumulates in vacuoles (red arrows, also see in (F, white arrows)). (E) eGFP::BbCrpa colocalizes with mRFP::BbRab7 in LEs (white arrows) and vacuoles (red arrows). (F) eGFP::BbCrpa accumulates in mature vacuoles (arrows) which were stained by FM4-64. (G) mRFP::BbCrpa colocalizes with CsA-5-FAM in puncta on the plasma membrane (arrows). (H) mRFP::BbCrpa colocalizes with CsA-5-FAM in vacuoles (arrows). (I) mRFP::BbCrpa colocalizes with FK506-5-FAM in puncta on the plasma membrane (arrows). (J) mRFP::BbCrpa colocalizes with FK506-5-FAM in vacuoles (arrows). (K) eGFP::BbCrpa appears in vesicles (white arrows) and moves into vacuoles (red arrows). Time to acquire one image pair was 16 s. (L) eGFP::BbCrpa colocalizes with vesicle from TGN which was labeled by mRFP::PHOSBP (white arrows) and transports into vacuole (red arrows). Time to acquire one image pair was 11 s. (M) Localization of eGFP::Drs2p in B. bassiana cells. eGFP::Drs2p did not accumulate in vacuoles (arrows) which were stained by FM4-64. Scale bars, 5 μm for (A–M). The value of Pearson (rP) and Overlap (rO) correlation coefficient shows the extent of colocalization between the two target molecules. The values range between +1 (positive correlation) and –1 (negative correlation).
Figure 3—figure supplement 1
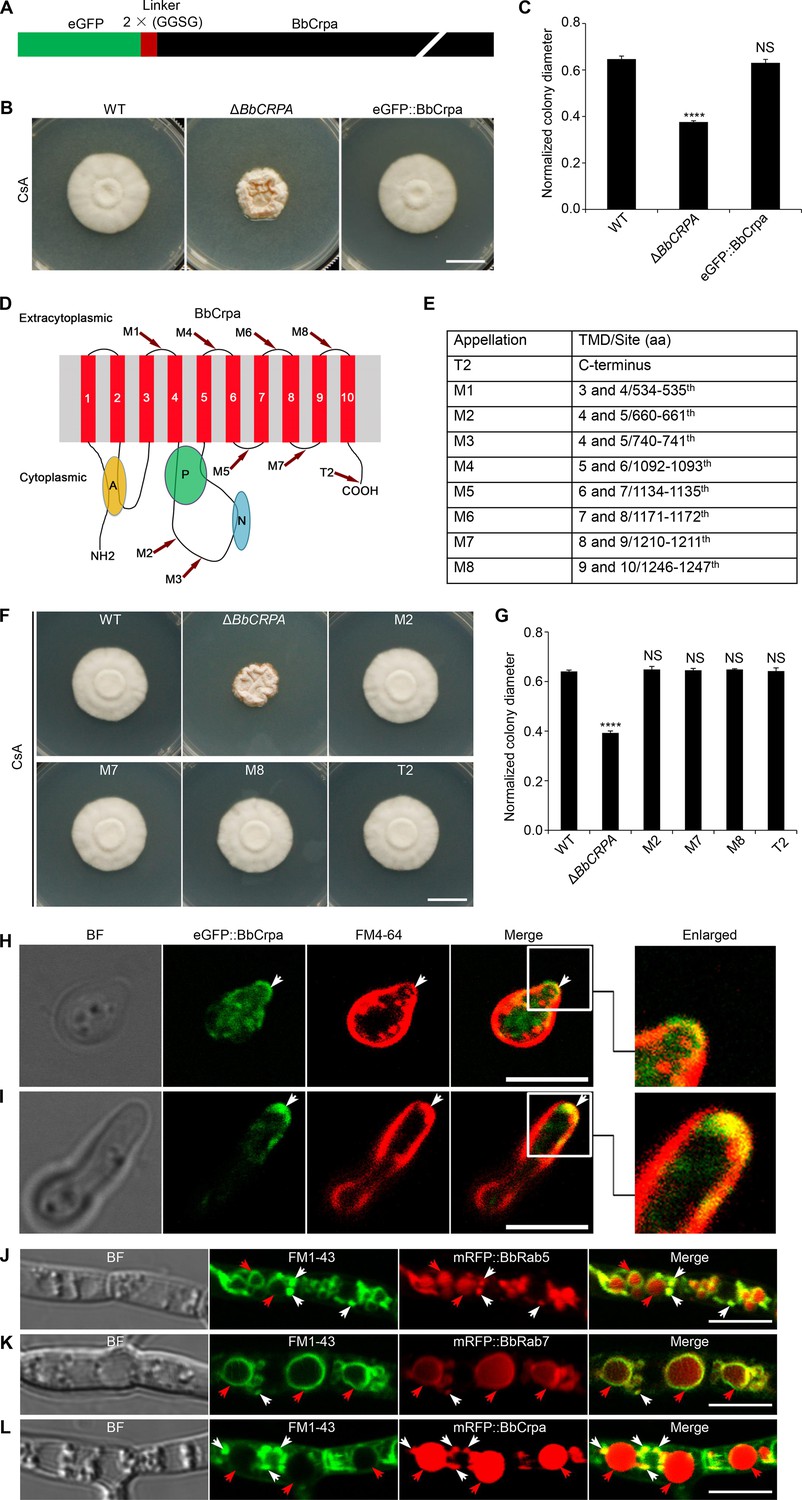
BbCrpa N-terminally tagged with eGFP maintains its original function and is localized to the apical plasma membrane and Spitzenkörper of B. bassiana.
(A) Schematic diagram of eGFP::BbCrpa fusion protein. (B and C) Expression eGFP::BbCRPA fusion gene in ΔBbCRPA strain could restore the resistance to CsA. (D and E) eGFP was fused to other 9 different sites of BbCrpa. TMD, transmembrane segments; aa, amino acid. (F and G) Complementary experiments (expression all the 9 constructs of eGFP-BbCRPA fusion genes in ΔBbCRPA strain) showed that four fusions of eGFP with BbCrpa, that is, at the sites of C-terminus (T2), and the putative outside-membrane region between transmembrane segments 4 and 5 (M2), 8 and 9 (M7), and 9 and 10 (M8) did not compromise the property of BbCrpa. (H) eGFP::BbCrpa localizes to the apical plasma membrane (arrows) and cytosolic structures stained with FM4-64 in germinating conidia. (I) eGFP::BbCrpa localizes to the Spitzenkörper (arrows) stained by FM4-64 in germ tubes. (J) mRFP::BbRab5 colocalizes with FM1-43 signal in early EEs (white arrows) and vacuoles (red arrows). (K) mRFP::BbRab7 colocalizes with FM1-43 signal in LEs (white arrows) and vacuoles (red arrows). (L) mRFP::BbCrpa appears in vesicles (white arrows) and vacuoles (red arrows), the membranes of which are indicated by FM1-43. For CsA sensitivity analysis, plates were spot inoculated with 3 μl conidial suspensions (1×10⁷ conidia/ml) and incubated at 26℃ for about 10 days. Different strains showed variation in growth rates and the data were shown as [colony diameter CZP supplemented with CsA]/[colony diameter CZP]. Scale bars, 1 cm for (B and F) and 5 μm for (H–L). All experiments were performed in triplicate (n = 3). Data are represented as the mean ± SD. ****p<0.0001 from Student′s t-test. NS, not significant.
-
Figure 3—figure supplement 1—source data 1
Growth of target strains at CZP supplemented with CsA normalized to growth at CZP.
Different strains showed variation in growth rates and the data were shown as [colony diameter CZP supplemented with CsA]/[colony diameter CZP]. Data are represented as the mean ± SD. ****p<0.0001 from Student′s t-test. File for the primary data corresponding to Figure 3—figure supplement 1C and G.
- https://cdn.elifesciences.org/articles/79179/elife-79179-fig3-figsupp1-data1-v1.xlsx
Figure 3—figure supplement 2
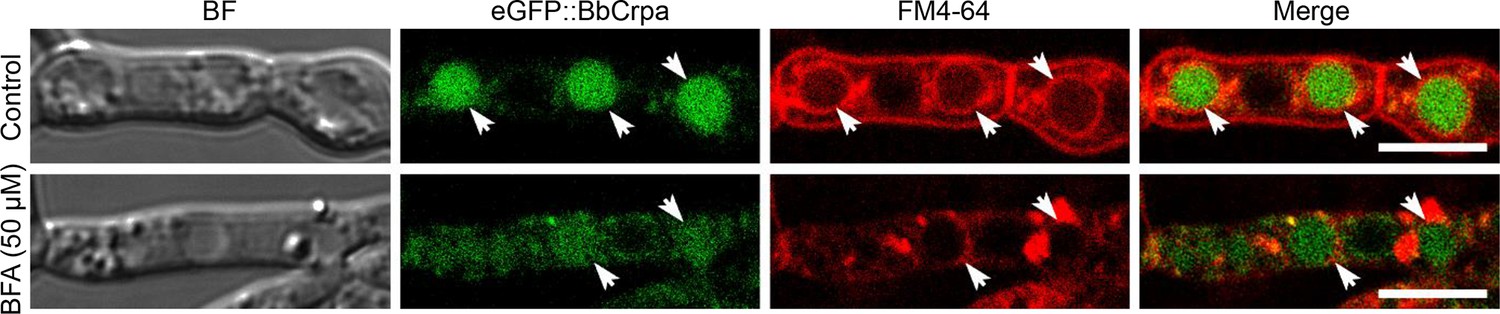
BFA treatment decreases BbCrpa accumulation in the vacuoles.
B. bassiana hyphae were treated with 50 μM BFA for 1 hr. Scale bars, 5 μm.
Figure 3—video 1
Time-lapse imaging of the trajectory of eGFP::BbCrpa (green) and vesicle (red) labeled by FM4-64.
Time to acquire one image pair was 1 s. Scale bar, 5 µm. File corresponding to Figure 3K.
Figure 3—video 2
Time-lapse imaging of the trajectory of eGFP::BbCrpa (green) and vesicle (red) derived from TGN which was labeled by mRFP::PHOSBP (red).
Time to acquire one image pair was 1 s. Scale bar, 5 µm. File corresponding to Figure 3L.
Figure 4 with 1 supplement
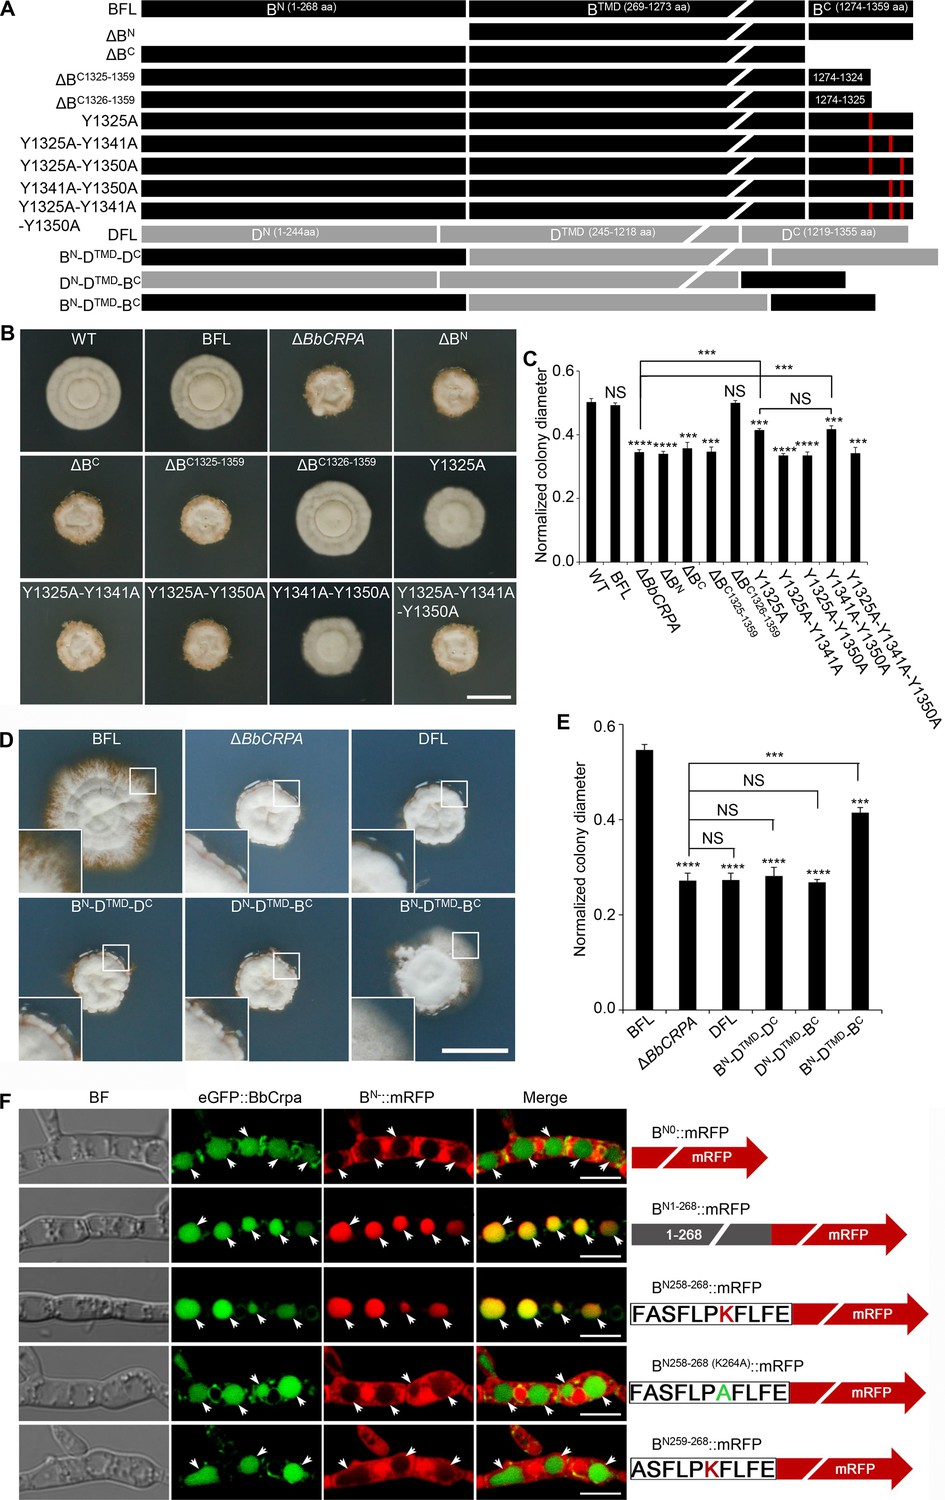
Y1325 (Tyr) in C-terminus is critical for detoxification, and the N-terminus is essential for vacuolar targeting.
(A) Schematic model of N- and C-terminal deletion of BbCrpa and the graft of the N- and C-terminus of BbCrpa with Drs2p. BFL, BbCrpa full length; BN, BbCrpa N-terminus; BTMD, BbCrpa transmembrane-domain; BC, BbCrpa C-terminus; DFL, Drs2p full length; DN, Drs2p N-terminus; DTMD, Drs2p transmembrane-domain; DC, Drs2p C-terminus. (B and C) BbCrpa C-terminus Y1325 is critical for the detoxification of CsA. All strains were incubated in CZP +CsA (20 μg/ml). (D and E) BbCrpa N- and C-terminus are crucial for Drs2p detoxification activity. All strains were incubated in CZA +CsA (20 μg/ml). (F) The last 11 amino acid residues of BbCrpa N-terminus contains vacuolar localization signal. BbCrpa N-terminus (BN1-268, BN258-268) fused with mRFP are obviously colocalized with BbCrpa in vacuoles. When the K264 (Lys) was replaced by Ala (A), the guiding function was disappeared. BN-::mRFP, mRFP fused with different length of N-terminus of BbCrpa. For CsA sensitivity analysis, plates were spot inoculated with 3 μl conidial suspensions (1×10⁷ conidia/ml) and incubated at 26℃ for about 10 (CZP/CZP +CsA) or 14 (CZA/CZA +CsA) days. The variation in growth rates was shown as [colony diameter CZP/CZA supplemented with CsA]/[colony diameter CZP/CZA]. All experiments were performed in triplicate (n = 3). Data are represented as the mean ± SD. ***p<0.001; ****p<0.0001 from Student′s t-test. NS, not significant. Scale bars, 1 cm for (B and D) and 5 μm for (F).
-
Figure 4—source data 1
Growth of target strains at CZP/CZA supplemented with CsA normalized to growth at CZP/CZA.
The variation in growth rates was quantified by calculating the ratio of colony diameter in the presence of CsA supplementation to the colony diameter in the absence of CsA supplementation ([colony diameter on CZP/CZA supplemented with CsA]/[colony diameter on CZP/CZA]). File for the primary data corresponding to Figure 4C and E.
- https://cdn.elifesciences.org/articles/79179/elife-79179-fig4-data1-v1.xlsx
Figure 4—figure supplement 1
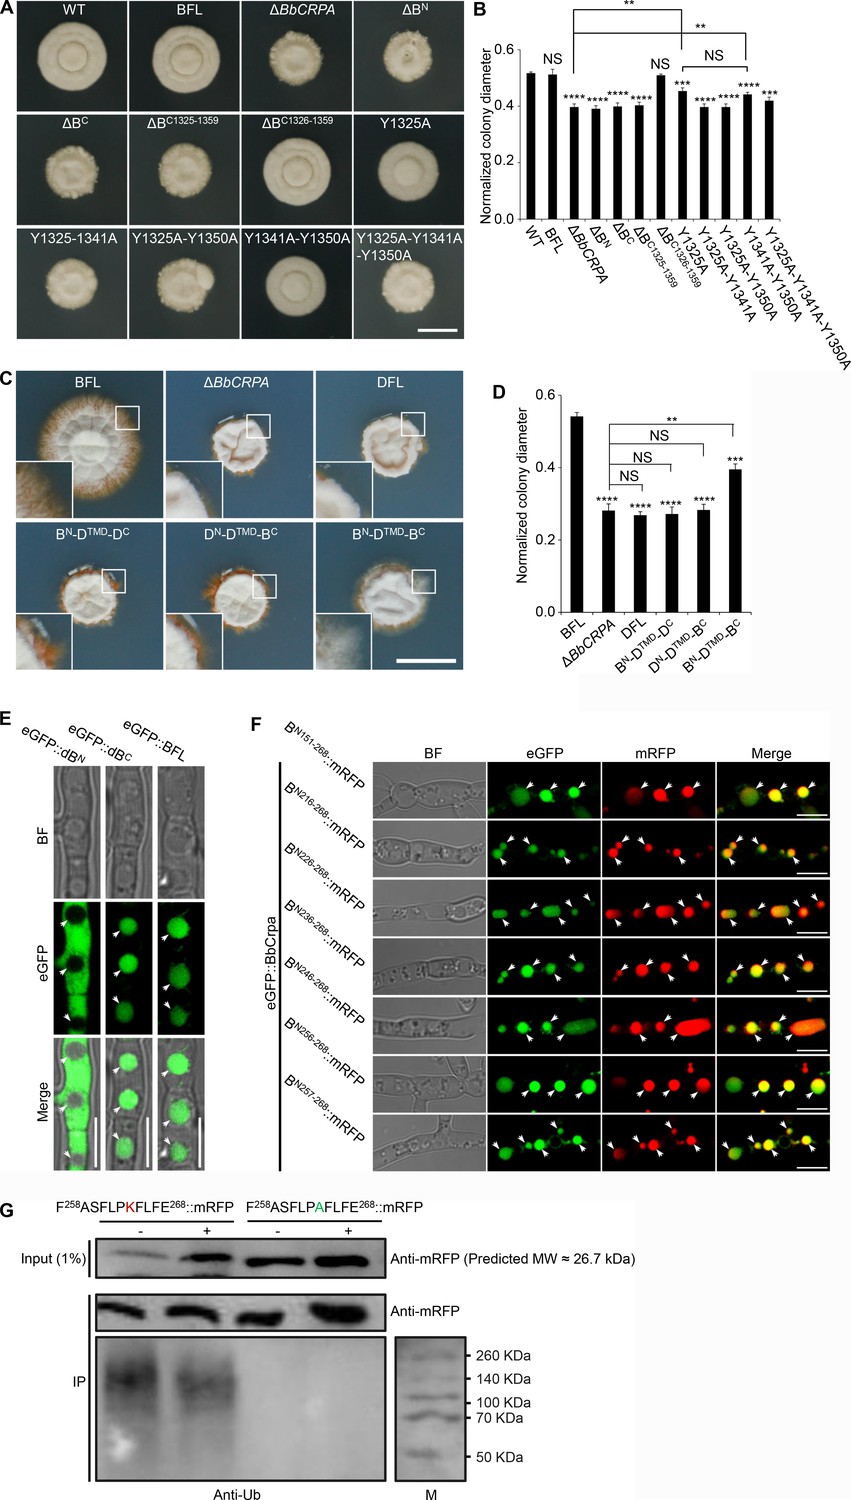
Y1325 (Tyr) in C-terminus is critical for detoxification of FK506, and the N-terminus is essential for vacuolar targeting.
(A and B) BbCrpa C-terminus Y1325 is critical for detoxification of FK506. All strains were incubated in CZP +FK506 (20 μg/ml). (C and D) BbCrpa N- and C-terminus are crucial for its detoxification activity. All strains were incubated in CZA +FK506 (20 μg/ml). (E) BbCrpa N-terminus contains vacuolar sorting signal. dBN, Deleting N-terminus of BbCrpa; dBC, Deleting C-terminus of BbCrpa. (F) The fusions of mRFP with different sizes of BbCrpa N-terminus (BN151-268, BN216-268, BN226-268, BN236-268, BN246-268, BN256-268, and BN257-268) are obviously colocalized with BbCrpa in vacuoles (arrows). (G) K264 is responsible for the ubiquitination of BN258-268 (K264A)::mRFP. Total extracts of the strains were incubated with anti-RFP affinity beads 4FF. After intensive washing, the IP materials (anti-RFP) were subjected to immunoblot with anti-Ub (ubiquitin) and anti-RFP antibodies. The total extracts (input) were detected by immunoblot with anti-RFP antibody. +: CsA (20 μg/ml), -: DMSO. For FK506 sensitivity analysis, plates were spot inoculated with 3 μl conidial suspensions (1×10⁷ conidia/ml) and incubated at 26℃ for about 10 (CZP/CZP +CsA) or 14 (CZA/CZA +CsA) days. The variation in growth rates was shown as [colony diameter CZP/CZA supplemented with CsA]/[colony diameter CZP/CZA]. All experiments were performed in triplicate (n = 3). Data are represented as the mean ± SD. **p<0.01; ***p<0.001; ****p<0.0001 from Student′s t-test. NS, not significant. Scale bars, 1 cm for (A and C) and 5 μm for (E and F).
-
Figure 4—figure supplement 1—source data 1
Growth of target strains at CZP/CZA supplemented with FK506 normalized to growth at CZP/CZA.
The variation in growth rates was shown as (colony diameter CZP/CZA supplemented with CsA]/[colony diameter CZP/CZA). All experiments were performed in triplicate. Data are represented as the mean ± SD. **p<0.01; ***p<0.001; ****p<0.0001 from Student′s t-test. File for the primary data corresponding to Figure 4—figure supplement 1B and D.
- https://cdn.elifesciences.org/articles/79179/elife-79179-fig4-figsupp1-data1-v1.xlsx
-
Figure 4—figure supplement 1—source data 2
Uncropped western blot.
Uncropped western blot is to demonstrate K264 in N terminus is responsible for the ubiquitination of BN258-268 (K264A)::mRFP. Hyphae were incubated with anti-mRFP affinity beads 4FF. IP materials (anti-mRFP) were subjected to immunoblot with anti-Ub (ubiquitin) and anti-mRFP antibodies. The total extracts (input) were detected by immunoblot with anti-mRFP antibody. +: CsA (20 μg/ml), -: DMSO. File for the primary data corresponding to Figure 4—figure supplement 1G.
- https://cdn.elifesciences.org/articles/79179/elife-79179-fig4-figsupp1-data2-v1.zip
Figure 5 with 1 supplement
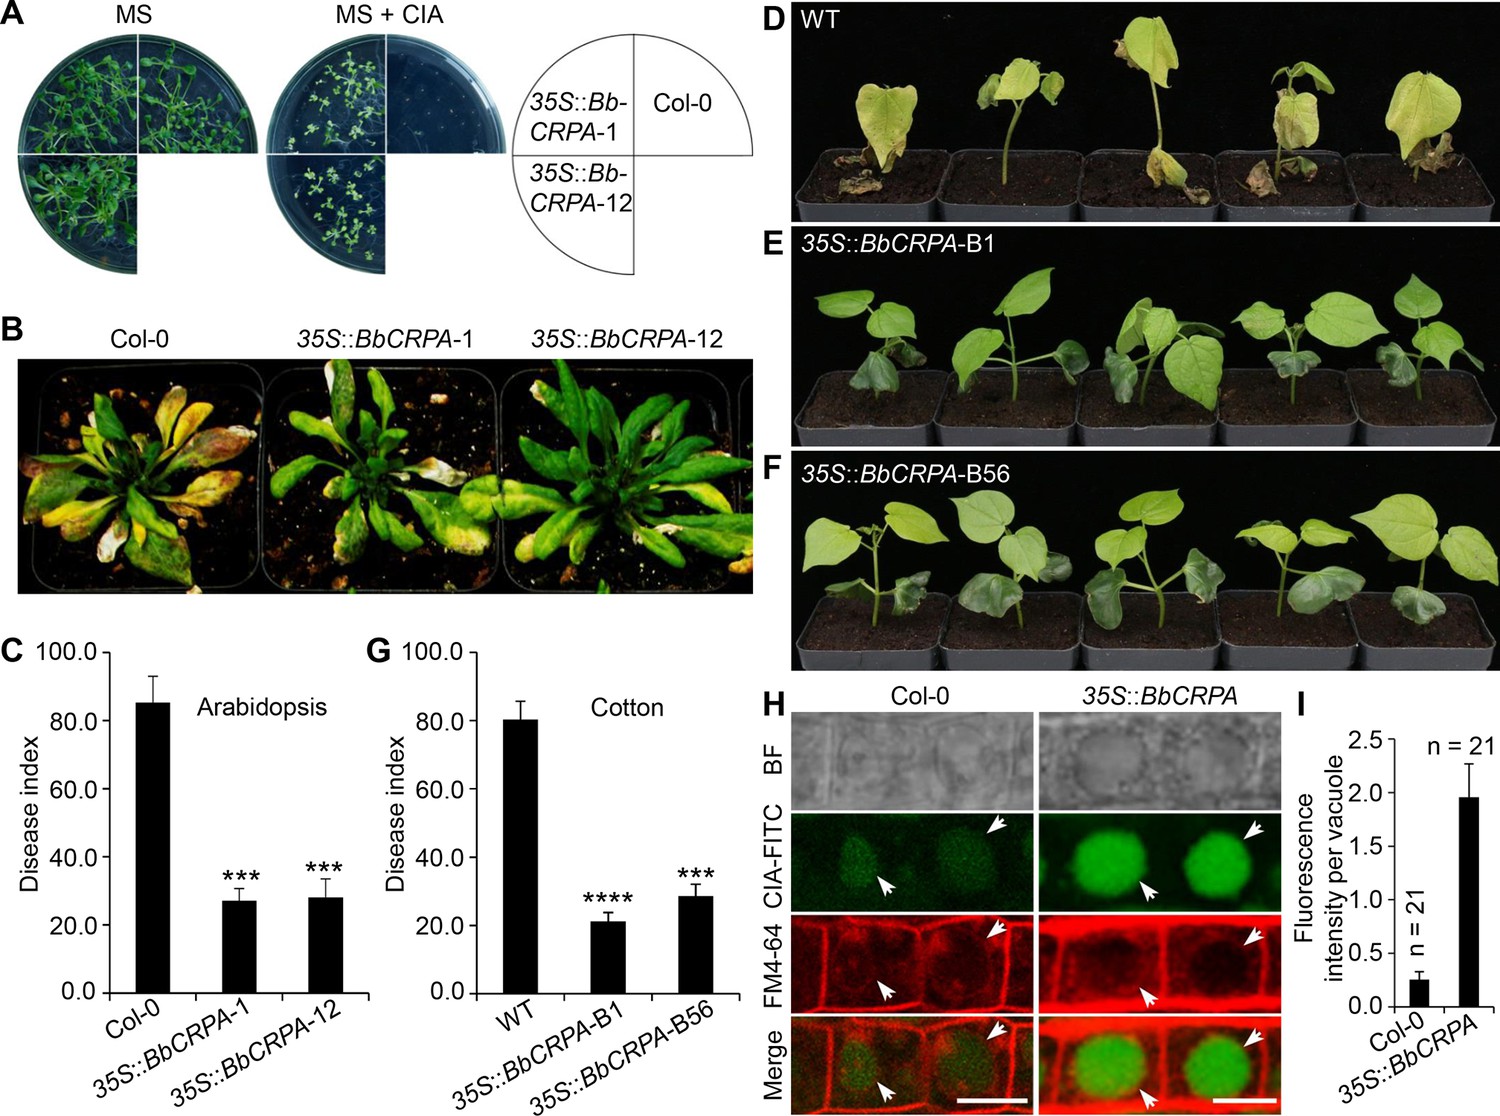
Exogenous overexpression of BbCRPA in Arabidopsis and cotton increases the resistance to V. dahliae.
(A) Exogenous overexpression of BbCRPA increases the resistance of Arabidopsis to CIA. The wild-type (Columbia, Col-0) and 35 S::BbCRPA seedlings (T3) were grown for 14 days on MS medium containing either 0.05% DMSO (control) or 50 μg/ml CIA. (B and C) Exogenous overexpression of BbCRPA increases the resistance of Arabidopsis to V. dahliae. Each Arabidopsis plant (4–5 leaves) was inoculated with 3 ml V. dahliae spore suspension (2×10⁸ spores/ml), and the disease index of transgenic plants and the wild-type plants to V. dahliae was evaluated 21 days after inoculation. 35 S::BbCRPA-1 and 35 S::BbCRPA-12: two homologous representative transgenic Arabidopsis lines.(D–G) Exogenous overexpression of BbCRPA in cotton (T2) increases the resistance to V. dahliae V991. Ten-day-old cotton seedling roots were infected by V. dahliae spore suspension (1×10⁷ spores/ml), and the disease index of the transgenic cottons to V. dahliae was evaluated 14 days after inoculation.35 S::BbCRPA-B1 and 35 S::BbCRPA-B56: two homologous representative transgenic cotton lines. (H and I) Exogenous overexpression of BbCRPA in Arabidopsis promotes the accumulation of cinnamyl acetate (CIA) in vacuoles of root cells. Strong fluorescein-labeled CIA (CIA-FITC) signal was observed in vacuoles of transgenic Arabidopsis cells (35 S::BbCRPA), while only very weak signal was observed in the vacuoles of wild-type Arabidopsis cells (arrows) (H). Vacuoles (arrows) were indicated by FM4-64 and plants were treated with 5 μg/ml CIA-FITC. The comparison of fluorescent intensity in vacuoles between the wild-type and 35 S::BbCRPA transgenic Arabidopsis was measured by ImageJ (I).Data are represented as the mean ± SD. Scale bars, 10 μm. The resistance of plants to V. dahliae was estimated by disease index. Data are represented as the mean ± SD for three independent experiments with at least 11 plants per replication. ***p<0.001; ****p<0.0001 from Student′s t-test.
-
Figure 5—source data 1
Verticillium disease index and fluorescent intensity of CIA-FITC in vacuoles.
The disease index of T3 transgenic Arabidopsis and the wild-type plants to V. dahliae was evaluated 21 days after inoculation. The disease index of T2 transgenic cotton to V. dahliae was evaluated 14 days after inoculation. DI = [∑(disease grades ×number of infected plants)/(total checked plants ×4)]×100. Data are represented as the mean ± SD. ***p<0.001; ****p<0.0001 from Student′s t-test. File for the primary data corresponding to Figure 5C, G and I.
- https://cdn.elifesciences.org/articles/79179/elife-79179-fig5-data1-v1.xlsx
Figure 5—figure supplement 1
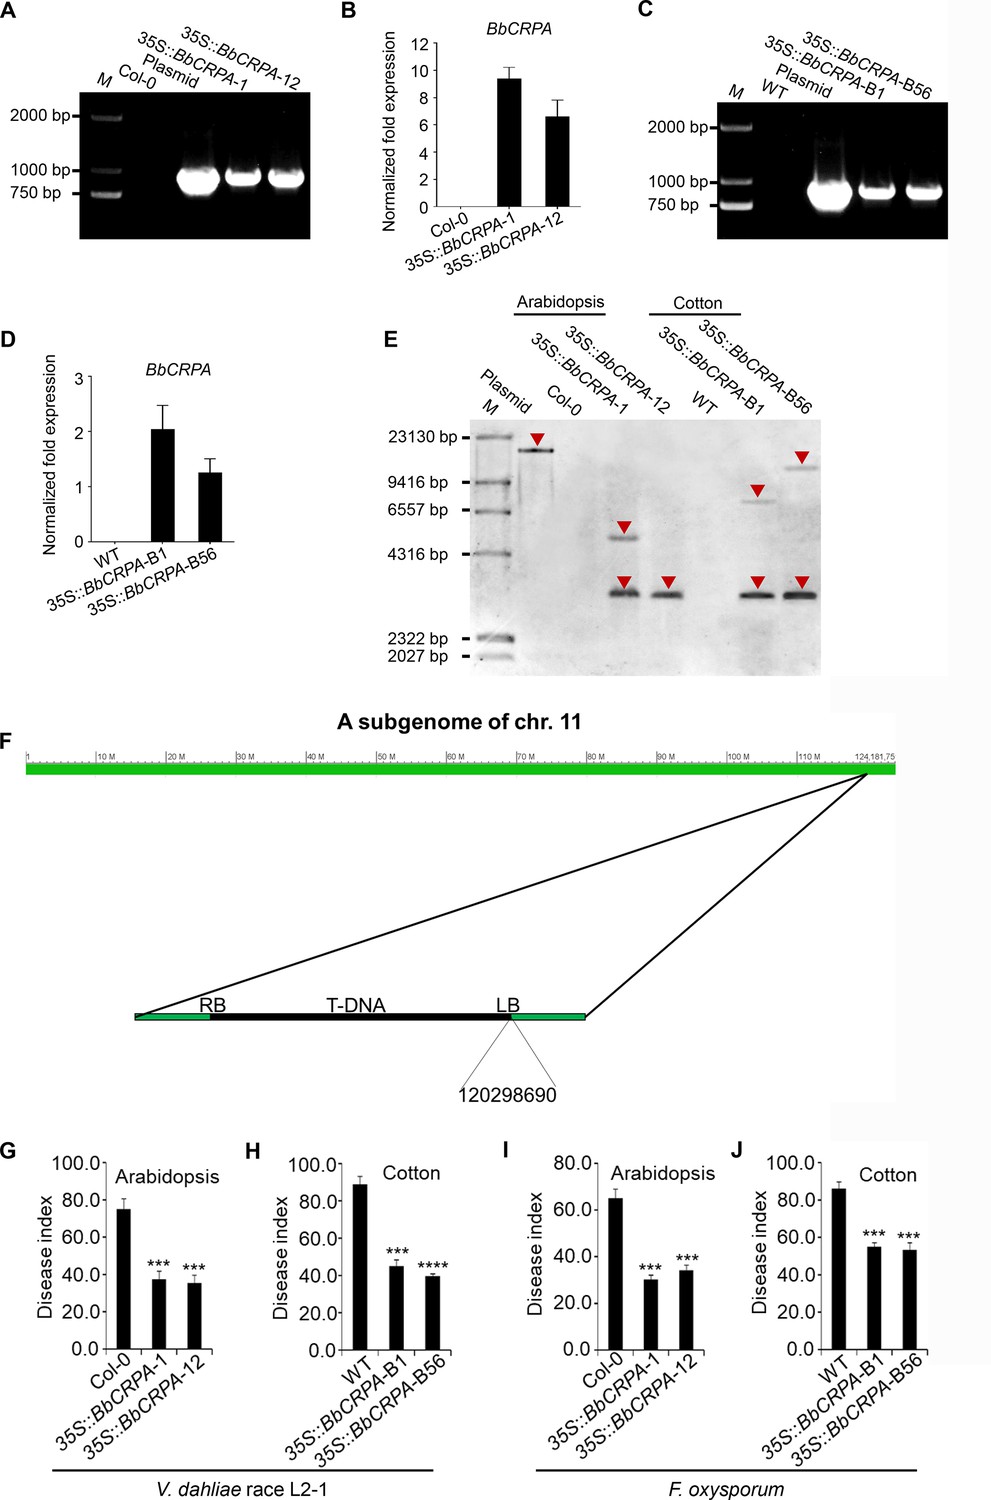
Validation of transgenic BbCRPA plants.
(A and C) PCR validation of BbCRPA transcription in transgenic Arabidopsis (A) and cotton (C). M, DNA Marker DL2000. (B and D) Transcriptional level detection of BbCRPA in transgenic Arabidopsis (B) and cotton (D) plants by qRT-PCR. All experiments were performed in triplicate (n = 3). Data are represented as the mean ± SD. (E) Southern blot validation of BbCRPA insertions in transgenic Arabidopsis and cotton. Genomic DNA was digested with HindIII and then hybridized with a 912 bp DNA probe produced via PCR from BbCRPA. Southern blot results indicate 35 S::BbCRPA was inserted into the chromosome of Arabidopsis and cotton. M, DNA Molecular Weight Marker; plasmid, positive control fragment from modified pCAMBIA2300 (PLGN). (F) Flanking sequencing indicated that in transgenic cotton line 35 S::BbCRPA-B1, transgene (35 S::BbCRPA-35S::NTPII::GUS) was inserted in the A subgenome of 11 chromosome at 120298690. Growth of transgenic Arabidopsis at MS supplemented with or without Kana (50 μg/ml). (G and H) Exogenous overexpression of BbCRPA increases the resistance of Arabidopsis and cotton to V. dahliae race L2-1. (I and J) Exogenous overexpression of BbCRPA increased the resistance of Arabidopsis and cotton to F. oxysporum. For disease index analysis, T3 transgenic Arabidopsis and T2 transgenic cotton plants were challenged by V. dahliae race L2-1 and F. oxysporum were evaluated. Data are represented as the mean ± SD for three independent experiments with at least 14 plants per replication. ***p<0.001; ****p<0.0001 from Student′s t-test.
-
Figure 5—figure supplement 1—source data 1
Transcriptional level detection of BbCRPA in transgenic plants.
File for the primary data corresponding to Figure 5—figure supplement 1B and D.
- https://cdn.elifesciences.org/articles/79179/elife-79179-fig5-figsupp1-data1-v1.xlsx
-
Figure 5—figure supplement 1—source data 2
Validation of transgenic Arabidopsis and cotton.
File for the primary data corresponding to Figure 5—figure supplement 1A, C and E .
- https://cdn.elifesciences.org/articles/79179/elife-79179-fig5-figsupp1-data2-v1.zip
-
Figure 5—figure supplement 1—source data 3
Disease index analysis.
File for the primary data corresponding to Figure 5—figure supplement 1G–J.
- https://cdn.elifesciences.org/articles/79179/elife-79179-fig5-figsupp1-data3-v1.xlsx
Tables
Appendix 1—key resources table
| Reagent type (species) or resource | Designation | Source or reference | Identifiers | Additional information |
|---|---|---|---|---|
| Strain, strain background (Agrobacterium tumefaciens) | AGL-1 | Lab stock | Fungal transformations, Biotechnology Research Center, Southwest University, Beibei, Chongqing, China | |
| Strain, strain background (Agrobacterium tumefaciens) | GV3101 | Lab stock | Arabidopsis transformation, Biotechnology Research Center, Southwest University, Beibei, Chongqing, China | |
| Strain, strain background (Agrobacterium tumefaciens) | LBA4404 | Lab stock | Cotton transformation, Biotechnology Research Center, Southwest University, Beibei, Chongqing, China | |
| Strain, strain background (Escherichia coli strain) | DH5α | Takara | Cat#9057 | DNA manipulations |
| Strain, strain background (Beauveria bassiana) | B. bassiana wild-type strain | China General Microbiologic-al Culture Collection Center (CGMCC) | Cat#CGMCC7.34 | Random insertion (T-DNA) library construction |
| Strain, strain background (Verticillium dahliae) | V991 | A gift of Prof. Guiliang Jian | Analysis of plant disease resistance | |
| Strain, strain background (Verticillium dahliae) | V. dahliae race L2-1 | A gift of Prof. Zhiying Ma | Analysis of plant disease resistance | |
| Strain, strain background (Fusarium oxysporum) | F. oxysporum f. sp. vasinfectum race 7 | A gift of Prof. Longfu Zhu | Analysis of plant disease resistance | |
| Strain, strain background (Metarhizium anisopliae) | M. anisopliae wild-type strain | A gift of Prof. Weiguo Fang | Inhibition ring assay | |
| Strain, strain background (Botrytis cinerea) | B. cinerea wild-type strain | CGMCC | Cat#3.4584 | Inhibition ring assay |
| Strain, strain background (Alternaria brassicae) | A. brassicae wild-type strain | CGMCC | Cat#3.7804 | Inhibition ring assay |
| Strain, strain background (Alternaria brassicicola) | A. brassicicola wild-type strain | CGMCC | Cat#3.7805 | Inhibition ring assay |
| Strain, strain background (Aspergillus nidulans) | A. nidulans wild-type strain | CGMCC | Cat#3.15737 | Inhibition ring assay |
| Strain, strain background (Alternaria solani) | A. solani wild-type strain | Lab stock | Inhibition ring assay, Biotechnology Research Center, Southwest University, Beibei, Chongqing, China | |
| Strain, strain background (Arabidopsis thaliana) | Col-0 | Arabidopsis Biological Resource Center | Cat#CS60000 | Analysis of plant disease resistance |
| Strain, strain background (Gossypium hirsutum) | G. hirsutum, cv. Jimian 14 | A gift of Prof. Zhiying Ma | Analysis of plant disease resistance | |
| Antibody | Anti-RFP (mouse monoclonal) | Thermo Scientific | Cat#MA5-15257 | WB (1:1000) |
| Antibody | Anti-ubiquitin (mouse monoclonal) | PTM-BIO | Cat#PTM-1107 | WB (1:2000) |
| Recombinant DNA reagent | pK2-BbCRPA5’-Bar- BbCRPA3’ (plasmid) | This paper | Deletion of BbCAPA, Biotechnology Research Center, Southwest University, Beibei, Chongqing, China | |
| Recombinant DNA reagent | pK2-Sur-BbCRPA (plasmid) | This paper | BbCPRA complementation, Biotechnology Research Center, Southwest University, Beibei, Chongqing, China | |
| Recombinant DNA reagent | pK2-HygB-BbCRPA | This paper | Expression of BbCRPA in V. dahliae, Biotechnology Research Center, Southwest University, Beibei, Chongqing, China | |
| Recombinant DNA reagent | PLGN-BbCRPA (plasmid) | This paper | Expression of BbCRPA in plants, Biotechnology Research Center, Southwest University, Beibei, Chongqing, China | |
| Recombinant DNA reagent | pK2-Sur-BFL (plasmid) | This paper | Functional verification of BbCrpa, Biotechnology Research Center, Southwest University, Beibei, Chongqing, China | |
| Recombinant DNA reagent | pK2-Sur-ΔBN (plasmid) | This paper | Functional verification of N-terminus of BbCrpa, Biotechnology Research Center, Southwest University, Beibei, Chongqing, China | |
| Recombinant DNA reagent | pK2-Sur-ΔBC (plasmid) | This paper | Functional verification of C-terminus of BbCrpa, Biotechnology Research Center, Southwest University, Beibei, Chongqing, China | |
| Recombinant DNA reagent | pK2-Sur-ΔBC1325-1359 (plasmid) | This paper | Functional verification of C-terminus of BbCrpa, Biotechnology Research Center, Southwest University, Beibei, Chongqing, China | |
| Recombinant DNA reagent | pK2-Sur-ΔBC1326-1359 (plasmid) | This paper | Functional verification of C-terminus of BbCrpa, Biotechnology Research Center, Southwest University, Beibei, Chongqing, China | |
| Recombinant DNA reagent | pK2-Sur-Y1325A (plasmid) | This paper | Functional verification of Y1325 of BbCrpa, Biotechnology Research Center, Southwest University, Beibei, Chongqing, China | |
| Recombinant DNA reagent | pK2-Sur-Y1325A- Y1341A (plasmid) | This paper | Functional verification of Y1325-Y1341 of BbCrpa, Biotechnology Research Center, Southwest University, Beibei, Chongqing, China | |
| Recombinant DNA reagent | pK2-Sur-Y1325A- Y1350A (plasmid) | This paper | Functional verification of Y1325-Y1350 of BbCrpa, Biotechnology Research Center, Southwest University, Beibei, Chongqing, China | |
| Recombinant DNA reagent | pK2-Sur-Y1341A- Y1350A (plasmid) | This paper | Functional verification of Y1341-Y1350 of BbCrpa, Biotechnology Research Center, Southwest University, Beibei, Chongqing, China | |
| Recombinant DNA reagent | pK2-Sur-Y1325A- Y1341A-Y1350A (plasmid) | This paper | Functional verification of Y1325-Y1341-Y1350 of BbCrpa, Biotechnology Research Center, Southwest University, Beibei, Chongqing, China | |
| Recombinant DNA reagent | pK2-Sur-DFL (plasmid) | This paper | Functional verification of Drs2p, Biotechnology Research Center, Southwest University, Beibei, Chongqing, China | |
| Recombinant DNA reagent | pK2-Sur-BN-DTMD-DC (plasmid) | This paper | Functional verification of N-terminus of BbCrpa, Biotechnology Research Center, Southwest University, Beibei, Chongqing, China | |
| Recombinant DNA reagent | pK2-Sur-DN-DTMD-BC (plasmid) | This paper | Functional verification of C-terminus of BbCrpa, Biotechnology Research Center, Southwest University, Beibei, Chongqing, China | |
| Recombinant DNA reagent | pK2-Sur-BN-DTMD-BC (plasmid) | This paper | Functional verification of transmembrane domains of BbCrpa, Biotechnology Research Center, Southwest University, Beibei, Chongqing, China | |
| Recombinant DNA reagent | pK2-Sur-D614R (plasmid) | This paper | Functional verification of D614 of BbCrpa, Biotechnology Research Center, Southwest University, Beibei, Chongqing, China | |
| Recombinant DNA reagent | pK2-Sur-I562E (plasmid) | This paper | Functional verification of I562 of BbCrpa, Biotechnology Research Center, Southwest University, Beibei, Chongqing, China | |
| Recombinant DNA reagent | eGFP::BbCrpa/BFL (plasmid) | This paper | Localization of BbCrpa, Biotechnology Research Center, Southwest University, Beibei, Chongqing, China | |
| Recombinant DNA reagent | eGFP::dBN (plasmid) | This paper | Functional verification of N-terminus of BbCrpa, Biotechnology Research Center, Southwest University, Beibei, Chongqing, China | |
| Recombinant DNA reagent | eGFP::dBC (plasmid) | This paper | Functional verification of C-terminus of BbCrpa, Biotechnology Research Center, Southwest University, Beibei, Chongqing, China | |
| Recombinant DNA reagent | BN1-268::mRFP (plasmid) | This paper | Functional verification of N-terminus of BbCrpa, Biotechnology Research Center, Southwest University, Beibei, Chongqing, China | |
| Recombinant DNA reagent | BN258-268::mRFP (plasmid) | This paper | Functional verification of N-terminus of BbCrpa, Biotechnology Research Center, Southwest University, Beibei, Chongqing, China | |
| Recombinant DNA reagent | BN258-268 (K264A)::mRFP (plasmid) | This paper | Functional verification of N-terminus of BbCrpa, Biotechnology Research Center, Southwest University, Beibei, Chongqing, China | |
| Recombinant DNA reagent | BN259-268::mRFP (plasmid) | This paper | Functional verification of N-terminus of BbCrpa, Biotechnology Research Center, Southwest University, Beibei, Chongqing, China | |
| Recombinant DNA reagent | BN0::mRFP (plasmid) | This paper | Functional verification of N-terminus of BbCrpa, Biotechnology Research Center, Southwest University, Beibei, Chongqing, China | |
| Recombinant DNA reagent | mRPF::BbCrpa (plasmid) | This paper | Localization of BbCrpa, Biotechnology Research Center, Southwest University, Beibei, Chongqing, China | |
| Recombinant DNA reagent | mRFP::PHOSBP (plasmid) | A gift of Dr. Miguel A. Peñalva | Labelling TGN, Biotechnology Research Center, Southwest University, Beibei, Chongqing, China | |
| Recombinant DNA reagent | mRFP::BbRab5 (plasmid) | This paper | Labelling early endosomes, Biotechnology Research Center, Southwest University, Beibei, Chongqing, China | |
| Recombinant DNA reagent | mRFP::BbRab7 (plasmid) | This paper | Labelling late endosomes, Biotechnology Research Center, Southwest University, Beibei, Chongqing, China | |
| Recombinant DNA reagent | eGFP::Drs2p (plasmid) | This paper | Localization of Drs2p, Biotechnology Research Center, Southwest University, Beibei, Chongqing, China | |
| Chemical compound, drug | Cyclosporine A (CsA) | APEXBIO | Cat#B1922 | |
| Chemical compound, drug | Tacrolimus (FK506) | APEXBIO | Cat#B2143 | |
| Chemical compound, drug | Cinnamyl acetate (CIA) | Sigma-Aldrich | Cat#166170 | |
| Chemical compound, drug | Phosphinothricin | PhytoTech | Cat#P679 | |
| Chemical compound, drug | Chlorimuron-ethyl | Alfa Aesar | Cat#J66605 | |
| Commercial assay, kit | Fungal protein extraction kit | BestBio | Cat#BB-3136 | |
| Commercial assay, kit | PrimeScript RT reagent Kit | Takara | Cat#RR037A | cDNA synthesis |
| Commercial assay, kit | iQSYBR Green Supermix | Bio-Rad | Cat#1708882 | qRT-PCR |
| Software, algorithm | GraphPad Prism | GraphPad Software | https://www.graphpad.com | |
| Software, algorithm | ImageJ | ImageJ | http://rsb.info.nih.gov/ij/ | |
| Software, algorithm | CFX96 Real-Time System | Bio-Rad | ||
| Software, algorithm | FV10-ASW 3.0 Viewer | Olympus | ||
| Other | FM4-64 | Thermo Scientific | Cat#F34653 | Membrane-binding fluorescent dye |
| Other | FM1-43 | Thermo Scientific | Cat#T35356 | Membrane probe |
Additional files
-
Supplementary file 1
Loss of autophagy-related protein BbAtg1, adaptor protein BbAP-1, or coat protein clathrin does not affect CsA resistance.
- https://cdn.elifesciences.org/articles/79179/elife-79179-supp1-v1.docx
-
Supplementary file 2
Primers used in this study.
- https://cdn.elifesciences.org/articles/79179/elife-79179-supp2-v1.docx
-
MDAR checklist
- https://cdn.elifesciences.org/articles/79179/elife-79179-mdarchecklist1-v1.docx
-
Source data 1
Growth of target strains at CZP/CZA supplemented with CsA normalized to growth at CZP/CZA. File for the primary data corresponding to Supplementary file 1B and E.
- https://cdn.elifesciences.org/articles/79179/elife-79179-data1-v1.xlsx
Download links
A two-part list of links to download the article, or parts of the article, in various formats.
Downloads (link to download the article as PDF)
Open citations (links to open the citations from this article in various online reference manager services)
Cite this article (links to download the citations from this article in formats compatible with various reference manager tools)
Cell detoxification of secondary metabolites by P4-ATPase-mediated vesicle transport
eLife 12:e79179.
https://doi.org/10.7554/eLife.79179


