Conduction velocity along a key white matter tract is associated with autobiographical memory recall ability
- Wellcome Centre for Human Neuroimaging, Department of Imaging Neuroscience, UCL Queen Square Institute of Neurology, University College London, United Kingdom
- Institute of Systems Neuroscience, University Medical Centre Hamburg-Eppendorf, Germany
Figures
Figure 1
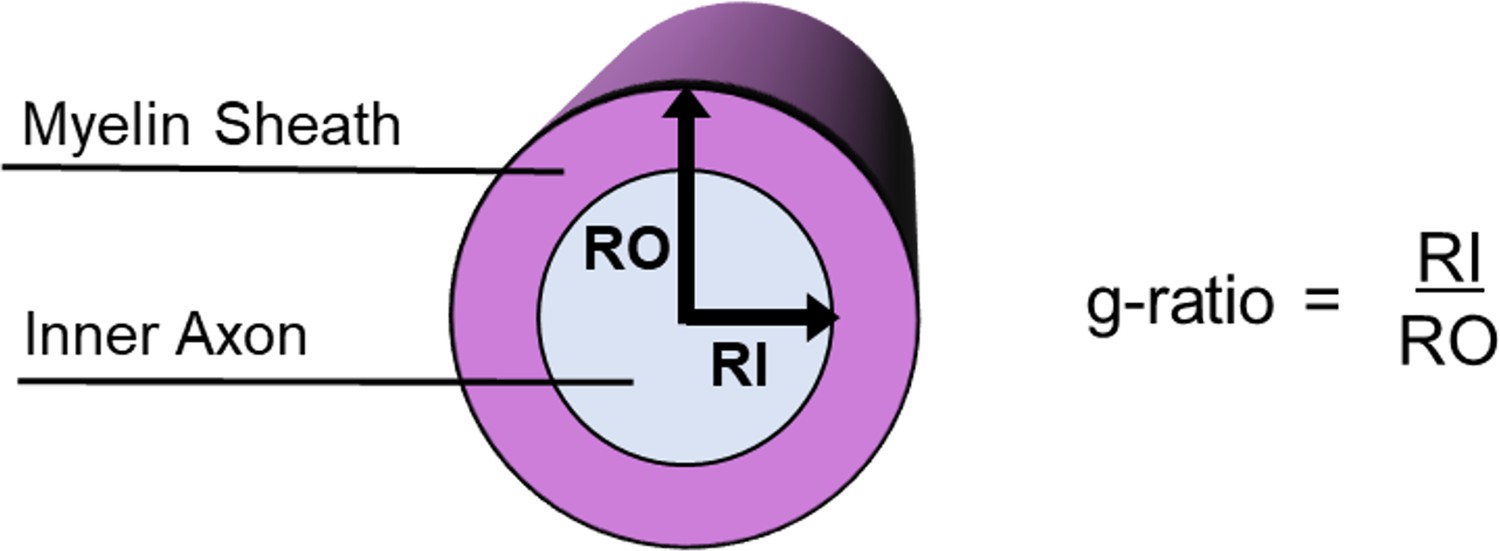
Schematic of a myelinated axon showing how the g-ratio is calculated.
Figure 2
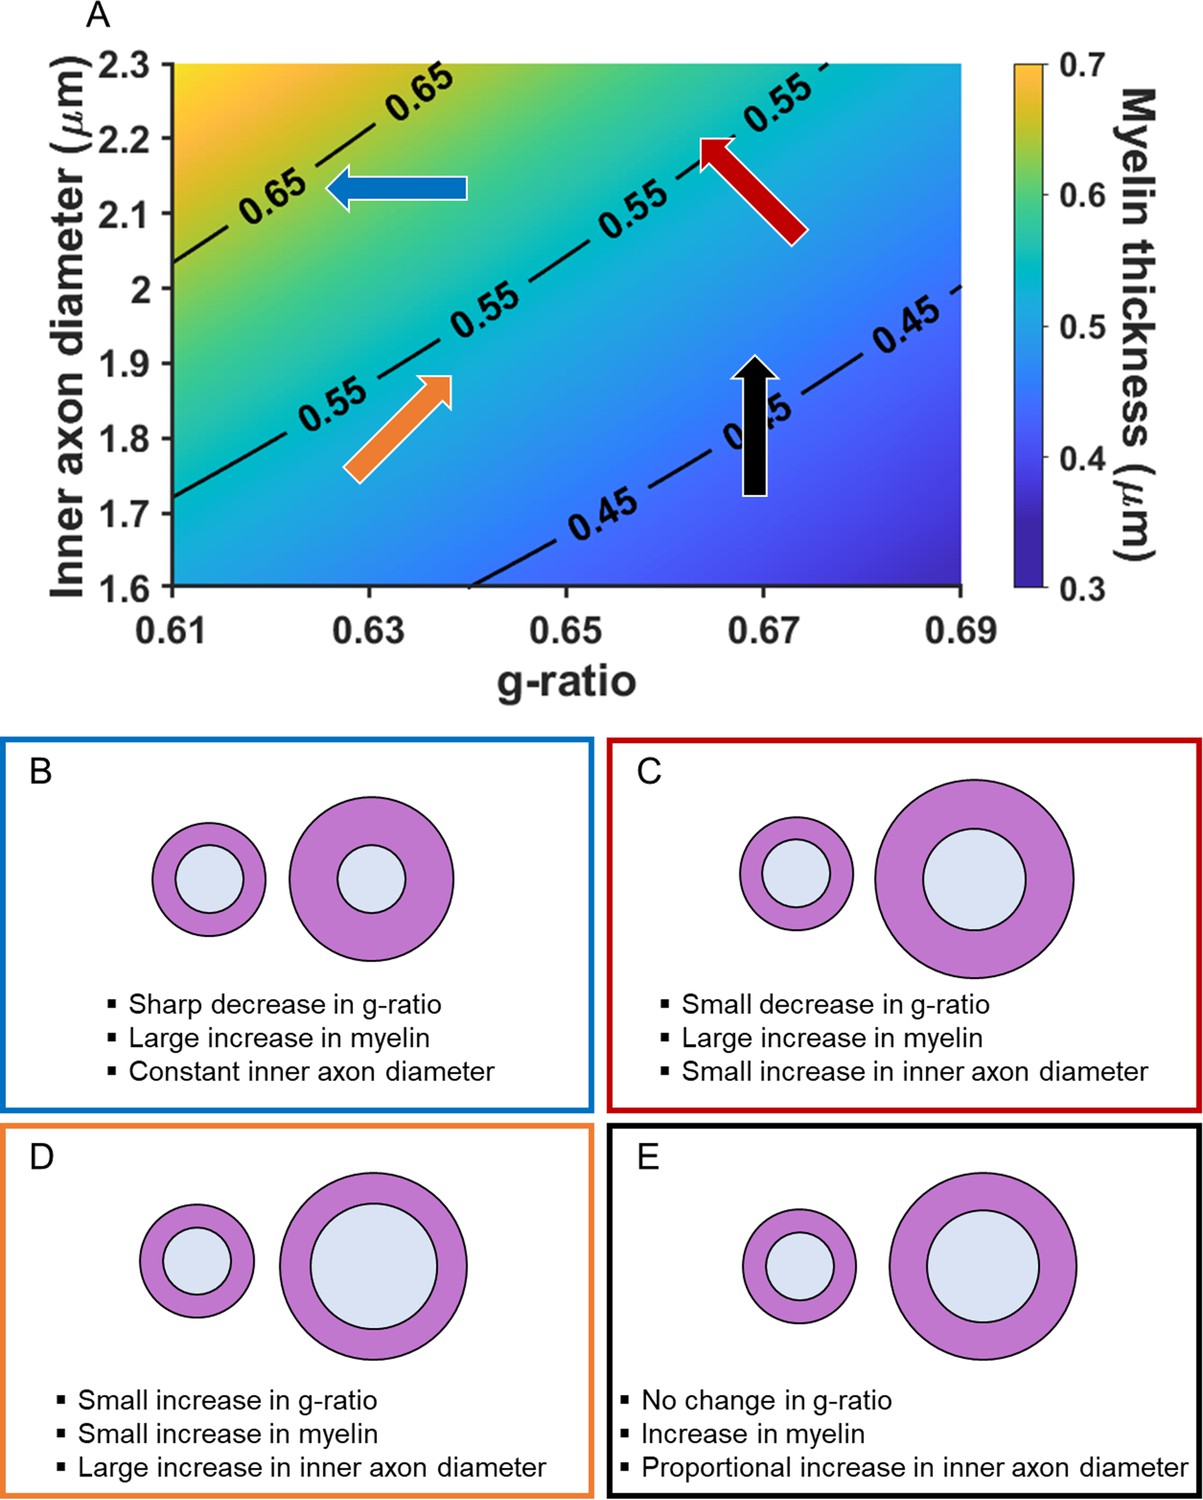
Illustration of how the MR g-ratio relates to specific microstructural properties given a faster conduction velocity.
(A) Graphical representation of the relationships between myelin thickness, inner axon diameter and MR g-ratio, assuming a faster conduction velocity (see Appendix 1 for details of the simulation). Myelin thickness is represented by the gradient in background colour and contours on the graph, with the thinnest myelin at the bottom right and thickest at the top left. The direction of the arrows describes the change in g-ratio for each microstructural variation presented in B-E. The positioning and colours of the arrows correspond to the text box outline colours in B-E. (B–E) Illustrations of how changes in the MR g-ratio relate to the underlying axonal microstructure, given a faster conduction velocity.
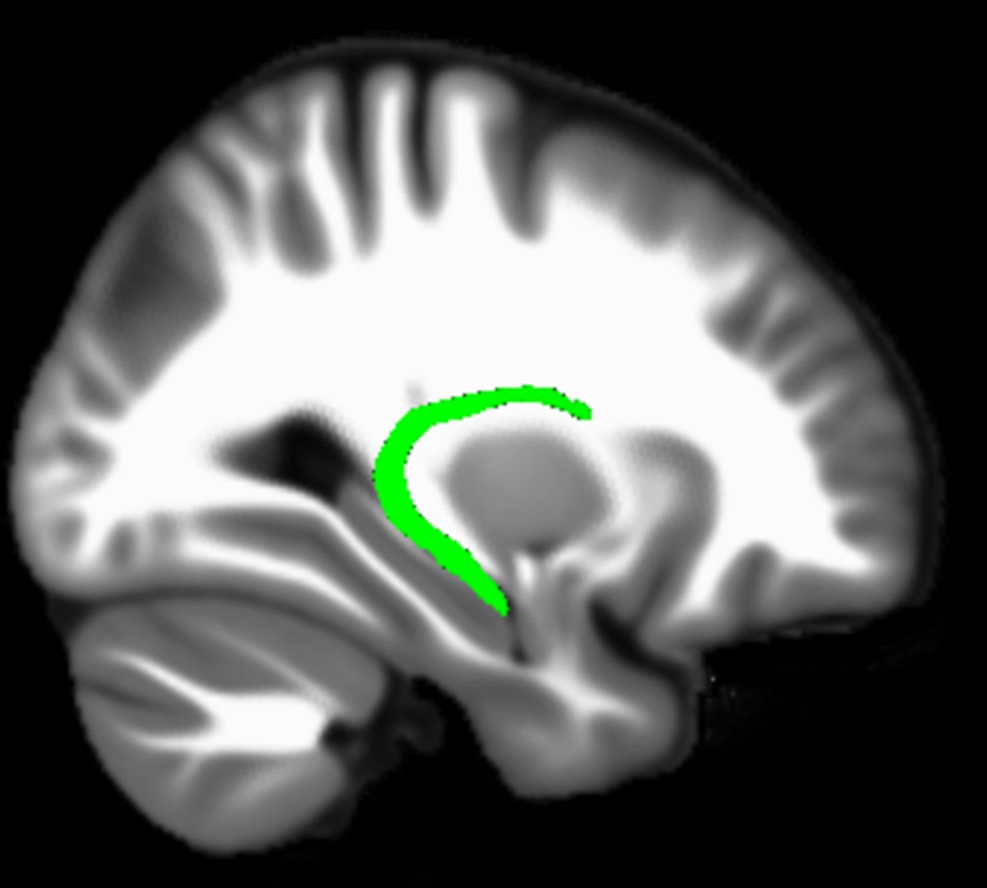
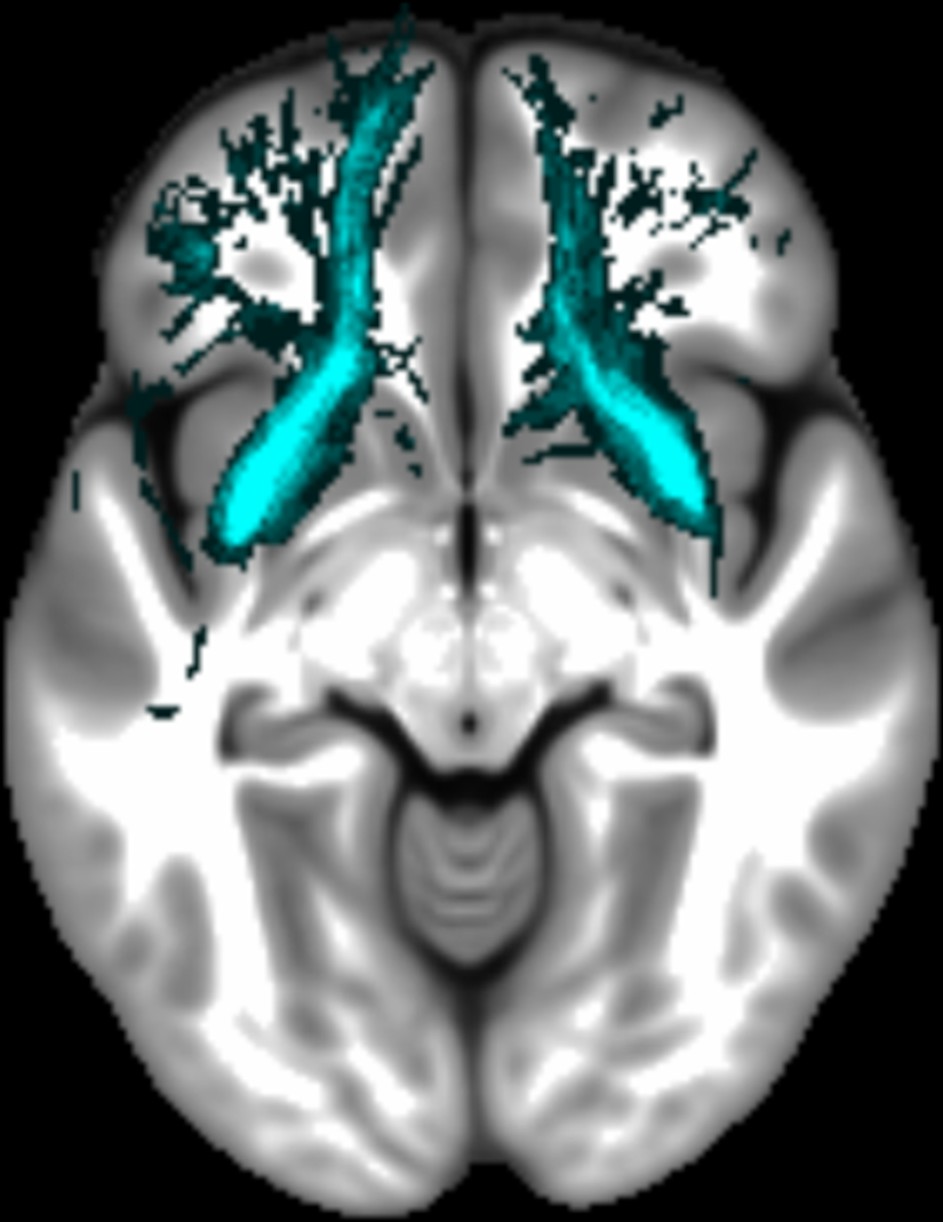
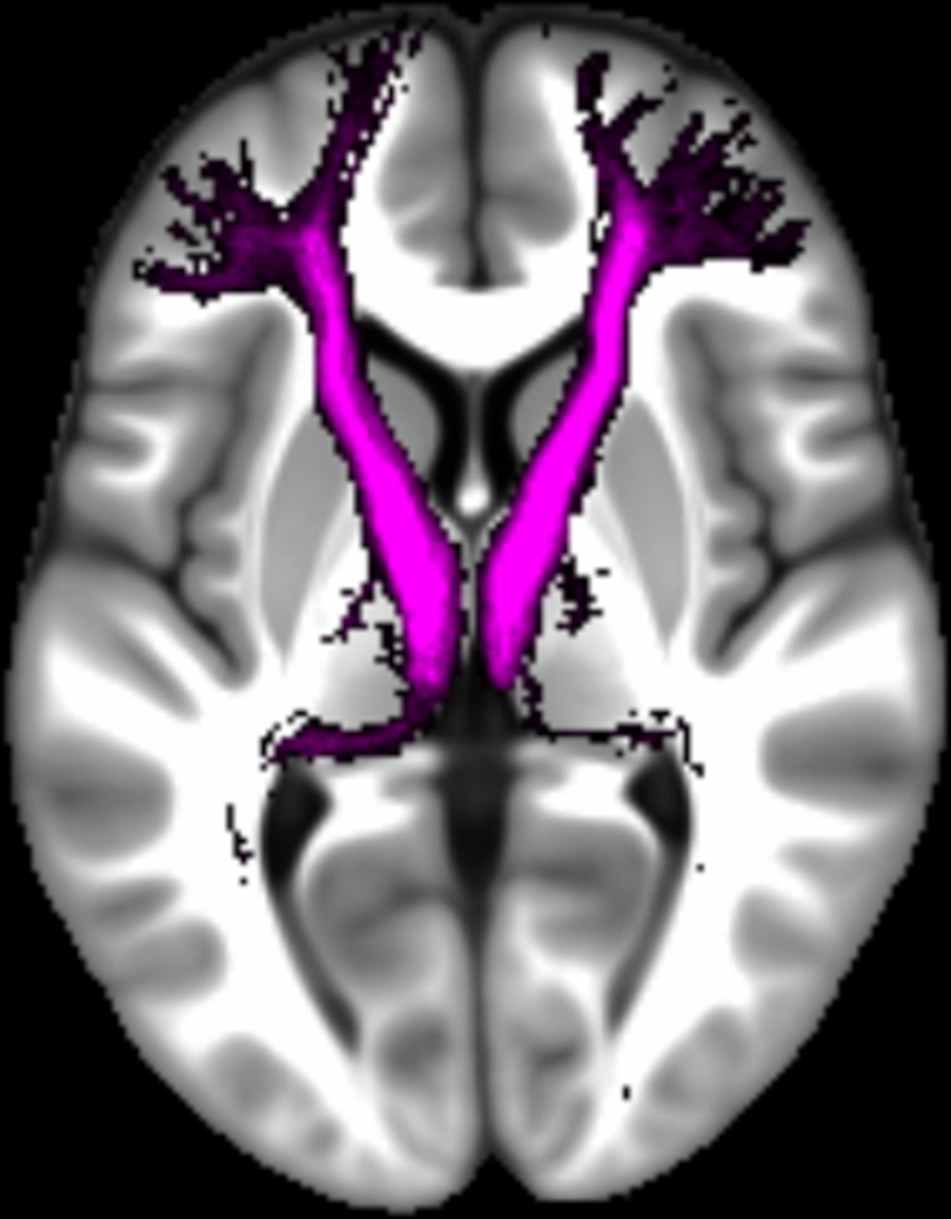
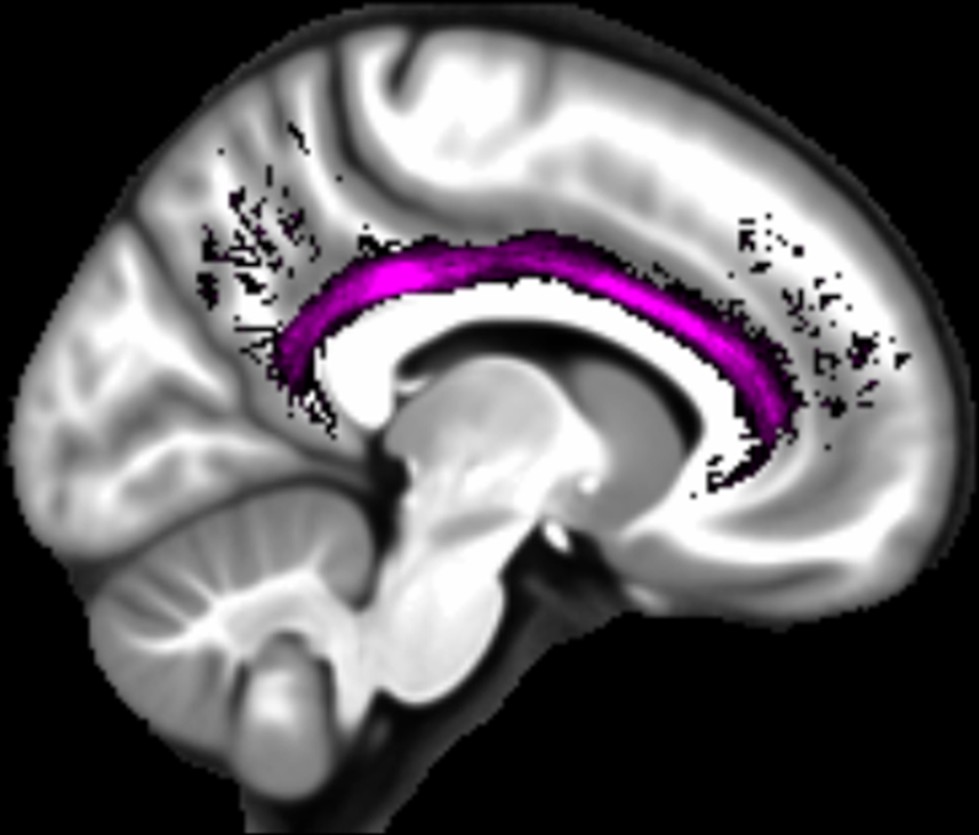
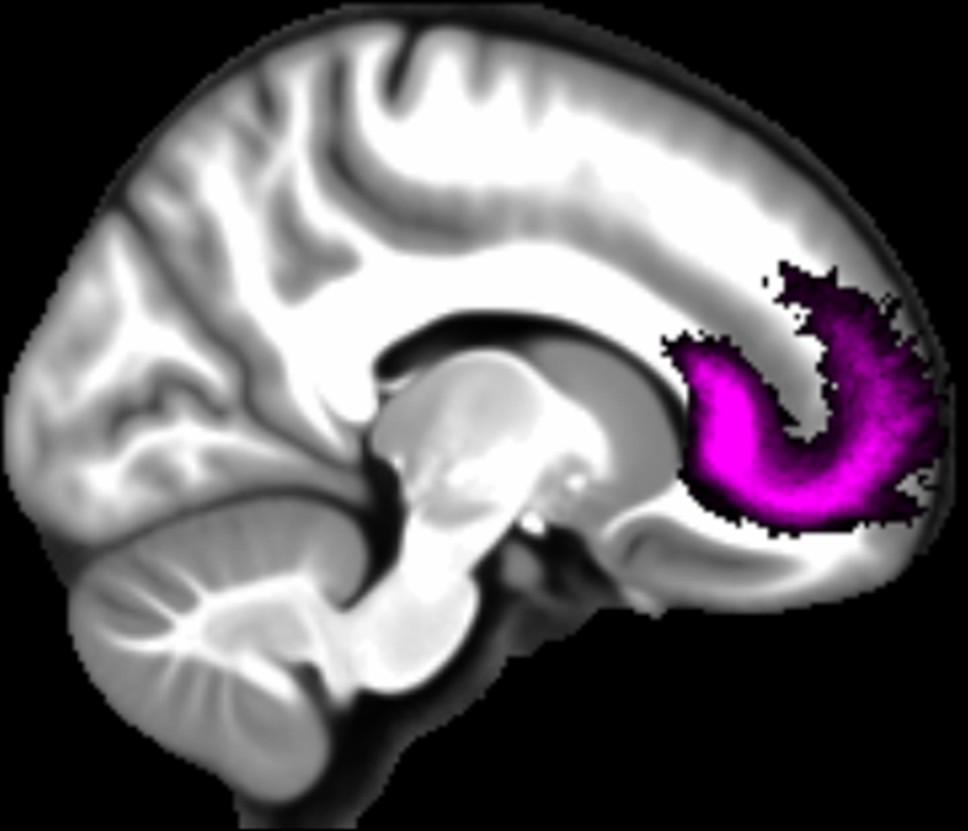
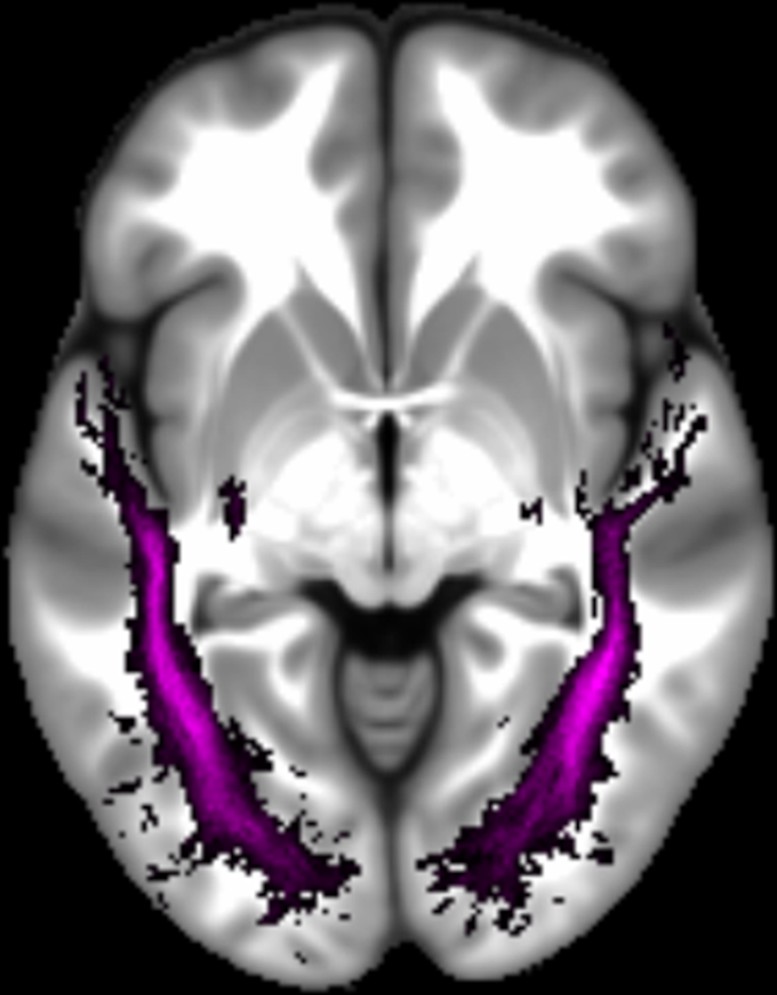
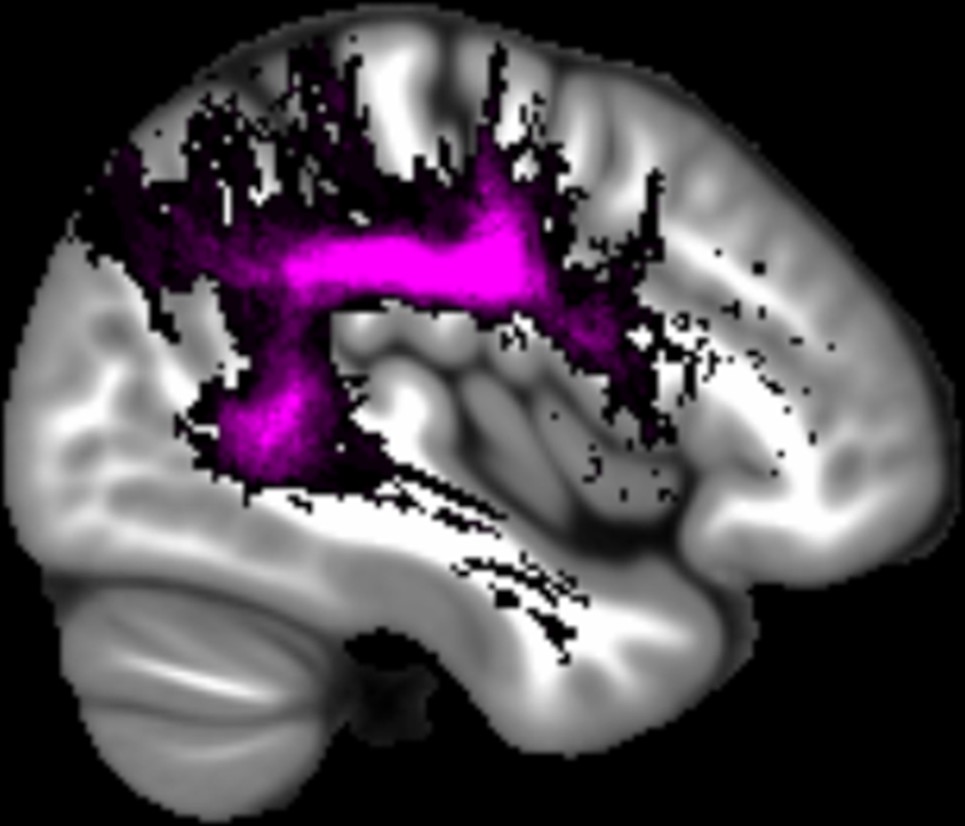
Figure 3
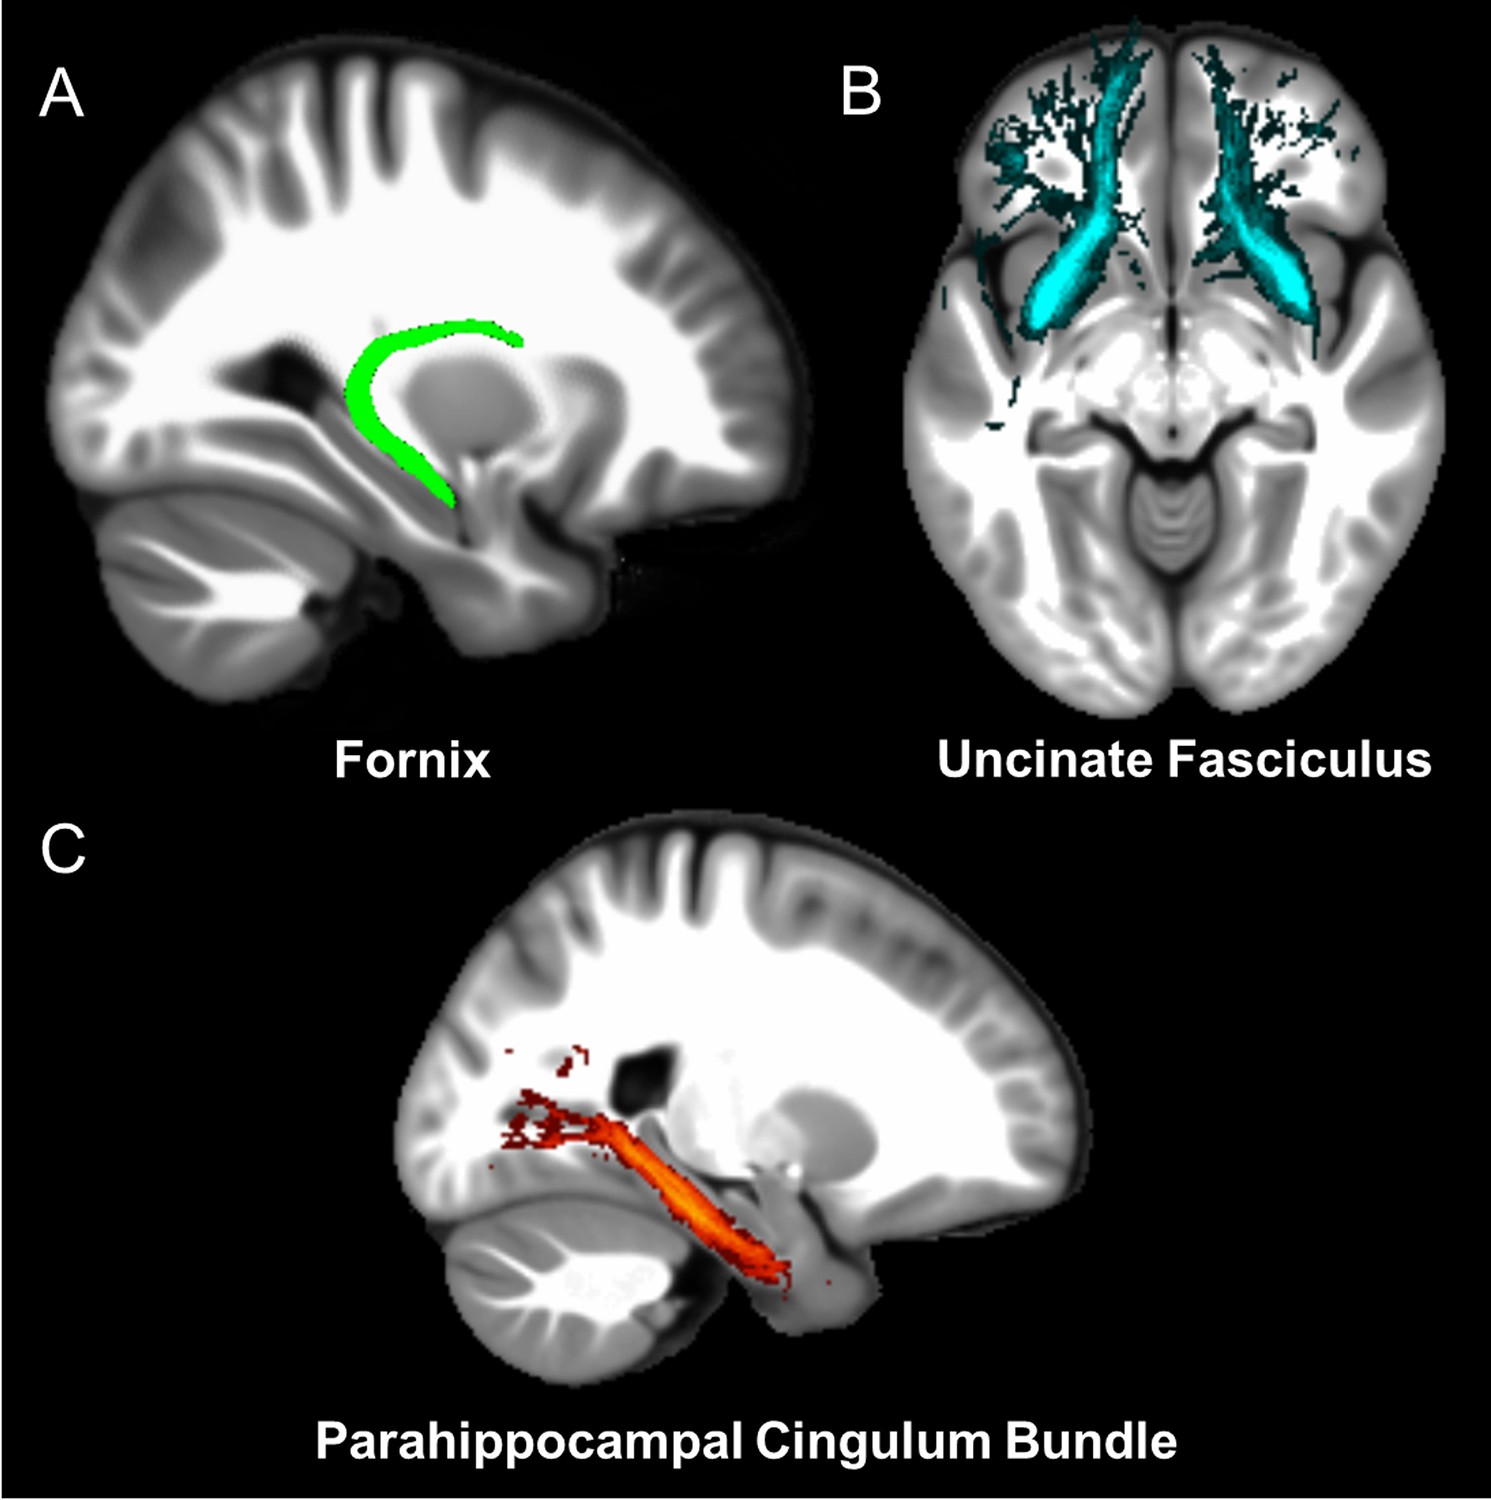
The three white matter tracts of interest, given their relationship with the hippocampal region.
The fornix was defined using the ICBM-DTI-81 white-matter labels atlas (Mori et al., 2008). The uncinate fasciculus and parahippocampal cingulum bundle were defined using the Johns Hopkins probabilistic white matter tractography atlas (Hua et al., 2008), with the minimum probability threshold set to 25%.
Figure 4
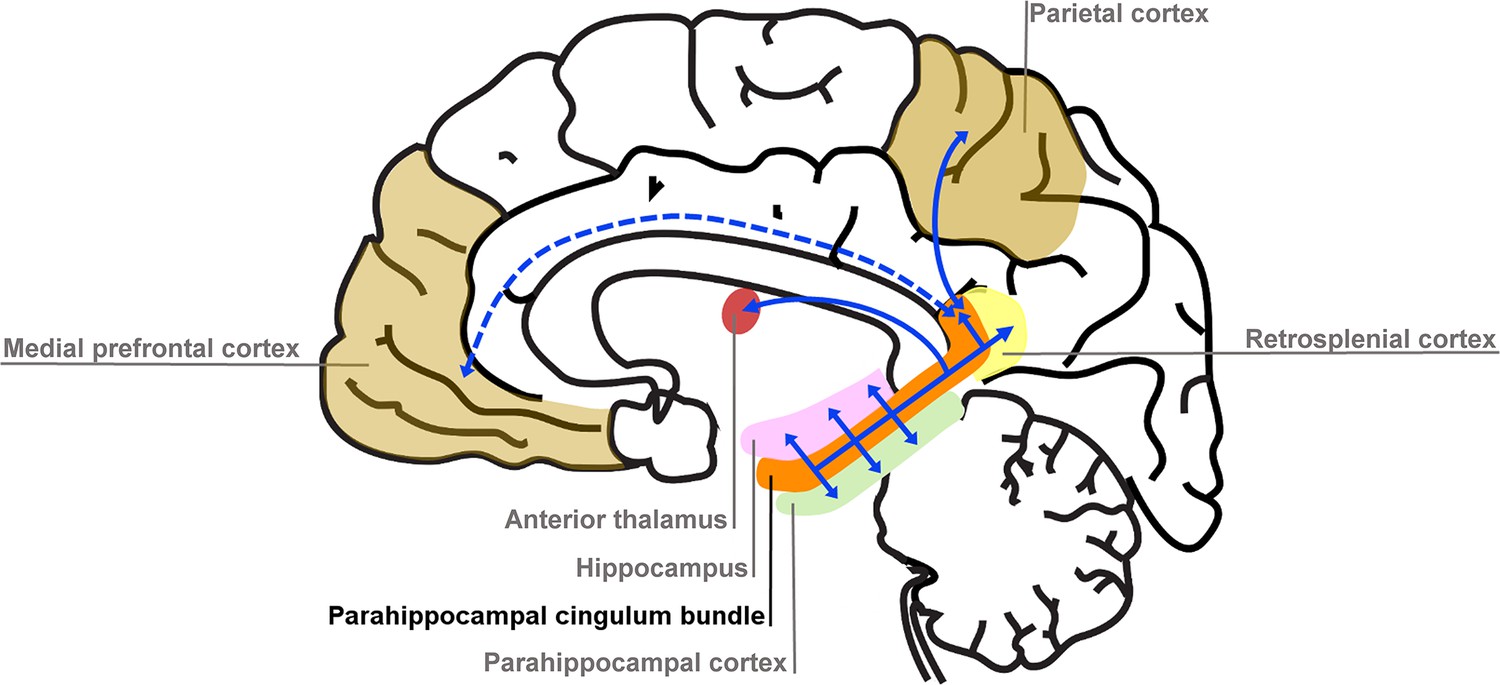
Simplified schematic of the location and main connections of the parahippocampal cingulum bundle.
The blue lines indicate direct connections, and the dashed blue line an indirect connection.
Figure 5

MR g-ratio and the parahippocampal cingulum bundle.
The relationship between parahippocampal cingulum bundle MR g-ratio and autobiographical memory recall ability (internal details), and the control measure (external details) are shown. (A) There was a significant positive correlation between the MR g-ratio and internal details (dashed lines indicate the confidence intervals). (B) There was no significant relationship between the MR g-ratio and external details. (C) Bar chart showing the partial correlation coefficients (with standard errors) between the MR g-ratio and internal and external details. There was a significant difference between the correlations when they were directly compared; ***p<0.001. Data points for this figure are provided in Figure 5—source data 1, n = 217 for all analyses.
-
Figure 5—source data 1
Source data for the data points in Figure 5.
- https://cdn.elifesciences.org/articles/79303/elife-79303-fig5-data1-v1.xlsx
Figure 6
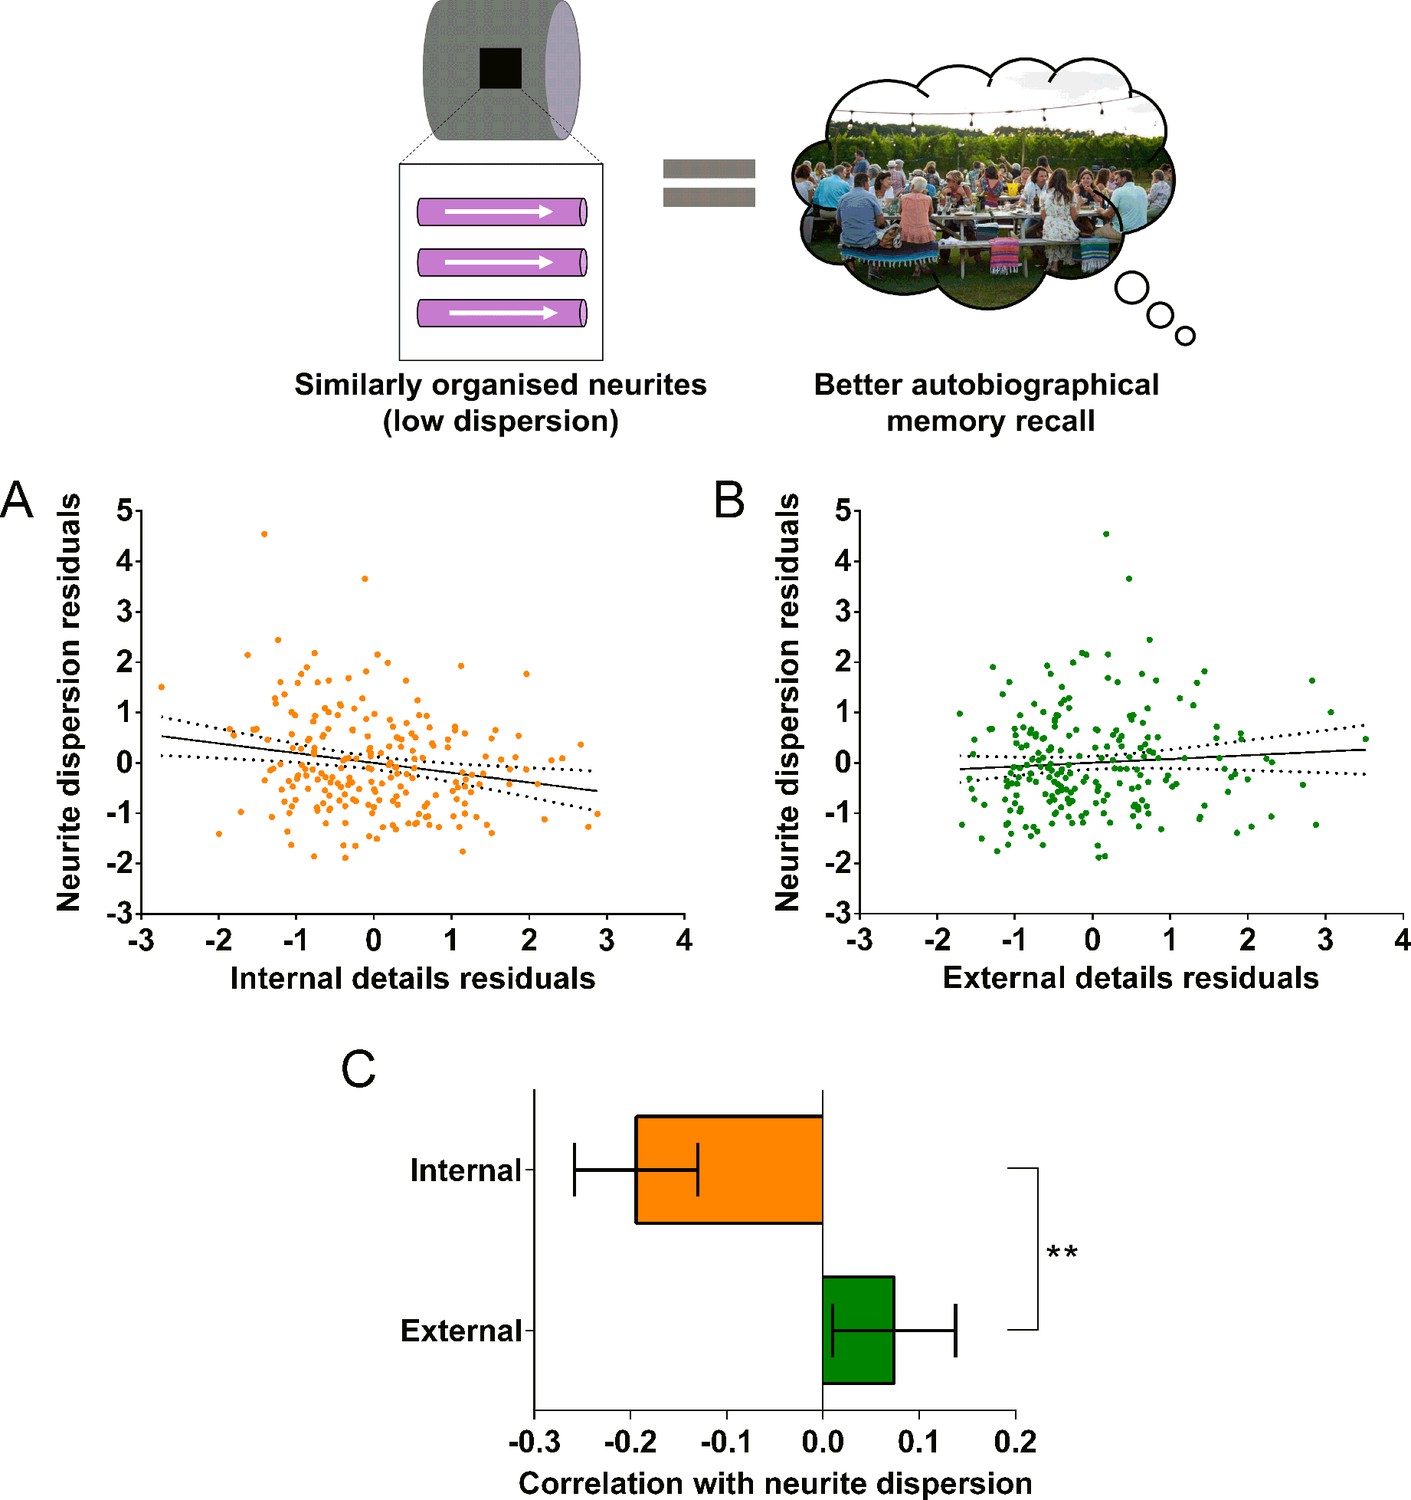
Neurite dispersion and the parahippocampal cingulum bundle.
The relationship between parahippocampal cingulum bundle neurite dispersion (orientation dispersion index) and autobiographical memory recall ability (internal details), and the control measure (external details) are shown. (A) There was a significant negative correlation between neurite dispersion and internal details (dashed lines indicate the confidence intervals). (B) There was no significant relationship between neurite dispersion and external details. (C) Bar chart showing the partial correlation coefficients (with standard errors) between neurite dispersion and internal and external details. There was a significant difference between the correlations when they were directly compared; **p<0.01. Data points for this figure are provided in the Figure 6—source data 1, n = 217 for all analyses.
-
Figure 6—source data 1
Source data for the data points in Figure 6.
- https://cdn.elifesciences.org/articles/79303/elife-79303-fig6-data1-v1.xlsx
Appendix 1—figure 1
The location of the fornix.
Appendix 1—figure 2
The location of the uncinate fasciculus.
Appendix 1—figure 3
The location of the anterior thalamic radiation.
Appendix 1—figure 4
The location of the dorsal cingulum bundle.
Appendix 1—figure 5
The location of the forceps minor.
Appendix 1—figure 6
The location of the inferior longitudinal fasciculus.
Appendix 1—figure 7

The location of the inferior occipitofrontal fasciculus.
Appendix 1—figure 8
The location of the superior longitudinal fasciculus.
Appendix 1—figure 9

Fractional anisotropy (FA) and the parahippocampal cingulum bundle.
The relationships between parahippocampal cingulum bundle FA and autobiographical memory recall ability (internal details), and the control measure (external details) are shown. (A) There was a significant positive correlation between FA and internal details (dashed lines indicate the confidence intervals). (B) There was no significant relationship between FA and external details. (C) Bar chart showing the partial correlation coefficients (with standard errors) between FA and internal and external details. There was a significant difference between the correlations when they were directly compared; **p<0.01. Data points for this figure are provided in Supplementary file 2.
Appendix 1—figure 10
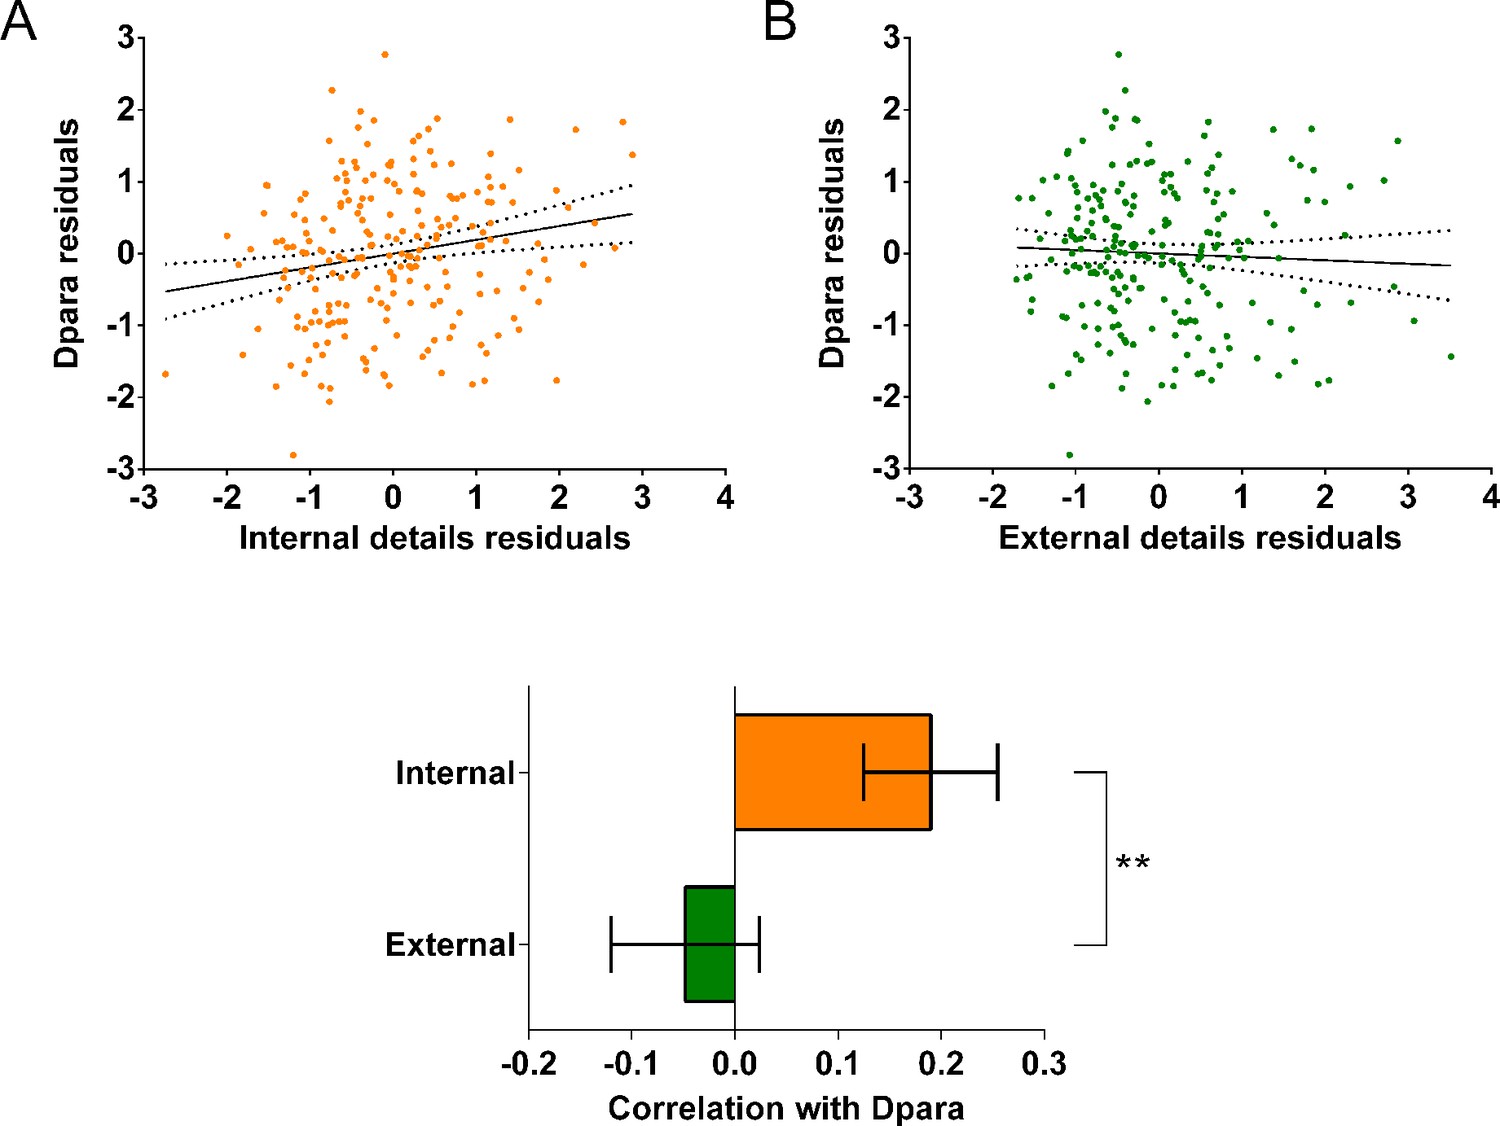
Dpara and the parahippocampal cingulum bundle.
The relationships between parahippocampal cingulum bundle diffusivities parallel (Dpara) and autobiographical memory recall ability (internal details), and the control measure (external details) are shown. (A) There was a significant positive correlation between Dpara and internal details (dashed lines indicate the confidence intervals). (B) There was no significant relationship between Dpara and external details. (C) Bar chart showing the partial correlation coefficients (with standard errors) between Dpara and internal and external details. There was a significant difference between the correlations when they were directly compared; **p<0.01. Data points for this figure are provided in Supplementary file 2.
Tables
Table 1
Means and standard deviations for the microstructure measures from the parahippocampal cingulum bundle.
| Microstructure measure | Mean | Standard deviation |
|---|---|---|
| MR g-ratio | 0.647 | 0.043 |
| Magnetisation transfer saturation | 0.959 | 0.007 |
| Neurite dispersion (ODI) | 0.189 | 0.038 |
| Neurite density | 0.480 | 0.051 |
-
Note. ODI = Orientation Dispersion Index.
Appendix 1—table 1
Means and standard deviations for the microstructure measures and standard DTI parameters extracted from the fornix.
| Measure | Mean | Standard deviation |
|---|---|---|
| MR g-ratio | 0.720 | 0.017 |
| Magnetisation transfer saturation | 0.973 | 0.003 |
| Neurite dispersion (ODI) | 0.143 | 0.021 |
| Neurite density | 0.601 | 0.045 |
| Fractional anisotropy | 0.605 | 0.035 |
| Mean diffusivity (10–3 mm2/s) | 0.901 | 0.036 |
| Mean kurtosis | 0.909 | 0.100 |
| Diffusivities parallel (10–3 mm2/s) | 1.645 | 0.072 |
| Diffusivities perpendicular (10–3 mm2/s) | 0.529 | 0.042 |
-
Note. ODI = Orientation Dispersion Index.
Appendix 1—table 2
Partial correlations between the microstructure measures or standard DTI parameters extracted from the fornix and autobiographical memory recall ability (internal details).
| Measure | r(211) | p | 95% Confidence interval | |
|---|---|---|---|---|
| Lower | Upper | |||
| MR g-ratio | –0.04 | 0.53 | –0.16 | 0.08 |
| Magnetisation transfer saturation | –0.08 | 0.23 | –0.20 | 0.03 |
| Neurite dispersion (ODI) | –0.03 | 0.62 | –0.16 | 0.10 |
| Neurite density | –0.03 | 0.69 | –0.15 | 0.10 |
| Fractional anisotropy | 0.02 | 0.80 | –0.12 | 0.15 |
| Mean diffusivity | 0.07 | 0.35 | –0.08 | 0.21 |
| Mean kurtosis | –0.03 | 0.66 | –0.16 | 0.10 |
| Diffusivities parallel | 0.05 | 0.46 | –0.09 | 0.19 |
| Diffusivities perpendicular | 0.02 | 0.74 | –0.12 | 0.15 |
-
Note. ODI = Orientation Dispersion Index.
Appendix 1—table 3
Means and standard deviations for the microstructure measures and standard DTI parameters extracted from the uncinate fasciculus.
| Measure | Mean | Standard deviation |
|---|---|---|
| MR g-ratio | 0.723 | 0.016 |
| Magnetisation transfer saturation | 0.972 | 0.003 |
| Neurite dispersion (ODI) | 0.189 | 0.022 |
| Neurite density | 0.562 | 0.045 |
| Fractional anisotropy | 0.512 | 0.036 |
| Mean diffusivity (10–3 mm2/s) | 0.877 | 0.304 |
| Mean kurtosis | 0.913 | 0.100 |
| Diffusivities parallel (10–3 mm2/s) | 1.456 | 0.055 |
| Diffusivities perpendicular (10–3 mm2/s) | 0.588 | 0.039 |
-
Note. ODI = Orientation Dispersion Index.
Appendix 1—table 4
Partial correlations between the microstructure measures or standard DTI parameters extracted from the uncinate fasciculus and autobiographical memory recall ability (internal details).
| Measure | r(211) | p | 95% Confidence interval | |
|---|---|---|---|---|
| Lower | Upper | |||
| MR g-ratio | 0.10 | 0.15 | –0.03 | 0.22 |
| Magnetisation transfer saturation | –0.02 | 0.81 | –0.14 | 0.11 |
| Neurite dispersion (ODI) | –0.01 | 0.94 | –0.14 | 0.13 |
| Neurite density | 0.01 | 0.89 | –0.14 | 0.16 |
| Fractional anisotropy | –0.01 | 0.94 | –0.14 | 0.13 |
| Mean diffusivity | –0.01 | 0.87 | –0.14 | 0.13 |
| Mean kurtosis | –0.01 | 0.91 | –0.13 | 0.18 |
| Diffusivities parallel | –0.01 | 0.87 | –0.14 | 0.13 |
| Diffusivities perpendicular | 0.00 | 0.96 | –0.15 | 0.14 |
-
Note. ODI = Orientation Dispersion Index.
Appendix 1—table 5
Partial correlations between the fornix MR g-ratio and magnetisation transfer saturation values and the laboratory-based memory tests.
| Measure | r(211) | p | 95% Confidence interval | |
|---|---|---|---|---|
| Lower | Upper | |||
| MR g-ratio | ||||
| Logical Memory immediate recall | –0.01 | 0.85 | –0.14 | 0.11 |
| Logical Memory delayed recall | –0.07 | 0.33 | –0.19 | 0.06 |
| RAVLT immediate recall | –0.06 | 0.42 | –0.20 | 0.09 |
| RAVLT delayed recall | 0.00 | 0.98 | –0.14 | 0.15 |
| Rey-Osterrieth Complex Figure delayed recall | 0.10 | 0.16 | –0.04 | 0.23 |
| Warrington RMT for Words | 0.04 | 0.59 | –0.08 | 0.16 |
| Warrington RMT for Faces | –0.05 | 0.52 | –0.17 | 0.09 |
| Dead or Alive Test | –0.05 | 0.50 | –0.16 | 0.09 |
| Magnetisation transfer saturation | ||||
| Logical Memory immediate recall | 0.04 | 0.53 | –0.11 | 0.19 |
| Logical Memory delayed recall | 0.11 | 0.11 | –0.04 | 0.26 |
| RAVLT immediate recall | 0.01 | 0.92 | –0.11 | 0.13 |
| RAVLT delayed recall | 0.03 | 0.71 | –0.09 | 0.15 |
| Rey-Osterrieth Complex Figure delayed recall | 0.07 | 0.33 | –0.06 | 0.19 |
| Warrington RMT for Words | 0.06 | 0.41 | –0.05 | 0.17 |
| Warrington RMT for Faces | 0.04 | 0.61 | –0.09 | 0.16 |
| Dead or Alive Test | 0.08 | 0.25 | –0.06 | 0.21 |
-
Note. RAVLT = Rey Auditory Verbal Learning Test; RMT = Recognition Memory Test.
Appendix 1—table 6
Partial correlations between the uncinate fasciculus MR g-ratio and magnetisation transfer saturation values and the laboratory-based memory tests.
| Measure | r(211) | p | 95% Confidence interval | |
|---|---|---|---|---|
| Lower | Upper | |||
| MR g-ratio | ||||
| Logical Memory immediate recall | 0.07 | 0.34 | –0.06 | 0.19 |
| Logical Memory delayed recall | 0.04 | 0.34 | –0.09 | 0.17 |
| RAVLT immediate recall | 0.00 | 0.98 | –0.14 | 0.13 |
| RAVLT delayed recall | 0.06 | 0.40 | –0.10 | 0.21 |
| Rey-Osterrieth Complex Figure delayed recall | 0.01 | 0.94 | –0.13 | 0.15 |
| Warrington RMT for Words | –0.01 | 0.86 | –0.16 | 0.15 |
| Warrington RMT for Faces | –0.07 | 0.34 | –0.20 | 0.06 |
| Dead or Alive Test | –0.04 | 0.60 | –0.15 | 0.08 |
| Magnetisation transfer saturation | ||||
| Logical Memory immediate recall | –0.04 | 0.53 | –0.17 | 0.09 |
| Logical Memory delayed recall | –0.05 | 0.49 | –0.18 | 0.09 |
| RAVLT immediate recall | –0.13 | 0.06 | –0.26 | 0.01 |
| RAVLT delayed recall | –0.16 | 0.02 | –0.27 | –0.03 |
| Rey-Osterrieth Complex Figure delayed recall | –0.07 | 0.33 | –0.20 | 0.07 |
| Warrington RMT for Words | –0.14 | 0.04 | –0.26 | –0.01 |
| Warrington RMT for Faces | –0.05 | 0.44 | –0.18 | 0.09 |
| Dead or Alive Test | –0.01 | 0.93 | –0.14 | 0.13 |
-
Note. RAVLT = Rey Auditory Verbal Learning Test; RMT = Recognition Memory Test.
Appendix 1—table 7
Means and standard deviations for the microstructure measures and standard DTI parameters extracted from the anterior thalamic radiation.
| Measure | Mean | Standard deviation |
|---|---|---|
| MR g-ratio | 0.724 | 0.014 |
| Magnetisation transfer saturation | 0.986 | 0.001 |
| Neurite dispersion (ODI) | 0.252 | 0.017 |
| Neurite density | 0.598 | 0.041 |
| Fractional anisotropy | 0.430 | 0.028 |
| Mean diffusivity (10–3 mm2/s) | 0.861 | 0.029 |
| Mean kurtosis | 0.986 | 0.063 |
| Diffusivities parallel (10–3 mm2/s) | 1.328 | 0.041 |
| Diffusivities perpendicular (10–3 mm2/s) | 0.627 | 0.034 |
-
Note. ODI = Orientation Dispersion Index.
Appendix 1—table 8
Partial correlations between the microstructure measures or standard DTI parameters extracted from the anterior thalamic radiation and autobiographical memory recall ability (internal details).
| Measure | r(211) | p | 95% Confidence interval | |
|---|---|---|---|---|
| Lower | Upper | |||
| MR g-ratio | 0.05 | 0.47 | –0.06 | 0.17 |
| MT sat | –0.08 | 0.26 | –0.20 | 0.04 |
| Neurite dispersion (ODI) | –0.05 | 0.46 | –0.18 | 0.09 |
| Neurite density | 0.10 | 0.16 | –0.04 | 0.23 |
| Fractional anisotropy | 0.08 | 0.26 | –0.06 | 0.21 |
| Mean diffusivity | 0.03 | 0.67 | –0.11 | 0.17 |
| Mean kurtosis | 0.07 | 0.28 | –0.07 | 0.22 |
| Diffusivities parallel | 0.09 | 0.20 | –0.04 | 0.21 |
| Diffusivities perpendicular | –0.02 | 0.77 | –0.16 | 0.12 |
-
Note. MT sat = Magnetisation Transfer saturation; ODI = Orientation Dispersion Index.
Appendix 1—table 9
Means and standard deviations for the microstructure measures and standard DTI parameters extracted from the dorsal cingulum bundle.
| Measure | Mean | Standard deviation |
|---|---|---|
| MR g-ratio | 0.710 | 0.016 |
| Magnetisation transfer saturation | 0.984 | 0.003 |
| Neurite dispersion (ODI) | 0.147 | 0.019 |
| Neurite density | 0.560 | 0.038 |
| Fractional anisotropy | 0.570 | 0.039 |
| Mean diffusivity (10–3 mm2/s) | 0.862 | 0.026 |
| Mean kurtosis | 0.862 | 0.093 |
| Diffusivities parallel (10–3 mm2/s) | 1.531 | 0.061 |
| Diffusivities perpendicular (10–3 mm2/s) | 0.527 | 0.040 |
-
Note. ODI = Orientation Dispersion Index.
Appendix 1—table 10
Partial correlations between the microstructure measures or standard DTI parameters extracted from the dorsal cingulum bundle and autobiographical memory recall ability (internal details).
| Measure | r(211) | p | 95% Confidence interval | |
|---|---|---|---|---|
| Lower | Upper | |||
| MR g-ratio | 0.09 | 0.22 | –0.04 | 0.21 |
| MT sat | 0.08 | 0.23 | –0.04 | 0.21 |
| Neurite dispersion (ODI) | 0.09 | 0.17 | –0.05 | 0.23 |
| Neurite density | 0.09 | 0.17 | –0.05 | 0.23 |
| Fractional anisotropy | 0.01 | 0.85 | –0.13 | 0.16 |
| Mean diffusivity | 0.06 | 0.43 | –0.08 | 0.19 |
| Mean kurtosis | 0.13 | 0.05 | 0.00 | 0.27 |
| Diffusivities parallel | 0.05 | 0.48 | –0.08 | 0.18 |
| Diffusivities perpendicular | 0.01 | 0.91 | –0.14 | 0.15 |
-
Note. MT sat = Magnetisation Transfer saturation; ODI = Orientation Dispersion Index.
Appendix 1—table 11
Means and standard deviations for the microstructure measures and standard DTI parameters extracted from the forceps minor.
| Measure | Mean | Standard deviation |
|---|---|---|
| MR g-ratio | 0.698 | 0.026 |
| Magnetisation transfer saturation | 0.993 | 0.002 |
| Neurite dispersion (ODI) | 0.201 | 0.016 |
| Neurite density | 0.601 | 0.042 |
| Fractional anisotropy | 0.500 | 0.027 |
| Mean diffusivity (10–3 mm2/s) | 0.881 | 0.031 |
| Mean kurtosis | 0.947 | 0.128 |
| Diffusivities parallel (10–3 mm2/s) | 1.467 | 0.052 |
| Diffusivities perpendicular (10–3 mm2/s) | 0.588 | 0.034 |
-
Note. ODI = Orientation Dispersion Index.
Appendix 1—table 12
Partial correlations between the microstructure measures or standard DTI parameters extracted from the forceps minor and autobiographical memory recall ability (internal details).
| Measure | r(211) | p | 95% Confidence interval | |
|---|---|---|---|---|
| Lower | Upper | |||
| MR g-ratio | 0.04 | 0.53 | –0.07 | 0.18 |
| MT sat | 0.07 | 0.34 | –0.06 | 0.19 |
| Neurite dispersion (ODI) | –0.06 | 0.38 | –0.21 | 0.07 |
| Neurite density | 0.09 | 0.19 | –0.04 | 0.22 |
| Fractional anisotropy | 0.10 | 0.17 | –0.03 | 0.23 |
| Mean diffusivity | –0.04 | 0.56 | –0.17 | 0.09 |
| Mean kurtosis | 0.00 | 0.97 | –0.11 | 0.21 |
| Diffusivities parallel | 0.03 | 0.67 | –0.09 | 0.18 |
| Diffusivities perpendicular | –0.07 | 0.32 | –0.19 | 0.05 |
-
Note. MT sat = Magnetisation Transfer saturation; ODI = Orientation Dispersion Index.
Appendix 1—table 13
Means and standard deviations for the microstructure measures and standard DTI parameters extracted from the inferior longitudinal fasciculus.
| Measure | Mean | Standard deviation |
|---|---|---|
| MR g-ratio | 0.724 | 0.013 |
| Magnetisation transfer saturation | 0.994 | 0.002 |
| Neurite dispersion (ODI) | 0.184 | 0.017 |
| Neurite density | 0.558 | 0.041 |
| Fractional anisotropy | 0.486 | 0.028 |
| Mean diffusivity (10–3 mm2/s) | 0.902 | 0.029 |
| Mean kurtosis | 0.918 | 0.061 |
| Diffusivities parallel (10–3 mm2/s) | 1.473 | 0.045 |
| Diffusivities perpendicular (10–3 mm2/s) | 0.616 | 0.035 |
-
Note. ODI = Orientation Dispersion Index.
Appendix 1—table 14
Partial correlations between the microstructure measures or standard DTI parameters extracted from the inferior longitudinal fasciculus and autobiographical memory recall ability (internal details).
| Measure | r(211) | p | 95% Confidence interval | |
|---|---|---|---|---|
| Lower | Upper | |||
| MR g-ratio | 0.07 | 0.35 | –0.06 | 0.19 |
| MT sat | 0.07 | 0.35 | –0.05 | 0.18 |
| Neurite dispersion (ODI) | –0.03 | 0.64 | –0.17 | 0.10 |
| Neurite density | 0.07 | 0.35 | –0.07 | 0.19 |
| Fractional anisotropy | 0.10 | 0.14 | –0.04 | 0.23 |
| Mean diffusivity | –0.01 | 0.87 | –0.15 | 0.13 |
| Mean kurtosis | 0.10 | 0.16 | –0.03 | 0.23 |
| Diffusivities parallel | 0.07 | 0.29 | –0.07 | 0.21 |
| Diffusivities perpendicular | –0.07 | 0.34 | –0.19 | 0.07 |
-
Note. MT sat = Magnetisation Transfer saturation; ODI = Orientation Dispersion Index.
Appendix 1—table 15
Means and standard deviations for the microstructure measures and standard DTI parameters extracted from the inferior occipitofrontal fasciculus.
| Measure | Mean | Standard deviation |
|---|---|---|
| MR g-ratio | 0.729 | 0.011 |
| Magnetisation transfer saturation | 0.995 | 0.001 |
| Neurite dispersion (ODI) | 0.179 | 0.012 |
| Neurite density | 0.563 | 0.036 |
| Fractional anisotropy | 0.508 | 0.024 |
| Mean diffusivity (10–3 mm2/s) | 0.889 | 0.026 |
| Mean kurtosis | 0.912 | 0.057 |
| Diffusivities parallel (10–3 mm2/s) | 1.488 | 0.039 |
| Diffusivities perpendicular (10–3 mm2/s) | 0.590 | 0.031 |
-
Note. ODI = Orientation Dispersion Index.
Appendix 1—table 16
Partial correlations between the microstructure measures or standard DTI parameters extracted from the inferior occipitofrontal fasciculus and autobiographical memory recall ability (internal details).
| Measure | r(211) | p | 95% Confidence interval | |
|---|---|---|---|---|
| Lower | Upper | |||
| MR g-ratio | –0.01 | 0.93 | –0.12 | 0.12 |
| MT sat | 0.08 | 0.22 | –0.03 | 0.19 |
| Neurite dispersion (ODI) | –0.01 | 0.89 | –0.14 | 0.13 |
| Neurite density | 0.06 | 0.42 | –0.07 | 0.18 |
| Fractional anisotropy | 0.06 | 0.38 | –0.08 | 0.20 |
| Mean diffusivity | 0.00 | 0.99 | –0.13 | 0.13 |
| Mean kurtosis | 0.07 | 0.31 | –0.06 | 0.19 |
| Diffusivities parallel | 0.05 | 0.50 | –0.09 | 0.18 |
| Diffusivities perpendicular | –0.03 | 0.62 | –0.17 | 0.10 |
-
Note. MT sat = Magnetisation Transfer saturation; ODI = Orientation Dispersion Index.
Appendix 1—table 17
Means and standard deviations for the microstructure measures and standard DTI parameters extracted from the superior longitudinal fasciculus.
| Measure | Mean | Standard deviation |
|---|---|---|
| MR g-ratio | 0.751 | 0.011 |
| Magnetisation transfer saturation | 0.996 | 0.001 |
| Neurite dispersion (ODI) | 0.218 | 0.012 |
| Neurite density | 0.634 | 0.034 |
| Fractional anisotropy | 0.471 | 0.026 |
| Mean diffusivity (10–3 mm2/s) | 0.825 | 0.025 |
| Mean kurtosis | 1.029 | 0.041 |
| Diffusivities parallel (10–3 mm2/s) | 1.324 | 0.035 |
| Diffusivities perpendicular (10–3 mm2/s) | 0.575 | 0.041 |
-
Note. ODI = Orientation Dispersion Index.
Appendix 1—table 18
Partial correlations between microstructure measures or standard DTI parameters extracted from the superior longitudinal fasciculus and autobiographical memory recall ability (internal details).
| Measure | r(211) | p | 95% Confidence interval | |
|---|---|---|---|---|
| Lower | Upper | |||
| MR g-ratio | 0.08 | 0.28 | –0.05 | 0.20 |
| MT sat | –0.04 | 0.54 | –0.16 | 0.08 |
| Neurite dispersion (ODI) | –0.09 | 0.17 | –0.23 | 0.05 |
| Neurite density | 0.12 | 0.09 | –0.01 | 0.24 |
| Fractional anisotropy | 0.13 | 0.05 | 0.01 | 0.26 |
| Mean diffusivity | –0.02 | 0.80 | –0.14 | 0.11 |
| Mean kurtosis | 0.11 | 0.12 | –0.03 | 0.24 |
| Diffusivities parallel | 0.12 | 0.09 | –0.03 | 0.25 |
| Diffusivities perpendicular | –0.08 | 0.23 | –0.20 | 0.03 |
-
Note. MT sat = Magnetisation Transfer saturation; ODI = Orientation Dispersion Index.
Appendix 1—table 19
Means and standard deviations for the standard DTI parameters extracted from the parahippocampal cingulum bundle.
| Measure | Mean | Standard deviation |
|---|---|---|
| Fractional anisotropy | 0.466 | 0.053 |
| Mean diffusivity (10–3 mm2/s) | 0.931 | 0.041 |
| Mean kurtosis | 0.779 | 0.122 |
| Diffusivities parallel (10–3 mm2/s) | 1.479 | 0.071 |
| Diffusivities perpendicular (10–3 mm2/s) | 0.656 | 0.057 |
Appendix 1—table 20
Partial correlations between the standard DTI parameters extracted from the parahippocampal cingulum bundle and autobiographical memory recall ability (internal details).
Appendix 1—table 21
Partial correlations between the parahippocampal cingulum bundle MR g-ratio and magnetisation transfer saturation values and the laboratory-based memory tests.
| Measure | r(211) | p | 95% Confidence interval | |
|---|---|---|---|---|
| Lower | Upper | |||
| MR g-ratio | ||||
| Logical Memory immediate recall | 0.01 | 0.93 | –0.13 | 0.13 |
| Logical Memory delayed recall | –0.05 | 0.46 | –0.18 | 0.08 |
| RAVLT immediate recall | –0.06 | 0.41 | –0.18 | 0.07 |
| RAVLT delayed recall | –0.09 | 0.17 | –0.21 | 0.04 |
| Rey-Osterrieth Complex Figure delayed recall | 0.07 | 0.34 | –0.06 | 0.19 |
| Warrington RMT for Words | 0.02 | 0.80 | –0.11 | 0.16 |
| Warrington RMT for Faces | –0.04 | 0.53 | –0.17 | 0.10 |
| Dead or Alive Test | 0.02 | 0.79 | –0.11 | 0.15 |
| Magnetisation transfer saturation | ||||
| Logical Memory immediate recall | 0.07 | 0.35 | –0.06 | 0.19 |
| Logical Memory delayed recall | 0.01 | 0.91 | –0.12 | 0.14 |
| RAVLT immediate recall | –0.01 | 0.90 | –0.14 | 0.14 |
| RAVLT delayed recall | –0.02 | 0.80 | –0.14 | 0.11 |
| Rey-Osterrieth Complex Figure delayed recall | –0.09 | 0.21 | –0.23 | 0.05 |
| Warrington RMT for Words | –0.09 | 0.21 | –0.22 | 0.04 |
| Warrington RMT for Faces | –0.05 | 0.49 | –0.17 | 0.09 |
| Dead or Alive Test | 0.11 | 0.11 | –0.01 | 0.23 |
-
Note. RAVLT = Rey Auditory Verbal Learning Test; RMT = Recognition Memory Test.
Additional files
-
Supplementary file 1
Microstructure and standard DTI parameters data for the fornix and uncinate fasciculus.
- https://cdn.elifesciences.org/articles/79303/elife-79303-supp1-v1.xlsx
-
Supplementary file 2
Microstructure and standard DTI parameters data for the parahippocampal cingulum bundle and source data for Appendix 1—figures 9 and 10.
- https://cdn.elifesciences.org/articles/79303/elife-79303-supp2-v1.xlsx
-
MDAR checklist
- https://cdn.elifesciences.org/articles/79303/elife-79303-mdarchecklist1-v1.docx
Download links
A two-part list of links to download the article, or parts of the article, in various formats.
Downloads (link to download the article as PDF)
Open citations (links to open the citations from this article in various online reference manager services)
Cite this article (links to download the citations from this article in formats compatible with various reference manager tools)
Conduction velocity along a key white matter tract is associated with autobiographical memory recall ability
eLife 11:e79303.
https://doi.org/10.7554/eLife.79303


