A nanobody toolbox to investigate localisation and dynamics of Drosophila titins and other key sarcomeric proteins
- Turing Centre for Living Systems, Aix-Marseille University, CNRS, IDBM, France
- Department of Cellular Logistics, Max Planck Institute for Multidisciplinary Sciences, Germany
Figures
Figure 1
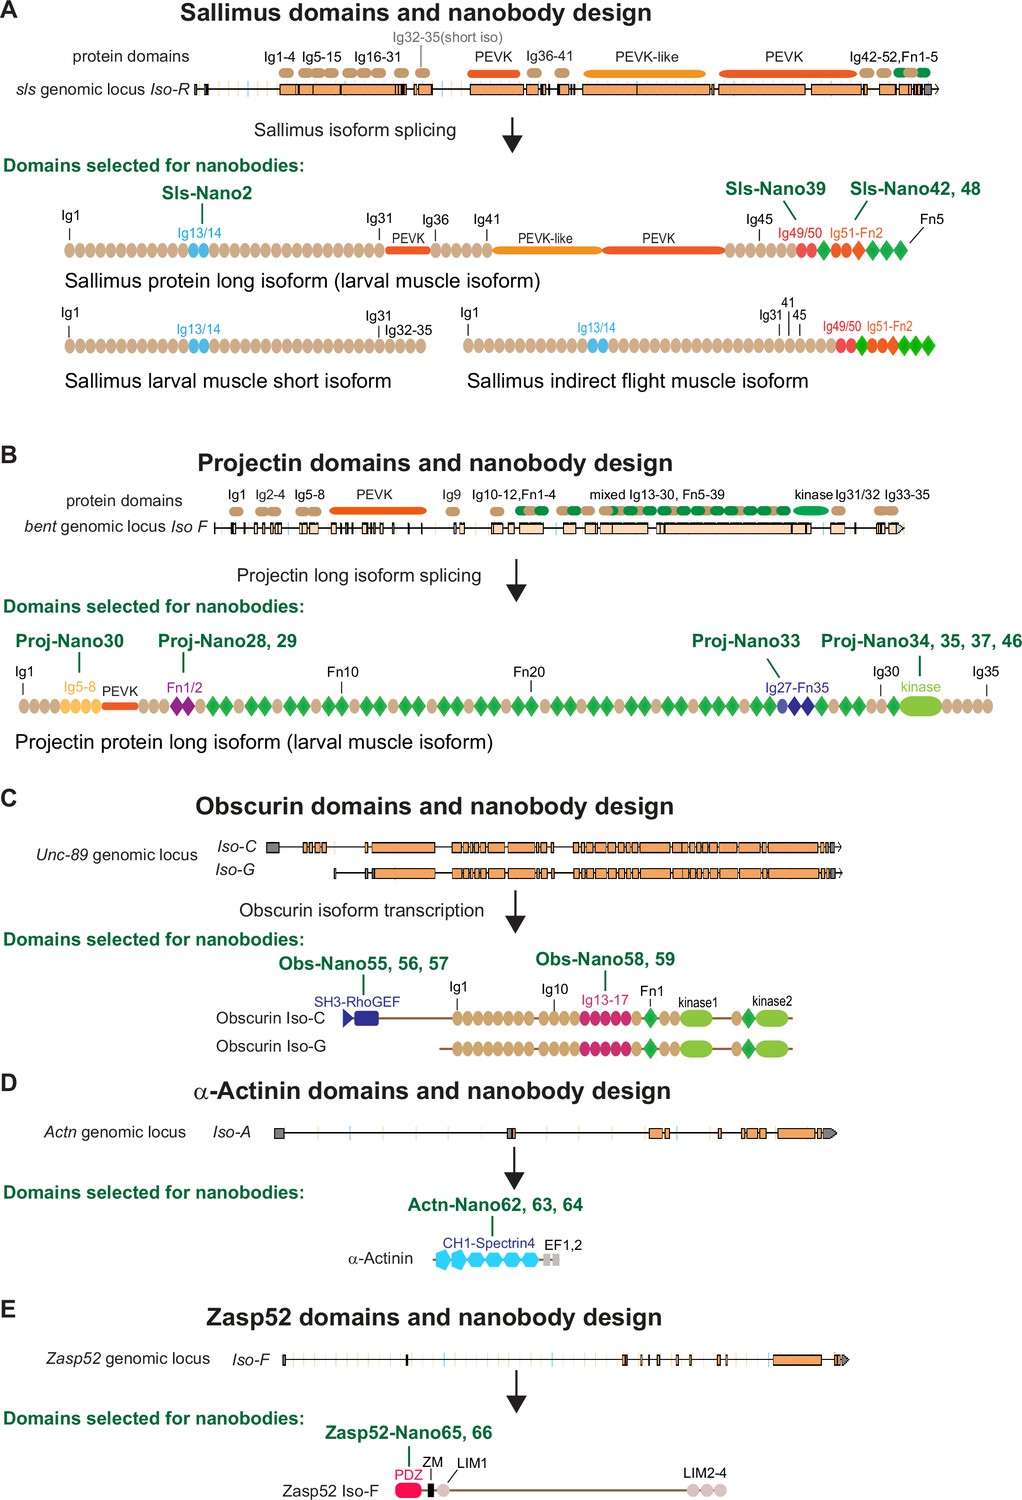
Drosophila nanobody design.
(A–E) Schematic of Sallimus (A), Projectin (B), Obscurin (C), α-Actinin (D), and Zasp52 (E) genes and their protein domain organisation. Top: genome loci taken from Flybase with exons represented by orange boxes and introns by black lines. The coded protein domains are overlayed with Immunoglobulin (Ig) domains in brown, proline, valine, glutamic acid, and lysine (PEVK) in orange, Fibronectin (Fn) and kinase domains in green for Sls and Projectin. Bottom: predicted domain organisation of the proteins in the respective isoforms. Domains selected for nanobody production are highlighted by special colours, and the names of the respective nanobodies are indicated above the protein.
Figure 2
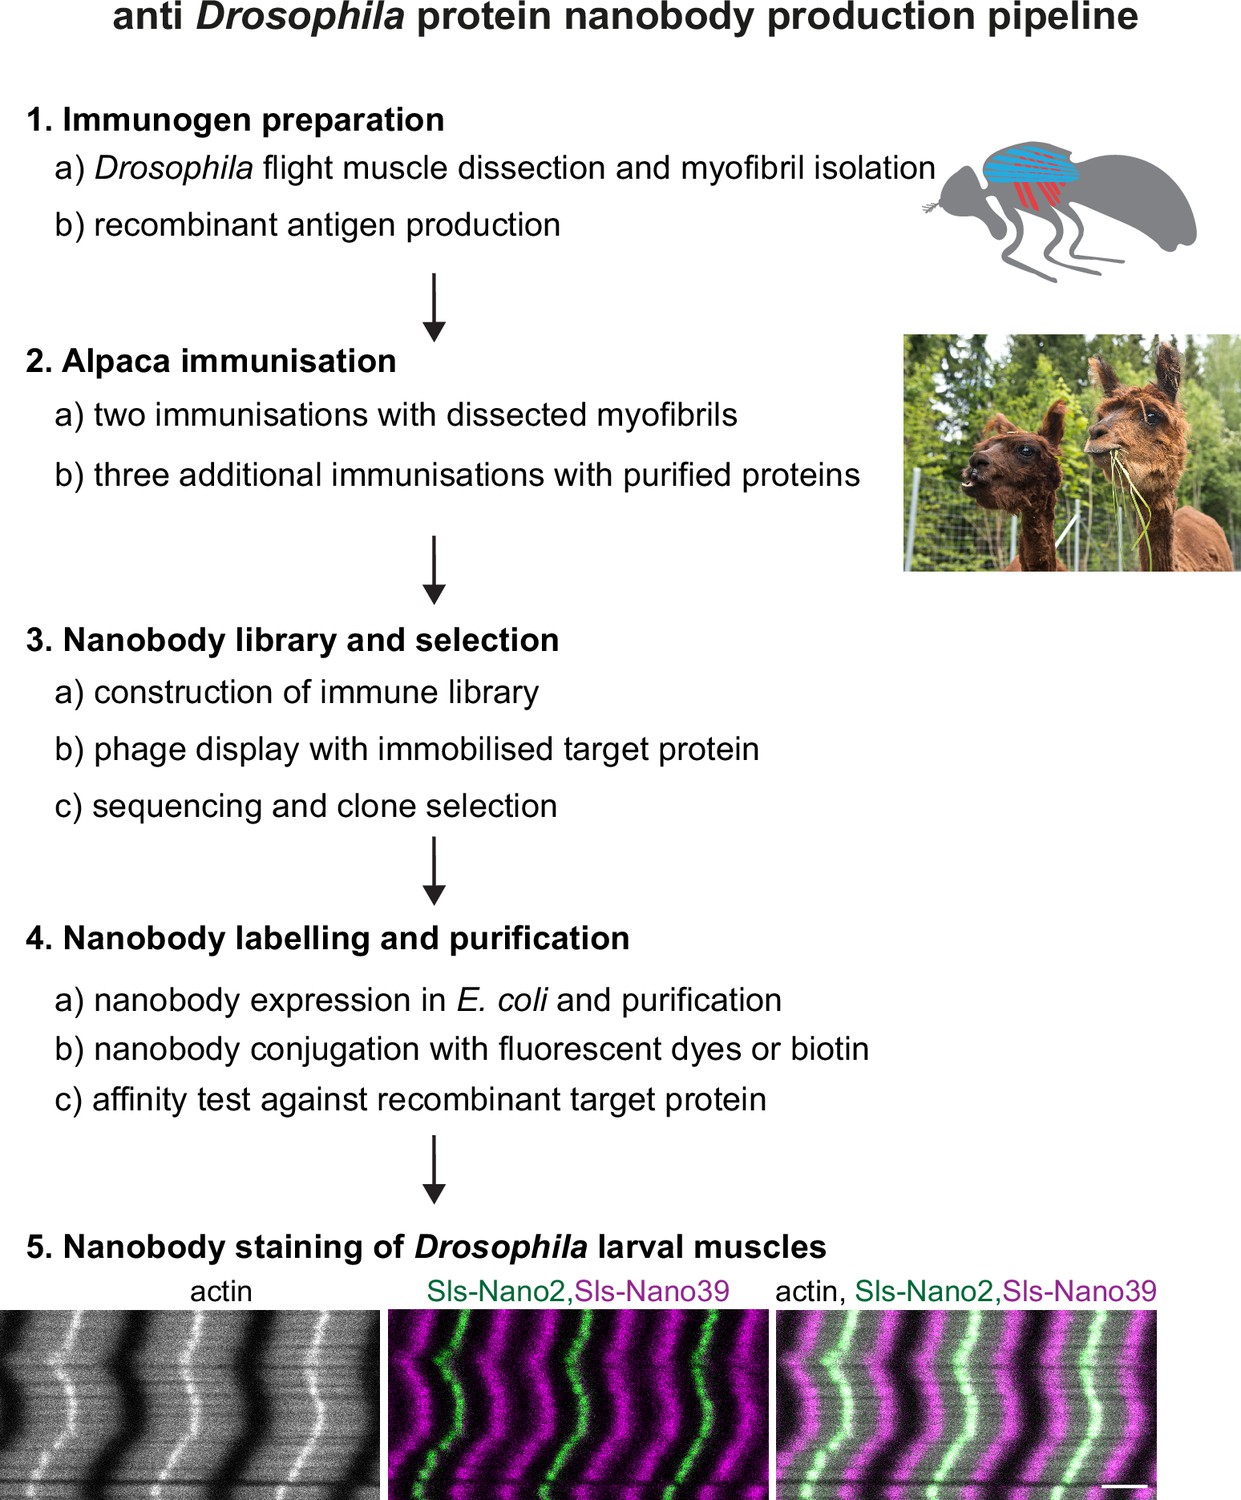
Nanobody production pipeline.
Overview of our optimised nanobody production pipeline against Drosophila sarcomeric protein domains. See text for details. Scale bar is 3 µm.
Figure 3

Nanobody labelling and affinity test.
(A) Sodium dodecyl sulfate–polyacrylamide gel electrophoresis gel documenting the expression, purification, tag cleavage, and labelling of a nanobody, here Sls-Nano2. Top part stained with Coomassie blue, lower part shows fluorescence of the same gel. Note the efficiency of the labelling (essentially quantitative) by the size shift of the bands. (B) Nanobody affinity assay. Sls-Nano2-biotin was immobilised to high precision streptavidin Octet sensors to a binding signal of 0.4 nm. After washing, the target domain Sls-Ig13/14 was allowed to bind at the indicated concentration for 200 s (beige box), followed by a 900 s dissociation step (pink box). A global fit of the curves indicates a 10 pM KD.
-
Figure 3—source data 1
SDS-PAGE of a nanobody purification and labelling example.
- https://cdn.elifesciences.org/articles/79343/elife-79343-fig3-data1-v2.zip
Figure 4 with 2 supplements
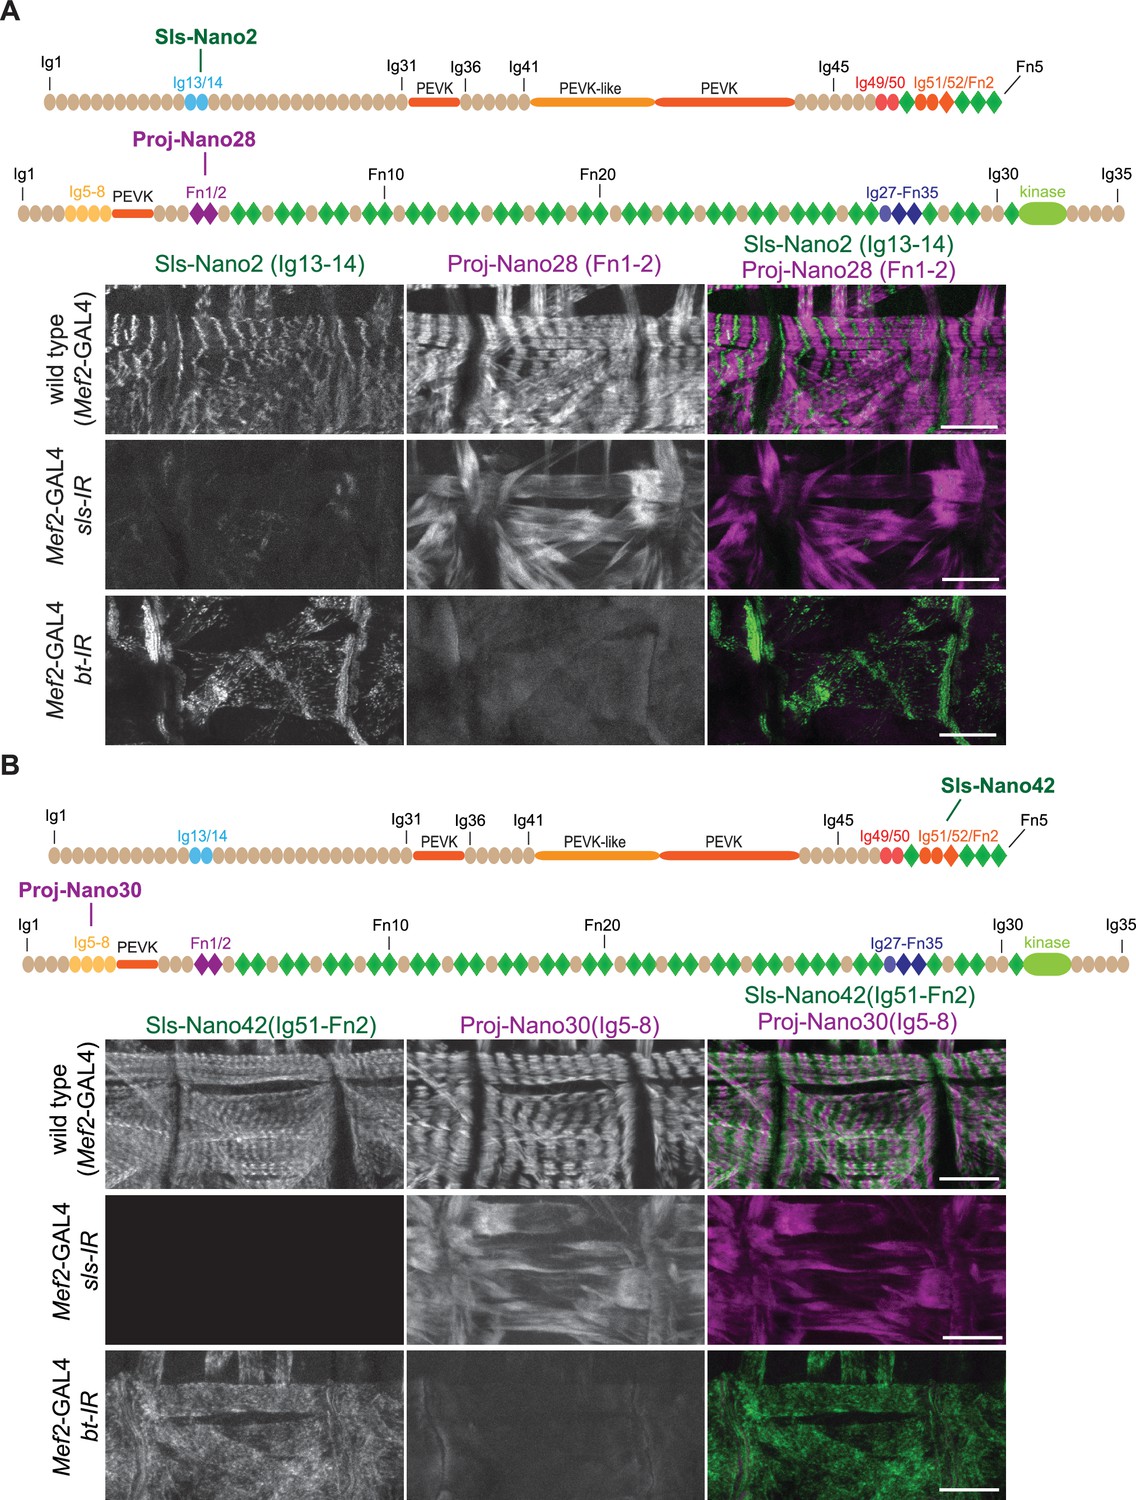
Anti-Sallimus and Projectin nanobody specificity.
(A and B) Top: schematic representation of Sallimus or Projectin domains with nanobodies used for stainings. Bottom: scanning confocal images of stage 17 embryos of wild-type (Mef2-GAL4) and muscle-specific sls or bt knock-down (Mef2-GAL4, UAS-sls-IR and Mef2-GAL4, UAS-bt-IR, respectively) stained with Sls (green) and Projectin (magenta) nanobodies Sls-Nano2 and Proj-Nano28 (A) or Sls-Nano42 and Proj-Nano30 (B). Note the striated pattern of Sls and Projectin in wild type, which is lost upon knock-down of one component. Scale bars are 20 µm.
Figure 4—figure supplement 1
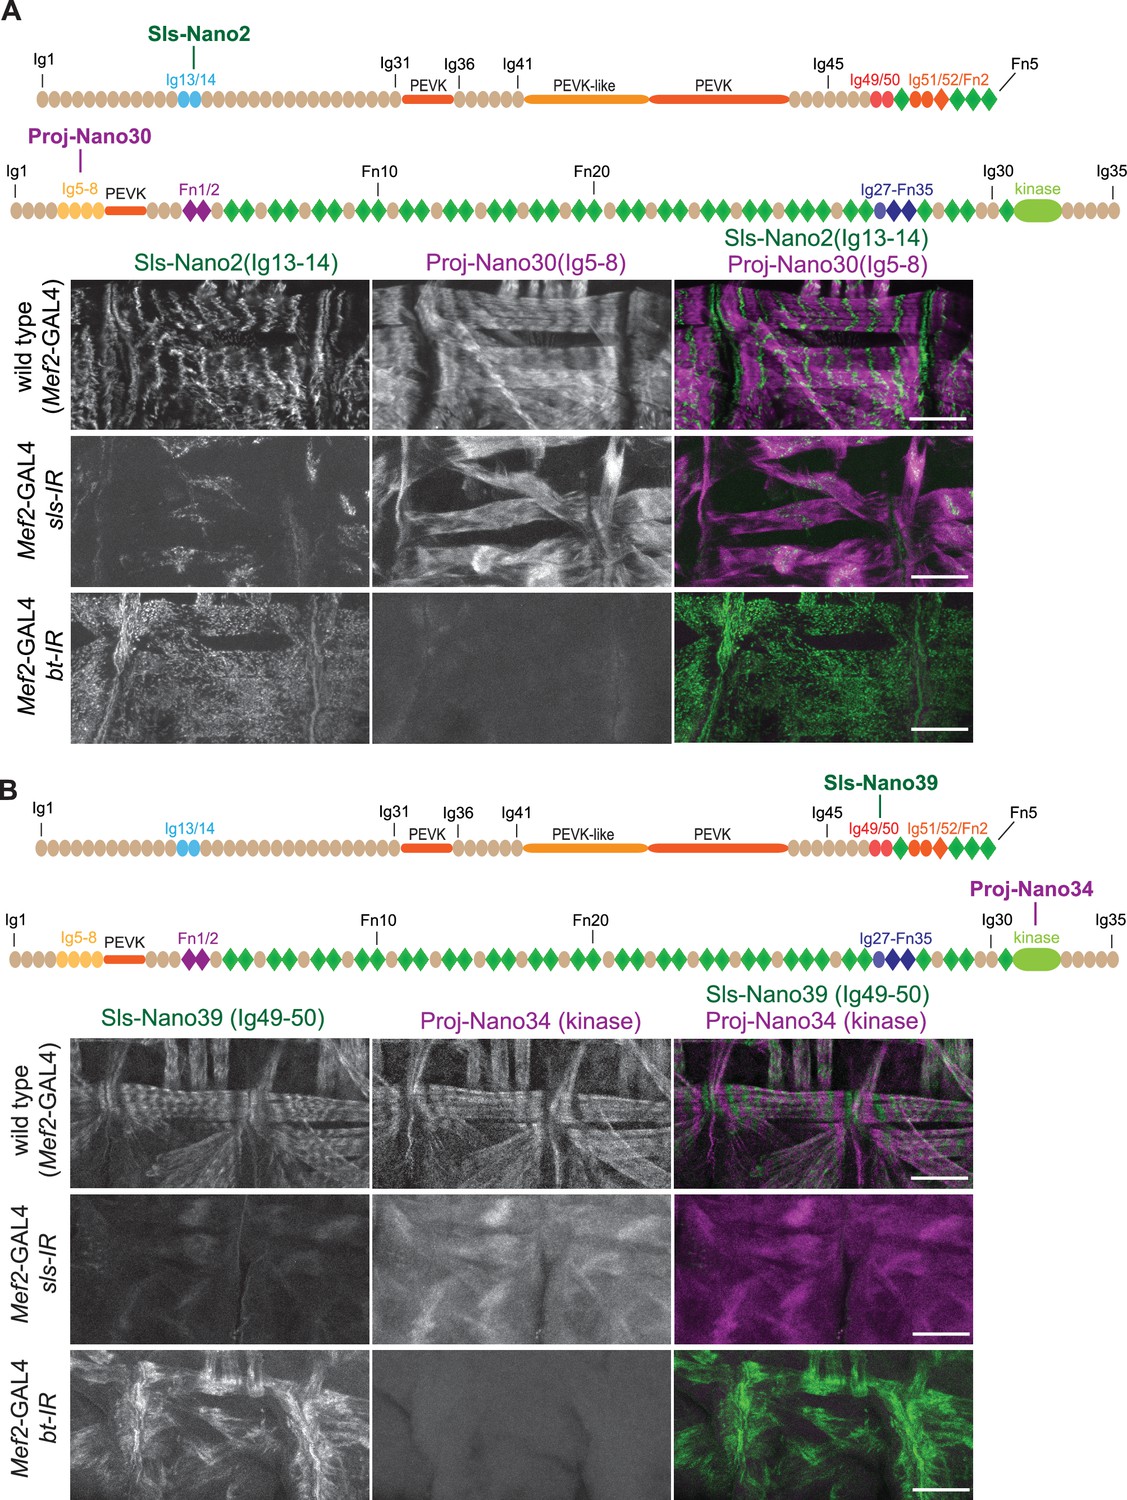
Anti-Sallimus and Projectin nanobody specificity.
(A and B) Top: schematic representation of Sallimus and Projectin domains with nanobodies used for stainings. Bottom: scanning confocal images of stage 17 embryos of wild type (Mef2-GAL4) and muscle specific sls or bt knock-down (Mef2-GAL4, UAS-sls-IR and Mef2-GAL4, UAS-bt-IR, respectively) stained with anti-Sls (green) and Projectin (magenta) nanobodies Sls-Nano2 and Proj-Nano30 (A) or Sls-Nano39 and Proj-Nano34 (B). Note the striated pattern of Sls and Projectin in wild type, which is lost upon knock-down of the other protein. Scale bars are 20 µm.
Figure 4—figure supplement 2
anti-Sallimus and Projectin nanobody specificity.
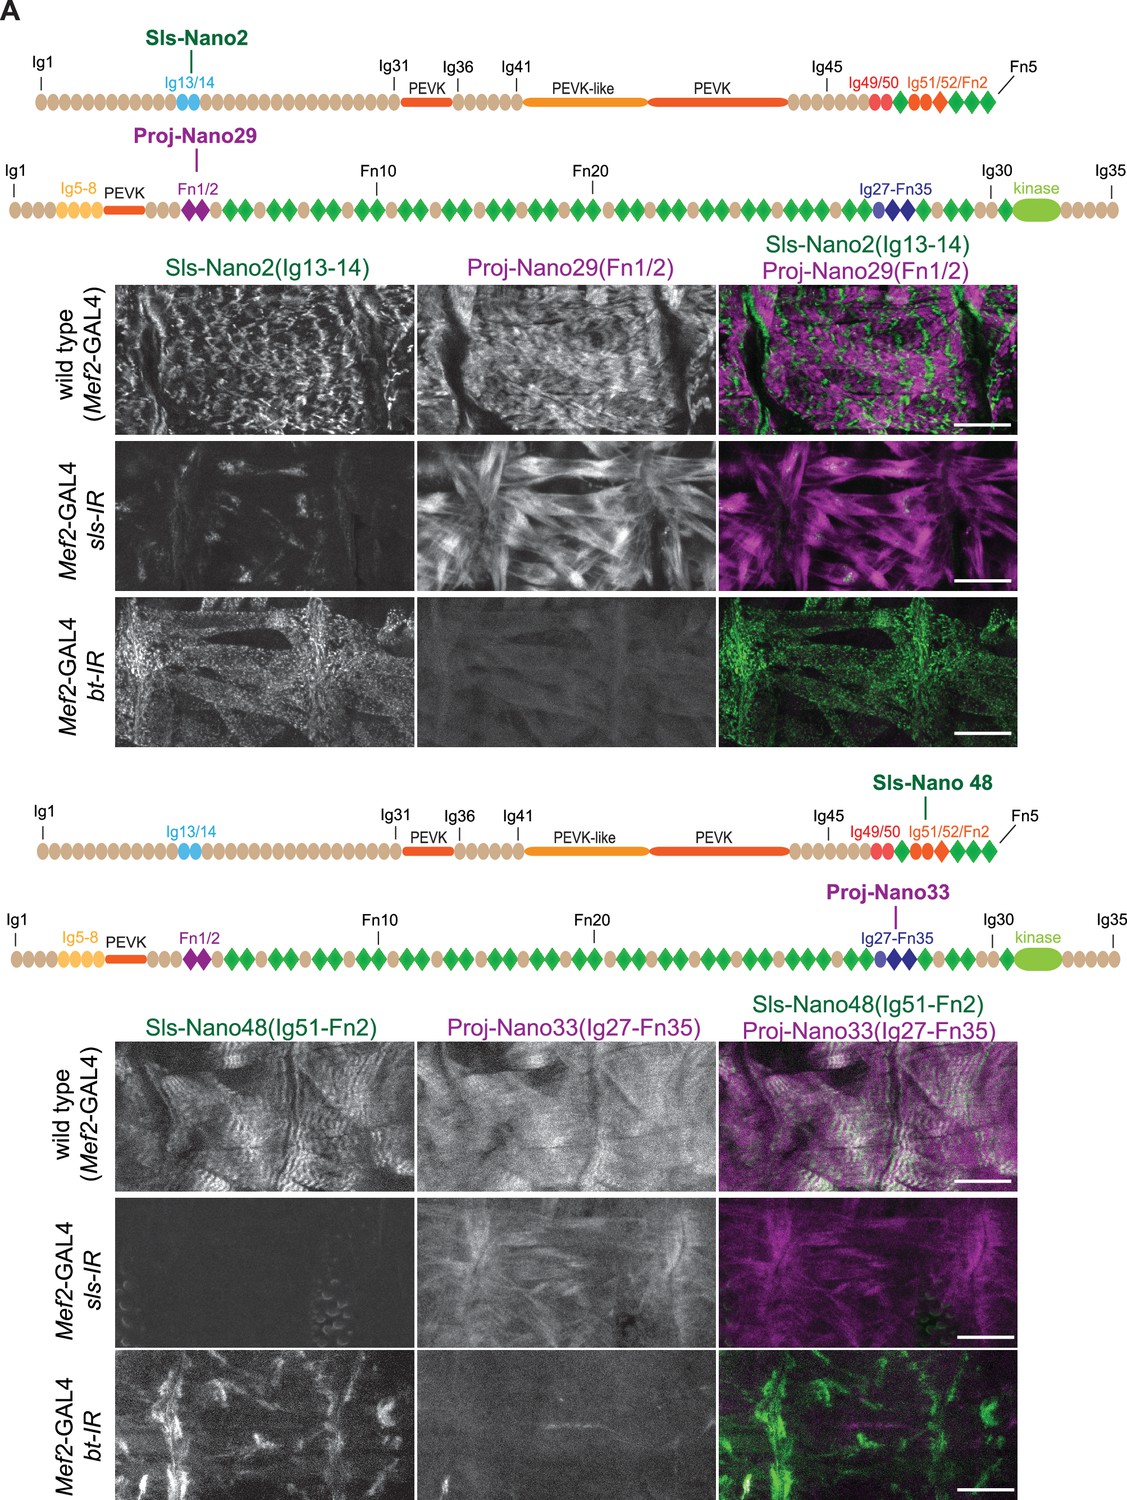
(A and B) Top: schematic representation of Sallimus and Projectin domains with nanobodies used for stainings. Bottom: scanning confocal images of stage 17 embryos of wild type (Mef2-GAL4) and muscle specific sls or bt knock-down (Mef2-GAL4, UAS-sls-IR and Mef2-GAL4, UAS-bt-IR, respectively) stained with Sls (green) and Projectin (magenta) nanobodies Sls-Nano2 and Proj-Nano29 (A) or Sls-Nano48 and Proj-Nano33 (B). Note the striated pattern of Sls and Projectin in wild type, which is lost upon knock-down of the other protein. Scale bars are 20 µm.
Figure 5 with 2 supplements
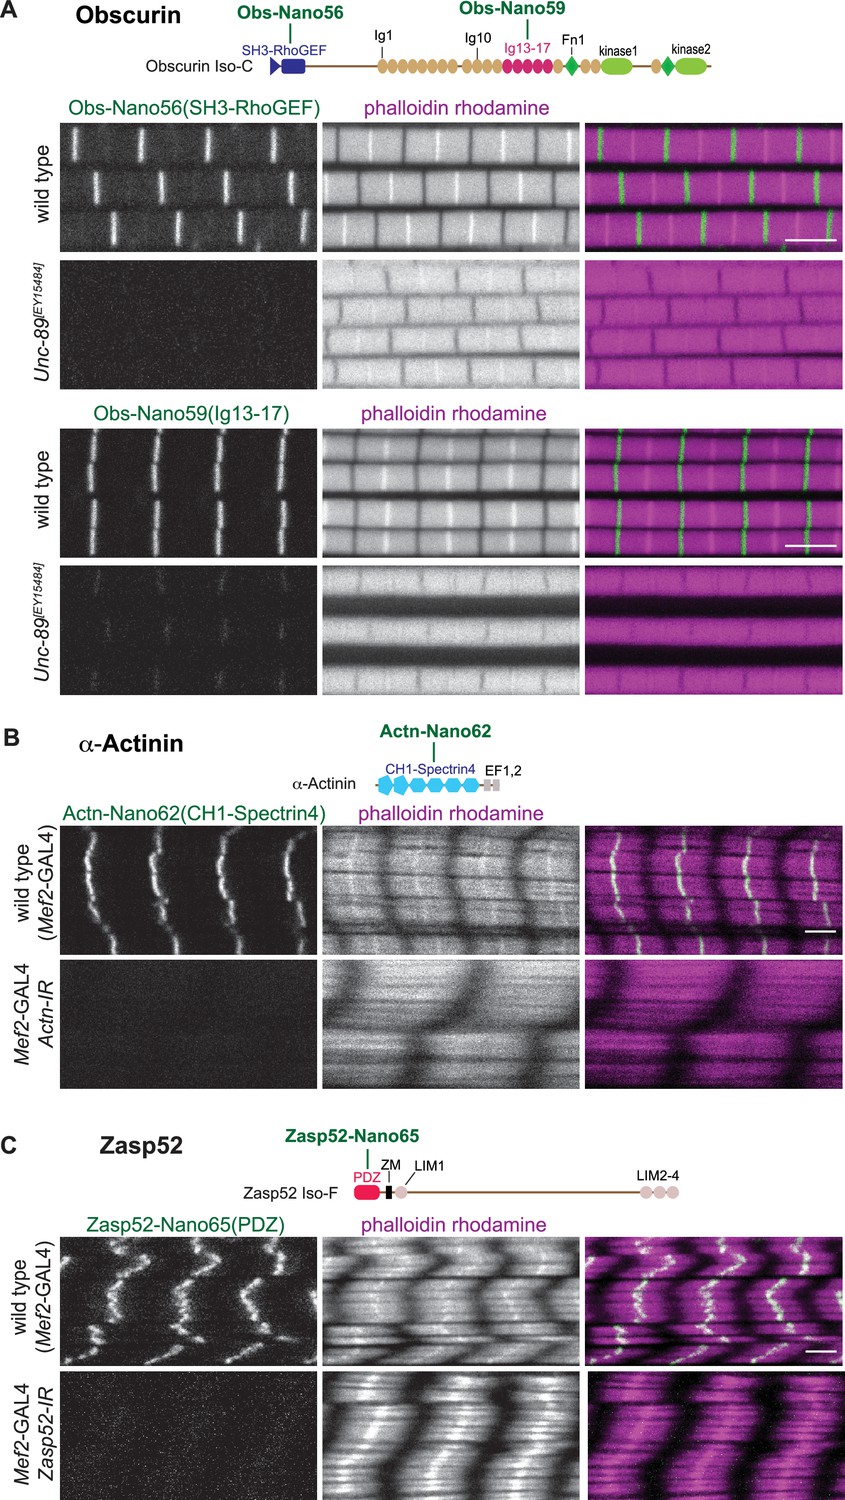
Anti-Obscurin, α-Actinin, and Zasp52 nanobody specificity.
(A – C) Top: schematic representation of Obscurin, α-Actinin and Zasp52 domains with nanobodies used for stainings. Bottom: scanning confocal images of wild-type and Unc-89[EY15484] adult flight muscles stained with the indicated nanobodies and phalloidin (A), wild-type and Actn (B), or Zasp52 (C) knock-down in larval muscles (Mef2-GAL4, UAS-Actn-IR and Mef2-GAL4, UAS-Zasp52-IR, respectively) stained with the indicated anti α-Actinin or Zasp52 nanobodies and phalloidin. Scale bars are 3 µm.
Figure 5—figure supplement 1
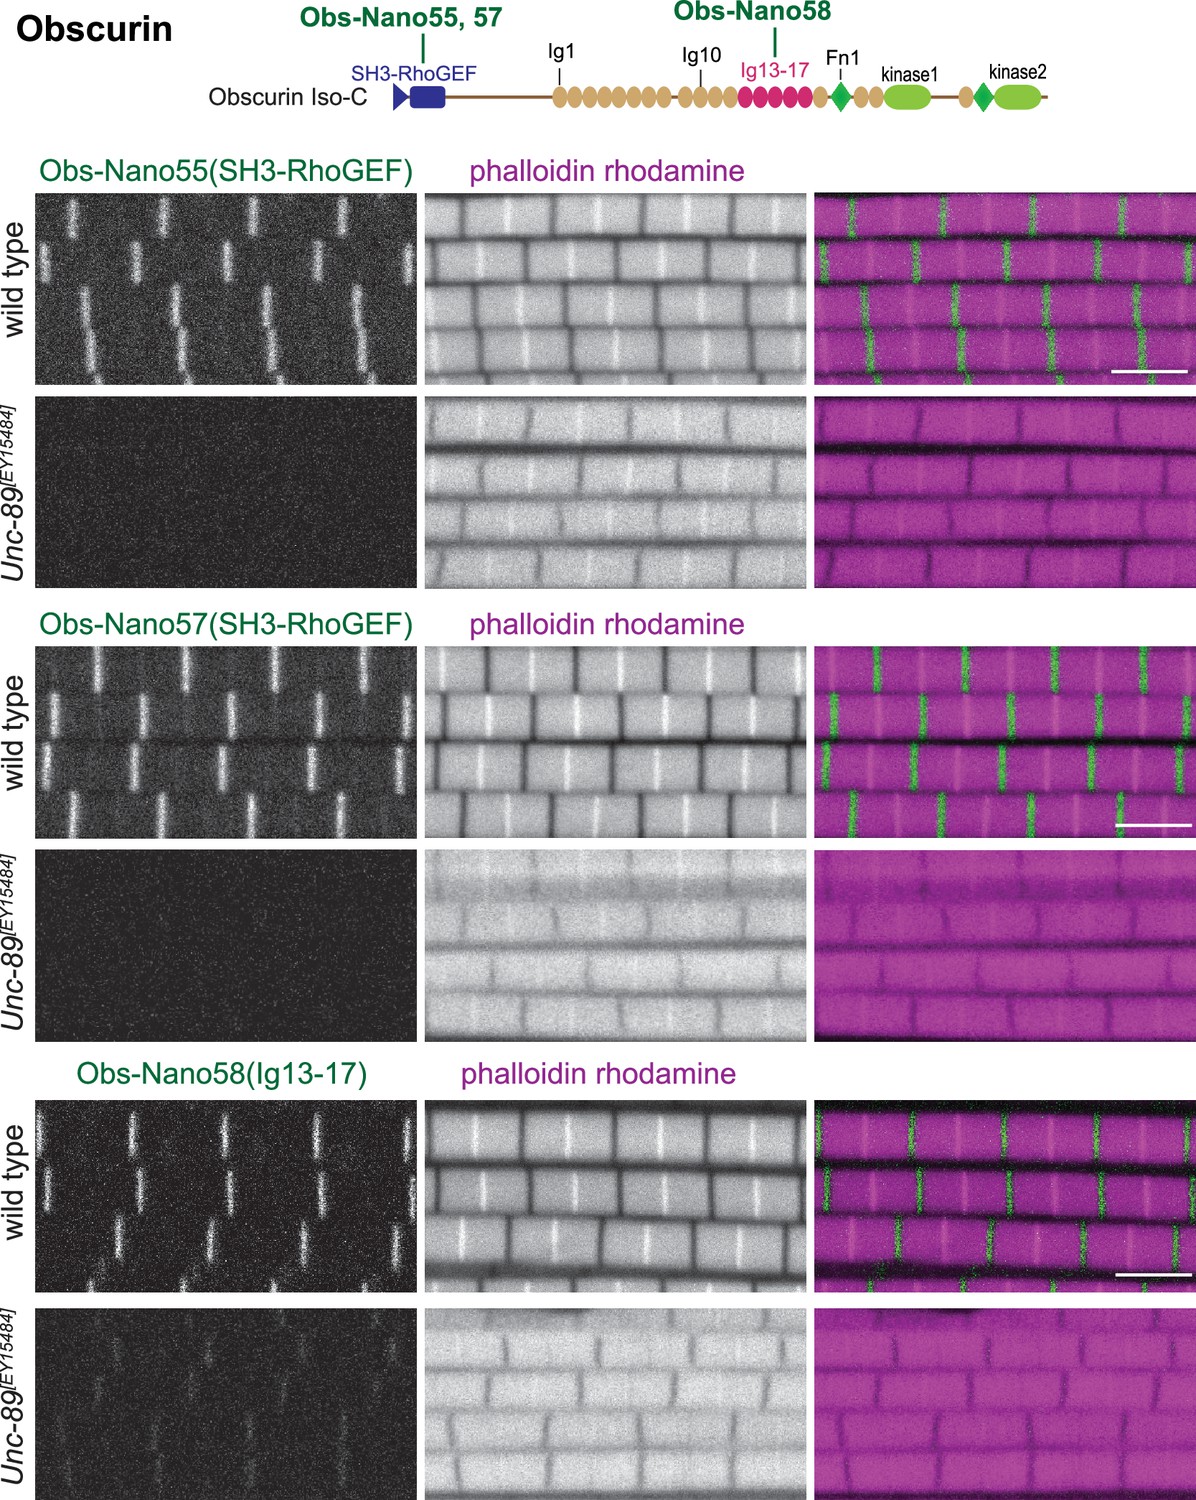
Anti-Obscurin nanobody specificity.
Top: schematic representation of Obscurin protein domains with nanobodies used for stainings. Bottom: scanning confocal images of wild type and Unc-89[EY15484] adult flight muscles stained with the indicated nanobodies and phalloidin. Scale bars are 3 µm. Note the M-band pattern of the anti-Obscurin nanobodies and its absence in the mutant.
Figure 5—figure supplement 2
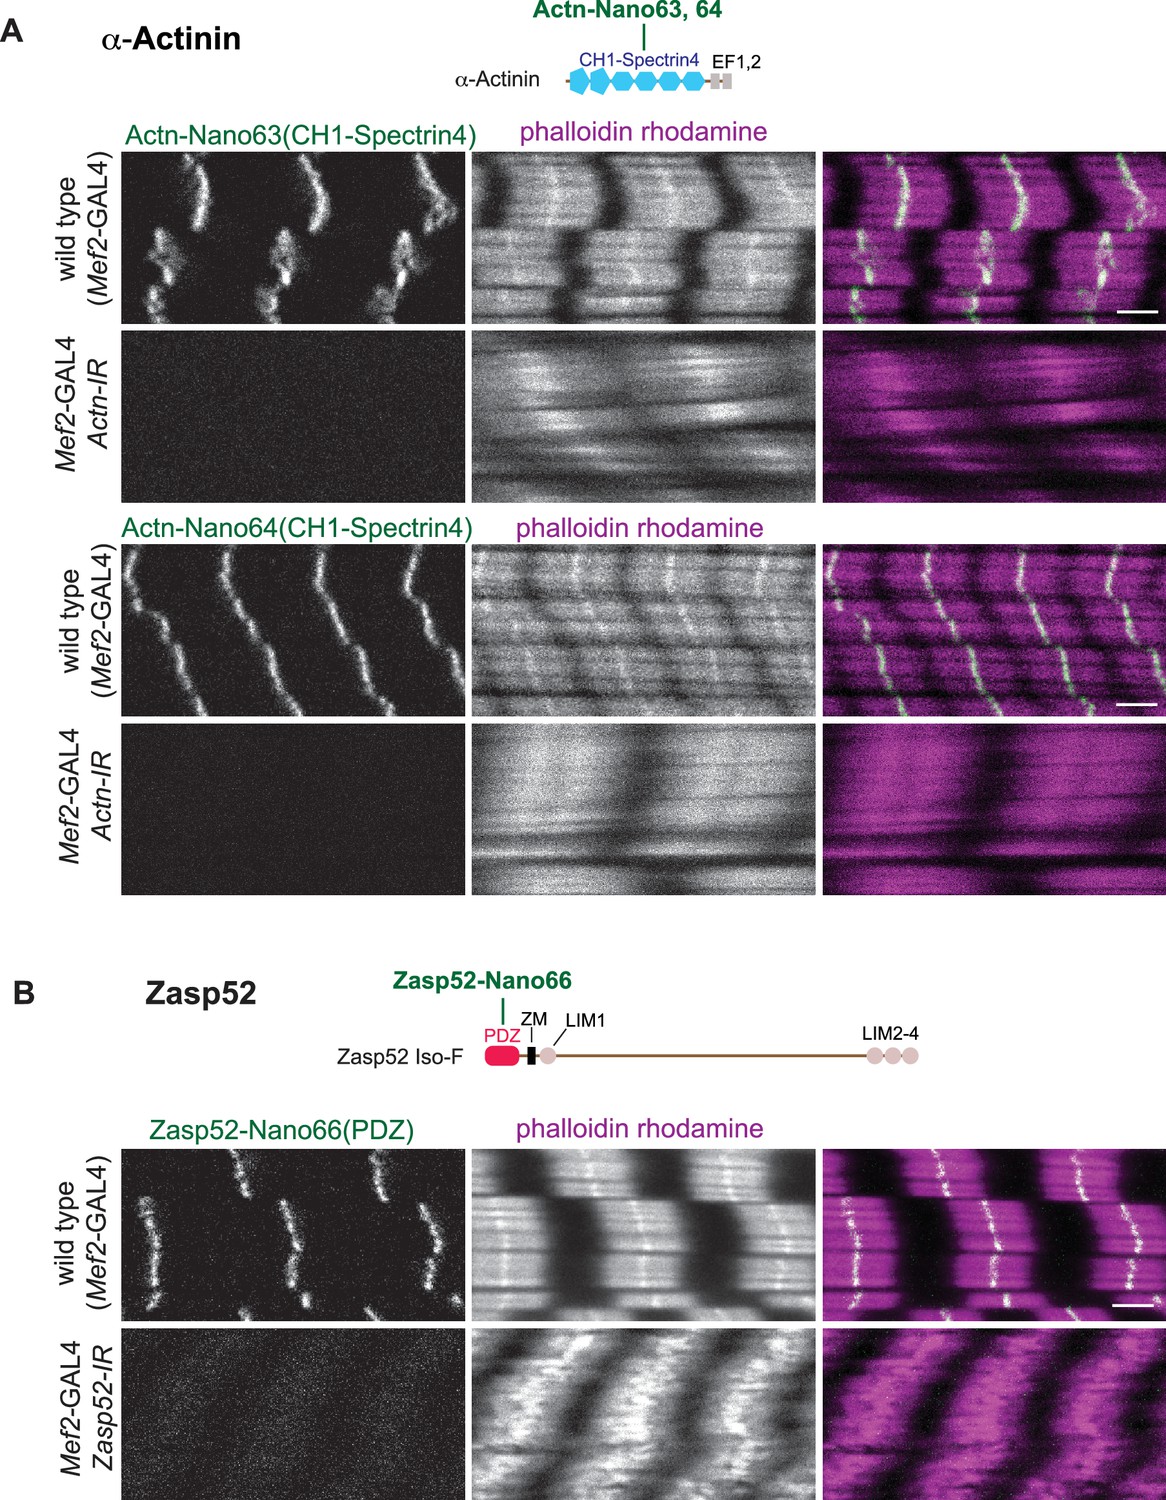
Anti-α-Actinin and Zasp52 nanobody specificity.
(A and B) Top: α-Actinin (A) and Zasp52 (B) domains with nanobodies used for stainings. Bottom: scanning confocal images of wild type and Actn (A) or Zasp52 (B) knock-down larval muscles (Mef2-GAL4, UAS-Actn-IR and Mef2-GAL4, UAS-Zasp52-IR, respectively) stained with the indicated anti-α-Actinin or anti-Zasp52 nanobodies and phalloidin. Scale bars are 3 µm. Note the Z-disc patterns of the anti-α-Actinin or anti-Zasp52 nanobodies and their absence after knock-down.
Figure 6 with 3 supplements
Nanobody penetration.
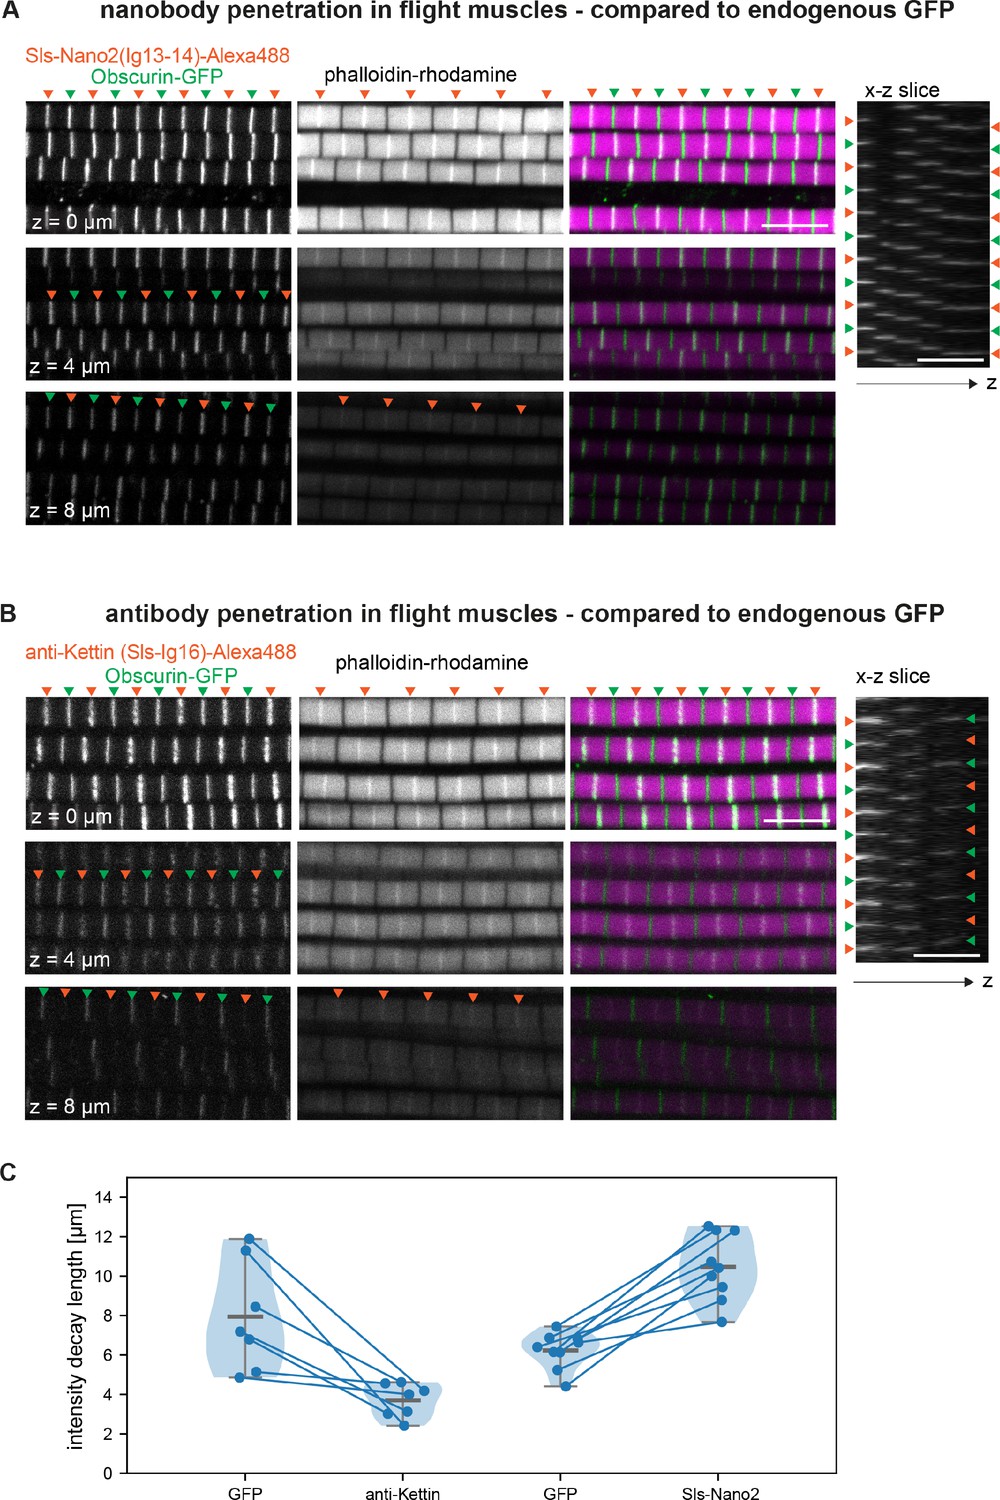
(A and B) Scanning confocal images of adult hemithorax expressing Obscurin-GFP (green arrowheads) in flight muscles stained with phalloidin to label actin (magenta) and either Sls-Nano2-Alexa488 (A) or anti-Kettin antibody (binding Sls-Ig16) (red arrowheads), followed by secondary antibody coupled with Alexa488 (B). Three different z-planes and x-z slices are shown. Note that nanobody (red arrowheads in A) and GFP signals (green arrowheads) are visible in the entire z-stack, whereas the antibody signal decays quickly in the z-direction (red arrowheads in B). Scale bars 5 µm. (C) Fluorescence detection decay length versus imaging depth for GFP, anti-Kettin and Sls-Nano2 (anti-Kettin vs. Sls-Nano2 comparison: p-value = 0.0001748, Mann-Whitney test).
-
Figure 6—source data 1
Source data for Figure 6.
- https://cdn.elifesciences.org/articles/79343/elife-79343-fig6-data1-v2.xlsx
Figure 6—figure supplement 1
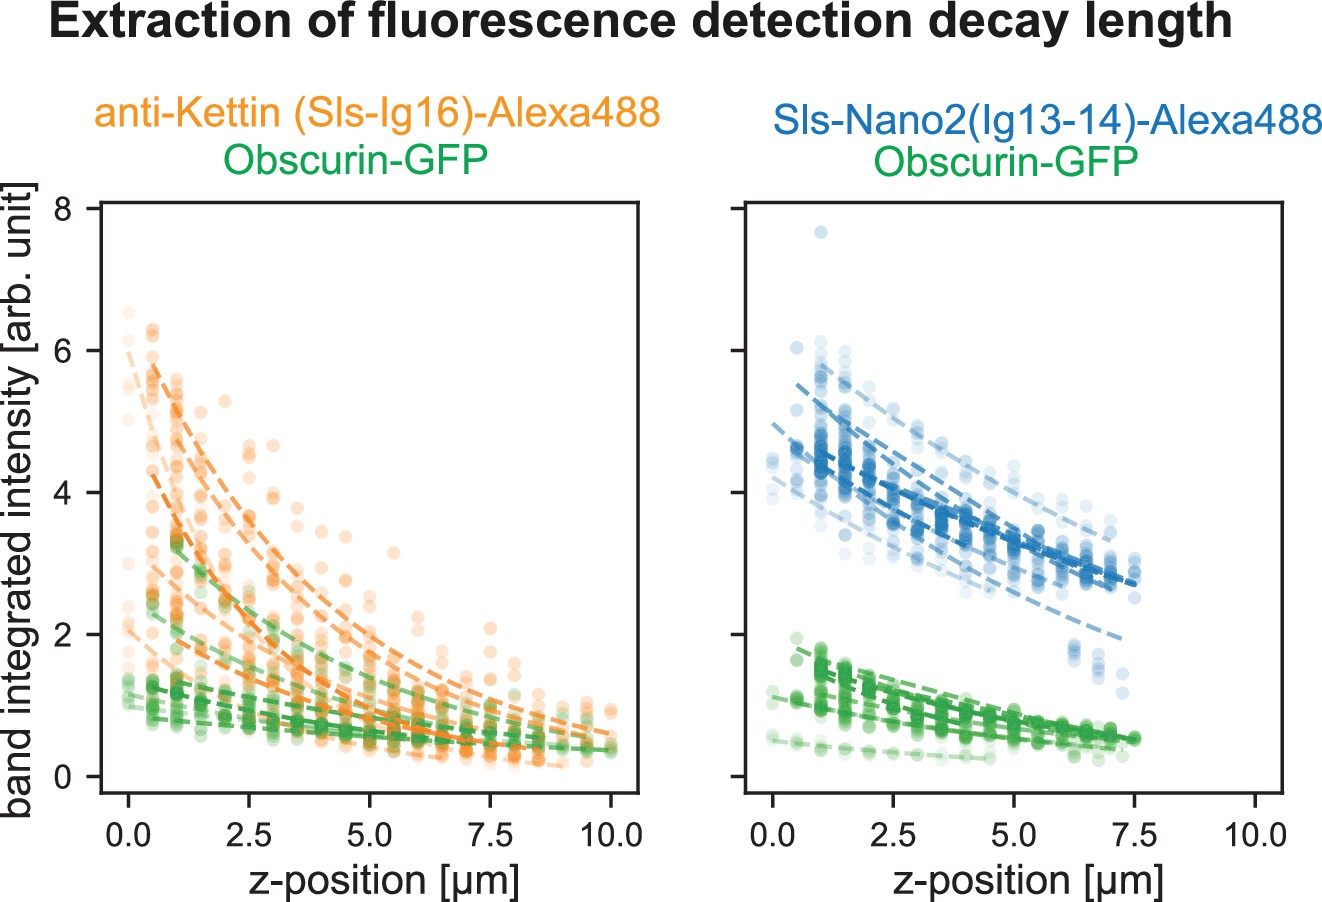
Quantification of intensity decay.
Scatter plots of the band mean intensity in a given flight muscle myofibril versus imaging depth. Dashed lines are the exponential decay fits for each hemithorax (individual decay lengths obtained from the fits are reported in Figure 6C). GFP in green, anti-Kettin in orange, and Sls-Nano2 in blue.
Figure 6—figure supplement 2
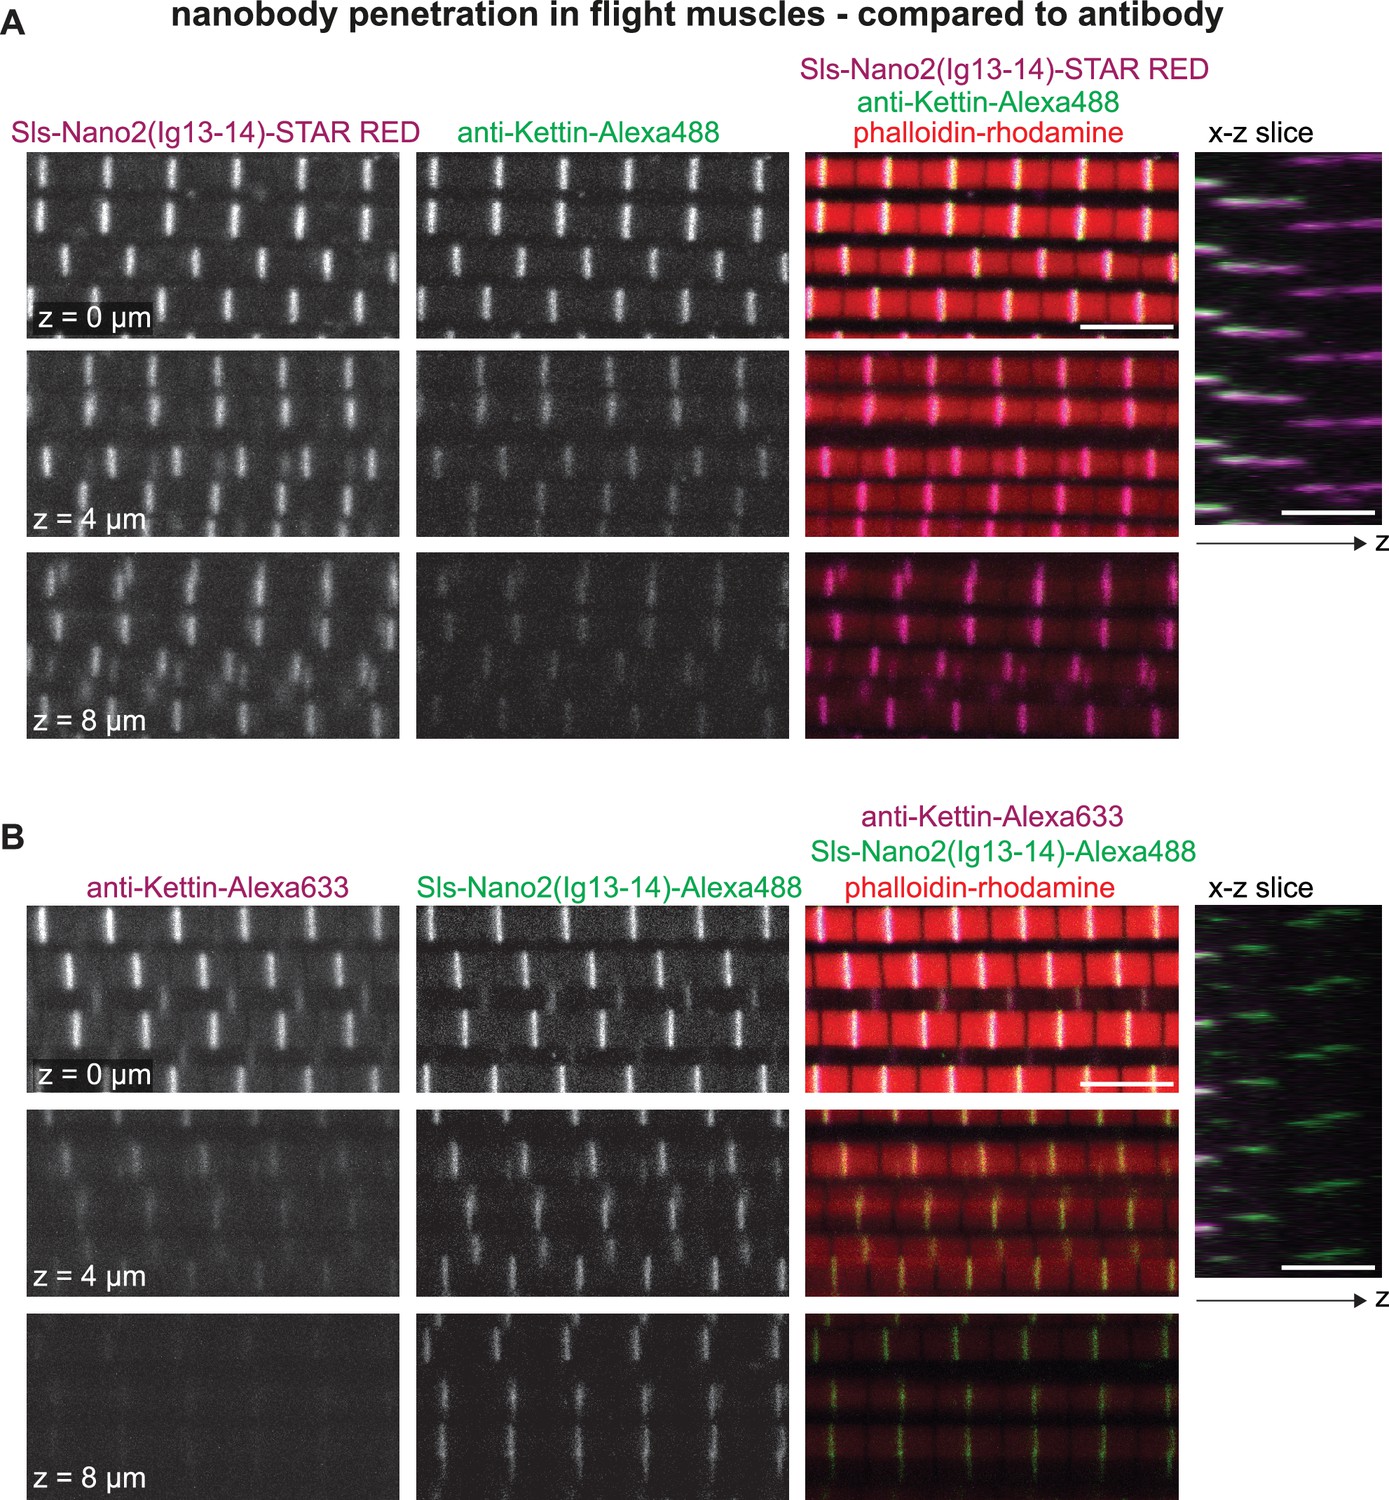
Nanobody penetration in flight muscles.
(A and B) Scanning confocal images of adult flight muscles stained with phalloidin (red) and either Sls-Nano2-STAR RED 9 (magenta) together with anti-Kettin antibody and secondary antibody with Alexa488 (green) (A) or Sls-Nano2-Alexa488 (green) and anti-Kettin antibody with Alexa633 (magenta) (B). Three different z-planes and x-z slice are shown. Scale bars 5 µm. Note that in both examples the nanobody penetrated the entire z-stack, whereas the antibody signal decays quickly in the z-direction.
Figure 6—figure supplement 3

Nanobodies penetrate embryos easier than antibodies.
(A–C) Scanning confocal images of stage 16 and 17 wild-type embryos (Mef2-GAL4) stained with anti-Sls and anti-Projectin nanobodies (Sls-Nano2, Proj-Nano30 in green; Proj-Nano28 in grey), in combination with antibodies against Sls (anti-Kettin) (A), Mhc (B), or Projectin (C) in magenta. Scale bars are 20 µm. Note that anti-Sls, Mhc and Projectin antibodies cannot penetrate stage 17 embryos efficiently, whereas the respective nanobodies stain muscles well.
Figure 7 with 1 supplement
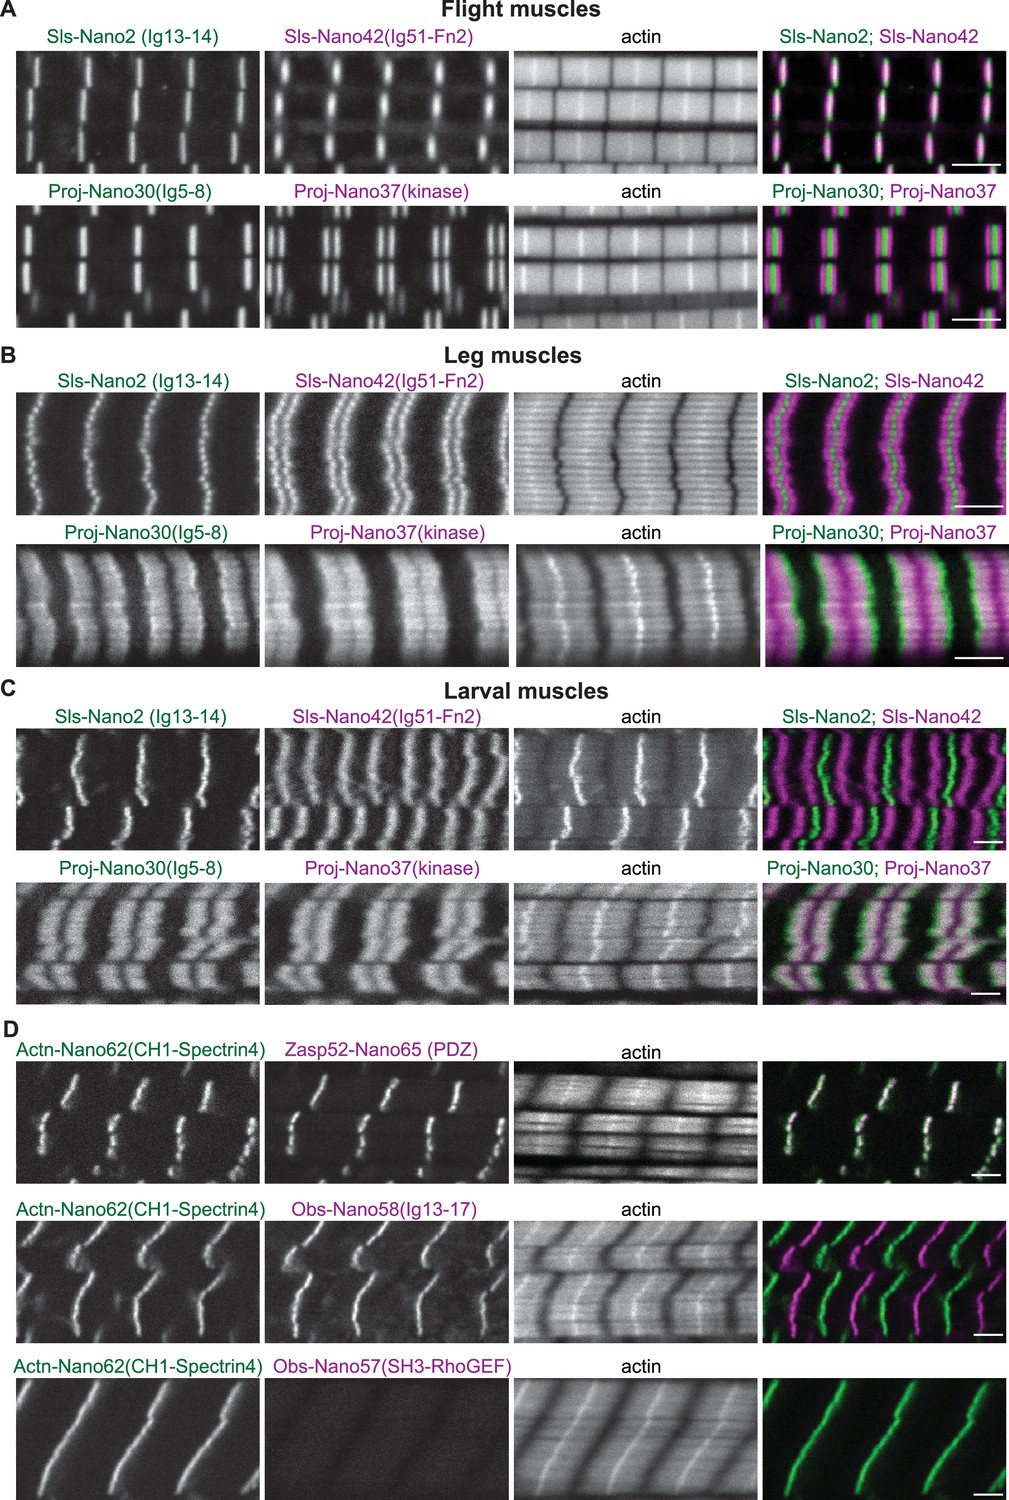
Sallimus, Projectin, α-Actinin, Obscurin, and Zasp52 localisation in different mature sarcomere types.
(A–C) Scanning confocal images of mature sarcomeres from wild-type flight muscles (A), leg muscles (B) or L3 larval muscles (C) stained by phalloidin (actin) together with N- and C-terminal anti-Sls nanobodies (Sls-Nano2 in green and Sls-Nano42 in magenta, top) or N- and C-terminal anti-Projectin nanobodies (Proj-Nano30 in green and Proj-Nano37 in magenta, bottom). Scale bars are 3 µm. Note the long distance between the Sls-Nano42 bands in larval muscles and the distinct locations of Proj-Nano30 and Proj-Nano37 in leg and larval muscles. (D) L3 larval muscles stained by phalloidin (actin) together with anti-Actn and anti-Zasp52 nanobodies (Actn-Nano62 in green and Zasp52-Nano65 in magenta, top), or with anti-Actn and anti-Obscurin nanobodies (Actn-Nano62 in green and Obs-Nano58 in magenta, middle and Actn-Nano62 in green and Obs-Nano57 in magenta, bottom). Note the absence of the Obscurin SH3-RhoGEF domain signal from the larval muscle. Scale bars are 3 µm.
Figure 7—figure supplement 1
Sallimus and Projectin localisation in mature flight muscle.
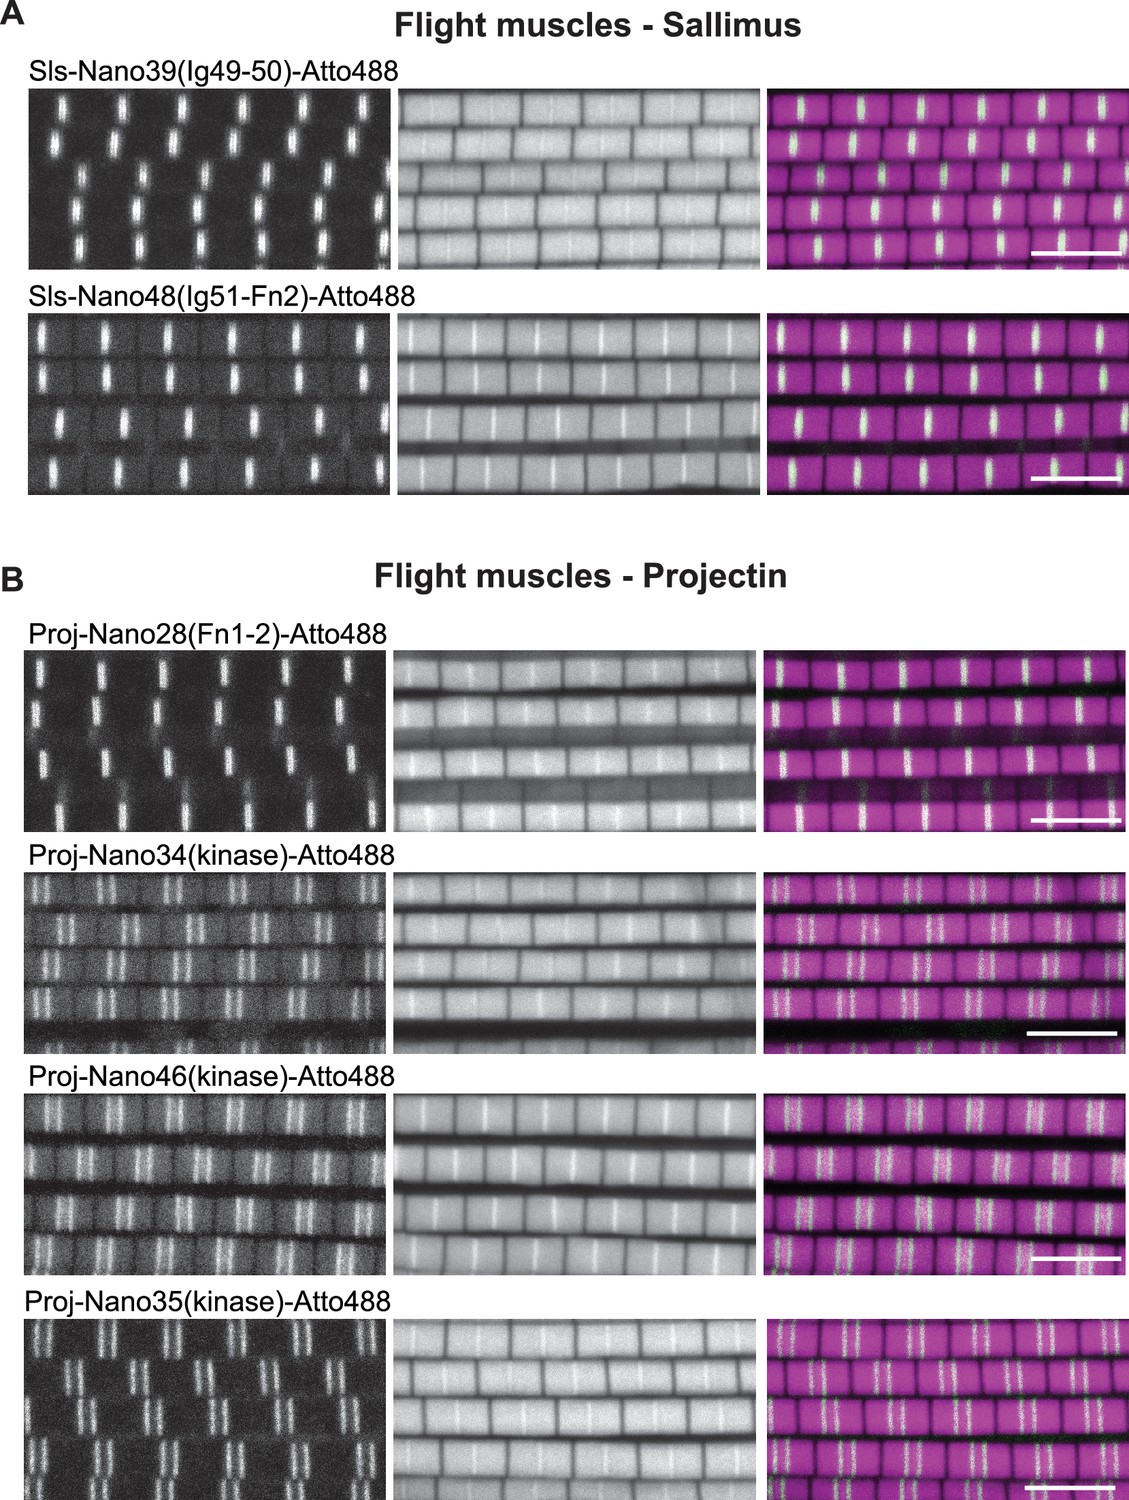
(A and B) Scanning confocal images of adult wild-type flight muscles stained with the indicated anti-Sls (A) or anti-Projectin Nanobodies in green and phalloidin in magenta. Scale bars 5 µm.
Figure 8 with 1 supplement

Sallimus and Projectin localisation patterns in mature larval sarcomeres.
(A) Scanning confocal images of L3 larval muscles stained for actin, and N-(Sls-Nano2, green) and C-terminal (Sls-Nano42, magenta) anti-Sls nanobodies. Scale bar 3 µm. Plot displays longitudinal intensity profiles of Sls-Nano2 and Sls-Nano42. Quantification of sarcomere length (distance between Sls-Nano2 bands) and Sls length (distance between Sls-Nano2 and Sls-Nano42). Each point represents an animal, n = 10. (B) L3 larval muscle stained for myosin (green) and C-terminal (Sls-Nano42, magenta) anti-Sls nanobody. Scale bar 3 µm. Plot displays intensity profiles of myosin and Sls-Nano42. Note that peaks of Nano42 map to the start of the myosin signal. (C) L3 larval muscle stained for anti-Projectin with N-(Proj-Nano30, green) and C-terminal (Proj-Nano37, magenta) nanobodies and imaged with an airy-scan detector. Scale bar 3 µm. Plot displays intensity profiles of Proj-Nano30 and Proj-Nano37. Note that the Proj-Nano37 signal is closer to the M-band compared to Proj-Nano30. (D) L3 larval muscle stained for Obscurin (Obs-Nano58, green) and Projectin either with N-(Proj-Nano30, magenta) or C-terminal (Proj-Nano37, magenta) nanobodies and imaged with an airy scan detector. Scale bar 3 µm. Plots display intensity profiles. Note that Obscurin perfectly fills the Proj-Nano37 gap at the M-band. (E) Molecular model of a larval sarcomere. Note the extended Sallimus across the I-band and the staggered Projectin on the myosin filaments in the A-band leaving the M-band free.
-
Figure 8—source data 1
Source data of Figure 8.
- https://cdn.elifesciences.org/articles/79343/elife-79343-fig8-data1-v2.xlsx
Figure 8—figure supplement 1
Sallimus and Projectin localisation in larval muscle.
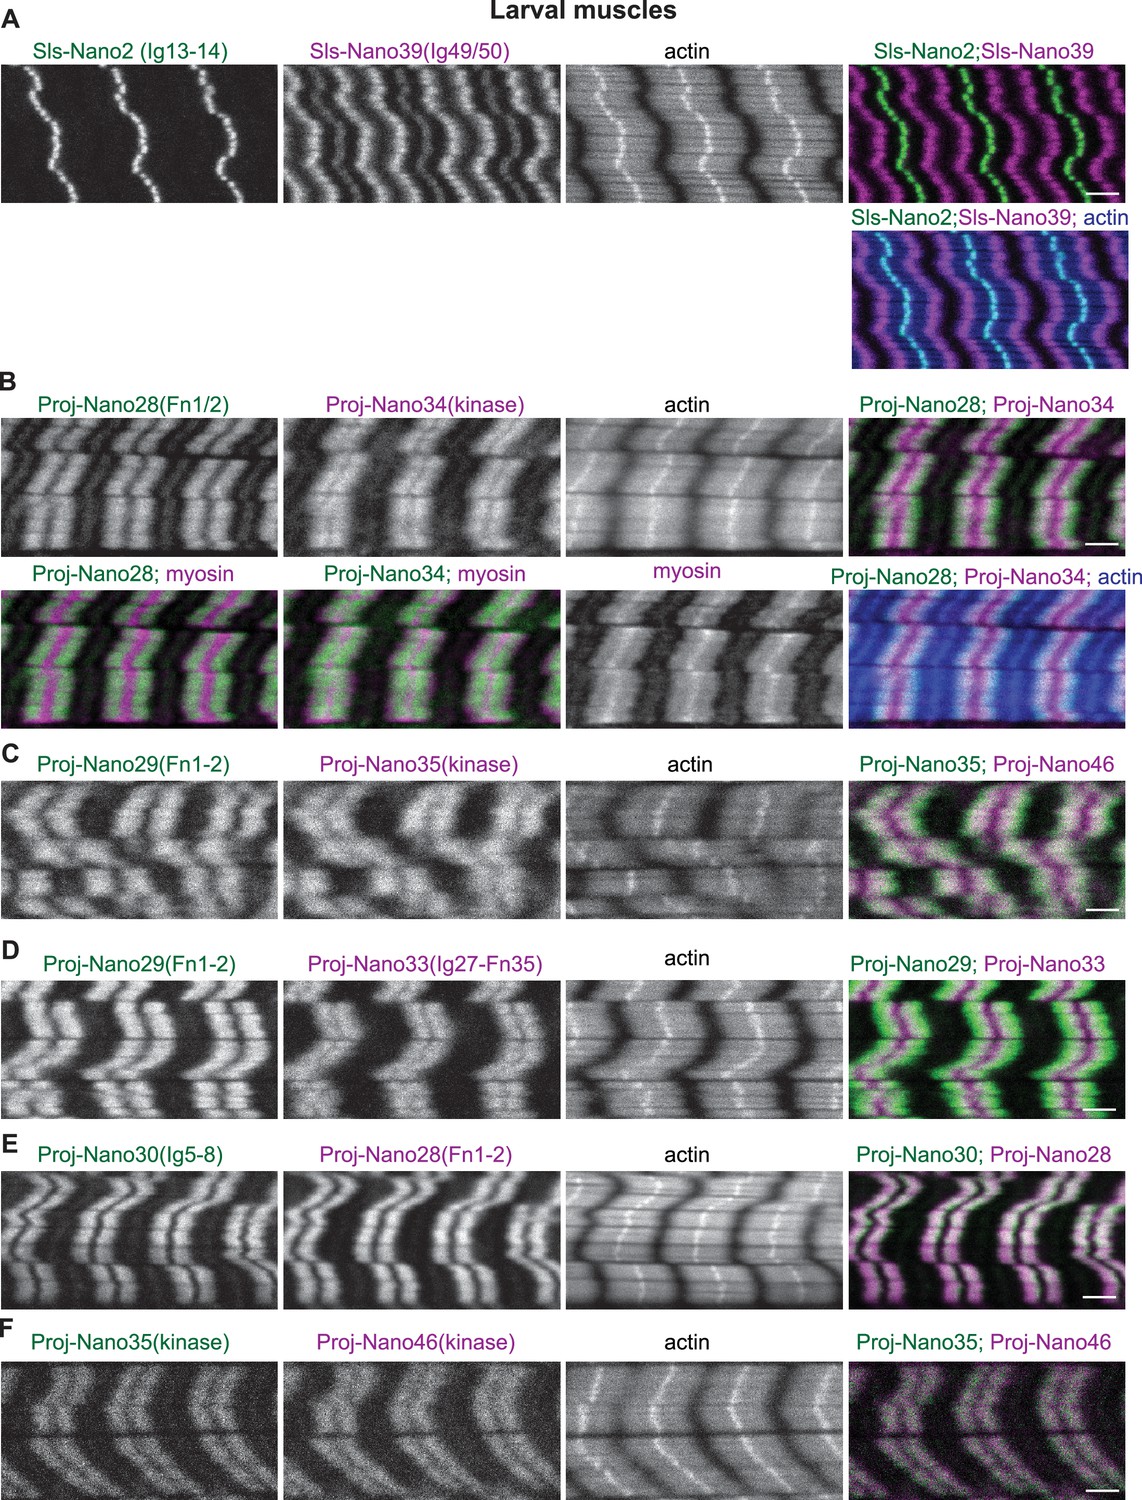
(A) Scanning confocal images of wild-type third-instar (L3) larval muscle stained for actin (blue) and Sallimus with N-(Sls-Nano2, green) and C-terminal (Sls-Nano39, magenta) anti-Sls nanobodies. Note the large distance of the Sls-Nano39 bands (a central SlsNano39 band at the Z-disc is sometimes seen that may indicate mechanical detachment of Sls during the muscle preparation). (B) Wild-type L3 larval muscle stained for actin (blue), myosin (magenta) and Projectin with N-(Proj-Nano28, green) and C-terminal (Proj-Nano34, green or magenta) nanobodies. Note the shift of N-terminal versus C-terminal nanobodies, both label the myosin filament. (C) Wild-type L3 larval muscle stained for actin and Projectin with N-(Proj-Nano29, green) and C-terminal (Proj-Nano35, magenta) nanobodies. (D) Wild-type L3 larval muscle stained for actin and Projectin with N-(Proj-Nano29, green) and C-terminal (Proj-Nano33, magenta) nanobodies. (E and F) Wild-type L3 larval muscle stained for actin and Projectin with two N-terminal (Proj-Nano30, green and Proj-nano28, magenta, in E) or two C-terminal (Proj-Nano35, green and Proj-Nano46, magenta in F) anti-Projectin nanobodies. Note that the two N-terminal or C-terminal anti-Projectin nanobody patterns overlap. Scale bars are 3 µm.
Figure 9 with 4 supplements

Live imaging of Sls using nanobodies in vivo.
(A) Live imaging of UAS-Nano-NeonGreen expressing larvae (Mef2-GAL4) with spinning disc microscopy. NeonGreen was fused to Sls-Nano2, Sls-Nano42, Proj-Nano30 or Proj-Nano37 nanobodies. Note the thin single stripes of Sls-Nano2-NeonGreen and the 2 stripes of Sls-Nano42-NeonGreen at the expected distance. Proj-Nano30-NeonGreen shows thick blocks that are further away from the M-band than the thick Proj-Nano37-NeonGreen blocks. Scale bar 20 µm. (B) Living L3 larval muscles expressing Sls-Nano2-NeonGreen expressed with Mef2-GAL4 imaged with spinning disc microscopy. Note the striated pattern marking the Z-discs. A region marked by the red rectangle was bleached (the larva was slightly moving while being bleached) and fluorescence recovery was imaged. A single z-plane of a stack is shown. Scale bar 10 µm. (C) Quantification of fluorescence recovery in the orange box, which was normalised by the fluorescence in the yellow box outside the bleached area. The different grey values indicate four different larvae from four different experiments. Note either absence or less than 20% recovery in the bleached area over 30 min.
-
Figure 9—source data 1
Source data for Figure 9.
- https://cdn.elifesciences.org/articles/79343/elife-79343-fig9-data1-v2.xlsx
Figure 9—figure supplement 1
Nanobody-NeonGreen fusions in vivo.
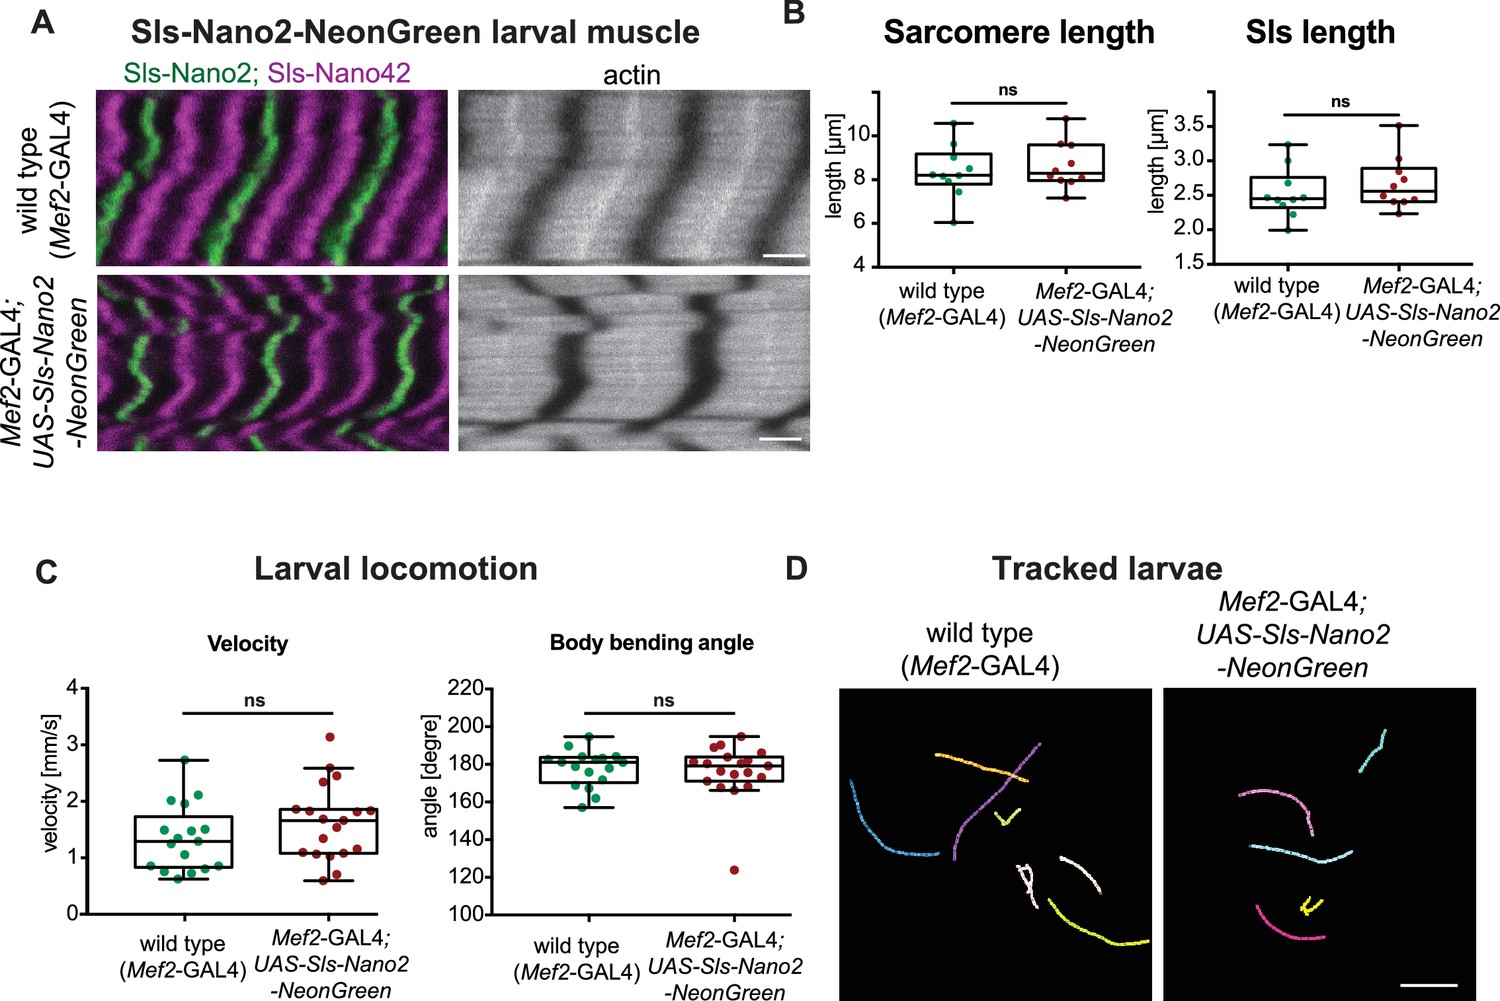
(A and B) Scanning confocal images of control (top) and Sls-Nano2-NeonGreen expressing L3 larvae (bottom), which were stained with Sls-Nano2 (green), Sls-Nano42 (magenta) and phalloidin (grey). Note the normal sarcomere morphology after Sls-Nano2-NeonGreen expression (A), as well as normal sarcomere and Sls protein length (B). Scale bar 3 µm. (Sarcomere length: p-value = 0.9118; Sls length: p-value = 0.4243; Mann–Whitney test) (C and D) Quantification of larval locomotion. Note the normal velocity as well as persistence indicated by largely straight positions (180 degrees) of the larvae during movement (C) and the automated tracks (D) in control and Sls-Nano2-NeonGreen expressing L3 larvae. Scale bar in (D) 2 cm (velocity: p-value = 0.2317; bending angle: p-value = 0.8023; Mann–Whitney test).
Figure 9—video 1
Larval crawling and tracking in wild type.
Control L3 larvae were recorded on agar plates with a frame rate of 25 Hz. Last frame shows the automated tracks using FIMTrack (Risse et al., 2017).
Figure 9—video 2
Larval crawling and tracking in Sls-Nano2-NeonGreen larvae.
Sls-Nano2-NeonGreen expressing L3 larvae were recorded on agar plates with a frame rate of 25 Hz. Last frame shows the automated tracks using FIMTrack (Risse et al., 2017).
Figure 9—video 3
Live imaging of Sls with a nanobody using fluorescence recovery after photobleaching.
Living L3 larva expressing Sls-Nano2-NeonGreen was imaged with a spinning disc confocal. One single plane is shown and assembled to the movie. The white square after the pre-bleach frames indicates the bleached area. One z-stack was recorded each minute after bleaching for 30 min, from which one frame is shown. The larva is moving slightly during the experiment. There is little recovery of Sls-Nano2-NeonGreen in the bleached area over the 30-min period.
Figure 10
Sls-Nano-deGrad in vivo.
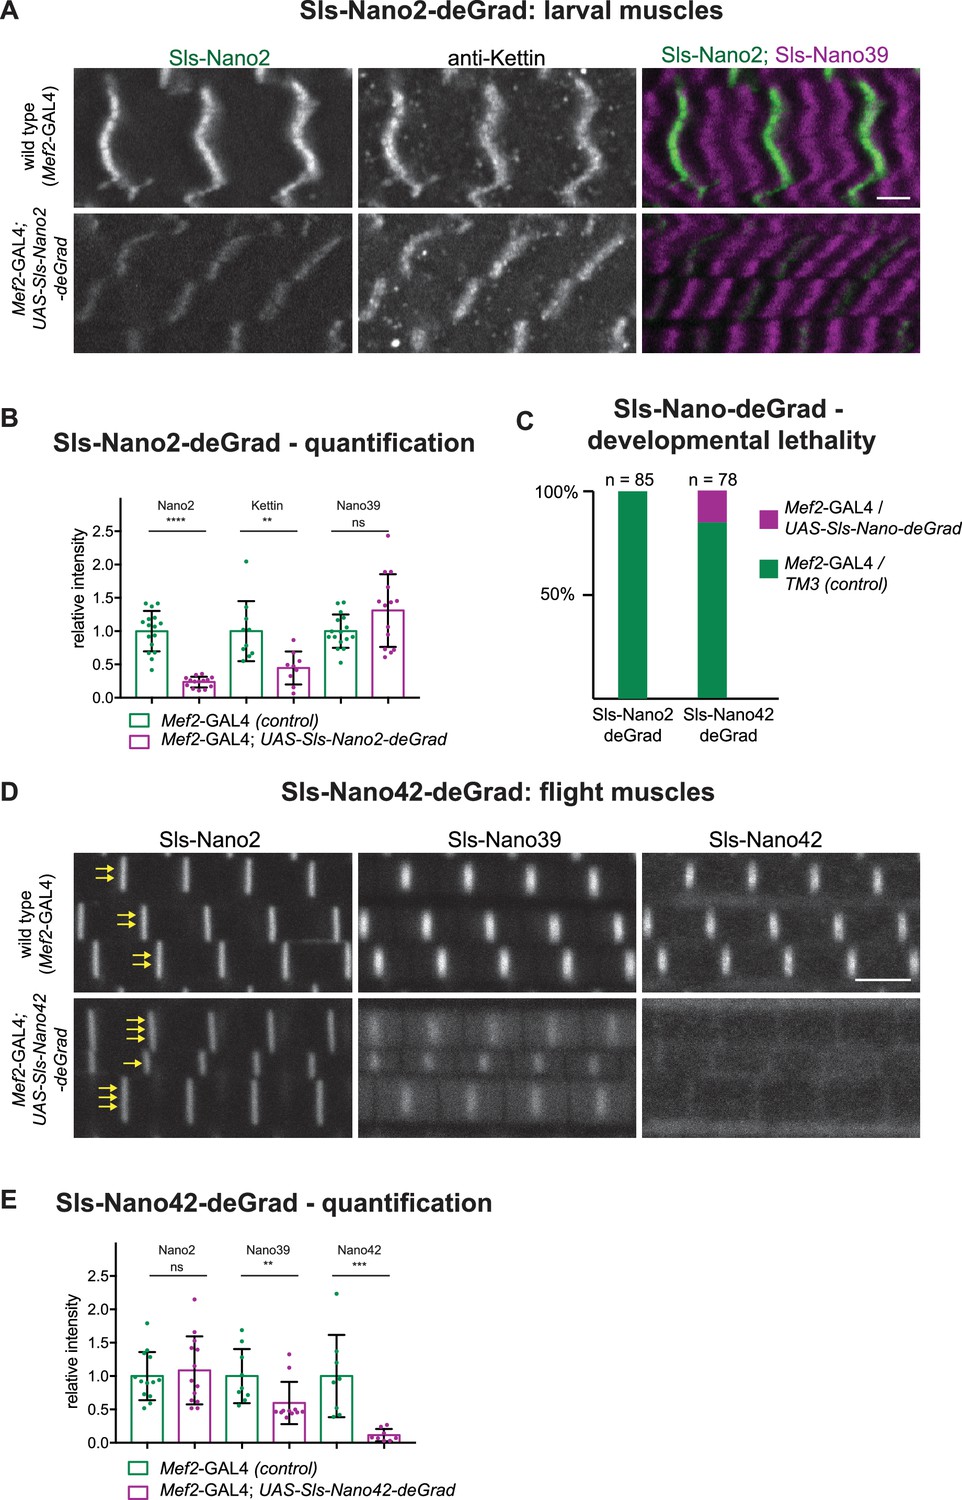
(A) Control (top) or Sls-Nano2-deGrad (bottom) expressing larval muscles stained with Sls-Nano2 (green), anti-Kettin (white), and Sls-Nano39 (magenta) and imaged with scanning confocal microscopy. Scale bar is 3 µm. Note the strong reduction of Sls-Nano2 signal, whereas anti-Kettin is weakly reduced. (B) Quantifications of staining intensities shown in (A). Each dot represents an animal (p-value Nano2:<0.0001; Kettin = 0.002; Nano39 = 0.1279; Mann–Whitney test). (C) Lethality assay upon crossing UAS-Sls-Nano-deGrad/TM3 to Mef2-GAL4. Note the complete lethality induced by the expression of Sls-Nano2-deGrad and the partial lethality induced by Sls-Nano42-deGrad (expected ratio to Mef2-GAL4/TM3 control: 50%). (D) Control (top) or Sls-Nano42-deGrad (bottom) expressing adult flight muscles stained with Sls-Nano2, Sls-Nano39, and Sls-Nano42. Note the strong reduction of Sls-Nano42 signal and the weaker reduction of Sls-Nano39. Note the irregular thickness of the myofibrils in Sls-Nano42-deGrad flight muscles compared to control indicated by varying number of yellow arrows. Scale bar is 3 µm. (E) Quantifications of staining intensities shown in (D). Each dot represents an animal (p-value Nano2 = 0.8288; Nano39 = 0.004; Nano42 = 0.0002; Mann–Whitney test).
-
Figure 10—source data 1
Source data for Figure 10.
- https://cdn.elifesciences.org/articles/79343/elife-79343-fig10-data1-v2.xlsx
Tables
Key resources table
| Reagent type (species) or resource | Designation | Source or reference | Identifiers | Additional information |
|---|---|---|---|---|
| Strain, strain background (Drosophila melanogaster) | Luminy | Leonte et al., 2021 | ||
| Strain, strain background (Drosophila melanogaster) | Mef2-GAL4 | Schnorrer et al., 2010 | ||
| Strain, strain background (Drosophila melanogaster) | sls-IR (TF47301) | Dietzl et al., 2007 | ||
| Strain, strain background (Drosophila melanogaster) | UAS-bt-IR (TF46252) | Dietzl et al., 2007 | ||
| Strain, strain background (Drosophila melanogaster) | UAS-Actn-IR (TF7760) | Dietzl et al., 2007 | ||
| Strain, strain background (Drosophila melanogaster) | UAS-Zasp52-IR (JF01133) | Ni et al., 2011 | ||
| Strain, strain background (Drosophila melanogaster) | Unc-89[EY15484] | Katzemich et al., 2012 | ||
| Gene (Drosophila melanogaster) | sls | http://flybase.org/reports/FBgn0086906 | FBgn0086906 | |
| Gene (Drosophila melanogaster) | bt (Projectin) | http://flybase.org/reports/FBgn0005666 | FBgn0005666 | |
| Gene (Drosophila melanogaster) | Unc-89 (Obscurin) | http://flybase.org/reports/FBgn0053519 | FBgn0053519 | |
| Gene (Drosophila melanogaster) | Actn | http://flybase.org/reports/FBgn0000667 | FBgn00006679 | |
| Gene (Drosophila melanogaster) | Zasp52 | http://flybase.org/reports/FBgn0265991 | FBgn0265991 | |
| Antibody | anti-Mhc (Mouse monoclonal) | DHSB | 3e8-3D3 | IF(1:100) |
| Antibody | anti-Sls (Kettin) (Rat monoclonal) | Babraham Institute | MAC155 | IF(1:500) |
| Antibody | anti-Projectin (Rat monoclonal) | Babraham Institute | MAC150 | IF(1:100) |
| Other | Sls-Ig13/14 (Nano2) | This study | Coupled to A488; A647; STAR RED | Nanobody – used at about 50 nM; see Materials availability statement |
| Other | Sls-Ig49/50 (Nano39) | This study | Coupled to A488; A647; | Nanobody – used at about 50 nM; see Materials availability statement |
| Other | Sls-Ig51-Fn2 (Nano42) | This study | Coupled to A488; A647; | Nanobody – used at about 50 nM; see Materials availability statement |
| Other | Sls-Ig51-Fn2 (Nano48) | This study | Coupled to A488; A647; | Nanobody – used at about 50 nM; see Materials availability statement |
| Other | Proj-Fn1/2 (Nano28) | This study | Coupled to A488; A647; | Nanobody – used at about 50 nM; see Materials availability statement |
| Other | Proj-Fn1/2 (Nano29) | This study | Coupled to A488; A647; | Nanobody – used at about 50 nM; see Materials availability statement |
| Other | Proj-Ig5-8 (Nano30) | This study | Coupled to A488; A647; | Nanobody – used at about 50 nM; see Materials availability statement |
| Other | Proj-Ig27-Fn35 (Nano33) | This study | Coupled to A488; A647; | Nanobody – used at about 50 nM; see Materials availability statement |
| Other | Proj-kinase (Nano34) | This study | Coupled to A488; A647; | Nanobody – used at about 50 nM; see Materials availability statement |
| Other | Proj-kinase (Nano35) | This study | Coupled to A488; A647; | Nanobody – used at about 50 nM; see Materials availability statement |
| Other | Proj-kinase (Nano37) | This study | Coupled to A488; A647; | Nanobody – used at about 50 nM; see Materials availability statement |
| Other | Proj-kinase (Nano46) | This study | Coupled to A488; A647; | Nanobody – used at about 50 nM; see Materials availability statement |
| Other | Obscurin-SH3-RhoGEF (Nano55) | This study | Coupled to A488; A647; | Nanobody – used at about 50 nM; see Materials availability statement |
| Other | Obscurin-SH3-RhoGEF (Nano56) | This study | Coupled to A488; A647; | Nanobody – used at about 50 nM; see Materials availability statement |
| Other | Obscurin-SH3-RhoGEF (Nano57) | This study | Coupled to A488; A647; | Nanobody – used at about 50 nM; see Materials availability statement |
| Other | Obscurin-Ig13-17 (Nano58) | This study | Coupled to A488; A647; | Nanobody – used at about 50 nM; see Materials availability statement |
| Other | Obscurin-Ig13-17 (Nano59) | This study | Coupled to A488; A647; | Nanobody – used at about 50 nM; see Materials availability statement |
| Other | α-Actinin-CH1-Spec4 (Nano62) | This study | Coupled to A488; A647; | Nanobody – used at about 50 nM; see Materials availability statement |
| Other | α-Actinin-CH1-Spec4 (Nano63) | This study | Coupled to A488; A647; | Nanobody – used at about 50 nM; see Materials availability statement |
| Other | α-Actinin-CH1-Spec4 (Nano64) | This study | Coupled to A488; A647; | Nanobody – used at about 50 nM; see Materials availability statement |
| Other | Zasp52-PDZ (Nano65) | This study | Coupled to A488; A647; | Nanobody – used at about 50 nM; see Materials availability statement |
| Other | Zasp52-PDZ (Nano66) | This study | Coupled to A488; A647; | Nanobody – used at about 50 nM; see Materials availability statement |
| Chemical compound, drug | Rhodamine-phalloidin | Invitrogen, Cat. R415 | 1 in 500 |
Additional files
Download links
A two-part list of links to download the article, or parts of the article, in various formats.
Downloads (link to download the article as PDF)
Open citations (links to open the citations from this article in various online reference manager services)
Cite this article (links to download the citations from this article in formats compatible with various reference manager tools)
A nanobody toolbox to investigate localisation and dynamics of Drosophila titins and other key sarcomeric proteins
eLife 12:e79343.
https://doi.org/10.7554/eLife.79343


