A prefrontal network model operating near steady and oscillatory states links spike desynchronization and synaptic deficits in schizophrenia
- Department of Biology, Augsburg University, United States
- Department of Neuroscience, University of Minnesota, United States
- Medical Scientist Training Program (MD/PhD), University of Minnesota, United States
- Brain Sciences Center, VA Medical Center, United States
- Center for Cognitive Sciences, University of Minnesota, United States
Figures
Figure 1
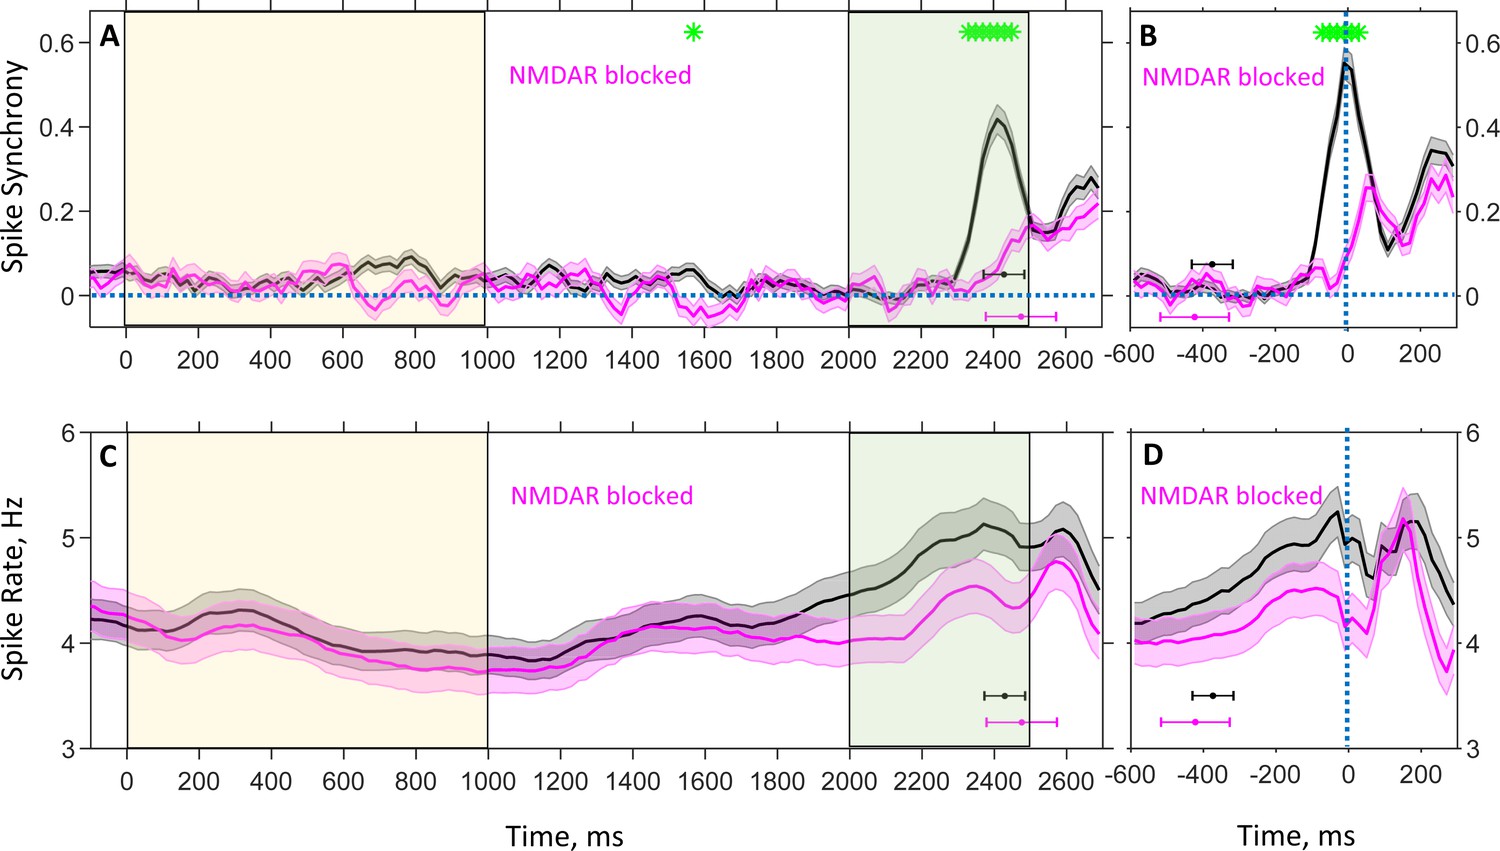
Population average spike rate and synchrony between spike trains of neuron pairs recorded during the DPX task as a function of time.
Plots show time evolution of spike synchrony (A, B) and spike rate (C, D) estimated with 100 ms temporal resolution for drug-naive (black) and drug (magenta) conditions. Spike synchrony was measured with 1 ms resolution, and only neuron pairs for which a reasonably reliable estimation of synchrony could be achieved contributed to the plots (see Materials and methods). (A, C): Trials are aligned to the cue onset ( ms); in all trials, the cue was presented until ms (yellow shaded area), followed by a 1,000 ms delay period, after which the probe was presented at ms for 500 ms (green shaded area). Color-coded horizontal error-bars indicate the mean and standard deviation of the motor response time for the corresponding drug condition. The numbers of contributing pairs for drug-naive and drug conditions are 524 and 195 (A), and the number of neurons are, correspondingly, 514 and 343 (C). (B, D): Trials are aligned to the time of motor response ( ms) to show the temporal modulation of synchrony and spike rate during the last 600 ms immediately preceding the response. Color-coded horizontal error-bars indicate the mean and standard deviation of the probe presentation time for the corresponding drug condition. The numbers of contributing pairs for drug-naive and drug conditions are 661 and 223 (B), and the number of neurons are, correspondingly, 538 and 343 (D). Shaded grey and magenta bands show the standard errors for spike synchrony (A, B) and rate (C, D). Green asterisks show the instances of times when the drug-naive and drug conditions are statistically different (false discovery rate 0.05 [Benjamini and Hochberg, 1995] using two-sample t-test p-values).
Figure 2 with 1 supplement
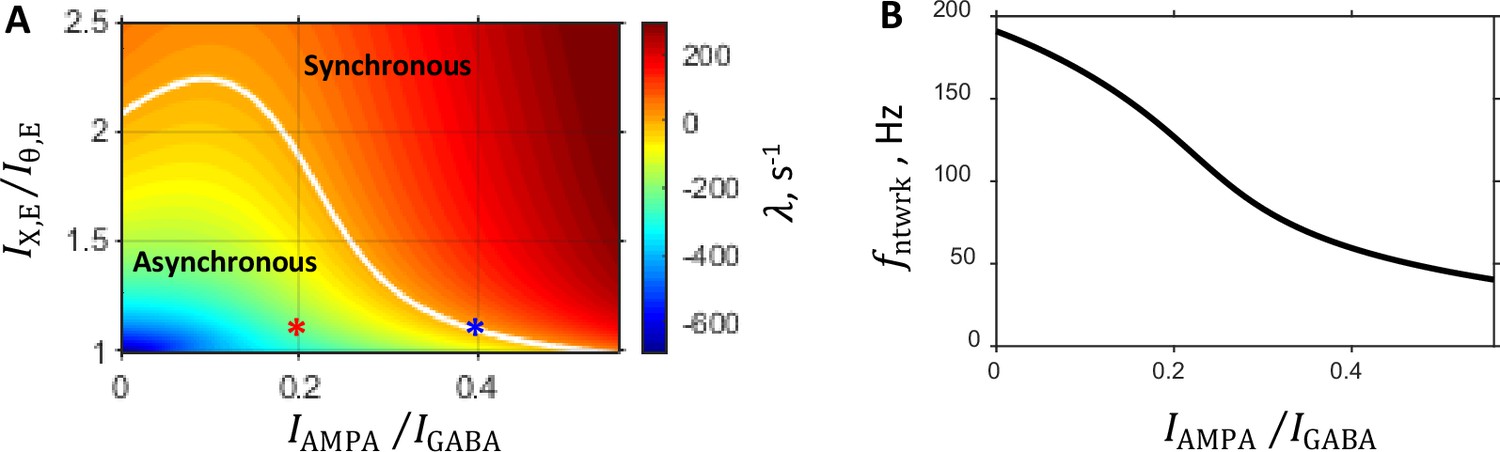
Characteristics of the system predicted by the linear stability analysis.
Parameters are as follows: prescribed firing rates of excitatory and inhibitory populations are 5 Hz and 20 Hz, respectively; external input spike rate is 5 Hz; and the balance between NMDA and GABA currents is fixed at 0.15. (A:) State diagram in the parameter plane showing color coded value of the rate of instability growth : in the region of the parameter space where the asynchronous state is stable, whereas the region where corresponds to the synchronous oscillation state. The two regimes are separated by a critical line on which . This boundary, shown by a white line, is the locus where the stationary network dynamic becomes unstable, and oscillatory population activity develops. Each point in this parameter plane corresponds to a network with a specific set of eight synaptic conductances provided by the mean field approximation. Red and blue asterisks are the points in the state diagram corresponding to the steady and critical primary networks, respectively (see Selection of Primary Networks in Results). (B:) Network oscillation frequency that develops on the critical line as a function of the balance between AMPA component of recurrent excitation and inhibition.
Figure 2—figure supplement 1
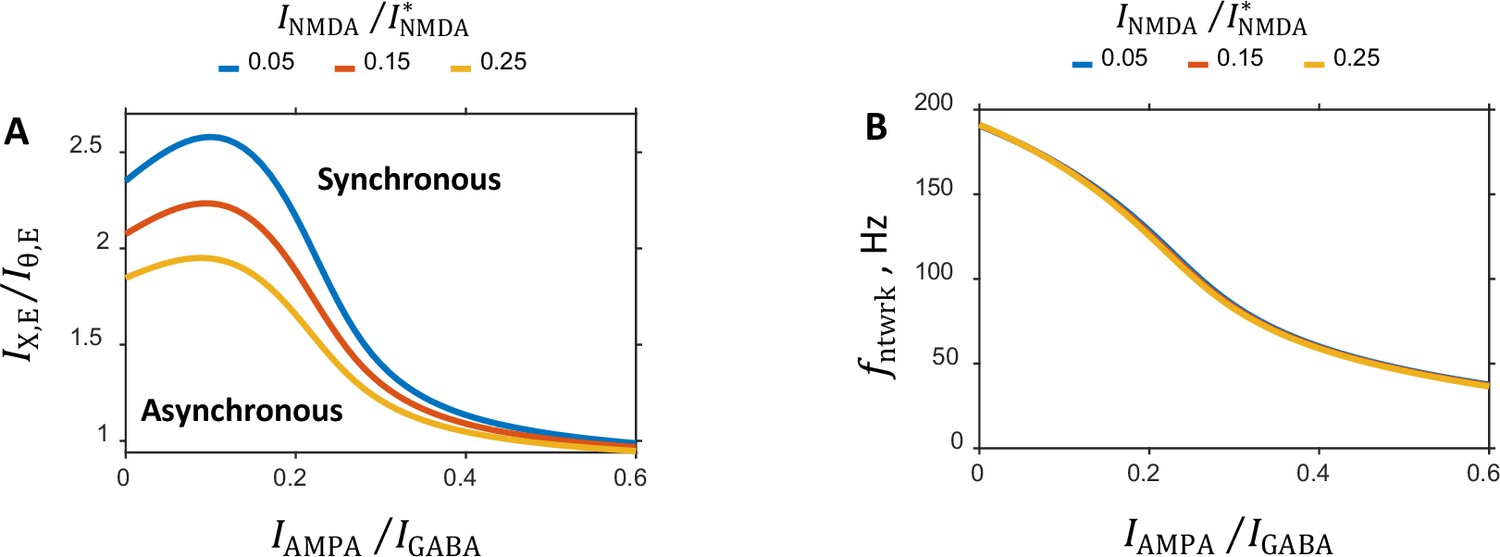
Dependence of the characteristic features of the network on the balance between the NMDA and GABA currents.
(A:) Critical line separating the asynchronous and synchronous states in the parameter plane is shown for several values of the balance. (B:) Oscillation frequency on the critical line as a function of the balance between AMPA component of recurrent excitation and GABA inhibition. Plots for different values of the balance nearly completely overlap.
Figure 3 with 1 supplement
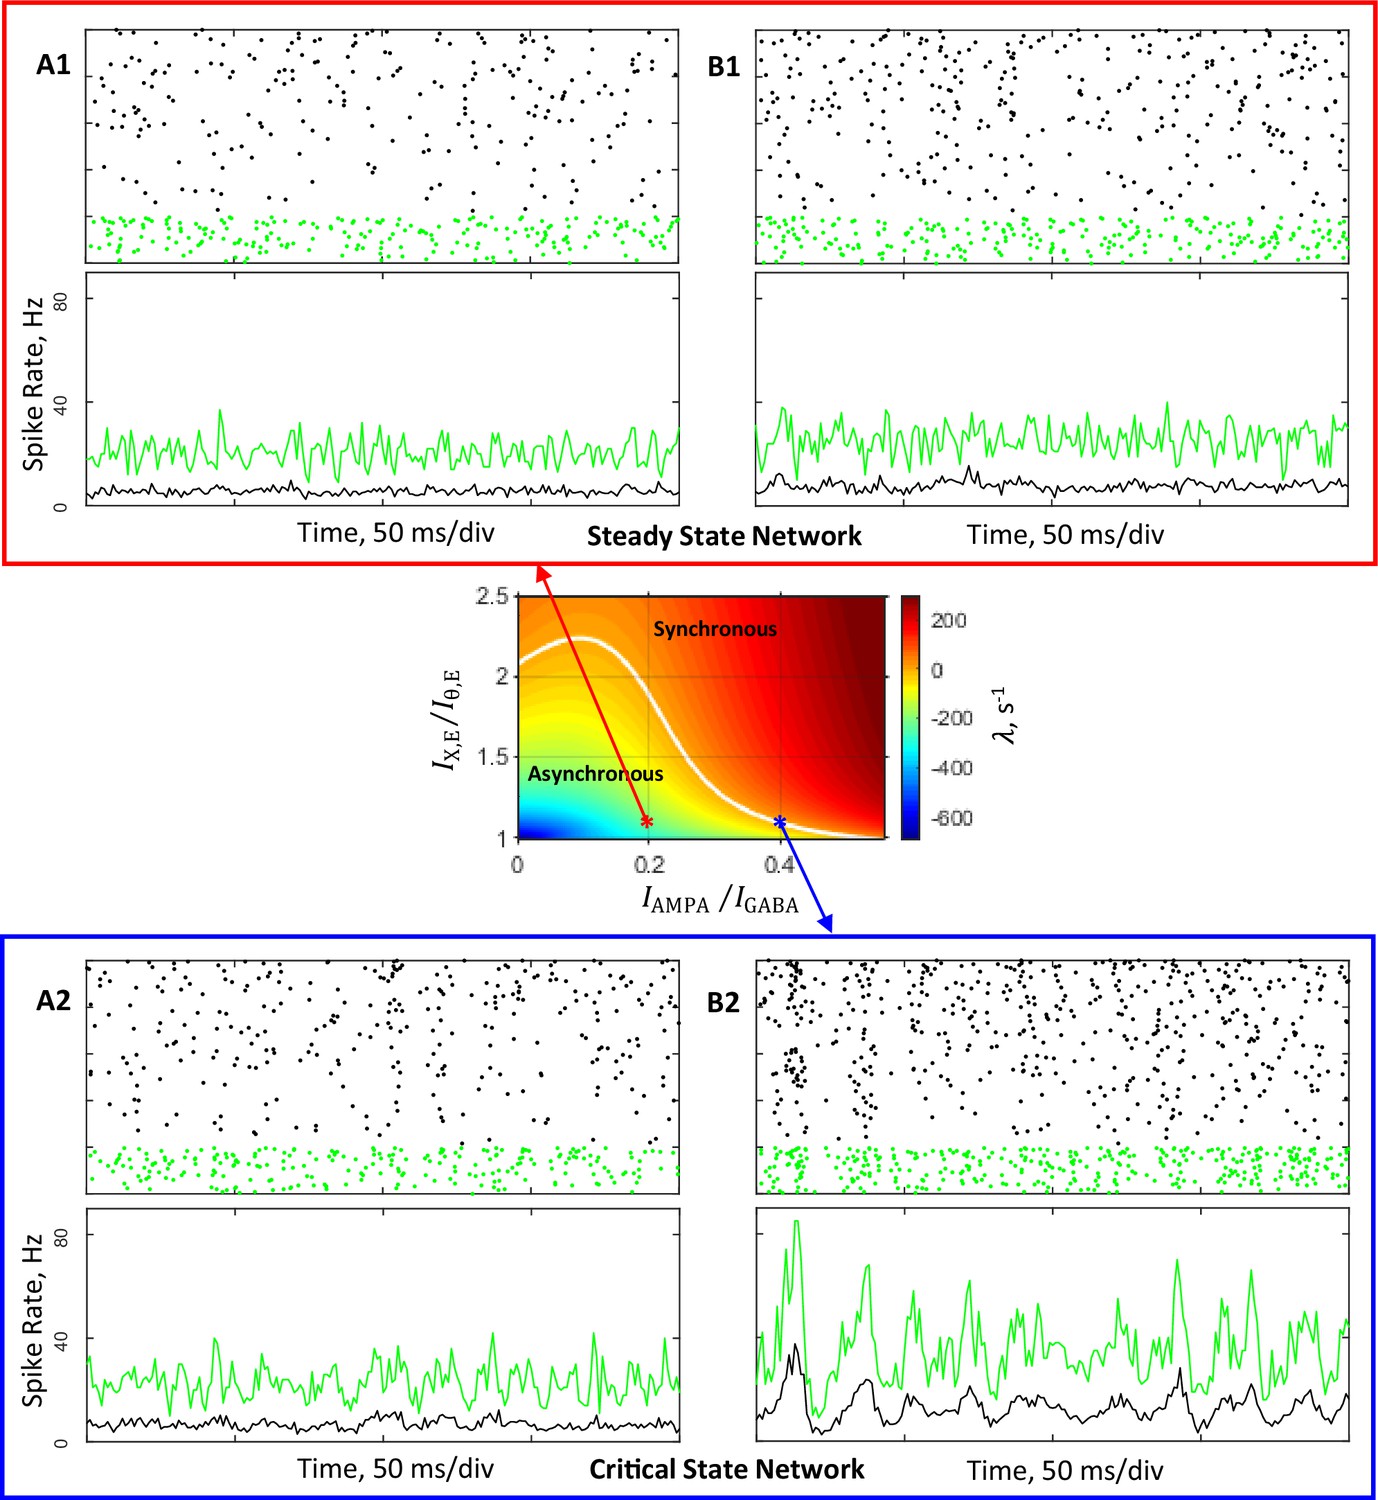
Simulations of networks composed of 4,000 excitatory and 1,000 inhibitory neurons connected randomly with probability 0.2.
Conductance parameters are solutions of mean field equations for the steady state primary network (A1, B1) and the critical state primary network (A2, B2) corresponding to the red and blue asterisks, respectively, in the state plane shown in Figure 2A and inset. (A1, B1), (A2, B2): Top, spike rasters (sorted by rate) of 200 excitatory (black) and 50 inhibitory (green) neurons. Bottom, time-varying activity (1ms resolution) of excitatory (black) and inhibitory (green) populations. (A1, A2): External input spike rate Hz. Excitatory and inhibitory neurons display average firing rates of, respectively, 5.3 Hz and 20 Hz (A1), and 6.3 Hz and 22 Hz (A2). (B1, B2): In these simulations was increased by 5%. Excitatory and inhibitory neurons display average firing rates of, respectively, 7.5 Hz and 25 Hz (B1), and 12 Hz and 34 Hz (B2).
Figure 3—figure supplement 1
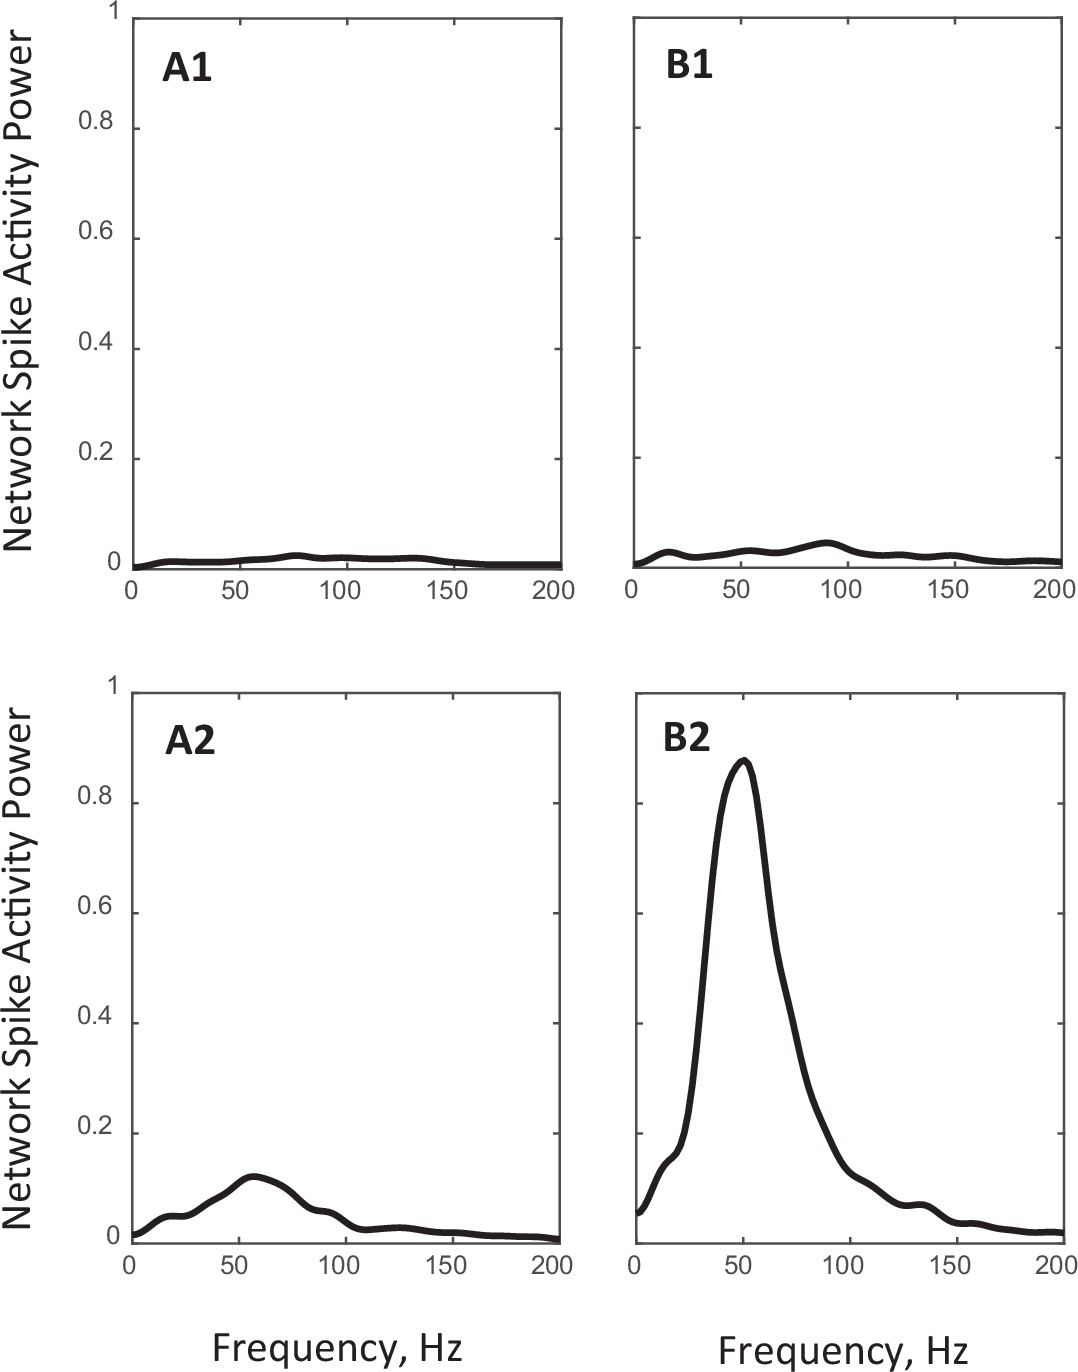
Power spectra of population spiking activity observed in network simulations.
(A1, B1): Spectra of the steady state network activities shown in Figure 3A1 and Figure 3B1, respectively. (A2, B2): Spectra of the critical state network activities shown in Figure 3A2 and Figure 3B2, respectively.
Figure 4
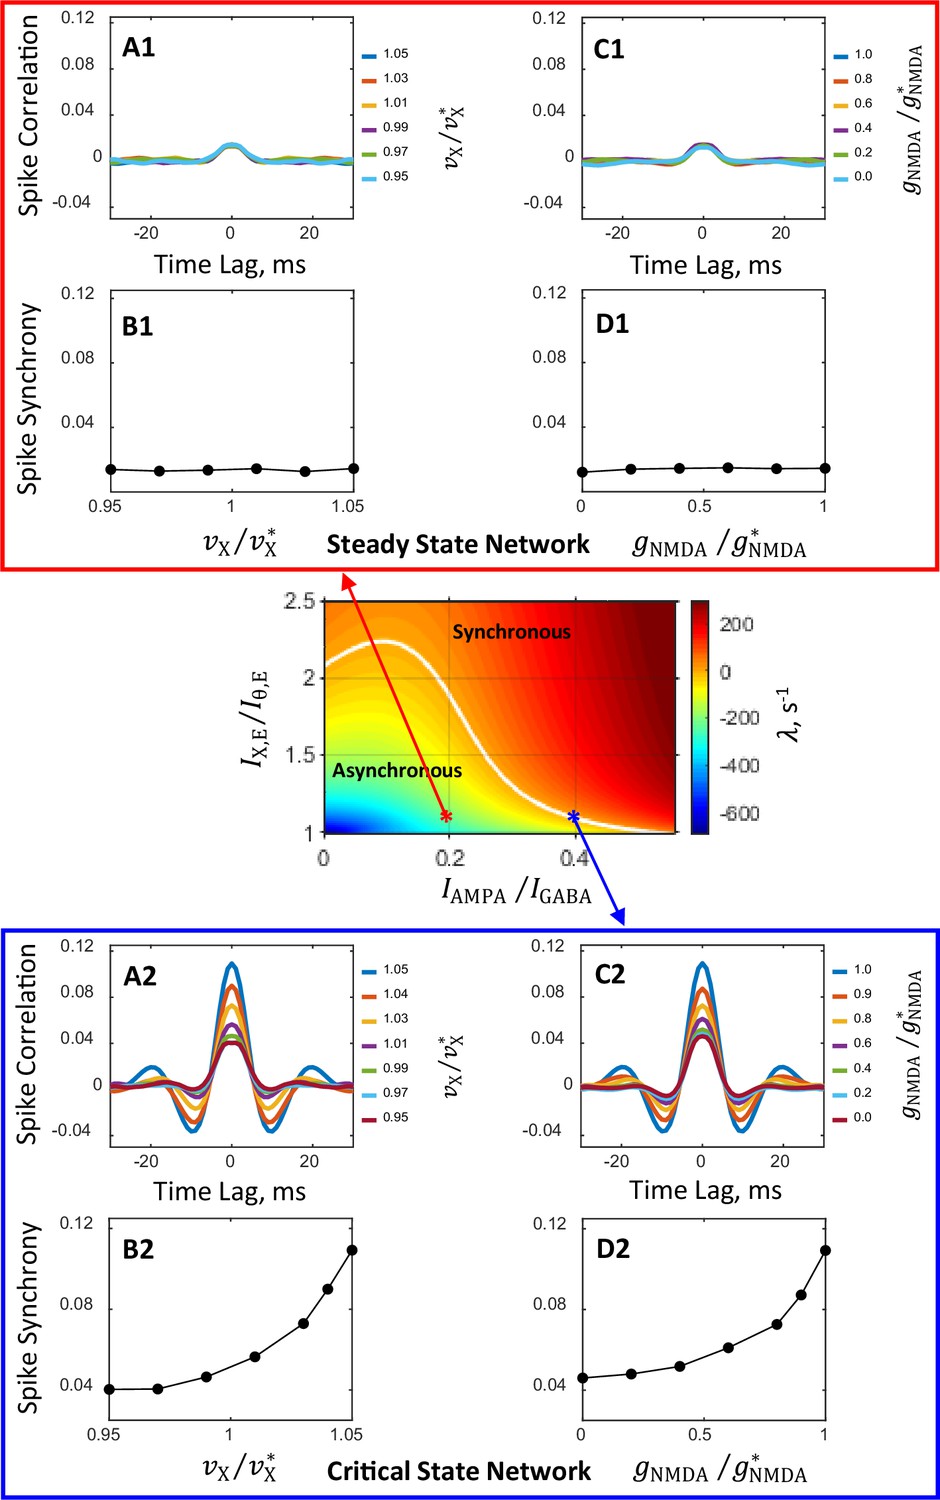
Spiking activity correlation and synchrony computed from spike trains of simulated networks.
Conductance parameters are solutions of mean field equations for the steady state primary network (A1, B1, C1, D1) and the critical state primary network (A2, B2, C2, D2) corresponding to the red and blue asterisks, respectively, in the state plane shown in Figure 2A and inset. For the steady state network, correlation and synchrony are weak and insensitive to the modulation of external input spike rate (A1, B1) and NMDAR conductance (C1, D1). In contrast, for the critical state network spike correlation depends strongly on the external spike rate (A2) and NMDAR conductance (C2) and the degree of spike synchrony could be modulated from relatively weak to strong (B2, D2). Results shown in (C1, D1, C2, D2) are obtained from simulations in which is increased by 5%. The magnitudes of modulation of and are normalized by their standard values and , respectively. The numbers next to color-coded lines for spike correlation plots show the normalized magnitudes of external input spike rates, , (A1, A2) and NMDAR conductance, , (C1, C2).
Figure 5
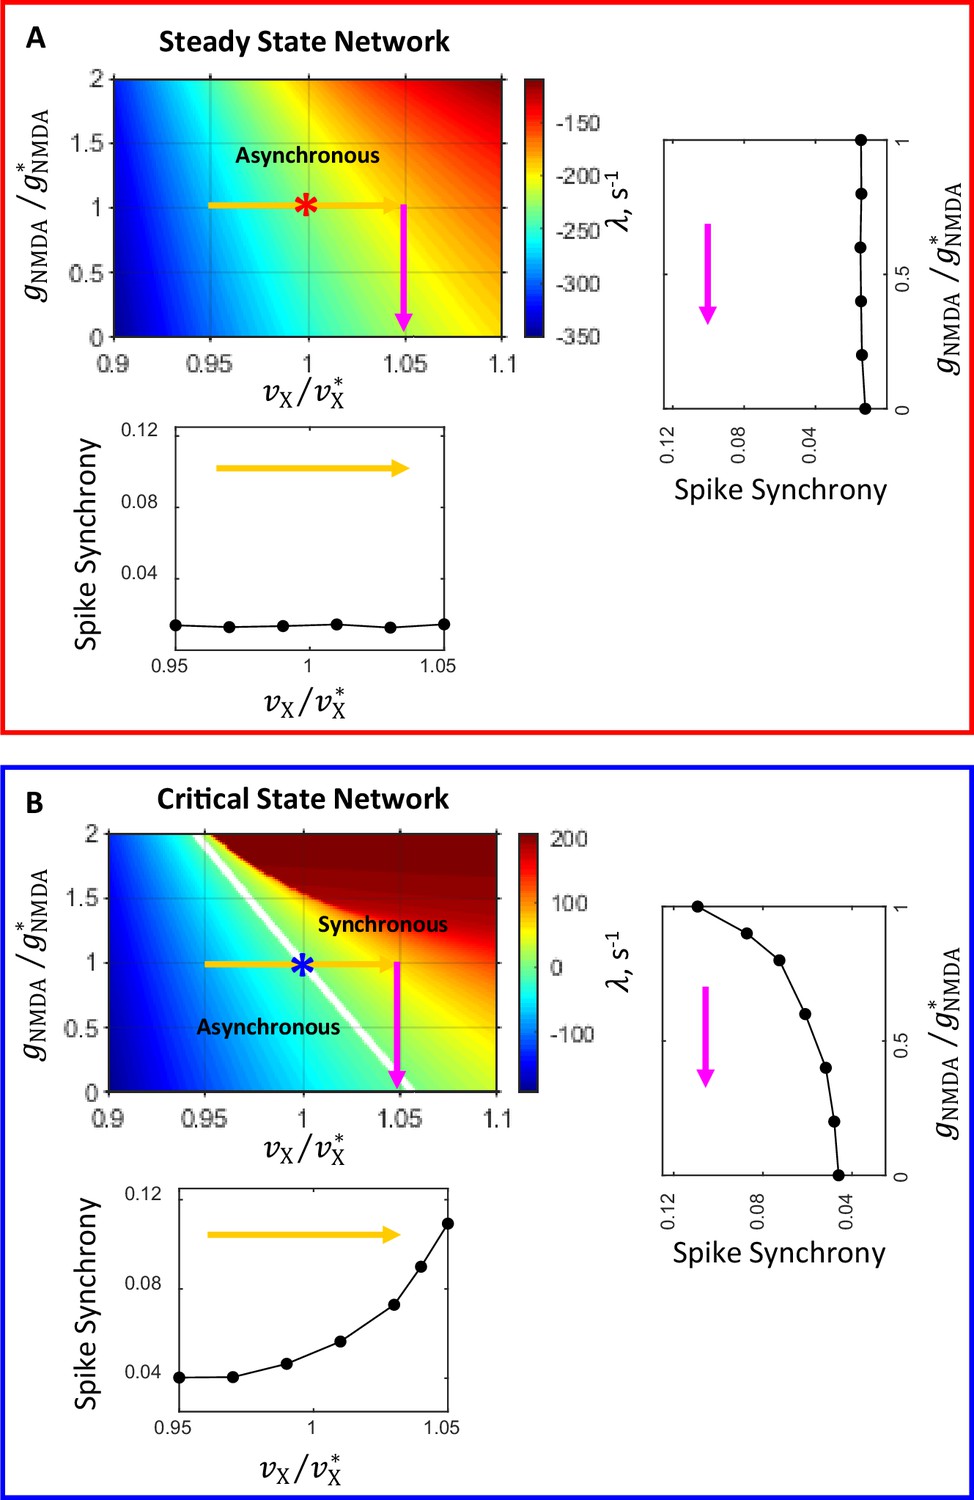
Network state diagrams in th e plane.
The critical line (, white line) separates the parameter plane into regions of asynchronous stationary () and synchronous oscillatory () regimes. In the state diagram for the steady state network (A) the critical line is beyond the area covered by the diagram. Asterisks correspond to the steady (A) and critical (B) state primary networks in these planes. Color-coded arrows show the range of modulation of (yellow) and (magenta) corresponding to the range of modulation of these parameters for which temporal correlations of spiking activity and synchrony are shown in Figure 4. The insets show how spike synchrony changes along the corresponding arrows in the state diagrams. These insets display the same plots for spike synchrony that are shown in panels B1 and B2 (bottom insets in A and B, correspondingly) and D1 and D2 (right insets in A and B, correspondingly) in Figure 4.
Figure 6 with 2 supplements
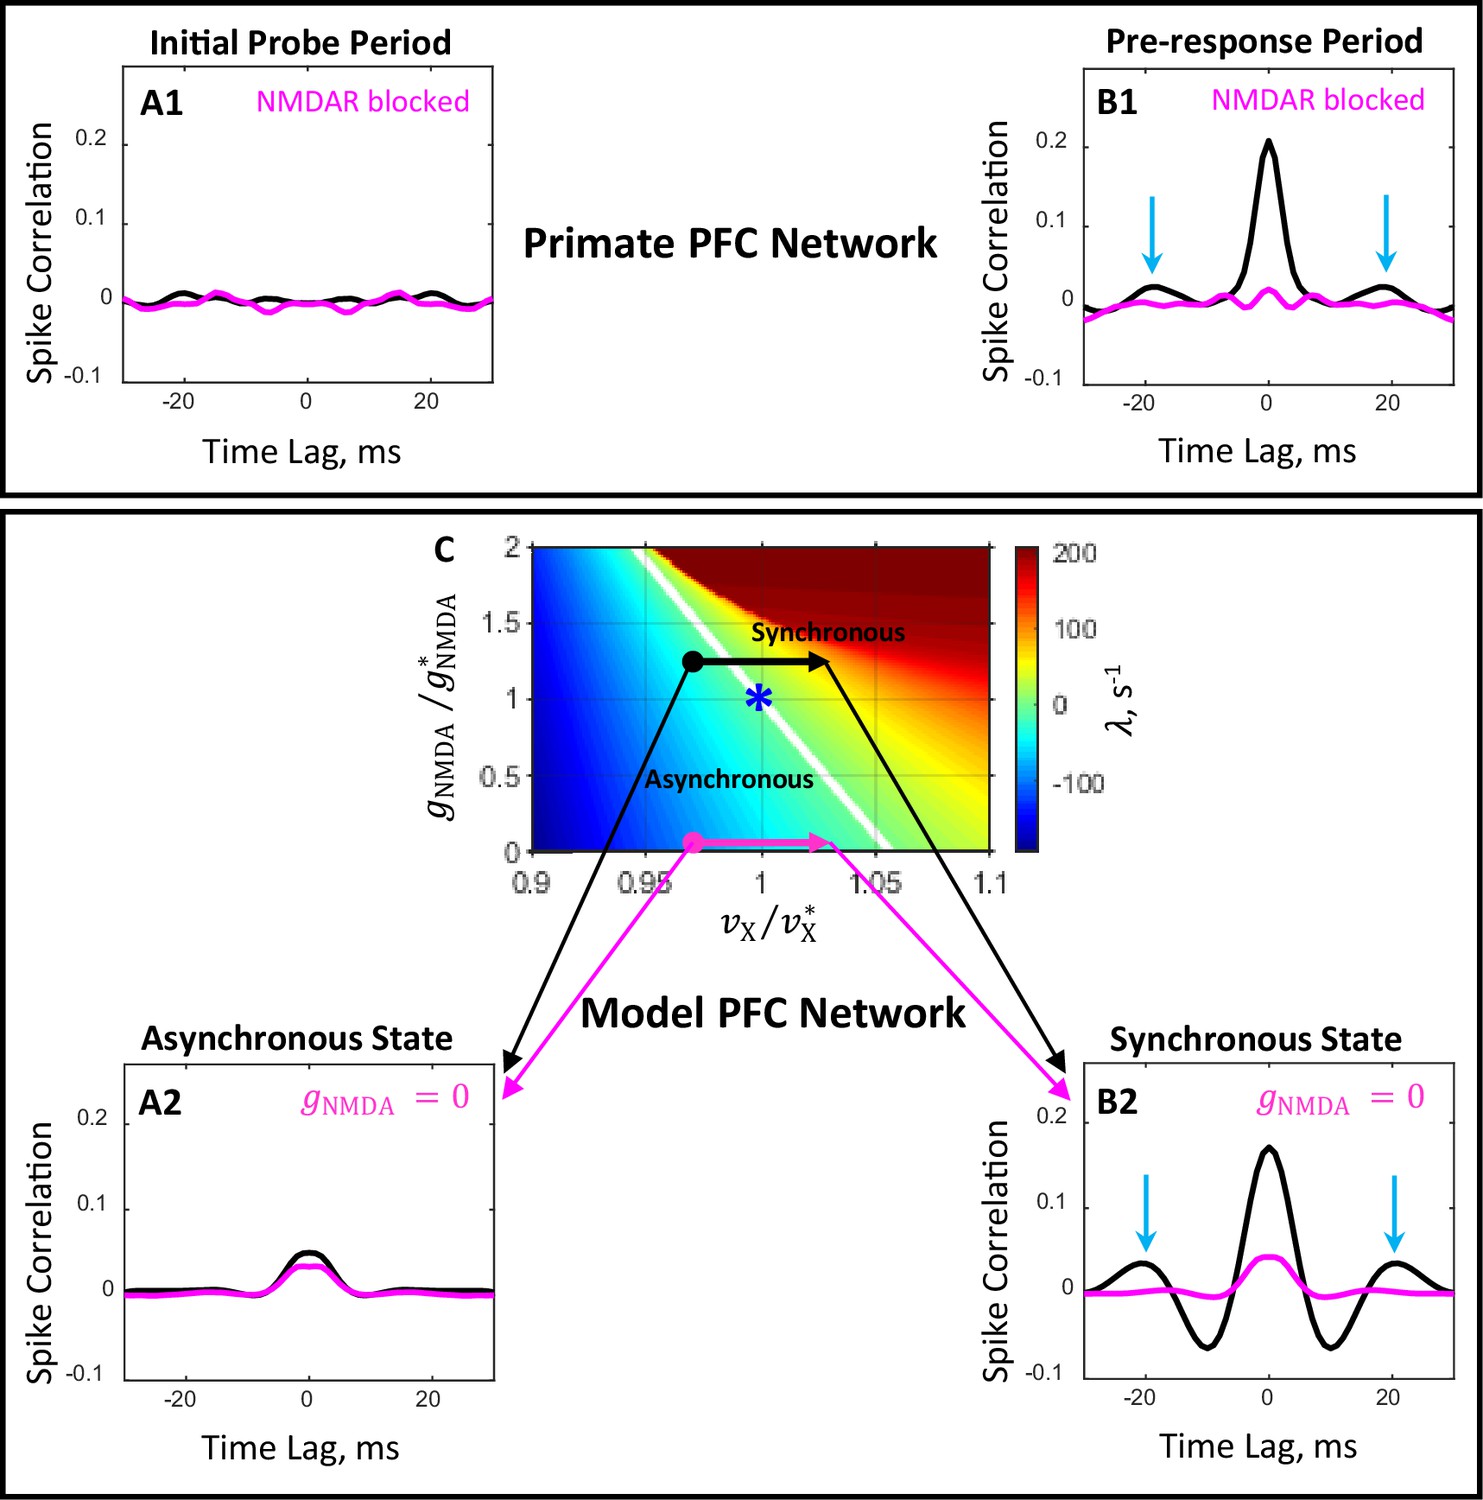
Comparison of the effects of blocking of NMDAR in primate PFC and in the prefrontal circuit model.
(A1, B1) Plots show population average temporal correlations between spiking activity of neuron pairs recorded from PFC during the 200 ms period immediately following probe presentation (A1) and the 200 ms period immediately preceding the motor response (B1) in the DPX task (Zick et al., 2018). In the drug-naive condition (black line), population activity during the pre-response period develops characteristics of synchronous oscillation with a frequency of ∼55 Hz (peaks at time lags ±18 ms, blue arrows, B1). Administration of a drug blocking NMDAR (magenta line) desynchronizes neuronal activity during the pre-response period (B1). (A2, B2, C) Temporal correlations (A2, B2) computed from spike trains of simulated networks corresponding to four conditions shown in the state plane (C) by bold dots and arrow heads: initial probe ( , A2) and pre-response ( , B2) periods for drug-naive ( , black line) and drug ( , magenta line) conditions. The critical line (, white line in panel C) separates the parameter plane into regions of asynchronous stationary () and synchronous oscillation () regimes. The locus of the blue asterisk corresponds to the critical state primary network in this plane.
Figure 6—figure supplement 1
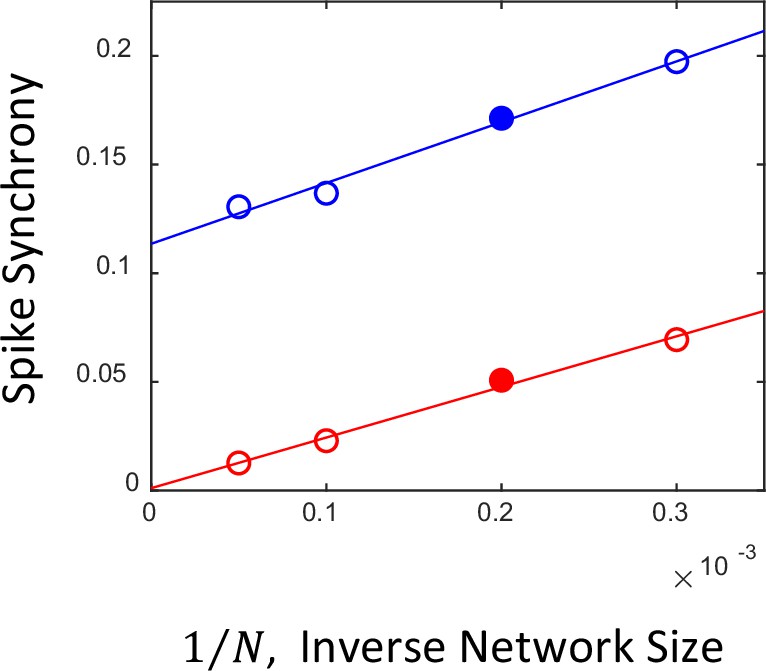
Dependence of spike synchrony on the network size.
In a large (network size ) and sparsely connected network (probability of connection ), when the population average firing rate is stationary and the network is in the asynchronous state, spike synchrony vanishes in the limit , while the average number of connections of individual neurons remains finite. The small 0-lag peak seen for the asynchronous network in panel Figure 6 A2 is due to the effect of the finite size of the network (Brunel and Hakim, 1999) in the simulations. The plot shows spike synchrony obtained from the spike trains of the asynchronous steady (red circles) and synchronous oscillatory networks (blue circles) as a function of the simulated network size (from left to right, 20,000, 10,000, 5,000, and 3,333). The red and blue lines represent linear fits to the corresponding simulated data. It can be seen that, as the sizes of the networks increase, the synchrony of the asynchronous network extrapolates to zero in the limit , whereas for the synchronous network it remains finite. Solid red and blue circles correspond to the networks in panels (Figure 6 A2 and B2), respectively.
Figure 6—figure supplement 2
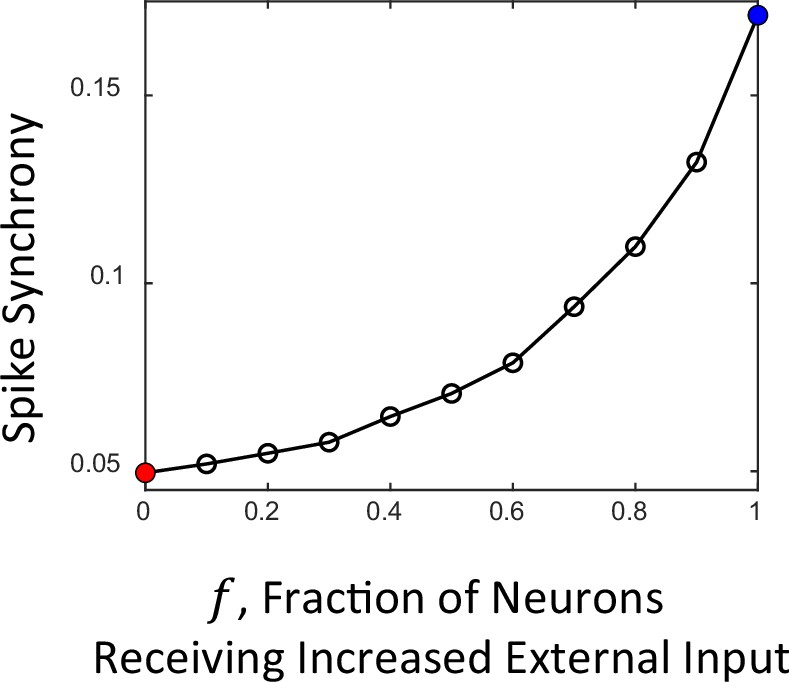
Dependence of spike synchrony on the fraction of neurons receiving increased external input.
In the framework of computational modeling studies of cortical networks, it is commonly assumed that the model network receives specific external inputs during specific events such as cue/probe presentations in the course of a behavioral task. It is assumed that such inputs are received by a small (~10%) specific group of neurons, which are selective to a particular cue/probe. In our model, we assume that during the pre-response period all network neurons receive elevated external input, which is modeled as an increase in the external spike rate from its background level. Due to this input the network switches from the steady asynchronous to synchronous oscillatory dynamics resulting in the increase of spike synchrony, similarly to what is observed in the course of the DPX task around the time of response (Figure 1B). On the other hand, during the cue and initial probe presentation periods no increase in the spike synchrony occurs in the empirical data (Figure 1A, B). To understand whether our model is consistent with this observation as well, we carried out a series of simulations in which the fraction of neurons that received the increase in external spike rate varied from 0 to 1. The plot shows spike synchrony obtained from the spike trains of simulated networks as a function of the fraction . In this approach, the cue and probe presentations correspond to the case when relatively small fraction of neurons () receive the increase in external input, in contrast to the case of the pre-response period, when all neurons receive increased input (). It is seen that for small the spike synchrony remains week, which is in agreement with the experimental observations. The solid red and blue circles correspond to the spike synchrony values of networks in panel Figure 6A2 and Figure 6B2, respectively.
Figure 7
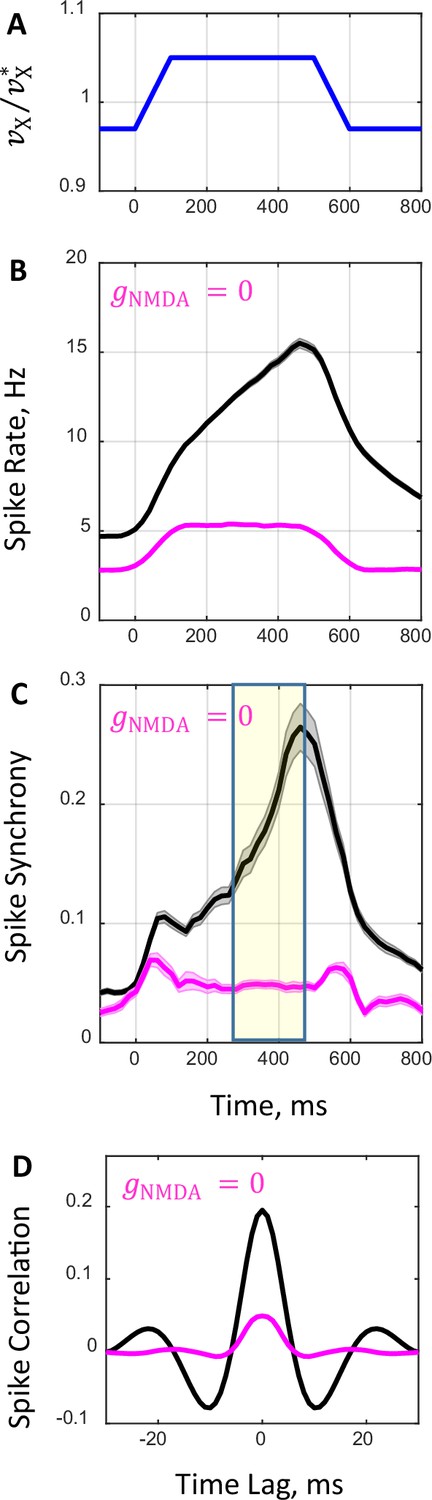
Network spiking dynamics in response to transient input.
(A) Temporal profile of external rate. Initially, external rate is fixed at a lower level () and the network is in the asynchronous state. At time the rate begins to increase and in the next 100 ms it crosses the boundary between the asynchronous and synchronous states reaching a higher level (). The rate is kept constant for the next 400 ms and, afterwards, it decreases within 100 ms and returns to its initial level corresponding to the asynchronous state. (B, C) Average population spike rate (B) and synchrony (C) obtained from spike trains of 100 network simulations that received the transient external input shown in A for drug-naive (, black line) and drug conditions (, magenta line). Shaded grey and magenta bands show the standard errors for spike rate (B) and synchrony (C). (D) Population average temporal correlations between spiking activity of neuron pairs obtained in simulations during the 200 ms period shown in (C) by yellow shaded area.
Figure 8
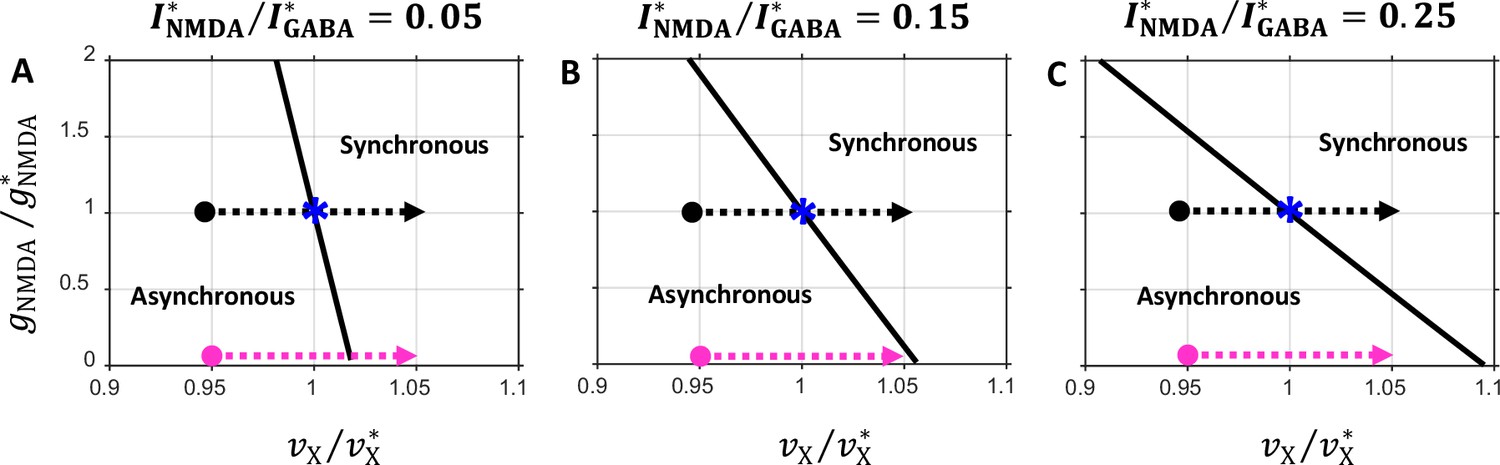
State diagrams in the plane obtained for several values of the balance between the NMDA and GABA currents.
Notations are the same as in Figure 6C. (A) ; (B) ; (C) . Note that the critical line orientation depends on the balance.
Figure 9
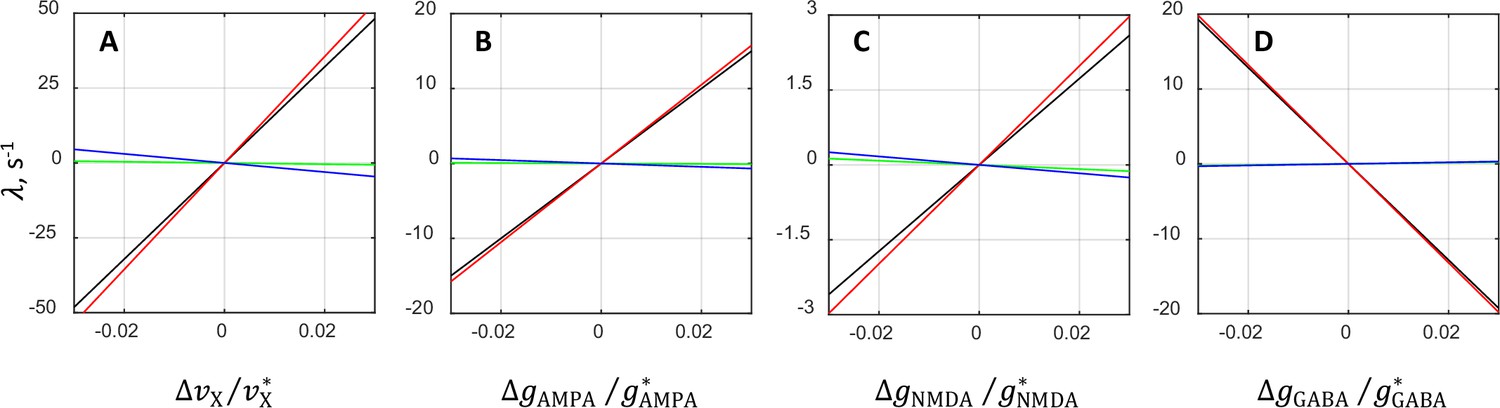
Contributions from various terms in the analytical approximation of the oscillatory instability growth rate .
The plots show separately the rate and its individual terms , , and (Equation 1) as functions of the relative deviations from the critical value of external rate (A), AMPAR conductance (B), NMDAR conductance (C), and GABAR conductance (D). The comparison is performed by varying the underlying parameter while keeping the other parameters at their critical values. Black lines correspond to the rate , whereas red, green, and blue lines correspond to the terms involving , , and , respectively. In each plot, the values corresponding to red, blue, and green lines add up to the values of black lines. Note that red lines run very close to black lines, and blue and green lines are nearly horizontal. This indicates that the term alone approximates the dependence of on the synaptic parameters rather accurately and that the contributions from the remaining terms and are rather small.
Appendix 1—figure 1
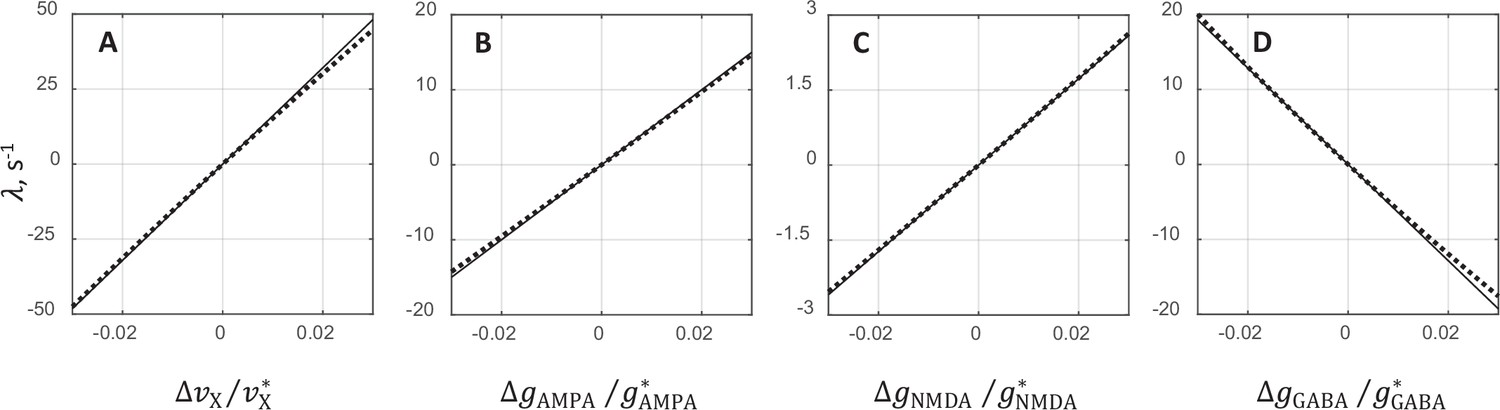
Comparison between exact solution and analytical approximation for the oscillatory instability growth rate .
The comparison is performed separately for each of the three synaptic conductances and external rate by varying one of the underlying parameters while the remaining three keeping constant at their critical values. It is seen that in all cases, the analytical expression for provides a very good approximation of the exact relationship.
The plots show the rate as a function of the relative deviation from the critical value of external rate (A), AMPAR conductance (B), NMDAR conductance (C), and GABAR conductance (D). The comparison is performed by varying the underlying parameter while keeping the other parameters at their critical values. The solid lines show analytical approximations for given by Equations 1, 2, and the dotted lines are the exact solutions obtained from the mean field and stability analysis equations.
Appendix 2—figure 1
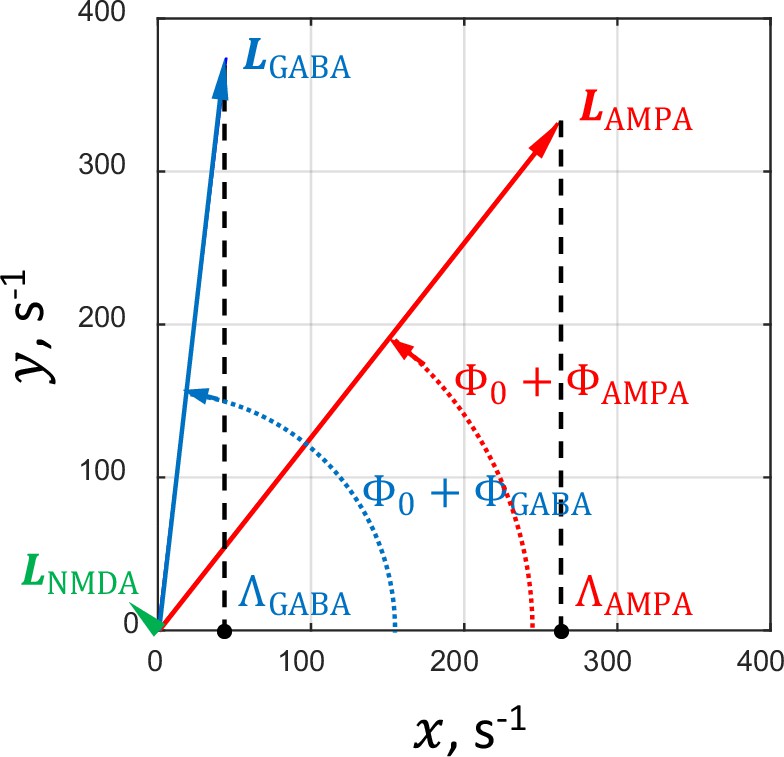
Geometric interpretation of the factors , , and .
For illustration purposes, the factors , , and (Equation 1) are associated with corresponding vectors , , and (see text for details). The projections of these vectors on the -axis are equal to their respective factors. The vectors and corresponding to the values of and in the critical network are shown in red and blue, respectively. The green arrowhead at the origin relates to the vector corresponding to . Due to the small size of the vector, it cannot be depicted in scale on this plot.
Appendix 4—figure 1
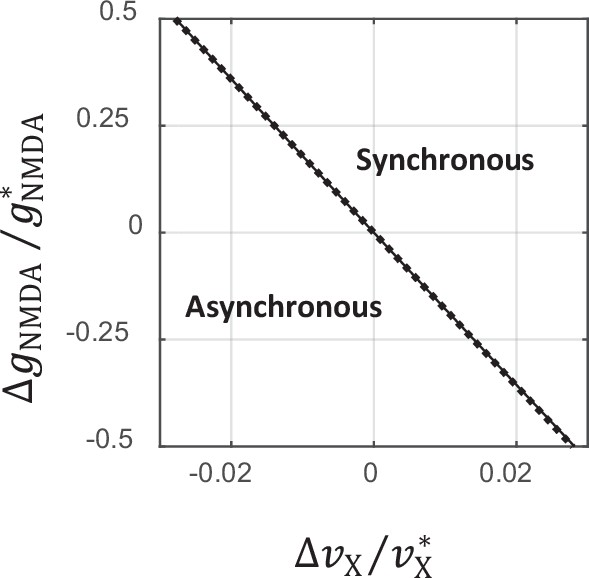
Comparison between exact and analytical approximation of the critical line separating asynchronous and synchronous states.
The solid line shows the analytical approximation of the critical line given by Equation 112. The dotted line corresponds to the exact solution obtained from the mean field and stability analysis equations. On the scale of this plot, the two curves virtually overlap.
Additional files
Download links
A two-part list of links to download the article, or parts of the article, in various formats.
Downloads (link to download the article as PDF)
Open citations (links to open the citations from this article in various online reference manager services)
Cite this article (links to download the citations from this article in formats compatible with various reference manager tools)
A prefrontal network model operating near steady and oscillatory states links spike desynchronization and synaptic deficits in schizophrenia
eLife 13:e79352.
https://doi.org/10.7554/eLife.79352


