Impact of blindness onset on the representation of sound categories in occipital and temporal cortices
- Institute for research in Psychology (IPSY) & Neuroscience (IoNS), Louvain Bionics, Crossmodal Perception and Plasticity Laboratory - University of Louvain (UCLouvain), Belgium
- Department of Brain and Cognition, KU Leuven, Belgium
- Center for Mind/Brain Studies, University of Trento, Italy
- School of Health Sciences, HES-SO Valais-Wallis, Switzerland
- The Sense Innovation and Research Center, Lausanne and Sion, Switzerland
Figures
Figure 1
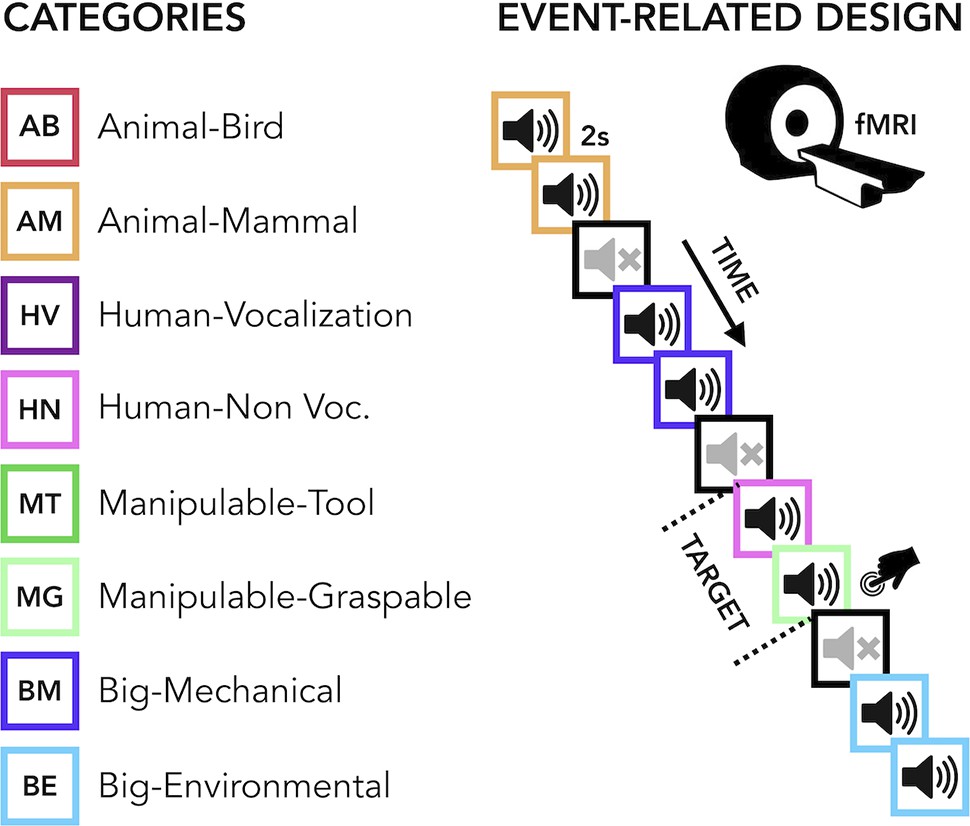
Experimental design.
(Left) Categories of stimuli. (Right) Design of the fMRI experiment. (Right) Regions of interest (ROIs) selected from groups’ contrasts. β-Values from each group and ROIs for every main category (animal, human, manipulable, big objects and places) are reported in the orange (temporal) and green (occipital) rectangles.
Figure 2 with 1 supplement
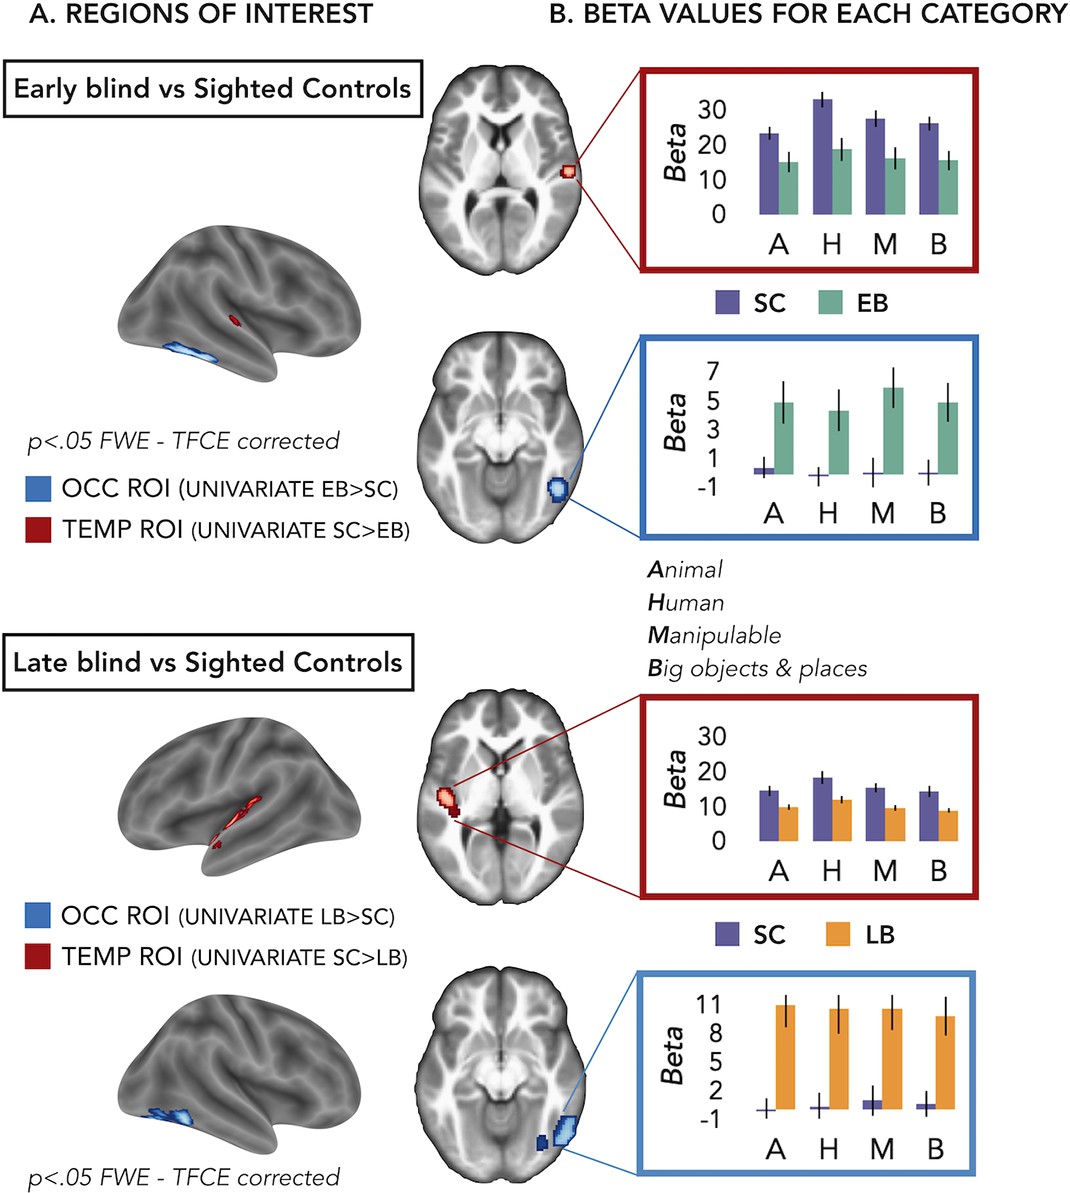
Regions of interest (ROIs).
(A) ROIs selected from groups’ contrasts at the univariate level. Note that, for illustration purpose, we report here the groups univariate contrasts including all subjects, but to avoid circular analyses we actually created ad hoc ROIs using a leave-one-subject-out approach (i.e. for each subject we excluded himself/herself from the univariate contrast). (B) β-Values from each group and ROIs for every main category (animal, human, manipulable, big objects and places) are reported in the red (temporal) and blue (occipital) rectangles. Black bars show standard error (sample size: Early Blind=16; Late Blind=15; Sighted Controls=20).
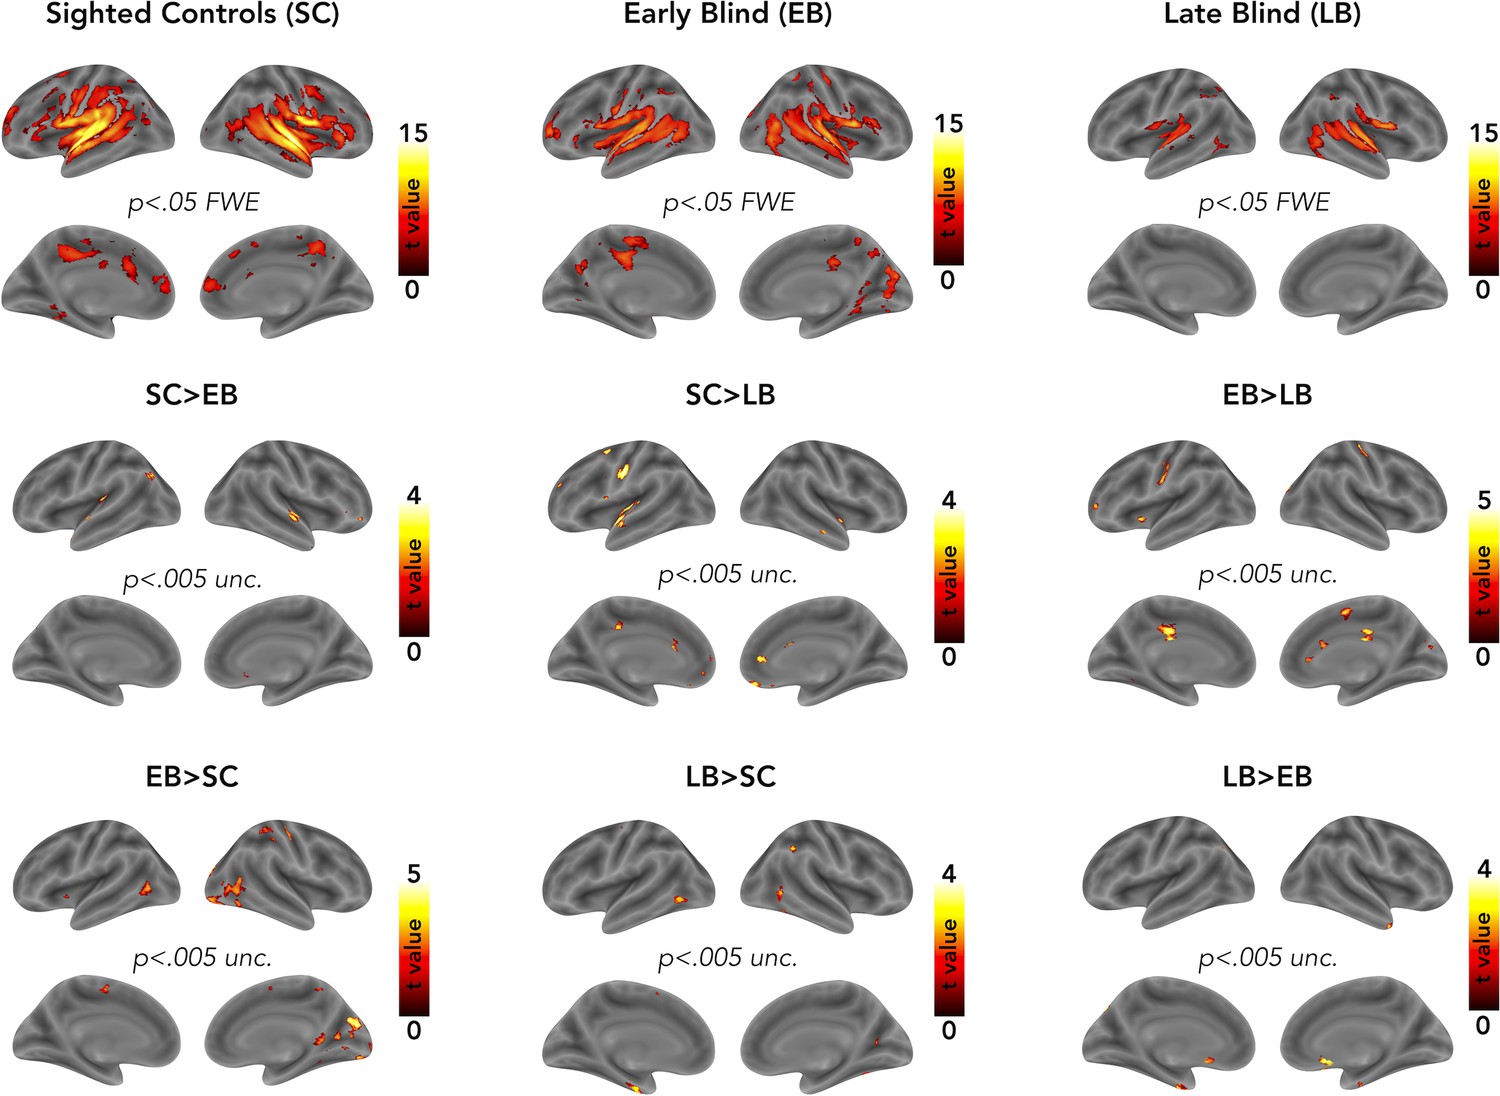
Figure 2—figure supplement 1

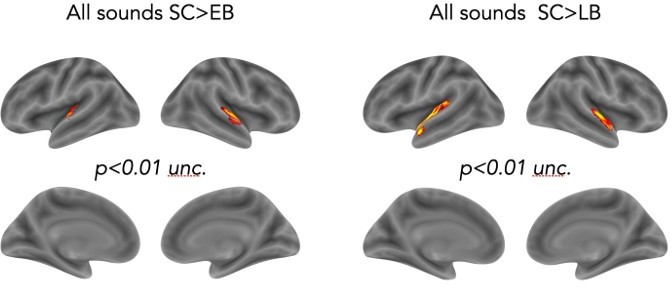
Univariate whole brain analyses.
In the first row the results within each group (sighted, early blind, and late blind) for the contrast All Sound > Baseline are reported. In the second and third rows all the possible groups’ contrasts are reported.
Figure 3 with 2 supplements

Multivoxel pattern (MVP) classification results in the regions of interest (ROIs).
Eight-way decoding results from the early blind/sighted control (EB/SC) groups (left) and late blind (LB)/SC groups (right). Black bars show standard error (sample size: Early Blind=16; Late Blind=15; Sighted Controls=20).
Figure 3—figure supplement 1
Multivoxel pattern (MVP) classification results at the searchlight level.
Figure 3—figure supplement 2
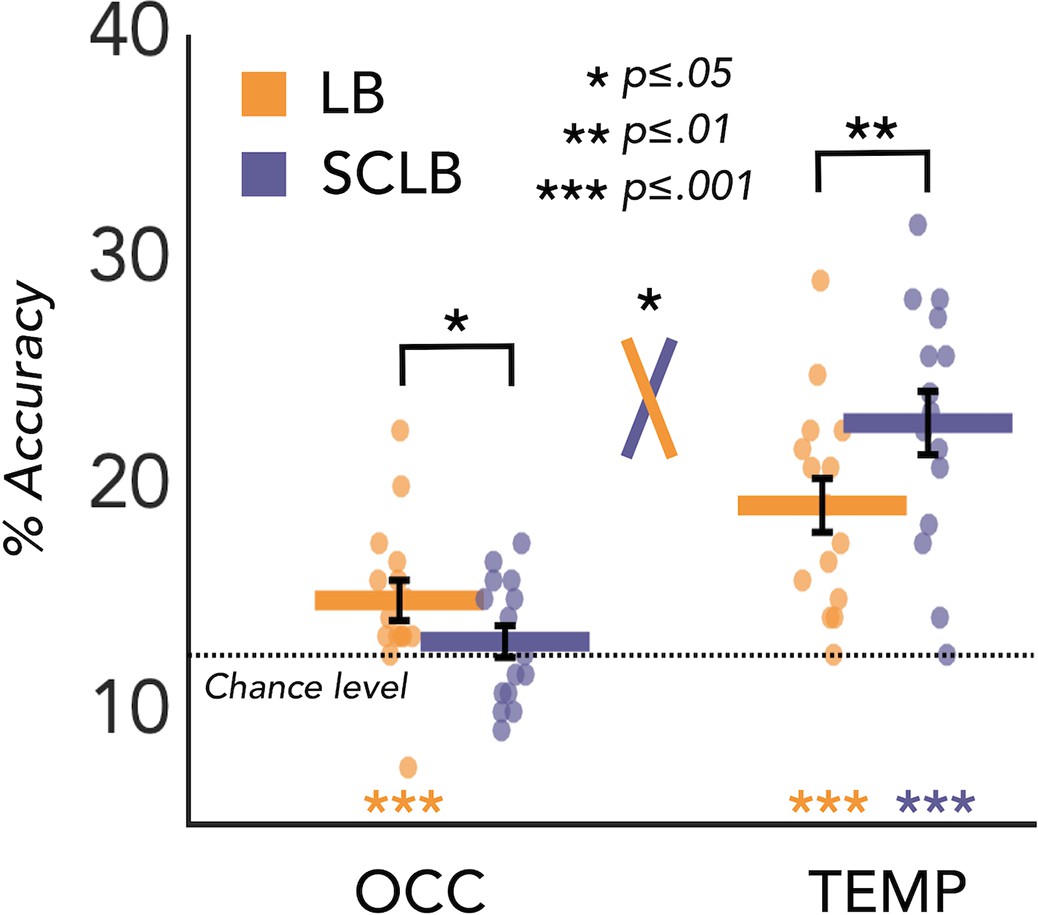
Multivoxel pattern analysis (MVPA) results for the late blind/sighted control (LB/SC) (age matched).
In the SCLB group the decoding accuracy is significant in the temporal (DA = 22.83%; p<0.001) but not in the occipital (DA = 13.11%; p=0.18) region of interest (ROI). In the LB group the decoding accuracy is significant in both temporal (DA = 17.89%; p<0.001) and occipital (DA = 14.39%; p=0.002) regions. A permutation test also revealed a significant difference between groups in both regions. In the occipital cortex the decoding accuracy value is significantly higher in LB than the SC (p=0.03, Cohen’s d=0.59), while in the temporal ROI the accuracy value is significantly higher in SC than LB (p=0.01, Cohen’s d=0.72). Importantly, the adjusted rank transform test (ART) 2 Groups × 2 ROIs revealed a significant group by region interaction (F(1,28)=4.23; p=0.04). The results are similar to the results we obtained from the LB/SC comparison (not age matched). Black bars show standard error (sample size: Late Blind=15; Sighted Controls=15).
Figure 4 with 1 supplement
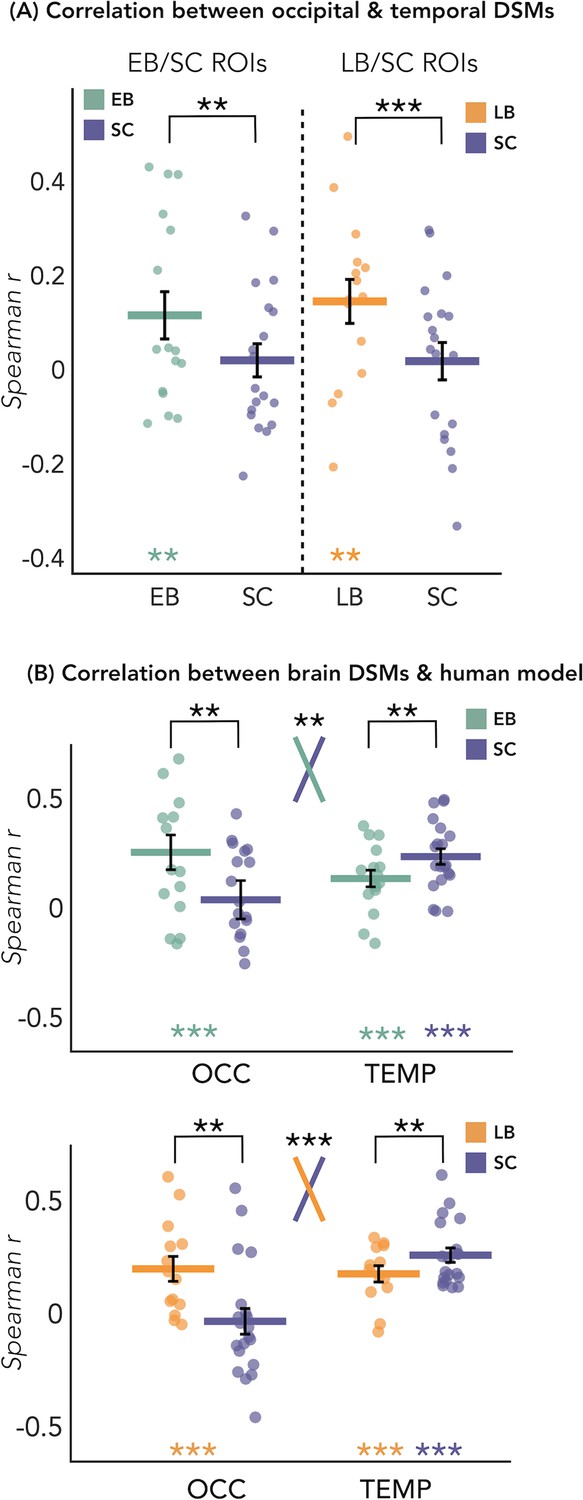
Dissimilarity matrices (DSMs) correlations.
(A) Spearman’s correlation between occipital and temporal DSMs. (B) Spearman’s correlation between brain DSMs (occipital and temporal) and the human model. Black bars show standard error (sample size: Early Blind=16; Late Blind=15; Sighted Controls=20).
Figure 4—figure supplement 1
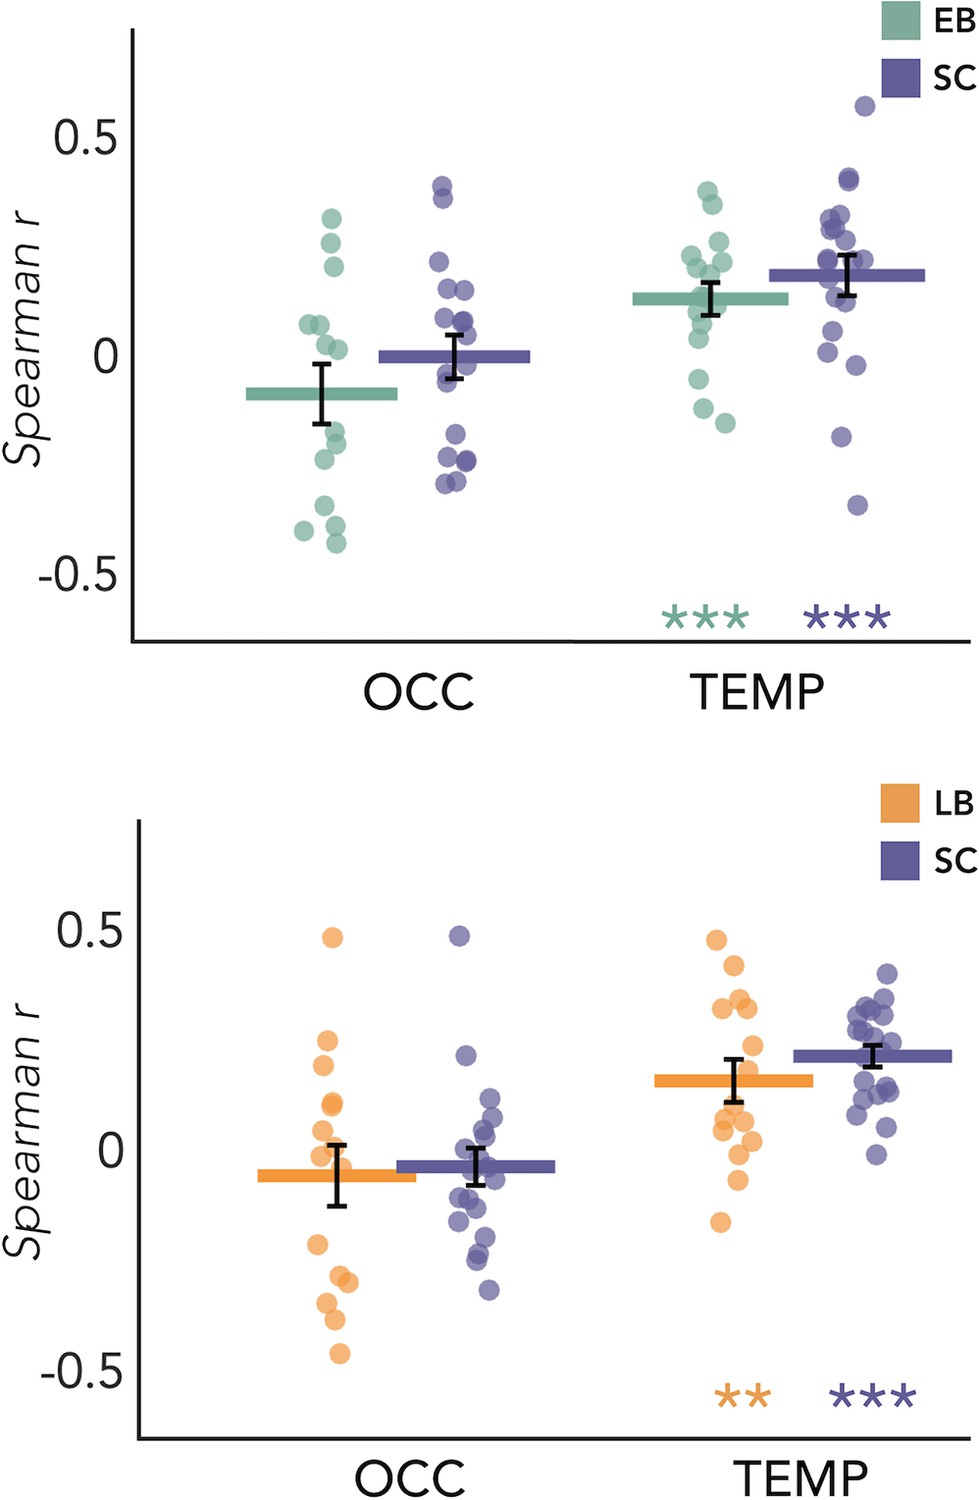
Correlation of brain dissimilarity matrices (DSMs) with behavioral models.
As a supplemental information, we investigated whether there was a statistical difference between groups in the correlation with the behavioral model, both in occipital and in temporal regions of interest (ROIs). (Top panel) Representational similarity analysis (RSA) results with the behavioral model for the early blind/sighted control (EB/SC) groups. The permutation test did not reveal a significant different correlation between EB and SC nor in the occipital ROI (p=0.12), neither in the temporal ROI (p=0.2).Finally, adjusted rank transform test (ART) analysis 2 Groups × 2 ROIs did not reveal any significant effect of interaction group by region. (Bottom panel) RSA results with the behavioral model for the late blind (LB)/SC groups. The permutation test did not reveal a significant different correlation between LB and SC nor in the occipital ROI (p=0.6), neither in the temporal ROI (p=0.14). The ART analysis 2 Groups × 2 ROIs did not reveal any significant interaction between groups and regions. Black bars show standard error (sample size: Early Blind=16; Late Blind=15; Sighted Controls=20).
Figure 5 with 1 supplement
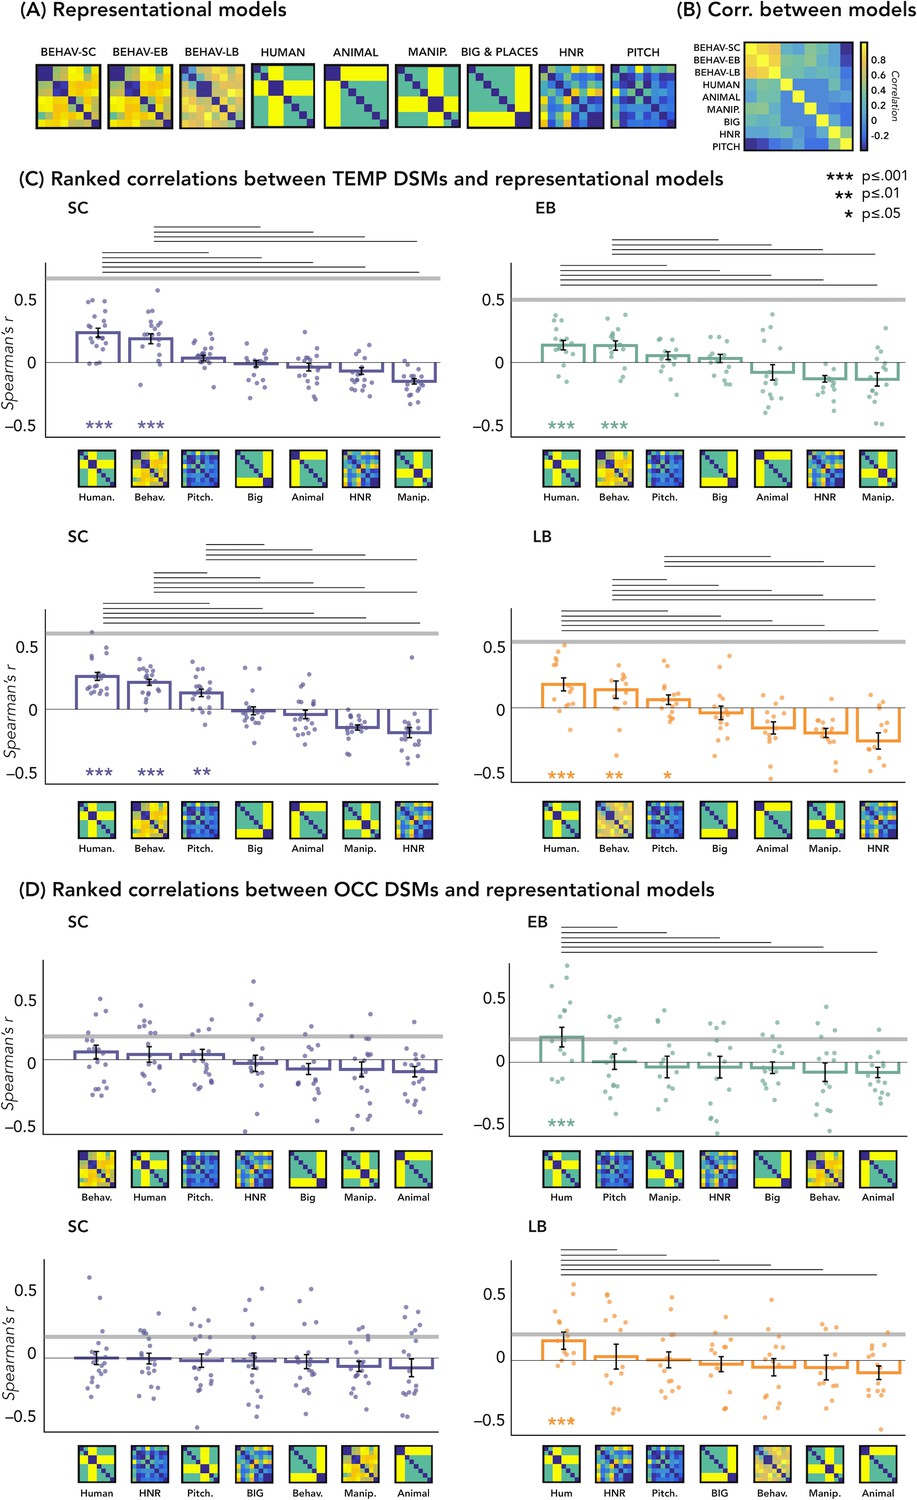
Representational similarity analysis (RSA) – correlations with representational models.
(A) Representation of the seven models. (B) Matrix including the linear correlations between each pair of models. Yellow indicates high correlations, blue indicates low correlation. (C) Correlations between temporal dissimilarity matrix (DSM) of each group and the seven representational models. (D) Correlation between occipital DSM of each group and the seven representational models. Bars show mean Spearman’s correlations across participants; error bars show standard error and each dot represents one participant (Sample size: Early Blind=16; Late Blind=15; Sighted Controls=20). Horizontal thick gray lines show the lower bound of the noise ceiling, which represents the reliability of the correlational patterns and provides an approximate bound of the observable correlations between representational models and neural data (Bracci and Op de Beeck, 2016; Nili et al., 2014). An asterisk below the bar indicates that correlations with that model were significantly higher than zero. Correlations with individual models are sorted from highest to lowest. Horizontal black lines above bars show significant differences between the correlations of the two end points (FDR corrected for multiple comparisons): we only reported the statistical difference between models showing a positive significant correlation and all other models.
Figure 5—figure supplement 1
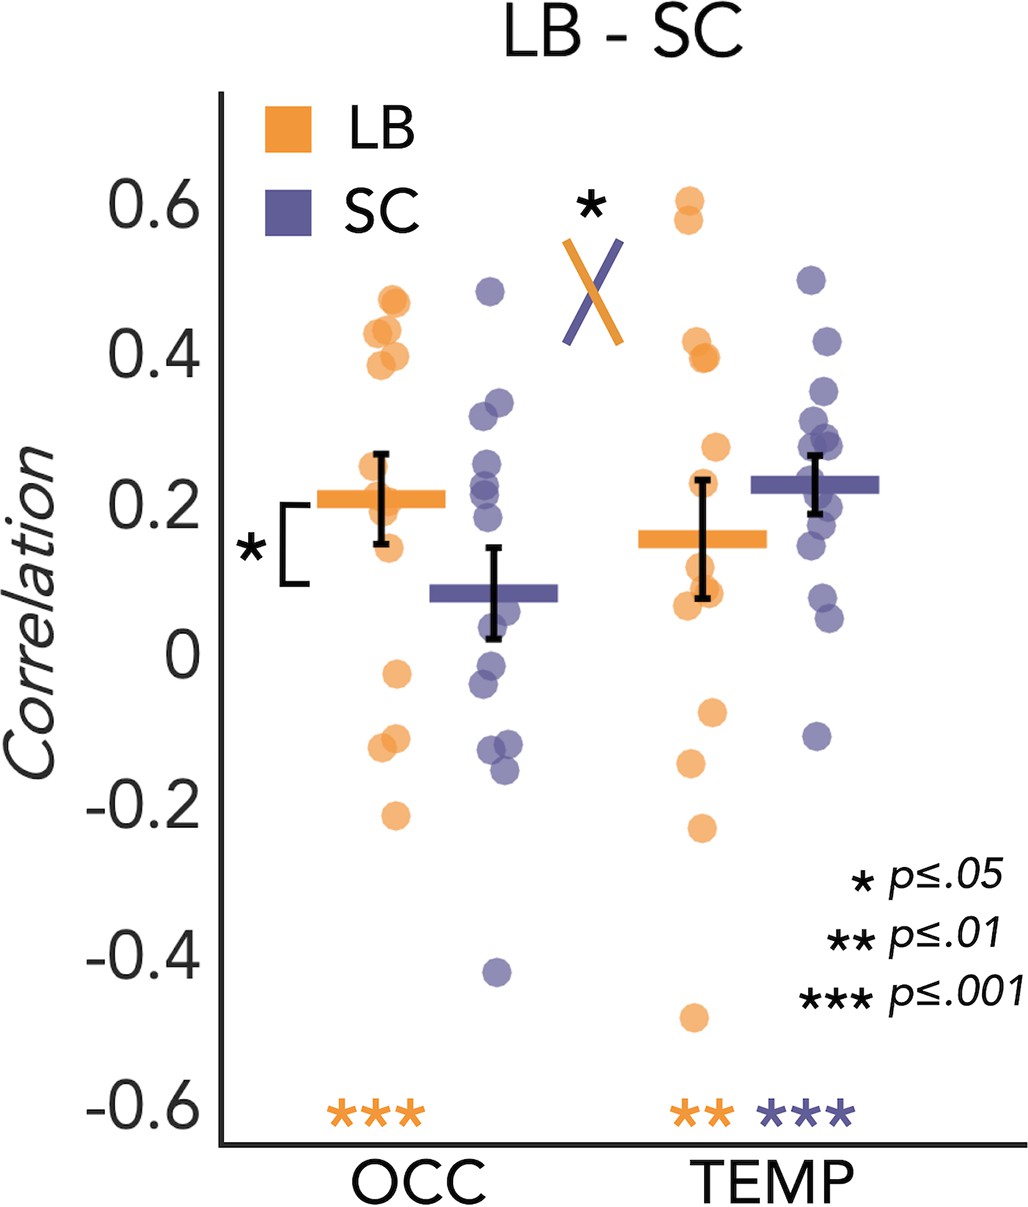
Representational similarity analysis (RSA) results with the human model for the late blind/sighted control (LB/SC) (age matched).
In the SCLB group the correlation is significant in the temporal (r=0.23; p<0.00001) but not in the occipital (r=0.08; p=0.11) region of interest (ROI). In the LB group the correlation is significant in both occipital (r=0.21; p<0.0001) and temporal (r=16.27; p<0.003) regions. In the occipital ROI, the permutation revealed a significant difference between LB and SC (p=0.03), while in the temporal ROI there was not a significant difference between LB and SC (p=0.14). The adjusted rank transform test (ART) analysis 2 Groups × 2 ROIs revealed a significant interaction between groups and regions (F(1,28)=4.4; p=0.04). Black bars show standard error (sample size: Late Blind=15; Sighted Controls=15).
Figure 6 with 1 supplement
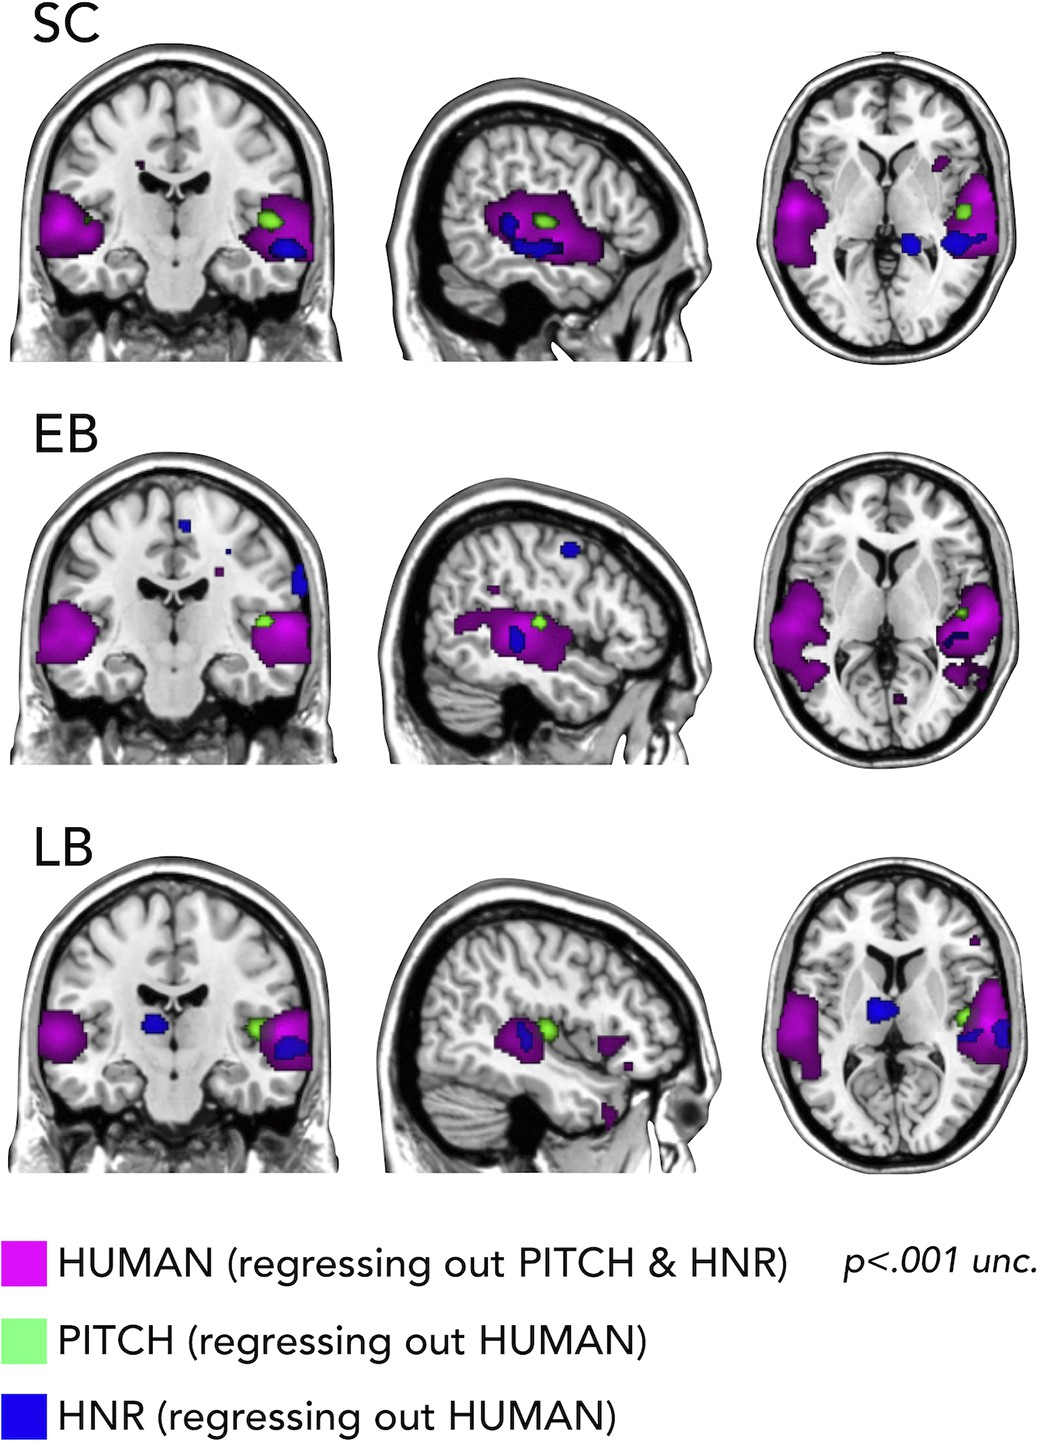
Representational similarity analysis (RSA) searchlight results with human, pitch, and harmonicity-to-noise ratio (HNR) models (including partial correlation).
Figure 6—figure supplement 1

Splithalf searchlight results.
Appendix 1—figure 1
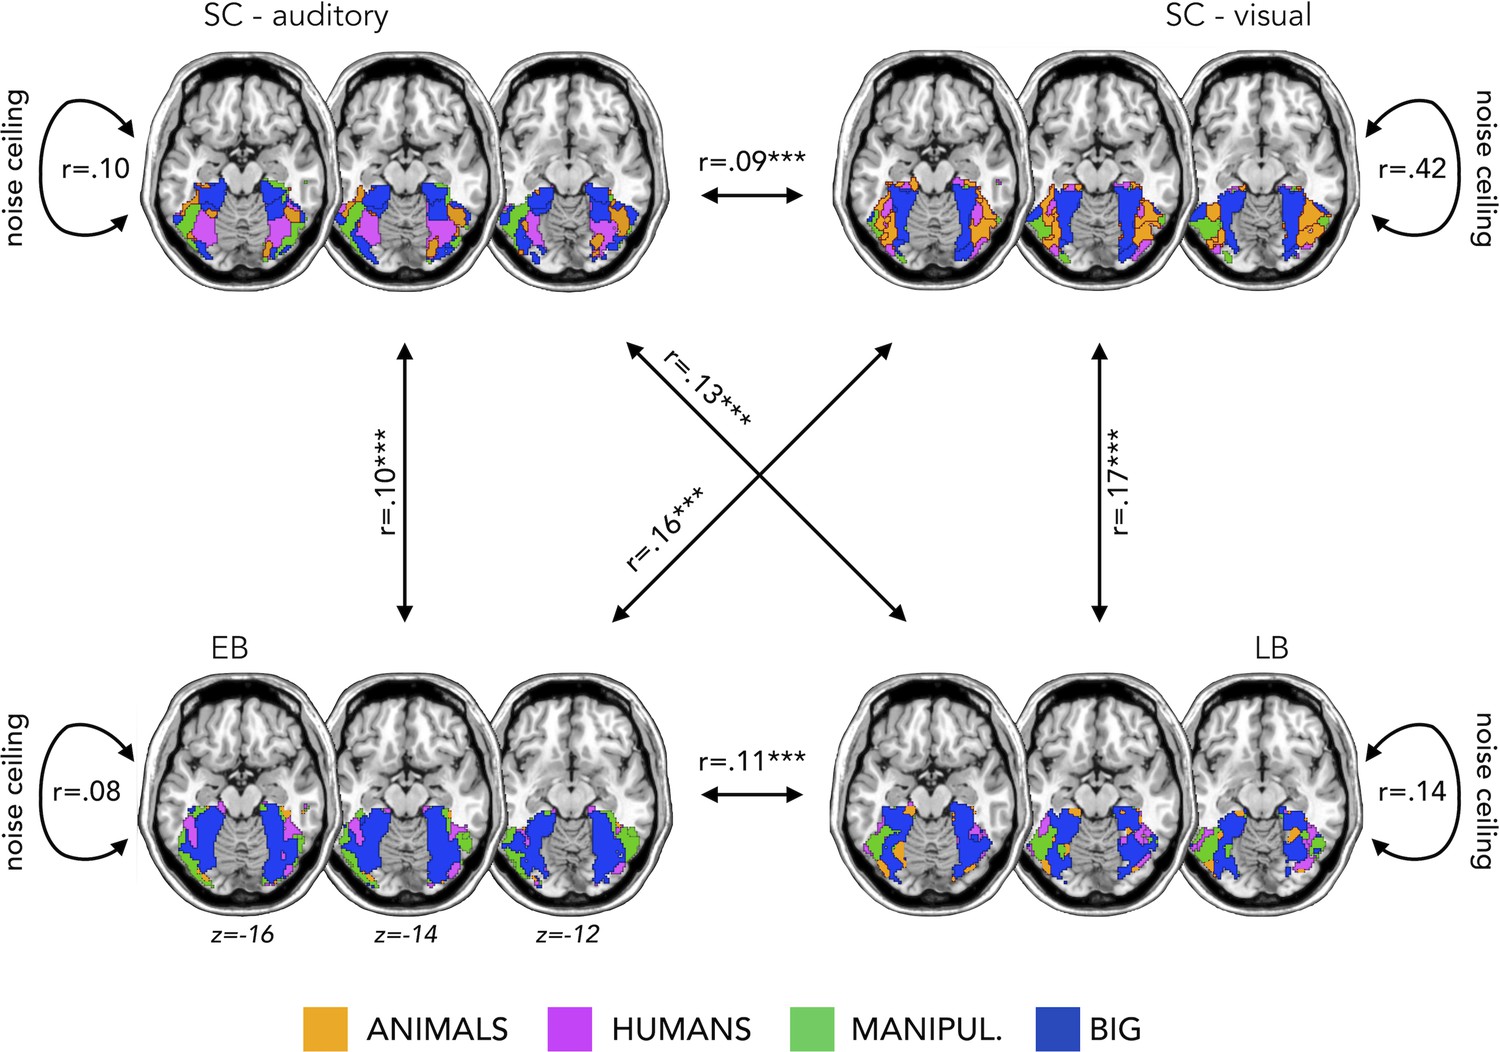
Topographical functional preference maps.
Averaged ‘winner take all’ topographical functional preference maps for our four main categories (animals, humans, manipulable, big non-manipulable) in the auditory modality in the sighted controls (SC, top left), early blind (EB, bottom left), and late blind (LB, bottom right). In the top right we also reported the map from an additional group of sighted that performed the visual version of the experiment. These maps visualize the functional topography of ventral occipito-temporal cortex (VOTC) to the main four categories in each group. These group maps are created for visualization purpose only since statistics are run from single subject maps (see Materials and methods). To obtain those group maps, we first averaged the β-values among participants of the same group in each voxel inside the VOTC for each of our four main conditions (animals, humans, manipulable objects, and places) separately and we then assigned to each voxel the condition producing the highest β-value. For each group we also computed a noise ceiling value, computing the correlation of the map between subjects from the same group.
Author response image 1

Bayes Factor for the MVP results in the temporal ROI LB>SC.
Author response image 2
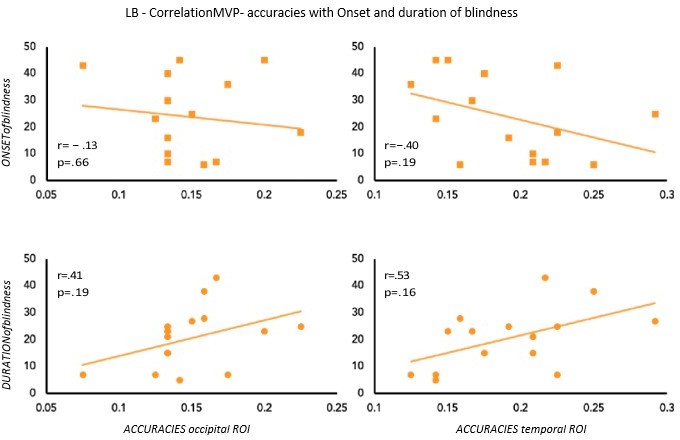
Correlation between MVP-accuracies values and Onset & Duration of blindness in LB.
Author response image 3
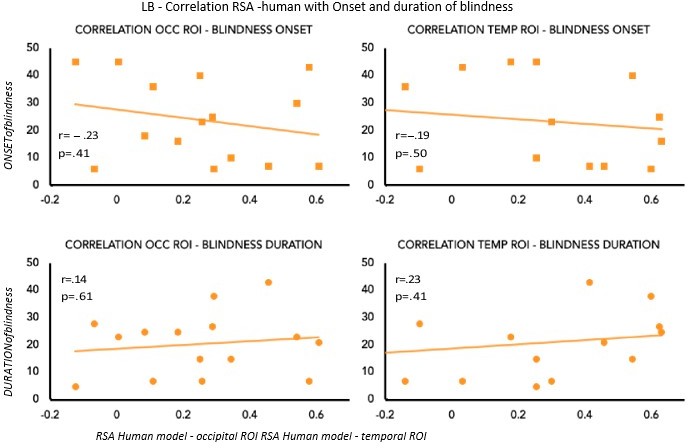
Correlation between RSA r values for the human model and Onset & Duration of blindness in LB.
Author response image 4
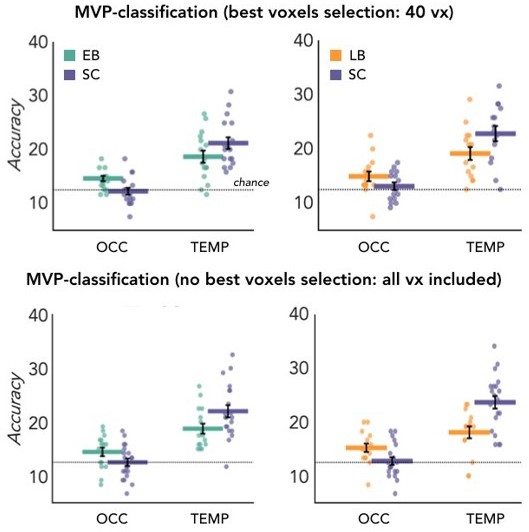
Top: results from MVP-classification analyses using the best voxels selection feature; Bottom: results from MVP-classification analyses including all the voxels in each ROI.
Author response image 5
Author response image 6
Author response image 7
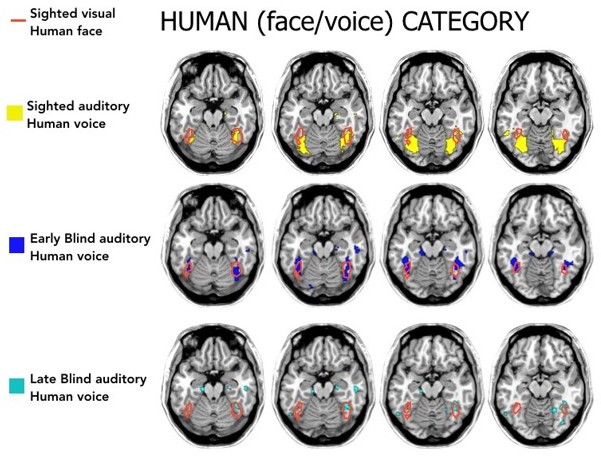
Human preference in the VOTC of each group and modality.
Author response image 8
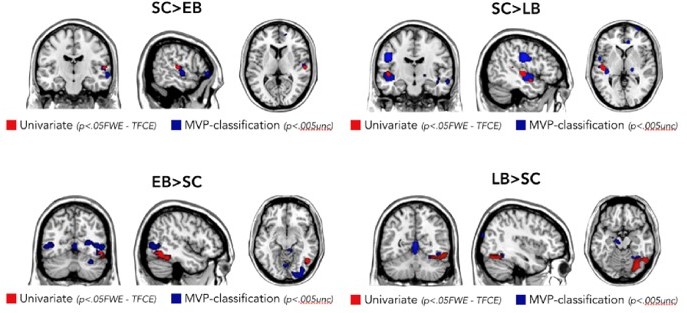
Overlap of univariate contrasts and searchlight MVPclassification results.
Author response image 9
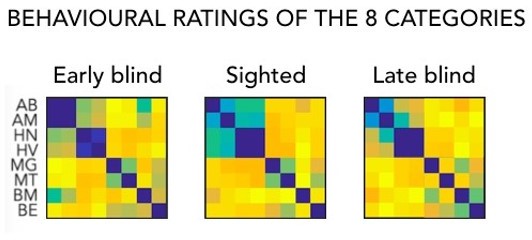
Dissimilarity matrices resulted from the behavioral similarity rating of each sound pairwise.
Author response image 10
Additional files
-
Supplementary file 1
Characteristics of early and late blind participants.
- https://cdn.elifesciences.org/articles/79370/elife-79370-supp1-v1.docx
-
Supplementary file 2
Categories and stimuli.
- https://cdn.elifesciences.org/articles/79370/elife-79370-supp2-v1.docx
-
Supplementary file 3
Groups’ mean β-values for each region of interest (ROI) and for every category.
- https://cdn.elifesciences.org/articles/79370/elife-79370-supp3-v1.docx
-
Supplementary file 4
R- and p-values (false discovery rate [FDR] corrected for seven comparisons) from representational similarity analysis (RSA) correlation between the occipital dissimilarity matrices (DSMs) and representational models.
- https://cdn.elifesciences.org/articles/79370/elife-79370-supp4-v1.docx
-
Supplementary file 5
R- and p-values (false discovery rate [FDR] corrected for seven comparisons) from representational similarity analysis (RSA) correlation between temporal dissimilarity matrices (DSMs) and representational models.
- https://cdn.elifesciences.org/articles/79370/elife-79370-supp5-v1.docx
-
Transparent reporting form
- https://cdn.elifesciences.org/articles/79370/elife-79370-transrepform1-v1.pdf
Download links
A two-part list of links to download the article, or parts of the article, in various formats.
Downloads (link to download the article as PDF)
Open citations (links to open the citations from this article in various online reference manager services)
Cite this article (links to download the citations from this article in formats compatible with various reference manager tools)
Impact of blindness onset on the representation of sound categories in occipital and temporal cortices
eLife 11:e79370.
https://doi.org/10.7554/eLife.79370


