Dynamic molecular evolution of a supergene with suppressed recombination in white-throated sparrows
- School of Biological Sciences, Georgia Institute of Technology, United States
- Department of Psychology, Emory University, United States
- Department of Ecology, Evolution, Marine Biology, University of California, Santa Barbara, United States
- Department of Medicine Huddinge, Karolinska Institutet, Sweden
- Department of Biology, East Carolina University, United States
Figures
Figure 1 with 2 supplements
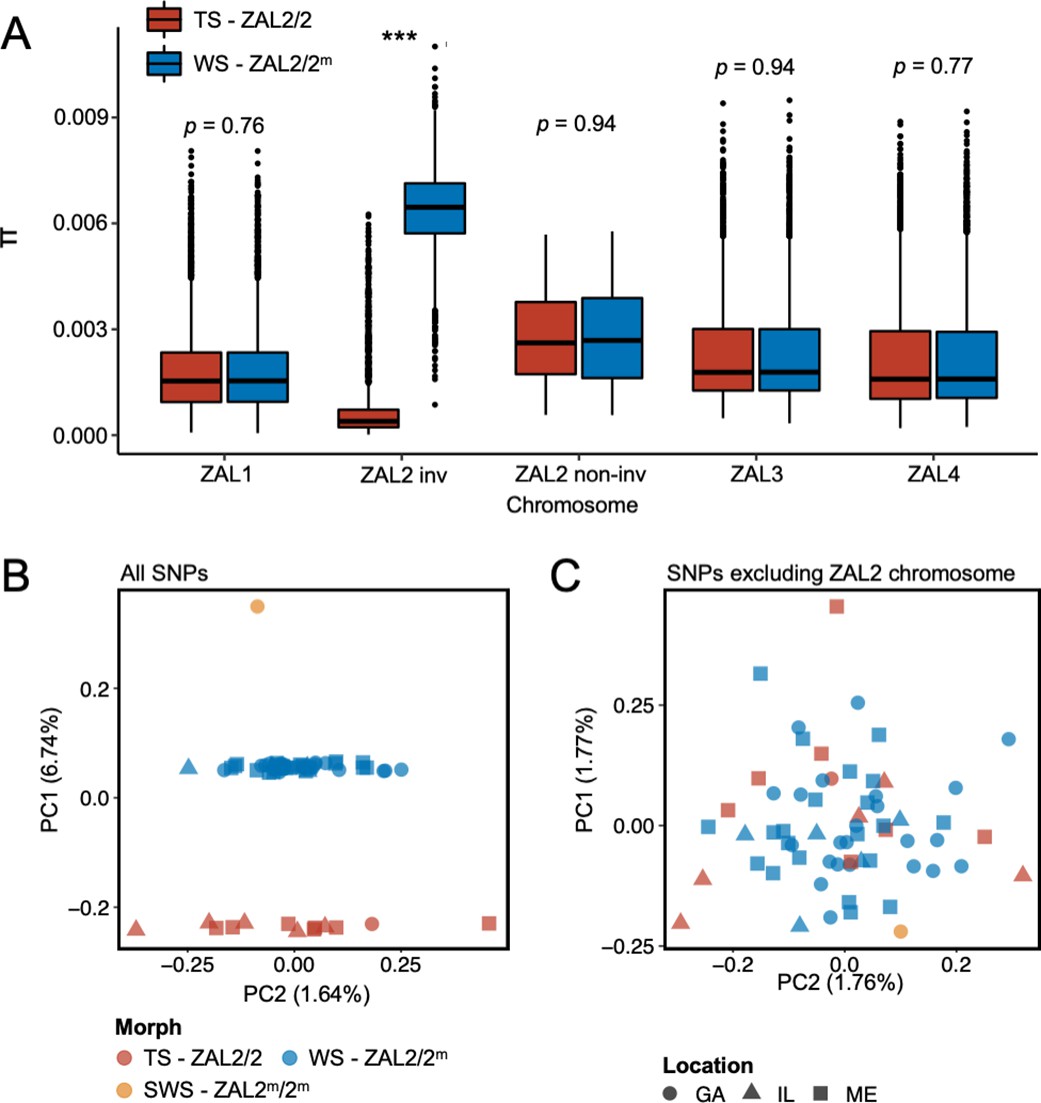
Genomic data from newly sequenced tan- and white-striped birds.
(A) Nucleotide diversity of macro-chromosomes for tan-striped (TS) and white-striped (WS) birds. White-striped birds (ZAL2/2m) show elevated nucleotide diversity for the ZAL2/2m inverted (INV, i.e. rearranged) regions (ZAL2/2m inv), while TS birds (ZAL2/2) show overall reduced nucleotide diversity for the inverted regions compared with other chromosomes. Note that panel (A) shows the comparison across morph. The comparison across the ZAL2 and ZAL2m alleles is shown in Figure 2a. (B) Scatterplots of eigenvector 1 (PC1) and eigenvector 2 (PC2) from principal component analysis of all single-nucleotide variants (left panel). (C) Principal component analysis (PCA) excluding single nucleotide polymorphisms (SNPs) on the ZAL2 chromosomes (right panel). The sex chromosomes and the ZAL3 chromosome (which includes an additional chromosomal inversion) were excluded from both PCA analyses. Note that ‘location’ here refers to the site of collection or capture of the bird: Georgia (GA), Illinois (IL), or Maine (ME). Breeding locations for GA and IL birds are unknown.
-
Figure 1—source data 1
Nucleotide diversity between tan- and white-striped birds.
Figure 1B and C: Supplementary file 1 (PCAs performed using variant call format (vcf) data from whole genome sequencing).
- https://cdn.elifesciences.org/articles/79387/elife-79387-fig1-data1-v1.txt
Figure 1—figure supplement 1

The number of informative sites inside the ZAL2m rearrangement differed between morphs.
The number of informative sites in tan- vs white-striped birds is shown for the four largest chromosomes (macrochromosomes), computed using the same number of samples from tan-striped (TS) and white-striped (WS) birds (=13 each). ZAL2 inv = inverted region in ZAL2 or ZAL2m; ZAL2 non-inv = non-inverted region in ZAL2 or ZAL2m.
Figure 1—figure supplement 2
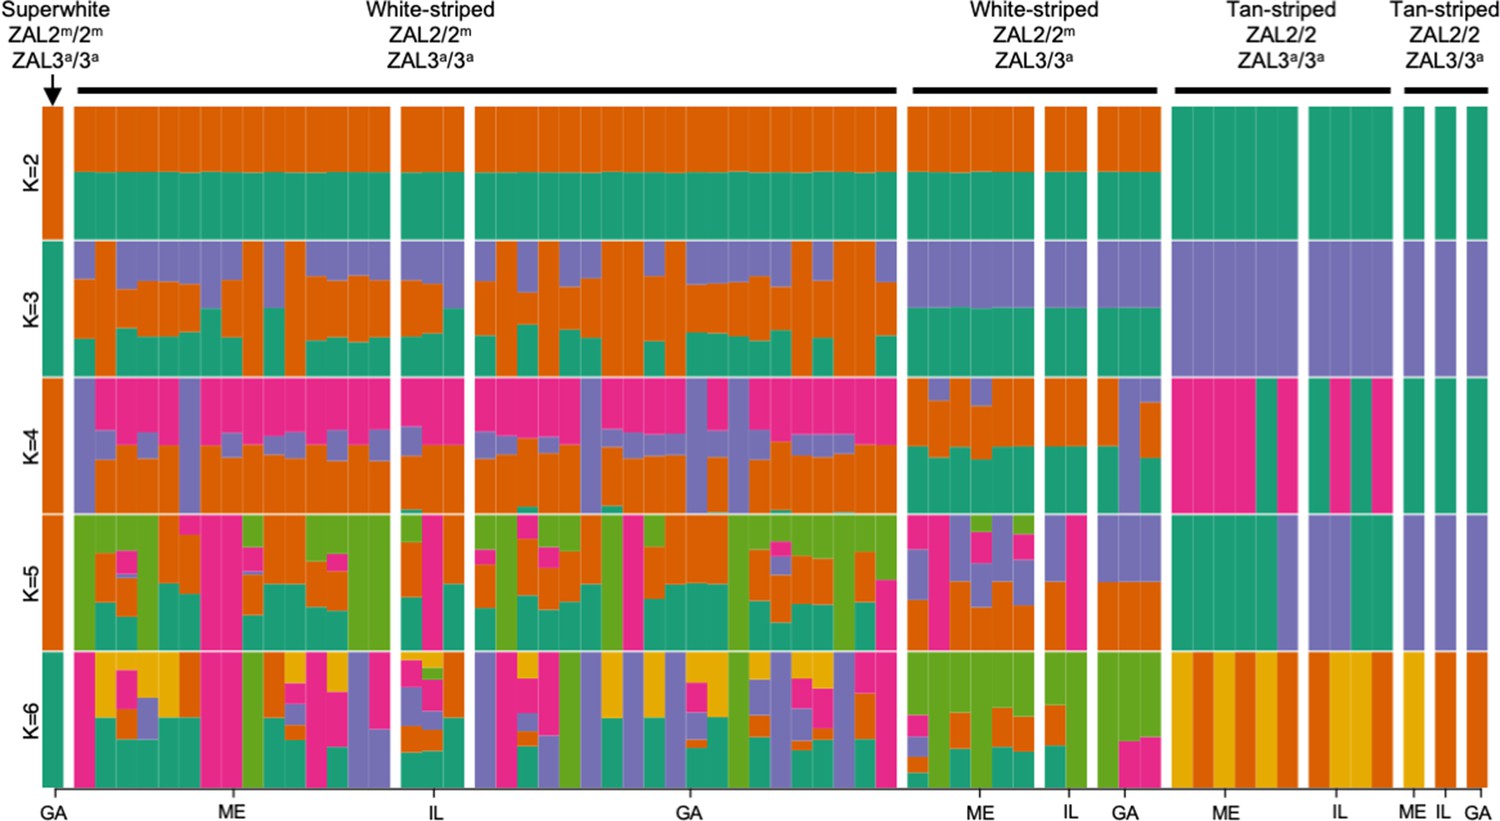
Admixture tests showed no population substructure by geographic sampling location.
Inferred ancestral population fractions are shown for each bird as estimated by ADMIXTURE (K=2 to K=6 possible populations) for birds of each genotype and from different sampling locations. ADMIXTURE was run using all single nucleotide polymorphisms (SNPs) in the genome, excluding SNPs that met any of the following criteria: MAF <0.01, missing >20%, located inside the additional chromosomal polymorphism on ZAL3, or located in sex chromosomes. Note that ‘geographic location’ here refers to the site of collection or capture of the bird. Breeding locations for the GA and IL birds were unknown.
Figure 2 with 1 supplement
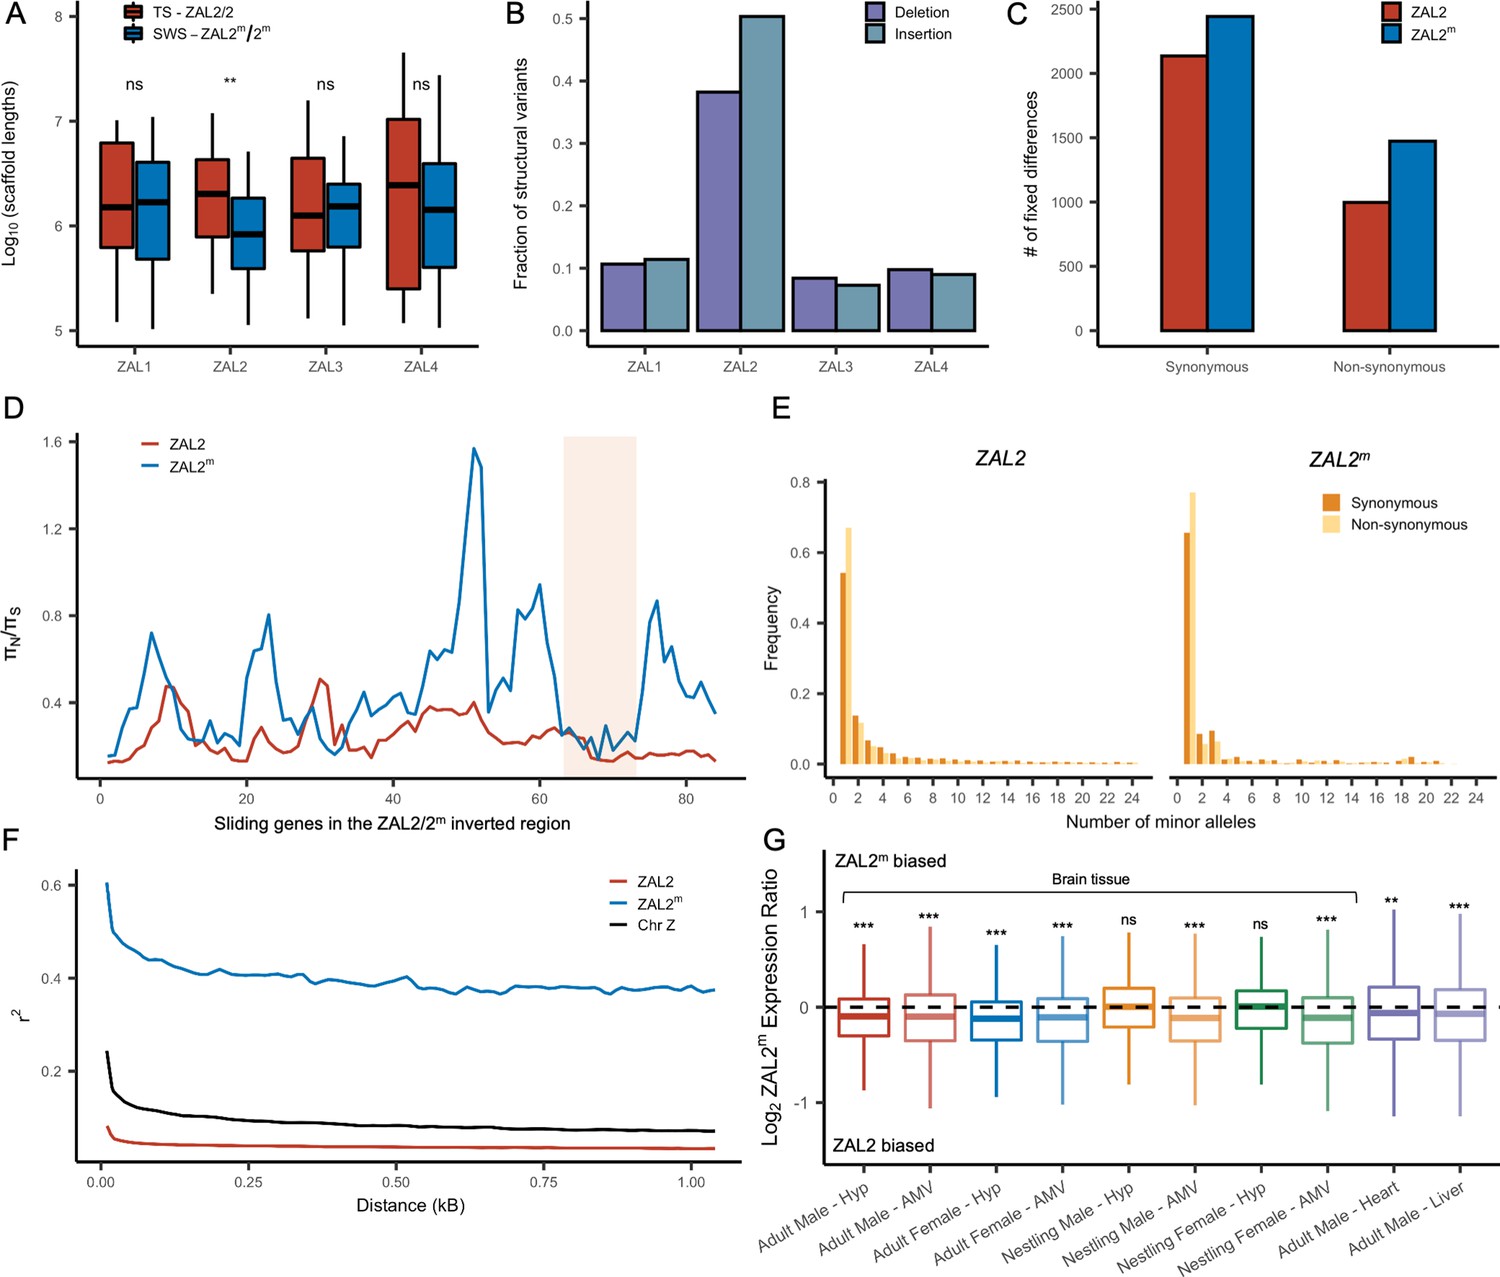
Genetic divergence between ZAL2 and ZAL2m chromosomes.
(A) The scaffolds for the ZAL2m chromosome in the super-white (SWS) assembly tend to be fragmented compared with those for the ZAL2 chromosome in the tan-striped (TS) assembly. ** p<0.001 (Mann-Whitney U-test); ns, not significant (B) Fraction of structural variants (SV), both insertion and deletion events, for the 4 largest chromosomes, using the tan-striped assembly as a reference. The fraction of SV is computed as a total base affected by variants divided by the length of the chromosome. (C) Number of fixed mutations derived in ZAL2 and ZAL2m in protein-coding regions (D) Sliding window (window size of 20 genes with step size of 5 genes) analysis of the ratio of nonsynonymous to synonymous nucleotide diversity (πN/πS) within the ZAL2 and ZAL2m chromosomes. The ZAL2m outlier region is highlighted (colored background). (E) Site frequency spectrum of polymorphic sites. (F) Decay of linkage disequilibrium. (G) Proportion of the ZAL2m alleles expressed for each tissue set. The proportion of the ZAL2m alleles expressed is less than the null hypothesis of 0.5 for all tissues except nestling AMV using false discovery rate (FDR) correction. Hyp, hypothalamus; AMV, ventromedial arcopallium.
-
Figure 2—source data 1
Scaffold length.
- https://cdn.elifesciences.org/articles/79387/elife-79387-fig2-data1-v1.txt
-
Figure 2—source data 2
Structural variant proportions.
- https://cdn.elifesciences.org/articles/79387/elife-79387-fig2-data2-v1.txt
-
Figure 2—source data 3
Variant information.
- https://cdn.elifesciences.org/articles/79387/elife-79387-fig2-data3-v1.txt
-
Figure 2—source data 4
Haplotype phased nucleotide diversity data.
- https://cdn.elifesciences.org/articles/79387/elife-79387-fig2-data4-v1.txt
-
Figure 2—source data 5
Minor alleles.
- https://cdn.elifesciences.org/articles/79387/elife-79387-fig2-data5-v1.txt
-
Figure 2—source data 6
Linkage disequilibrium.
- https://cdn.elifesciences.org/articles/79387/elife-79387-fig2-data6-v1.txt
-
Figure 2—source data 7
RNAseq allele specific expression data in long format.
- https://cdn.elifesciences.org/articles/79387/elife-79387-fig2-data7-v1.txt
Figure 2—figure supplement 1
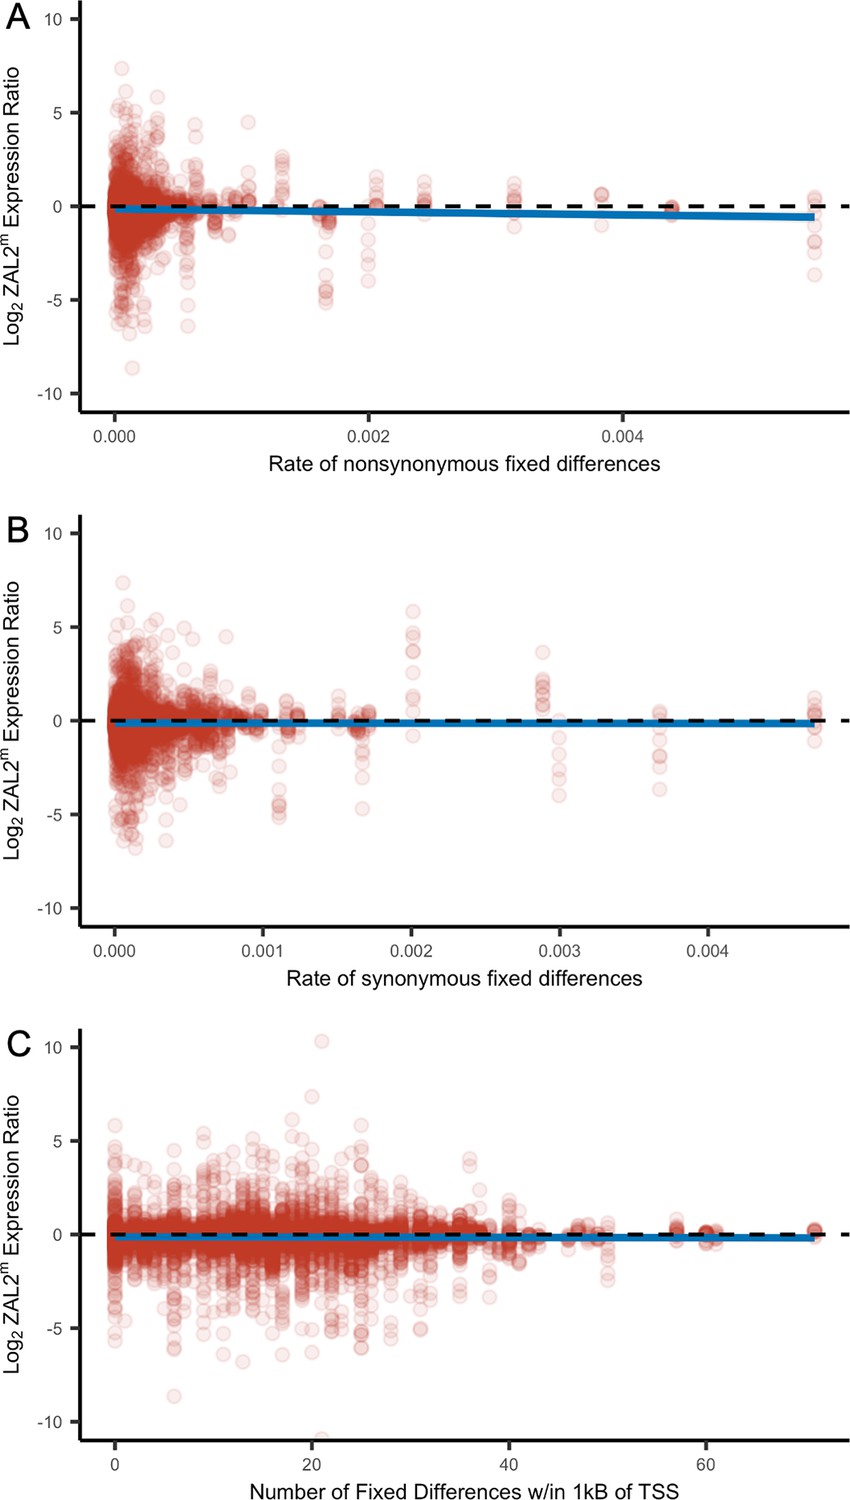
Allelic bias in expression was associated with the number of non-synonymous fixed differences.
Allelic bias in expression for each gene, averaged across sequencing batch and tissue (see Table 1, Materials and methods), is plotted by (A) the rate of fixed differences per-base that are non-synonymous, (B) the rate of fixed differences per-base that are synonymous, or (C) the number of fixed differences within 1 kb upstream of the transcription start site. Only the rate of non-synonymous fixed differences was associated with allelic bias in gene expression (X2(1)=9.97, p=0.00159).
Figure 3 with 5 supplements
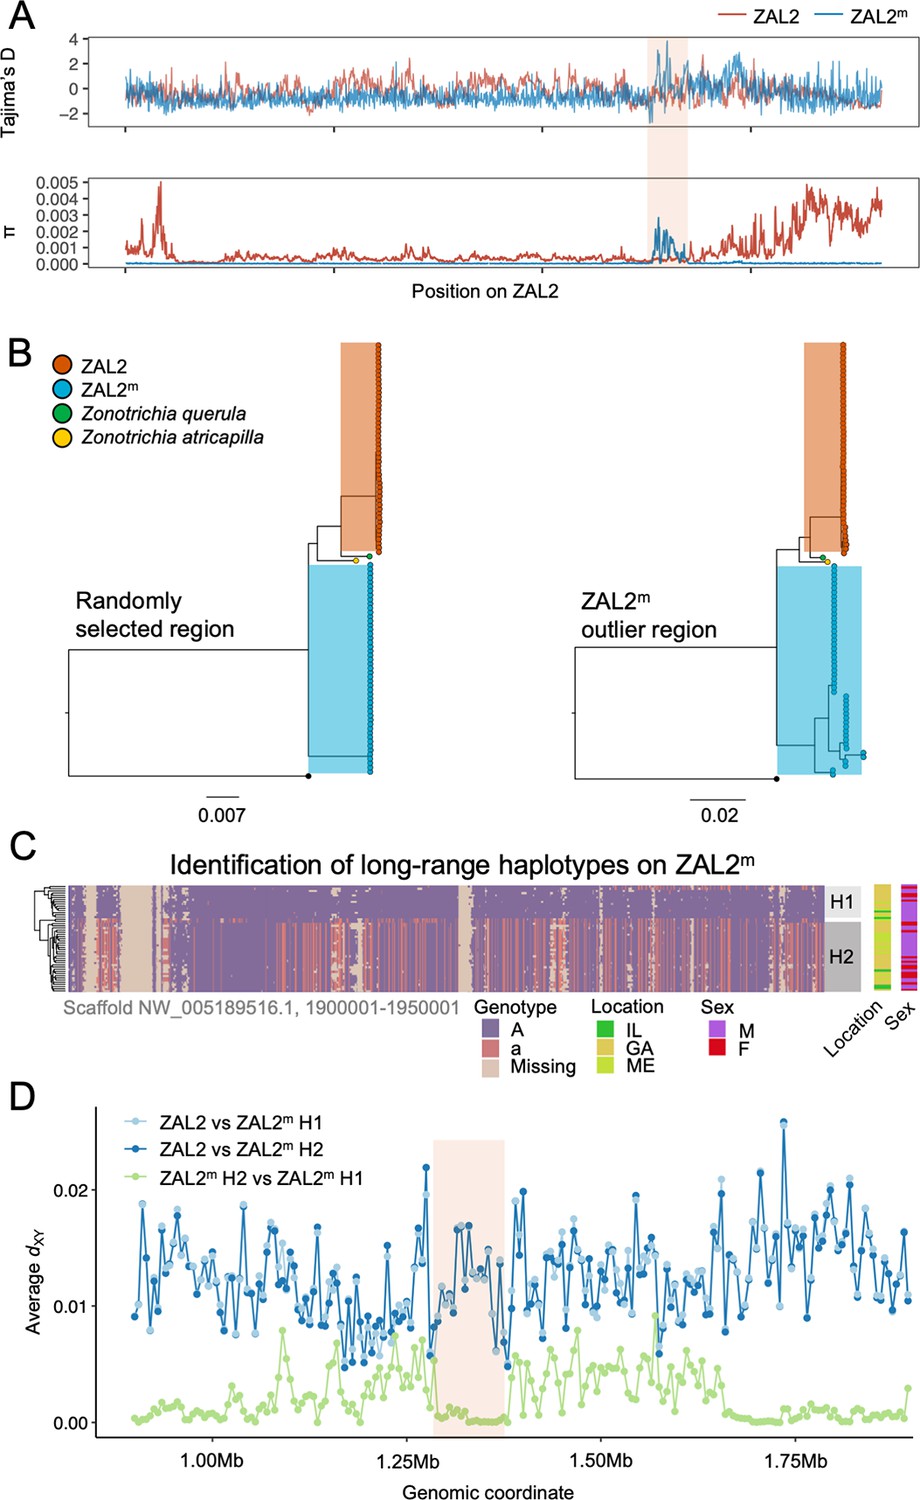
Genetic diversity and patterns of divergence across the rearranged region of the ZAL2m chromosome and in the ZAL2m outlier region.
(A) Tajima’s D and nucleotide diversity across the ZAL2 and ZAL2m chromosomes. The ZAL2m outlier region is highlighted (colored background). (B) Phylogenetic tree of randomly selected regions (left panel) and the ZAL2m outlier region (right panel). The ZAL2m chromosome shows multiple haplotype structures and has longer branch lengths within the population compared with ZAL2 chromosomes. (C) Single nucleotide polymorphism (SNP) genotype plot of a scaffold inside the ZAL2m outlier region (Scaffold NW_005189516.1, 1900001–1950001). The plot shows two haplogroups. Major allele SNPs (A, same genotype as the super-white ZAL2m/2m genome) are represented in purple, and minor allele SNPs (a, different from the super-white genome) in red. Tan indicates that there were no fixed SNPs to differentiate ZAL2 vs ZAL2m reads, resulting in missing data. (D) Genetic divergence (dXY) for a portion of the rearrangement. dXY between the ZAL2 chromosome and haplogroup 1 (H1) is plotted in light blue, between ZAL2 and haplogroup 2 (H2) in dark blue, and between H1 and H2 in light green.
-
Figure 3—source data 1
RAxML bipartitions for scaffold 5189516.
Figure 3A: Supplementary file 1 (Tajima’s D and nucleotide diversity plots created from variant call format (vcf) data from whole genome sequencing).
- https://cdn.elifesciences.org/articles/79387/elife-79387-fig3-data1-v1.txt
-
Figure 3—source data 2
RAxML bipartitions for scaffold 5190802.
- https://cdn.elifesciences.org/articles/79387/elife-79387-fig3-data2-v1.txt
-
Figure 3—source data 3
Genotype data for scaffold 5189516.
- https://cdn.elifesciences.org/articles/79387/elife-79387-fig3-data3-v1.txt
-
Figure 3—source data 4
dXY between ZAL2m haplotypes and ZAL2.
- https://cdn.elifesciences.org/articles/79387/elife-79387-fig3-data4-v1.txt
Figure 3—figure supplement 1

No evidence of introgression in ZAL2m outlier region.
Phylogenetic tree of ZAL2m outlier region using only the exons of single-copy orthologous genes.
Figure 3—figure supplement 2

The D-statistic did not vary by haplotype.
50 kb sliding window estimates of the D-statistic resulting from ABBA-BABA tests using as ingroup genomes the ZAL2 chromosome, the Harris' sparrow chromosome 2, and the ZAL2m chromosome (P1, P2, and P3, respectively). We used the medium ground finch as the outgroup species (P4). Data from the ZAL2m outlier region are plotted for four individual birds.
Figure 3—figure supplement 3

No difference in sequencing depth between haplotypes.
Boxplot of the average sequencing depth for individuals of haplotype 1 (H1) and haplotype 2 (H2).
Figure 3—figure supplement 4

The ZAL2m outlier region exhibited an excess of intermediate frequency minor alleles.
Site frequency spectra of polymorphic sites inside the ZAL2m outlier region are shown for both the ZAL2 and ZAL2m chromosomes. (A) shows all ZAL2/ZAL2m-linked single nucleotide polymorphisms (SNPs) and (B) excludes singleton SNPs.
Figure 3—figure supplement 5
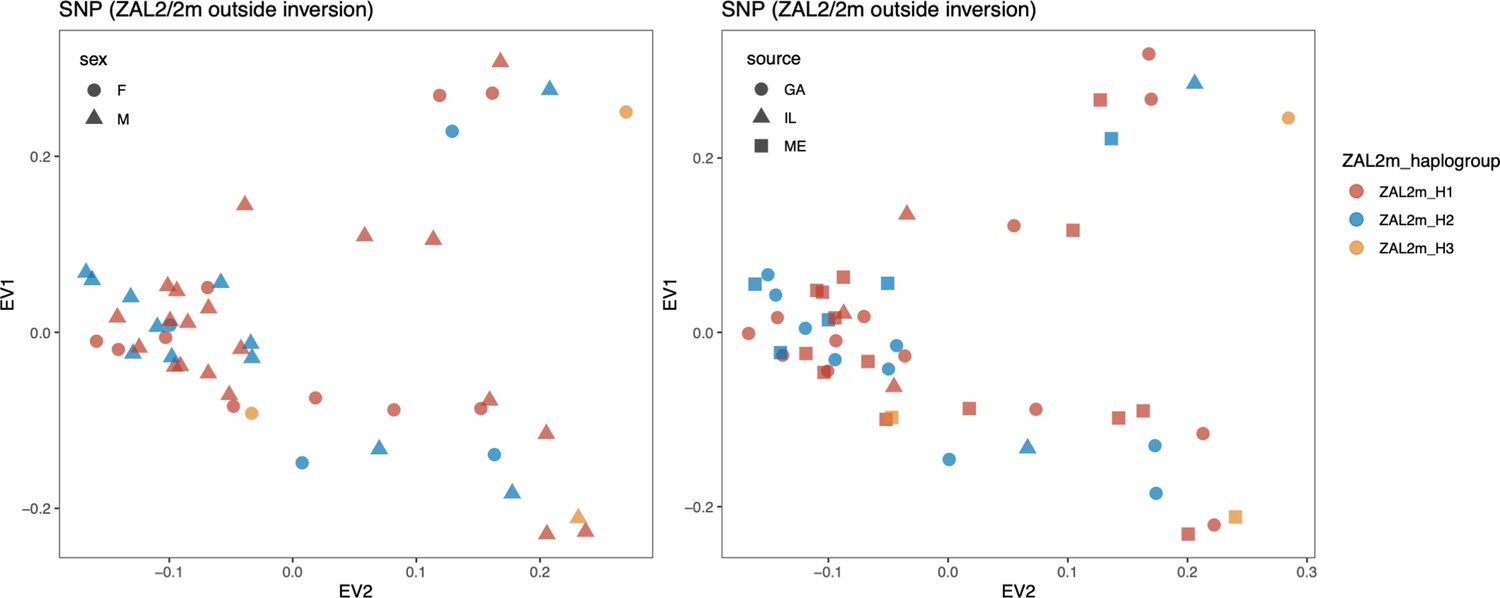
Neither sex nor geographic location of sample collection produced distinct patterns between haplogroups.
Scatterplots of eigenvector 1 (PC1) and eigenvector 2 (PC2) from principal component analysis of all single-nucleotide variants outside the ZAL2/2m inversion are shown. Colors show the haplogroup of the sample. In the left panel, shape indicates the sex of the sample and in the right panel, shape indicates the geographic sampling location. Note that the GA and IL birds were captured during migration, so their breeding location was unknown. SNP: single nucleotide polymorphisms.
Figure 4 with 3 supplements
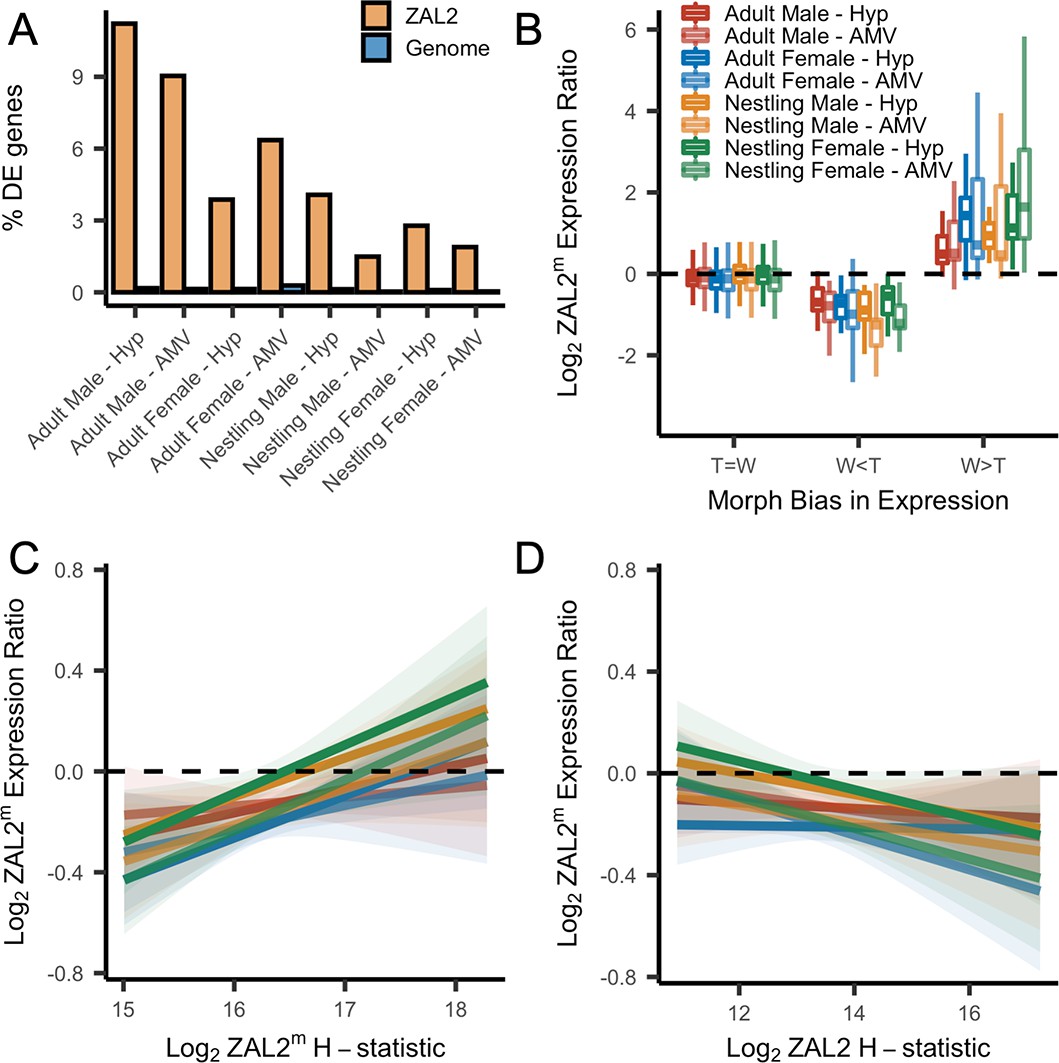
Evidence for antagonistic selection driving ZAL2 and ZAL2m gene expression in the brain.
(A) shows the percentage of differentially expressed genes that reside inside the rearranged region on ZAL2, vs elsewhere in the genome. The percentage of differentially expressed genes inside vs outside the rearranged region of ZAL2 is higher than expected by chance (padj <2.2 × 10⁻¹⁶ for all comparisons). (B) shows log2 ZAL2m expression ratios for genes that were more highly expressed in white-striped birds (W>T), genes more highly expressed in tan-striped birds (T>W) and those that that do not significantly differ between morphs (T=W). (C) Log2 ZAL2m expression ratios are plotted vs the Log2 ZAL2m H-statistic for each category of sample. Hypothalamus (Hyp), Ventromedial arcopallium (AMV). (D) Log2 ZAL2m expression ratio are plotted vs the Log2 ZAL2 H-statistic.
-
Figure 4—source data 1
Percent of Differentially Expressed genes on ZAL2 vs rest of genome.
- https://cdn.elifesciences.org/articles/79387/elife-79387-fig4-data1-v1.txt
-
Figure 4—source data 2
RNAseq allele specific expression data for brain in long format merged with morph bias and H-scan values.
- https://cdn.elifesciences.org/articles/79387/elife-79387-fig4-data2-v1.txt
Figure 4—figure supplement 1
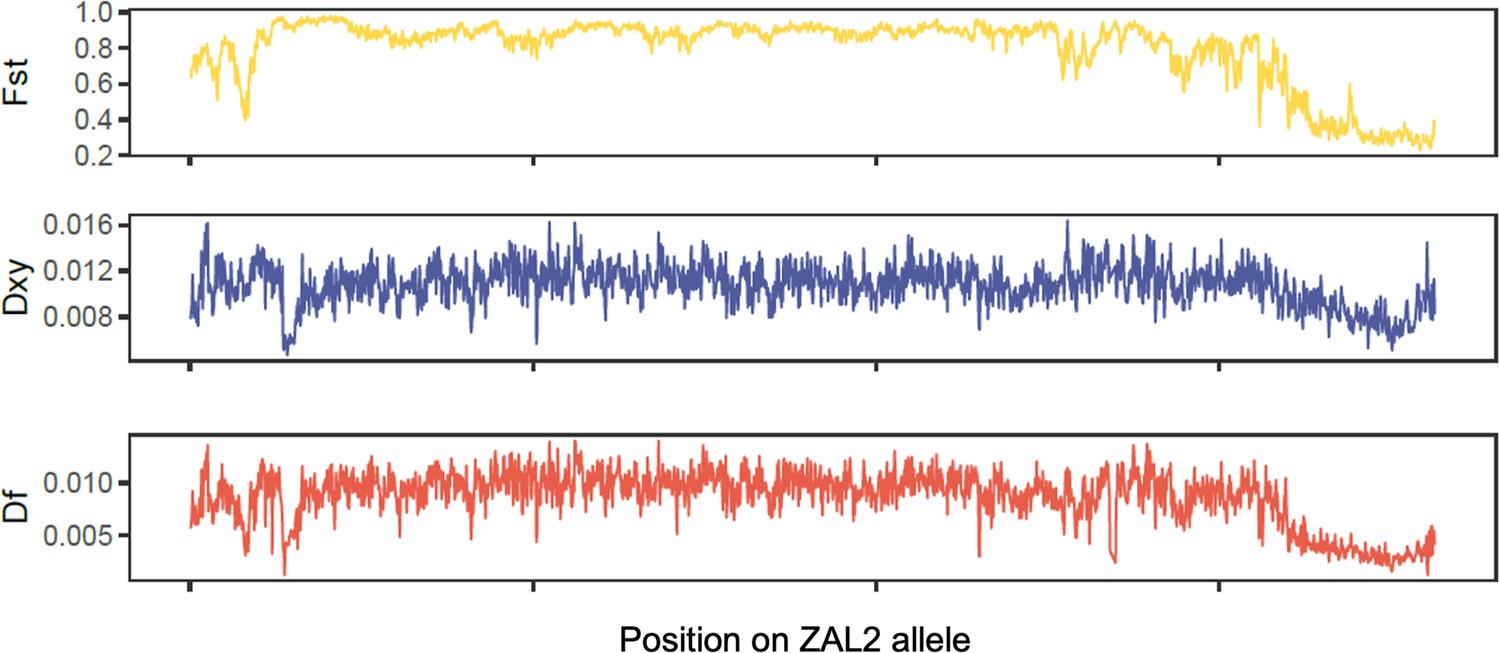
Genetic differentiation between ZAL2 and ZAL2m is reduced at the ends of the chromosomal arms.
Plots show the population differentiation in allele frequency (FST) between tan and white birds, the number of nucleotide substitutions per site (dXY) between ZAL2 and ZAL2m, and density of fixed differences (df) between ZAL2 and ZAL2m inside the rearranged region.
Figure 4—figure supplement 2

Both ZAL2 and ZAL2m have experienced selective sweeps.
The imputed p-values of the H-statistic (a measure of homozygosity, computed in 20 kb windows) are plotted along the position on ZAL2 inside the inversion for (A) ZAL2 and (B) ZAL2m. Colors refer to alternating scaffolds. A candidate region showing elevated H-statistics in four 20 kB windows on both ZAL2 and ZAL2m (Scaffold NW_005081582.1, 480–520 kb and 920–960 kb) is highlighted in blue. A~6 Mbp region showing a long stretch of elevated H-statistics on ZAL2 is highlighted in red.
Figure 4—figure supplement 3
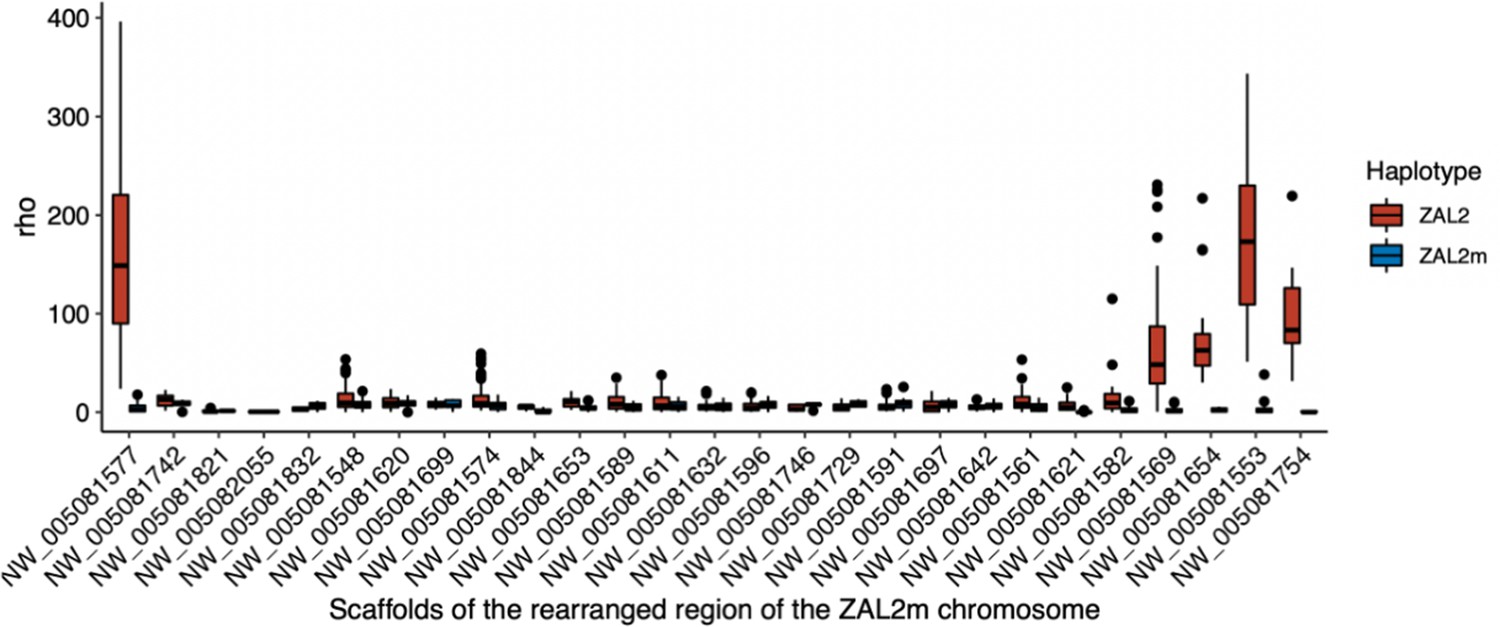
Population recombination rates in ZAL2 are likely higher in the chromosome end.
FastEprr was used to estimate the population recombination parameter, rho, for each genome assembly contig (50 kbp non-overlapping sliding window).
Tables
Table 1
List of RNA sequencing data sets.
| Tissue | Sample size (WS/total) | Collection details | Source | |
|---|---|---|---|---|
| Adult males | Brain (Hyp, AMV) | 9/20 | Collected early in the breeding season | Zinzow-Kramer et al., 2015; Sun et al., 2018 |
| Accession: GSE77186 | ||||
| Adult females | Brain (Hyp, AMV) | 6/11 | Collected early in the breeding season | Accession: PRJNA657006 |
| Nestlings (both sexes) | Brain (Hyp, AMV) | 16/32 | Collected from nests during the breeding season | Accession: PRJNA657006 |
| Adult males (all white-striped) | Heart and Liver | 20/20 | Collected during fall migration, then housed in captivity on either long or short days to simulate breeding vs non-breeding; collected at two time points during the day | Horton et al., 2019 |
| Accession: GSE116989 |
Table 2
List of protein-coding genes inside the ZAL2m outlier region.
| Gene | Scaffold | Start | End | π ZAL2 | π ZAL2m | TaDZAL2 | TaD ZAL2m | DXY |
|---|---|---|---|---|---|---|---|---|
| KCNS3 | NW_005081621.1 | 97089 | 110512 | 2.75E-04 | 8.43E-04 | –1.2953 | –0.8658 | 0.011281 |
| MSGN1 | NW_005081621.1 | 160375 | 160897 | NA | 6.10E-04 | NA | –0.1138 | 0.003056 |
| GEN1 | NW_005081621.1 | 175791 | 198245 | 3.52E-04 | 2.22E-03 | –1.1302 | 1.1728 | 0.011647 |
| SMC6 | NW_005081621.1 | 198452 | 244136 | 3.94E-04 | 2.27E-03 | –1.0088 | 0.8548 | 0.011901 |
| MYCN | NW_005081621.1 | 1179492 | 1184761 | 2.59E-04 | 6.18E-04 | –0.5898 | 0.2116 | 0.005173 |
| DDX1 | NW_005081621.1 | 1432697 | 1452535 | 3.41E-04 | 2.42E-03 | –1.5819 | 0.8752 | 0.014699 |
| NBAS | NW_005081621.1 | 1454601 | 1615580 | 2.93E-04 | 2.17E-03 | –1.6271 | 2.2291 | 0.012296 |
| TRIB2 | NW_005081621.1 | 2596178 | 2616950 | 3.45E-04 | 1.89E-04 | –1.0009 | –0.8376 | 0.011498 |
| LPIN1 | NW_005081621.1 | 3012153 | 3061203 | 2.73E-04 | 3.27E-04 | –1.7799 | –0.7252 | 0.015295 |
| GREB1 | NW_005081621.1 | 3100814 | 3165186 | 2.25E-04 | 1.72E-04 | –1.8299 | –0.7351 | 0.01458 |
| E2F6 | NW_005081582.1 | 24475 | 46577 | 1.90E-04 | 1.59E-04 | –1.5978 | –1.0219 | 1.4E-02 |
| ROCK2 | NW_005081582.1 | 50993 | 155170 | 2.62E-04 | 6.34E-04 | –1.46 | –0.2362 | 1.4E-02 |
| KCNF1 | NW_005081582.1 | 331424 | 333991 | 9.85E-05 | 2.41E-04 | –0.2519 | –0.8641 | 5.9E-03 |
| PDIA6 | NW_005081582.1 | 415853 | 431919 | 3.74E-04 | 1.49E-04 | –1.1579 | –1.2521 | 1.2E-02 |
| ATP6V1C2 | NW_005081582.1 | 431766 | 454886 | 2.56E-04 | 6.94E-04 | –1.7535 | –0.2391 | 1.4E-02 |
Additional files
-
Supplementary file 1
Sequencing sample information.
- https://cdn.elifesciences.org/articles/79387/elife-79387-supp1-v1.xlsx
-
Supplementary file 2
Population genetics sequencing information.
- https://cdn.elifesciences.org/articles/79387/elife-79387-supp2-v1.xlsx
-
Supplementary file 3
Genome assembly summary statistics.
- https://cdn.elifesciences.org/articles/79387/elife-79387-supp3-v1.xlsx
-
Supplementary file 4
ZAL2m outlier region differential expression analysis.
- https://cdn.elifesciences.org/articles/79387/elife-79387-supp4-v1.xlsx
-
Supplementary file 5
H-scan significant gene list.
- https://cdn.elifesciences.org/articles/79387/elife-79387-supp5-v1.xlsx
-
Supplementary file 6
Significant differential expression and allelic bias gene lists.
- https://cdn.elifesciences.org/articles/79387/elife-79387-supp6-v1.xlsx
-
Supplementary file 7
Candidate gene lists.
- https://cdn.elifesciences.org/articles/79387/elife-79387-supp7-v1.xlsx
-
MDAR checklist
- https://cdn.elifesciences.org/articles/79387/elife-79387-mdarchecklist1-v1.docx
Download links
A two-part list of links to download the article, or parts of the article, in various formats.
Downloads (link to download the article as PDF)
Open citations (links to open the citations from this article in various online reference manager services)
Cite this article (links to download the citations from this article in formats compatible with various reference manager tools)
Dynamic molecular evolution of a supergene with suppressed recombination in white-throated sparrows
eLife 11:e79387.
https://doi.org/10.7554/eLife.79387


