A spatiotemporal reconstruction of the C. elegans pharyngeal cuticle reveals a structure rich in phase-separating proteins
- Department of Molecular Genetics, University of Toronto, Canada
- The Donnelly Centre for Cellular and Biomolecular Research, University of Toronto, Canada
- Department of Pharmacology and Toxicology, University of Toronto, Canada
- Molecular Medicine Program, The Hospital for Sick Children, Canada
- Wroclaw University of Science and Technology, Faculty of Fundamental Problems of Technology, Department of Biomedical Engineering, Poland
- Department of Cell and Molecular Biology, St. Jude Children’s Research Hospital, United States
- PIT Bioinformatics Group, Institute of Mathematics, Eötvös University, Hungary
- Center for Quantitative Biology, Academy for Advanced Interdisciplinary Studies, Peking University, China
- Department of Computer Science and Technology, Tsinghua University, China
- Department of Biochemistry, University of Toronto, Canada
Figures
Figure 1
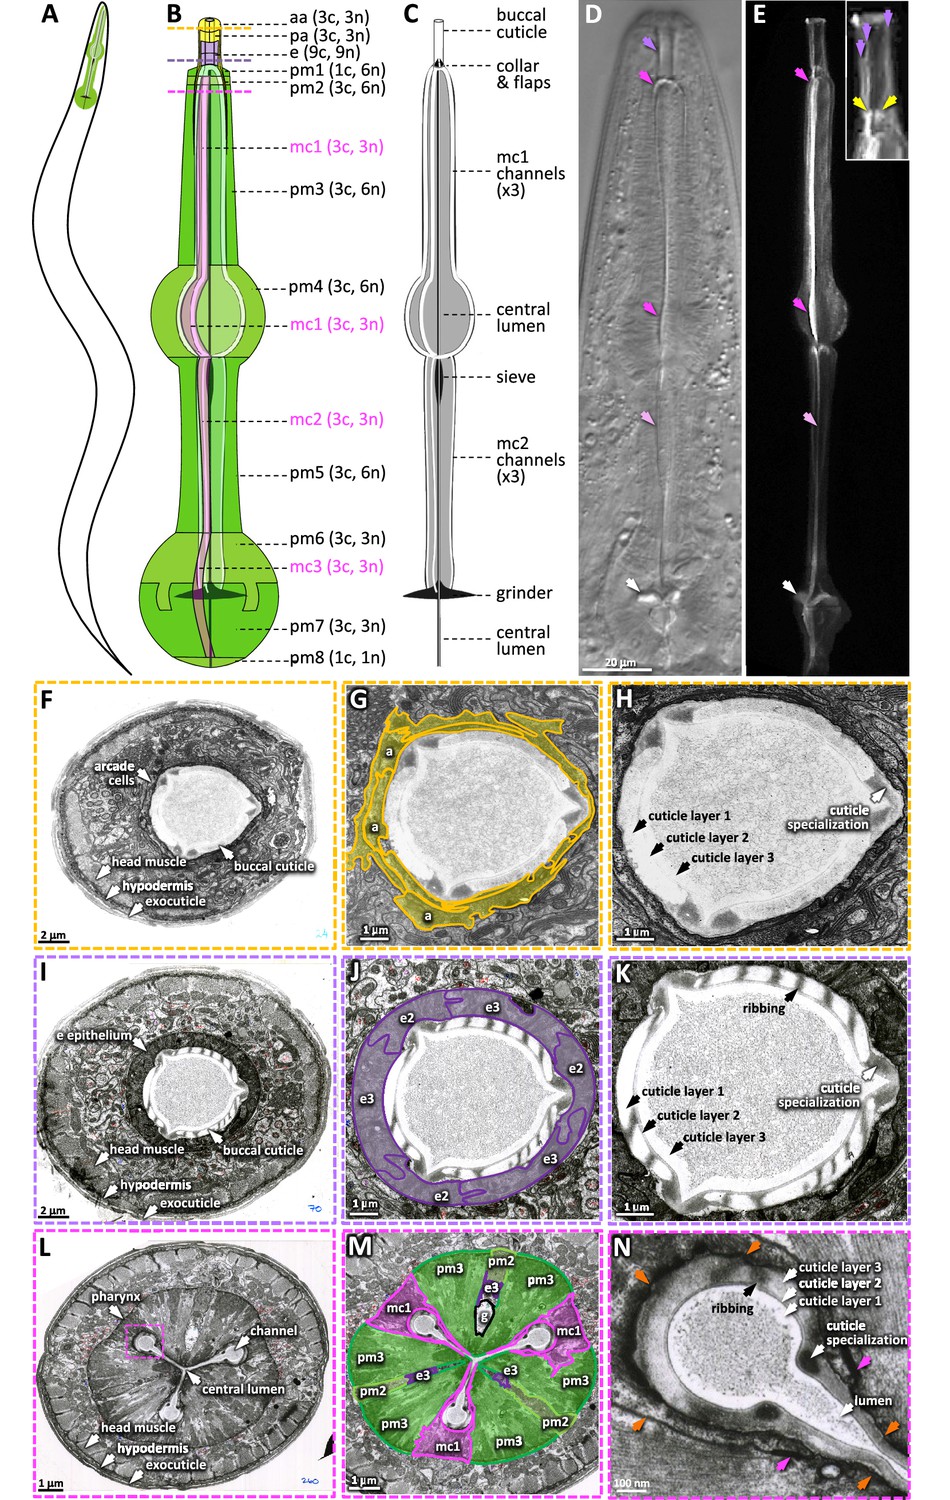
The pharyngeal cuticle and surrounding cells.
(A) A schematic of the relative position of the C. elegans pharynx (green). (B) A schematic of the pharynx. The image of the outer cells is transparent, revealing the pharyngeal cuticle underneath. The 5 cells of the gland and the 20 pharynx-associated neurons are not shown. Each of the cell types are labeled followed by individual number of cells (c) and nuclei (n). aa, anterior arcade cells; pa, posterior arcade cells; e, pharynx epithelium; pm1-8, pharynx muscle; mc1-3, marginal cells. The yellow, purple, and pink dashed lines represent the area of the cross sections in (F–H), (I–K), and (L–N), respectively. (C) A schematic of the pharyngeal cuticle. Black and gray is cuticle; white is the lumen of the buccal cavity, central lumen, and channels. (D, E). Micrographs of the head of young adults expressing ABU-14::sfGFP. Differential interference contrast (DIC) is on the left and GFP of a similarly staged animal, taken with confocal microscopy, is on the right. Purple arrows show the buccal cuticle. The three purple arrows in the inset mark regions of ABU-14::GFP enrichment that likely correspond to the cuticle specializations noted in (H) and (K). Yellow arrows, the metastomal flaps; dark pink arrows, mc1 channel; light pink arrows, mc2 channel; white arrows, grinder. (F–N) TEM images taken from the White et al., 1986 N2T series, stored on the WormAtlas EM archives. (F–H) show a cross section of the anterior buccal cavity; the surrounding arcade cells are highlighted in yellow in (G). (I–K) show a cross section of the posterior buccal cavity; the surrounding e epithelial cells are highlighted in purple in (J). (L–N) show a cross section of the procorpus posterior to the buccal cavity. In (M), the mc1 marginal cells associated with the channels are highlighted in pink; the pharyngeal muscles pm2 and pm3 are highlighted in green and ‘g’ indicates the gland. The pink box in (L) indicates the magnified area in (N). Orange arrows in (N) indicate the pm3-mc1 plasma membrane interface; the pink arrows indicate the adherens junctions.
Figure 2 with 1 supplement
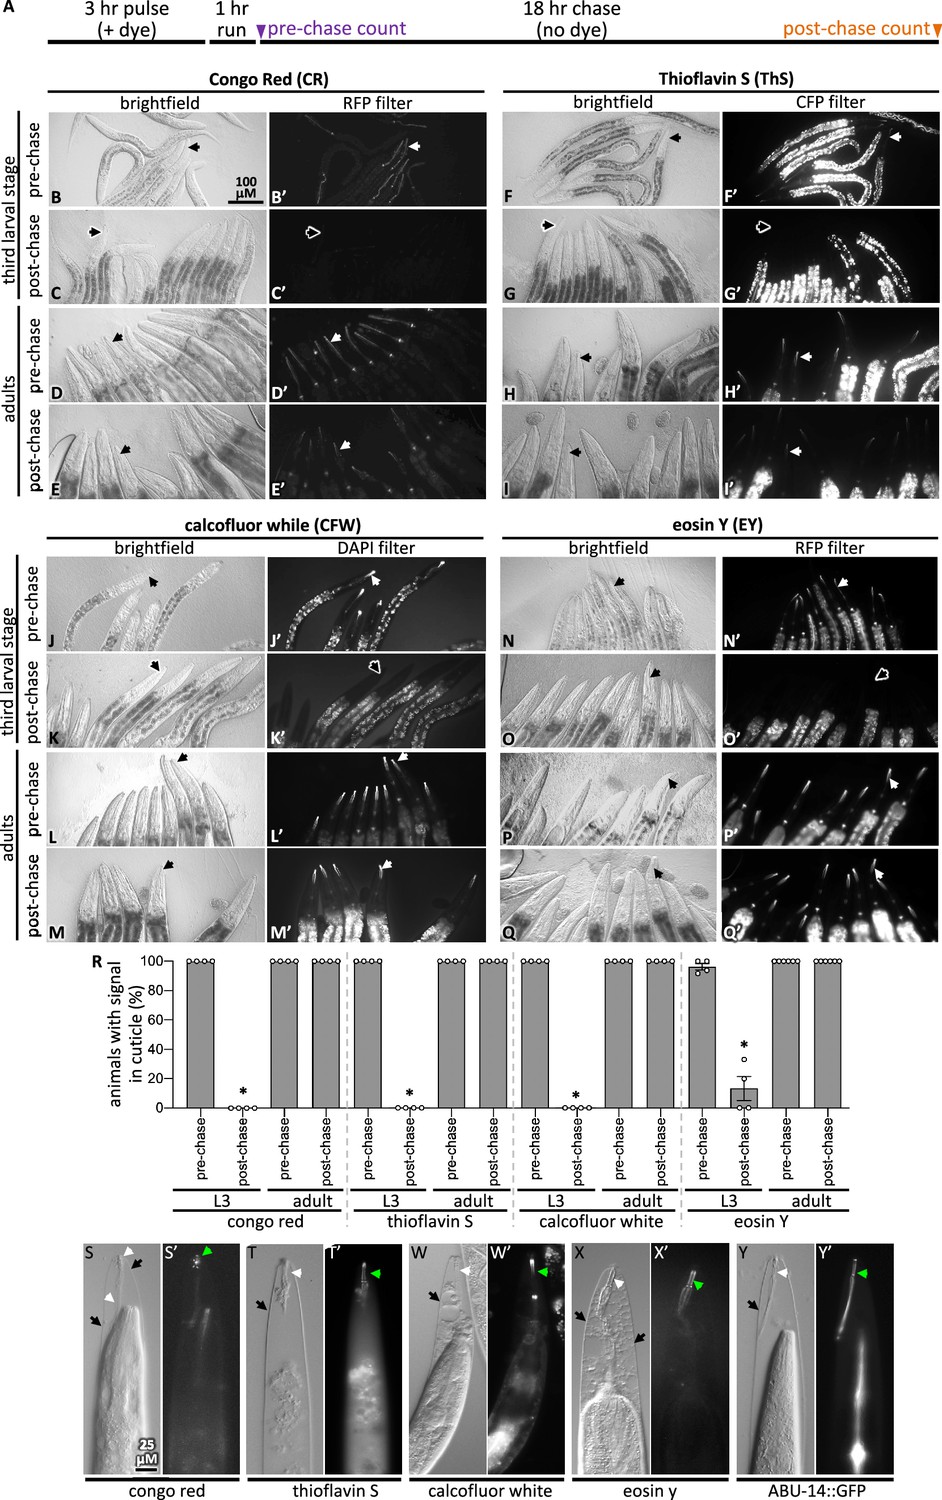
Pulse-chase and cuticle mutant experiments show dye association with the cuticle.
(A) Schematic showing the pulse-chase assay. Synchronized populations of L3 or adult worms were incubated with a dye for 3 hr (the ‘pulse’), after which worms were washed with M9 and run on normal plates with food for 1 hr. Worms are transferred to fresh plates and the presence of the dye was scored (see ‘Materials and methods’ for details). Then, 18 hr later (i.e., after the chase), worms were again scored for the presence of the dye. (B–Q) In each of the four groups of eight micrographs with the dye indicated in the header, the top two rows show the pulse-chase experiment done starting with L3s, and the bottom two rows show the pulse-chase experiment done with adults. The filter used to visualize the dyes is indicated at the header of the rightmost column in each of the four panel sets. In all panels, white arrows highlight the presence of the dye in the cuticle and black arrows show cuticle without dye signal. The scale bar is indicated. (R) The fraction of worms with stained cuticle before and after the chase for each dye is shown; a minimum of four repeats (N) were done with a sample size of 7–34 animals (average = 13) (n) per repeat. Asterisk denotes statistically significant difference relative to the pre-chase values (p<0.05). Standard error of the mean is shown. (S–X) Wildtype animals treated with mlt-9(RNAi) that are incubated with the indicated dye for 3 hr. The brightfield differential interference contrast (DIC) image and the corresponding fluorescent image are shown for each treatment. (Y) An animal expressing transgenic ABU-14::GFP treated with mlt-9(RNAi) but without dye stain. The scale in (S) applies to all panels.
Figure 2—figure supplement 1

The fluorescence and filter controls for dye staining.
Images of young adult wildtype worms incubated with the indicated dyes for 3 hr at the following concentrations: calcofluor white (CFW) (0.01% w/v), eosin Y (EY) (0.15 mg/mL), Congo Red (CR) (0.02% w/v), and thioflavin S (ThS) (0.01%). Also shown is an unstained ABU-14::GFP animal. Green arrows highlight the buccal collar dots that are often visible by differential interference contrast (DIC).
The scale in (A) applies to all panels.
Figure 3
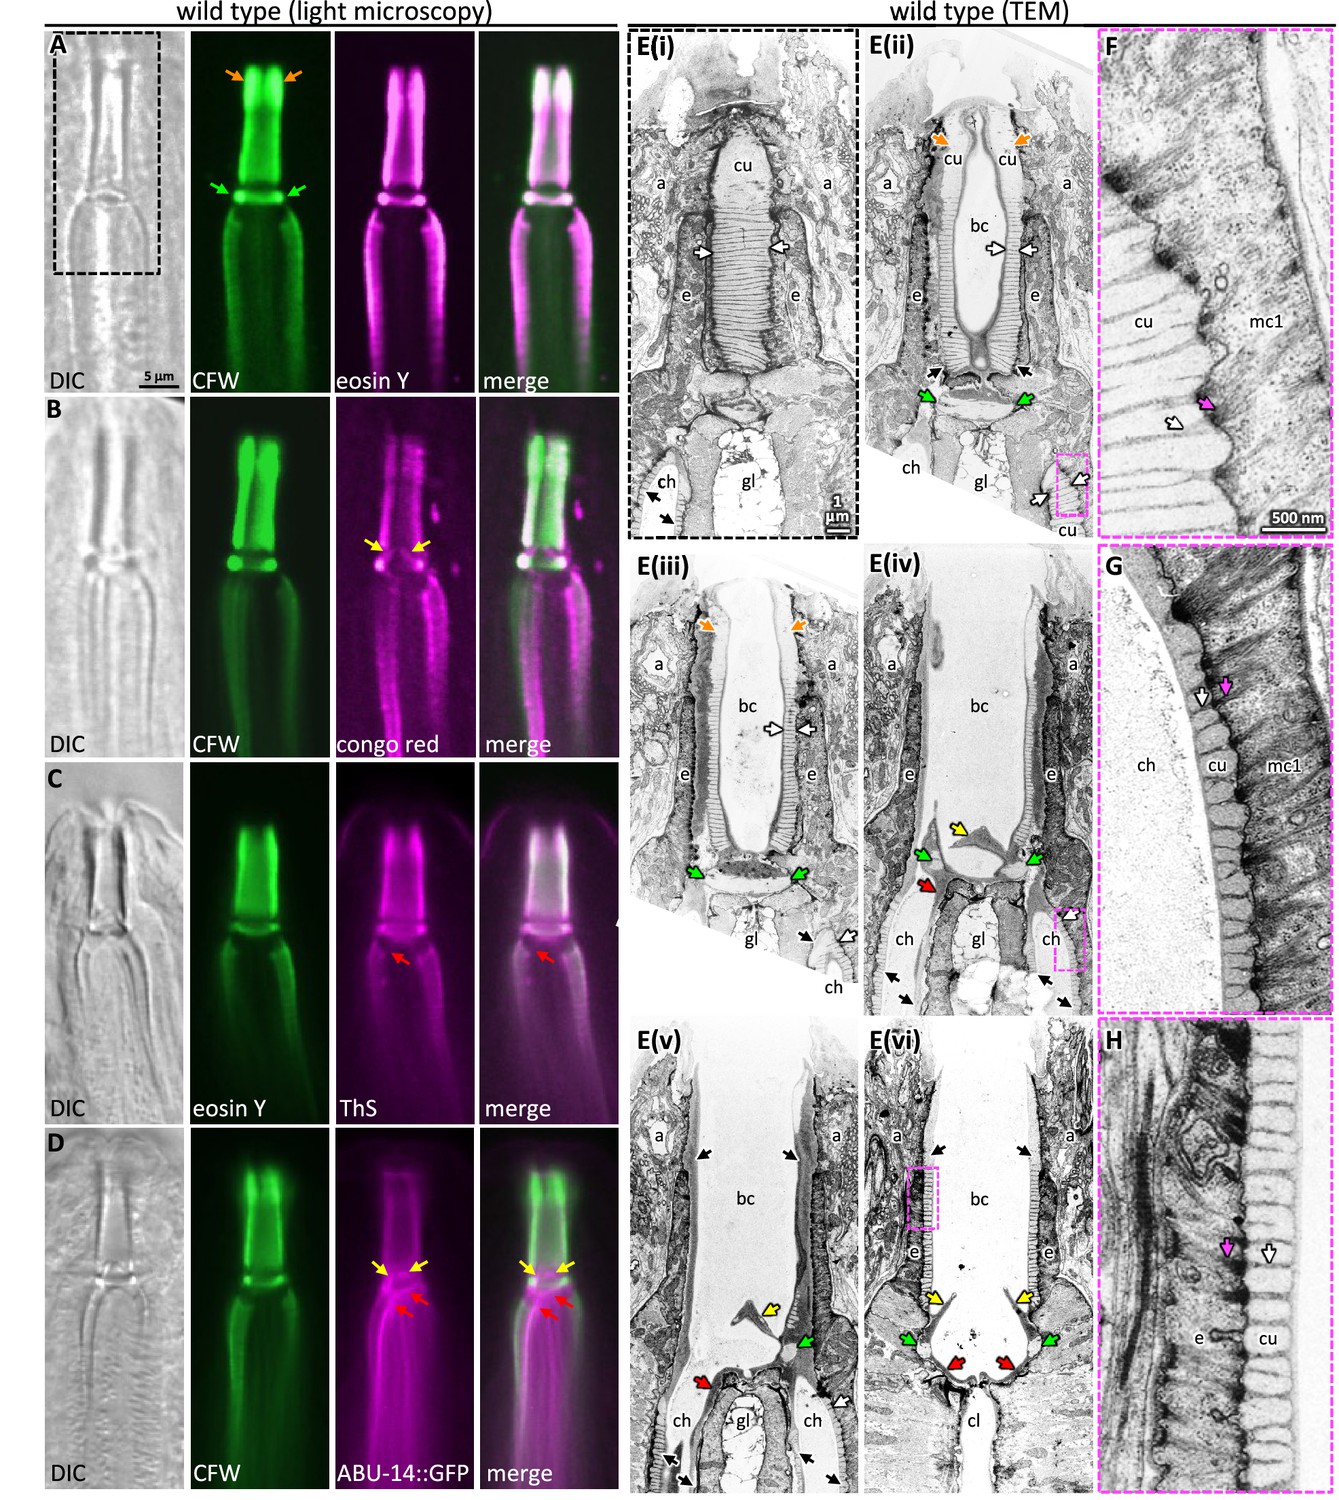
Probing pharyngeal cuticle composition with characterized dyes.
(A–D) Images of the buccal and mc1 channel cuticles and surrounding cells. The dyes or GFP-fusion protein examined is indicated. DIC, differential interference contrast; CFW, calcofluor white; ThS, thioflavin S. The scale shown in (A) is the same for (B–D). (E) Serial coronal sections of unpublished transmission electron micrographs taken by Wright and Thomson, 1981. The scale in (E(i)) applies to all images in the E series. (F–H) Magnifications of the boxed areas highlighted in the images to the left. (G) represents a slightly different plane than that depicted in (E(iv)) and was chosen because of the clearly visible filaments. The scale in (F) is the same as that for (G) and (H). For all panels: a, arcade cells; ch, mc1 channel; cu, cuticle; e, e epithelium; gl, gland cell; bc, buccal cavity; cl central lumen; orange arrows, the anterior enlargement of the buccal cuticle; green arrows, the prominent ring at the base of the buccal cavity; yellow arrows, the electron-dense flaps at the base of the buccal cavity; red arrows, the electron-dense material at the anterior end of the channel cuticle; black arrows, pharyngeal cuticle when too small to be labeled with ‘cu’; white arrows, the ribbing of the pharyngeal cuticle; pink arrows, the cytoplasmic filaments that correspond to the abutment of the ribbing.
Figure 4 with 1 supplement
An informatic reconstruction of the pharyngeal cuticle.
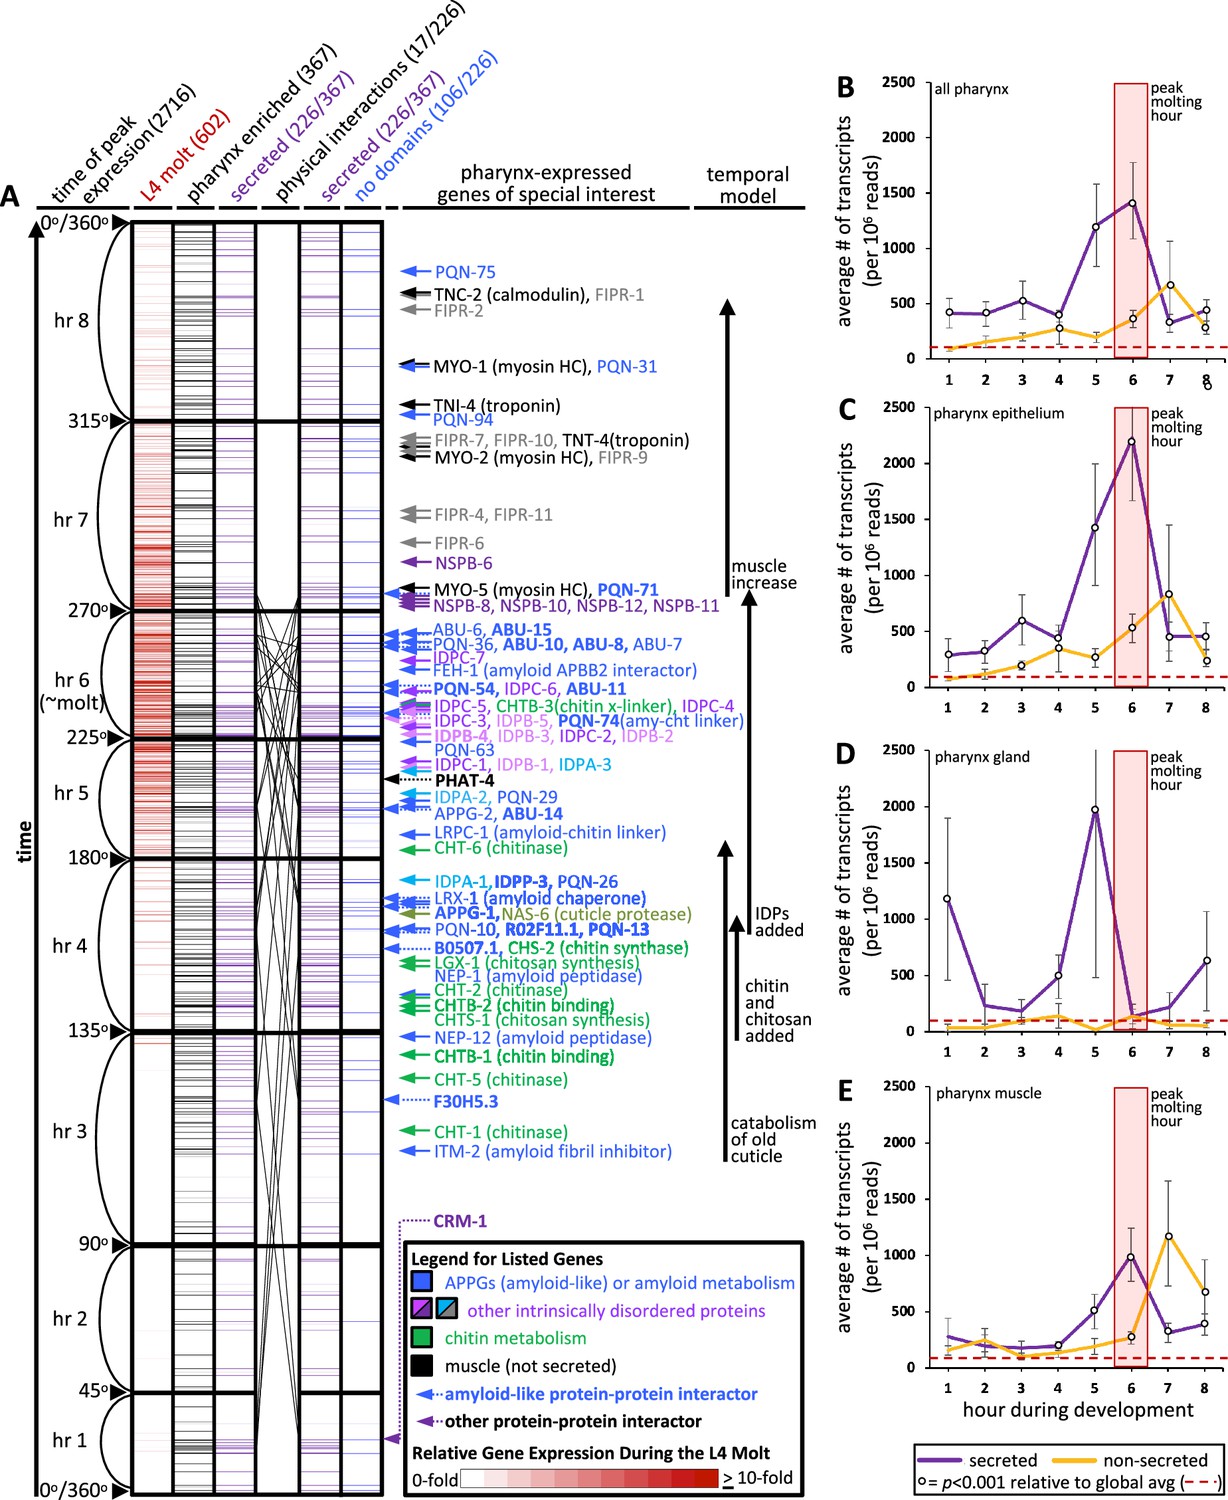
(A) A chart of 2716 genes whose expression oscillates over larval development with a periodicity that corresponds to larval stages. See text for details. Each row represents a single gene. Rows are arranged along the y-axis in order of the time at which each gene reaches its peak expression level with those earliest in the time course at the bottom and those latest in the period at the top. Because the periodicity is a continuum during larval development, Hendriks et al., 2014 represented time as degrees of a circle. That concept is preserved here, and the degree is indicated along the y-axis and divided into bins of time relative to the molting period. The first data column (red) represents the 602 oscillating genes that also were found to be upregulated in expression during the L4 lethargus (molting) period (see Supplemental Table 1 in George-Raizen et al., 2014); the scale of the relative expression level from this independent study (George-Raizen et al., 2014) (is indicated in the legend). The second data column (black) represents the 367 genes from the set of 2716 that are enriched in expression in the pharynx (data from Cao et al., 2017; see Figure 4—source data 1 for enrichment). The purple columns show the 226 genes (of the 367 pharynx-enriched set) that are predicted to be secreted. They are duplicated to show the 26 protein–protein interactions (PPI) among the 17 oscillating pharynx-secreted proteins identified through Genemania (see Figure 5C, Figure 4—source data 1, and Figure 5—source data 1 for the details of which protein pairs interact). The identity of the interacting proteins is indicated with bold lettering and a dotted arrow on the right of the graph. The last column (blue) represents those pharynx-enriched genes that lack an obvious domain as predicted by WormBase, PFAM, and SMART databases (see text for details). 78 pharynx-expressed genes of special interest are indicated with arrows to the right of the graph. The color of the arrows and text corresponds to broad categories indicated in the legend. (B–E) The average number of transcripts produced by genes whose expression is enriched in the indicated tissue as a function of developmental time. In all graphs, results are binned according to the hours indicated in (A), the global average transcript number (49.33) is indicated by the red dotted line. Statistical differences were measured using a Student’s t-test against the global average of gene expression levels in the pharynx. Standard error of the mean is shown in all graphs. The peak molting hour in (B–E) is highlighted by the transparent red box.
-
Figure 4—source data 1
This is the master file with all relevant data for the spatiotemporal map.
- https://cdn.elifesciences.org/articles/79396/elife-79396-fig4-data1-v2.xlsx
Figure 4—figure supplement 1

Tissue-enriched expression levels of tissue-enriched classes of genes.
Each plot shows the expression level (as measured in single-cell sequencing analyses; Cao et al., 2017) (y-axes) of the tissue-enriched set of genes in each tissue type (x-axis). Each dot represents the expression level for a single gene; each column reports the expression level of all genes in the respective set. For example, each of the 470 pharynx-enriched genes are expressed in the pharynx tissue at least 1.5-fold more than all other tissues combined. The plots demonstrate the enrichment of expression in the respective tissue type in each tissue-enriched gene set. The mean expression level for each tissue type and standard error of the mean is shown.
Figure 5 with 1 supplement
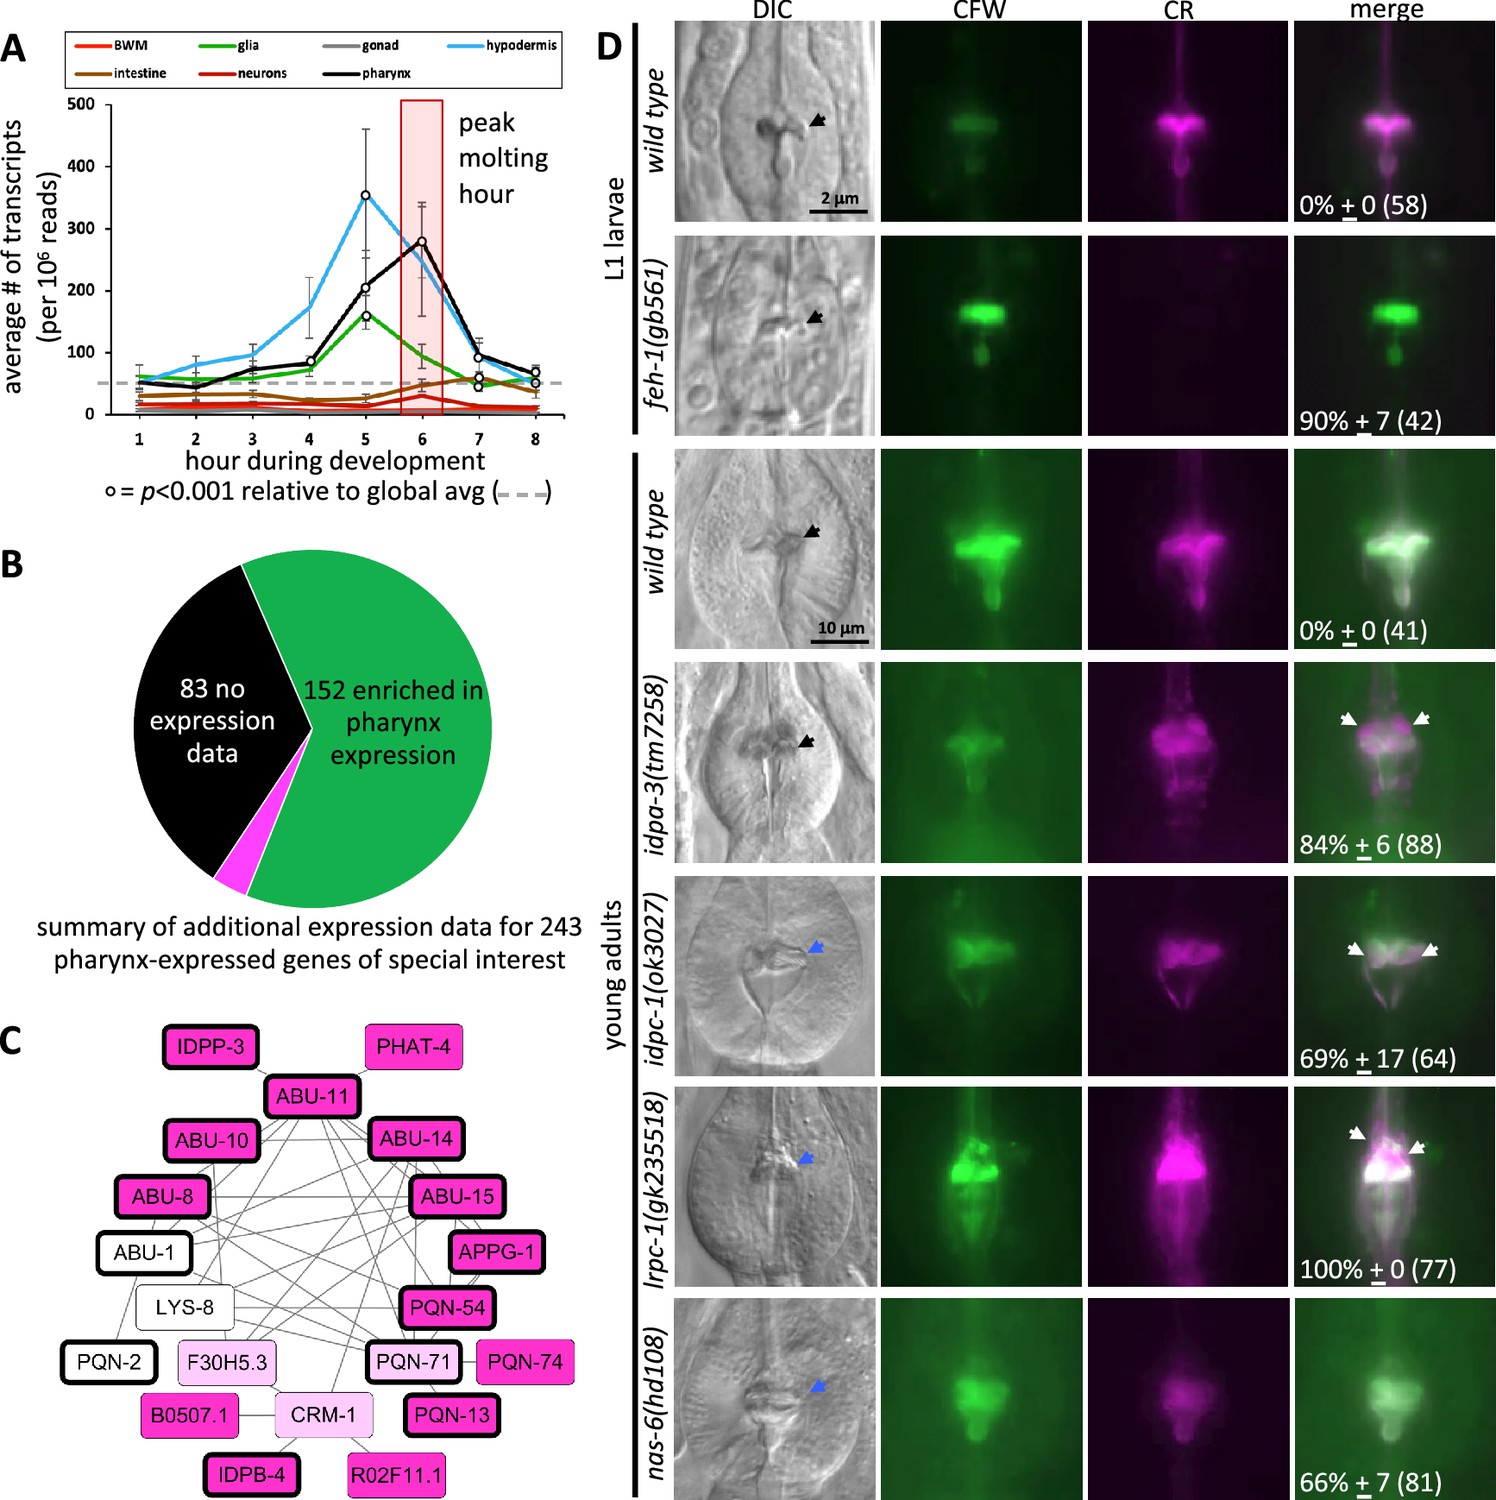
The spatiotemporal map has predictive power.
(A) Average gene expression in each of the indicated tissue types plotted as a function of developmental time. In the first hour of the time course, for example, 219 genes peak in expression and the average expression of each of these 219 genes in each of the indicated tissues is plotted for hour 1 on the graph. Standard error of the mean is shown. The peak pharynx molting hour is highlighted by the transparent red box. Significant differences relative to the global mean is calculated with a Student’s t-test. (B) A pie chart summarizing the search of publicly available information on previously documented expression patterns of the 226 oscillating pharynx secretome genes and 17 other genes of interest (which are part of the 78 genes highlighted in Figure 4A). Published expression patterns could be found for 160 of the 243 genes. Of the 160, the expression pattern of only 8 genes (indicated in fuchsia) did not support clear enrichment in the pharynx. See Supplementary file 1 for details. (C) Protein–protein interactions within the pharynx secretome. Dark pink nodes are those genes that peak in expression during hours 4, 5, or 6 on the spatiotemporal map. Light pink nodes peak in expression outside of hours 4, 5, or 6. White nodes represent genes that do not oscillate. Nodes outlined in bold are those proteins composed of >75% intrinsically disordered regions (IDRs). (D) A survey of mutants for obvious pharynx cuticle defects. Each of the indicated backgrounds are stained with calcofluor white (CFW) and Congo Red (CR). The mean percentage of animals showing defects, together with the standard error of the mean (N = 3 independent trials with more than eight animals each trial). The total number of animals surveyed is indicated in brackets. The scale for L1 and adult animals is shown. DIC, differential interference contrast, black arrows indicate a normal terminal bulb grinder, blue arrows indicate a dysmorphic grinder, and white arrows indicate discordant CR staining.
-
Figure 5—source data 1
Supporting information for the network diagram in Figure 5C and related insights.
- https://cdn.elifesciences.org/articles/79396/elife-79396-fig5-data1-v2.xlsx
Figure 5—figure supplement 1

The pharynx secretome has a dense protein–protein interaction (PPIs) network relative to other secretomes.
(A) The PPIs among gene products whose corresponding mRNAs are enriched in the indicated tissue (as derived from the L2 single-cell sequencing dataset; Cao et al., 2017) and secreted (as defined by the presence of a signal sequence) (see Supplementary file 1 for details) as revealed through Genemania (El-Gebali et al., 2019). Genemania settings used are ‘equal by network weighting’, and max resultant genes and attributes set to zero. Only networks that include clusters of three or more genes are considered here. Each interaction must be represented by multiple independent lines of experimental evidence. (B) A comparison of the indicated properties between the group of 20 interacting proteins of the pharynx secretome and the entire proteome. All differences are significant (p<0.001) as measured by a Student’s t-test.
Figure 6 with 1 supplement
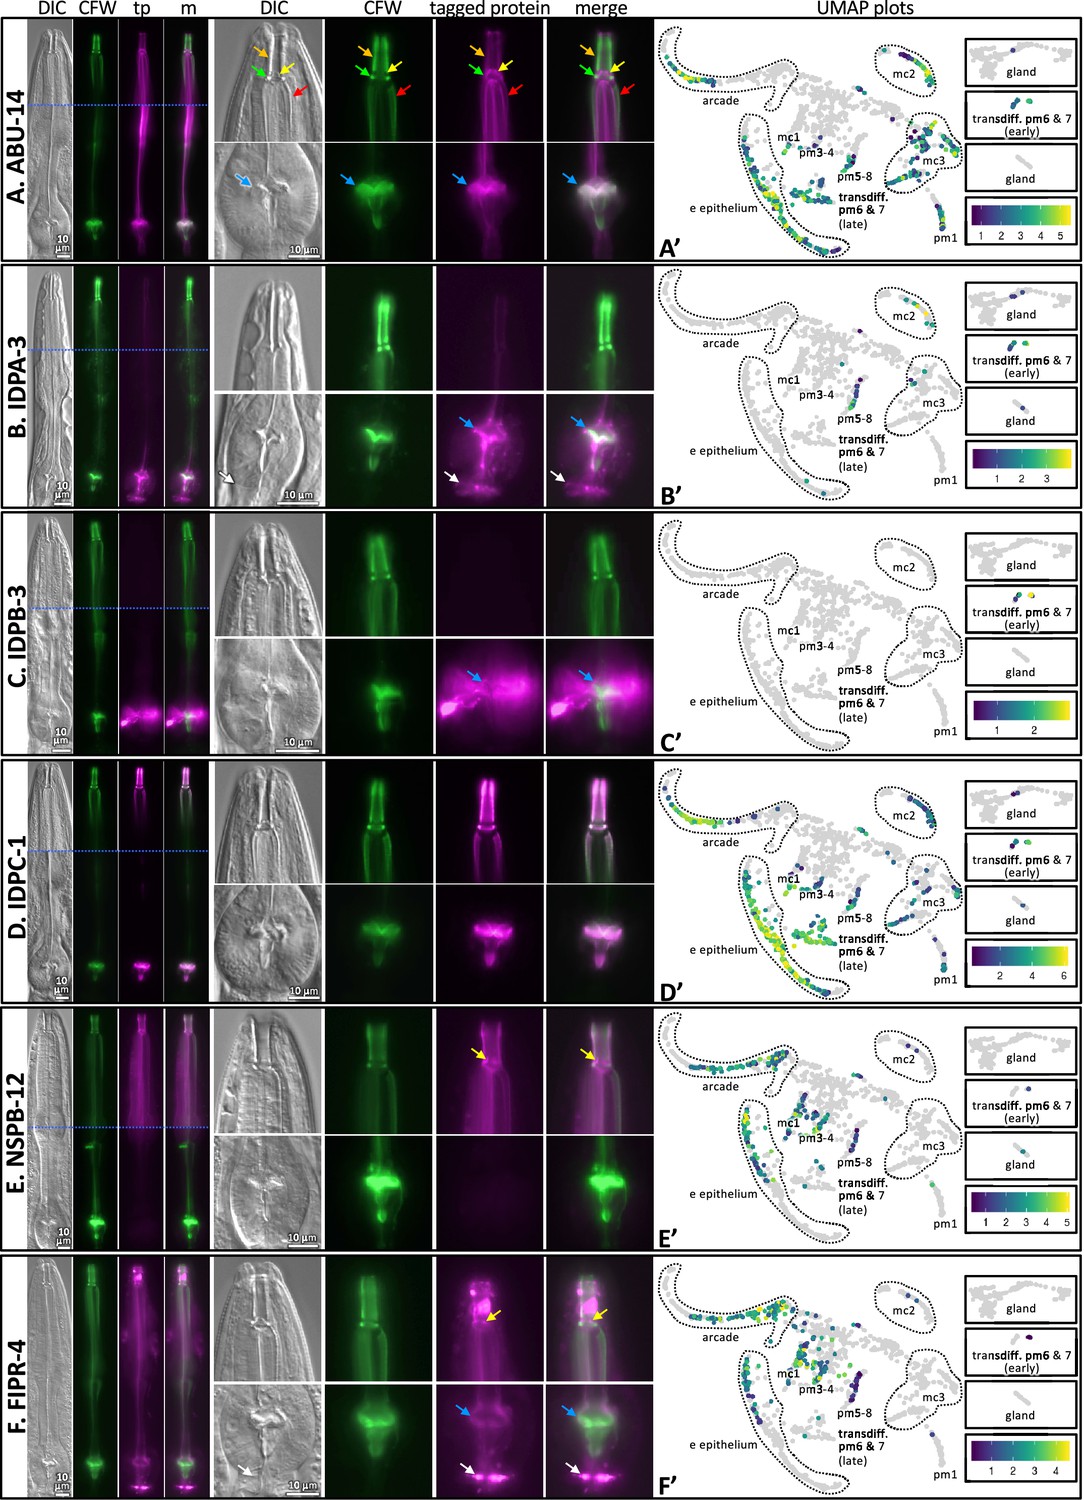
The localization of six fluorescently tagged pharynx cuticle components.
Each of the six large horizontal boxes contain data about the six predicted gene products indicated on the left. In each box, the four images on the left are of the head of a single worm, imaged first with differential interference contrast (DIC), then with calcofluor white (CFW) in green, then the fluorescently tagged protein (tp) protein of interest in fuchsia, followed by a merged (m) image as indicated at the top of the columns. A blue horizontal line indicates the intersection of two cropped images to show different relevant focal planes of the same animal. The scale is indicated. The middle set of eight images correspond to magnified buccal cavity and channels (top) and terminal bulb and grinder (bottom). The scale is indicated. Colored arrows are used for reference in (A) and used to draw attention to particular features in (B–F): Orange, buccal cavity; yellow, flaps; green, collar; red, anterior channels; blue, grinder; white, presumptive ECM between the terminal bulb and intestinal valve. The graph on the right is a UMAP plot of the pharynx mRNA expression pattern for the respective gene (see text for details). The relative expression level is indicated. (A) An RP3439 animal harboring the trIs113[Pabu-14:abu-14:superfolderGFP; rol-6(d); unc-119(+)] integrated array. (B) An RP3519 animal harboring the Ex[idpa-3p::IDPA-3::mNeonGreen; myo-2p::mCherry] extrachromosomal array. (C) An RP3498 animal harboring the Ex[idpb-3p::IDPB-3::mNeonGreen; myo-2p::mCherry] extrachromosomal array. (D) An RP3497 animal with genomic idpc-1 fused in-frame to the coding sequence for mGreenLantern. (E) An RP3499 animal harboring the Ex[nspb-12p::NSPB-12::mNeonGreen; myo-2p::mCherry] extrachromosomal array. (F) An RP3514 animal harboring the Ex[fipr-4p::FIPR-4::mNeonGreen; myo-2p::mCherry] extrachromosomal array. All animals are counterstained with the calcofluor white (CFW) chitin stain. The expression patterns shown are typical of the population that are positive for the transgene.
Figure 6—figure supplement 1
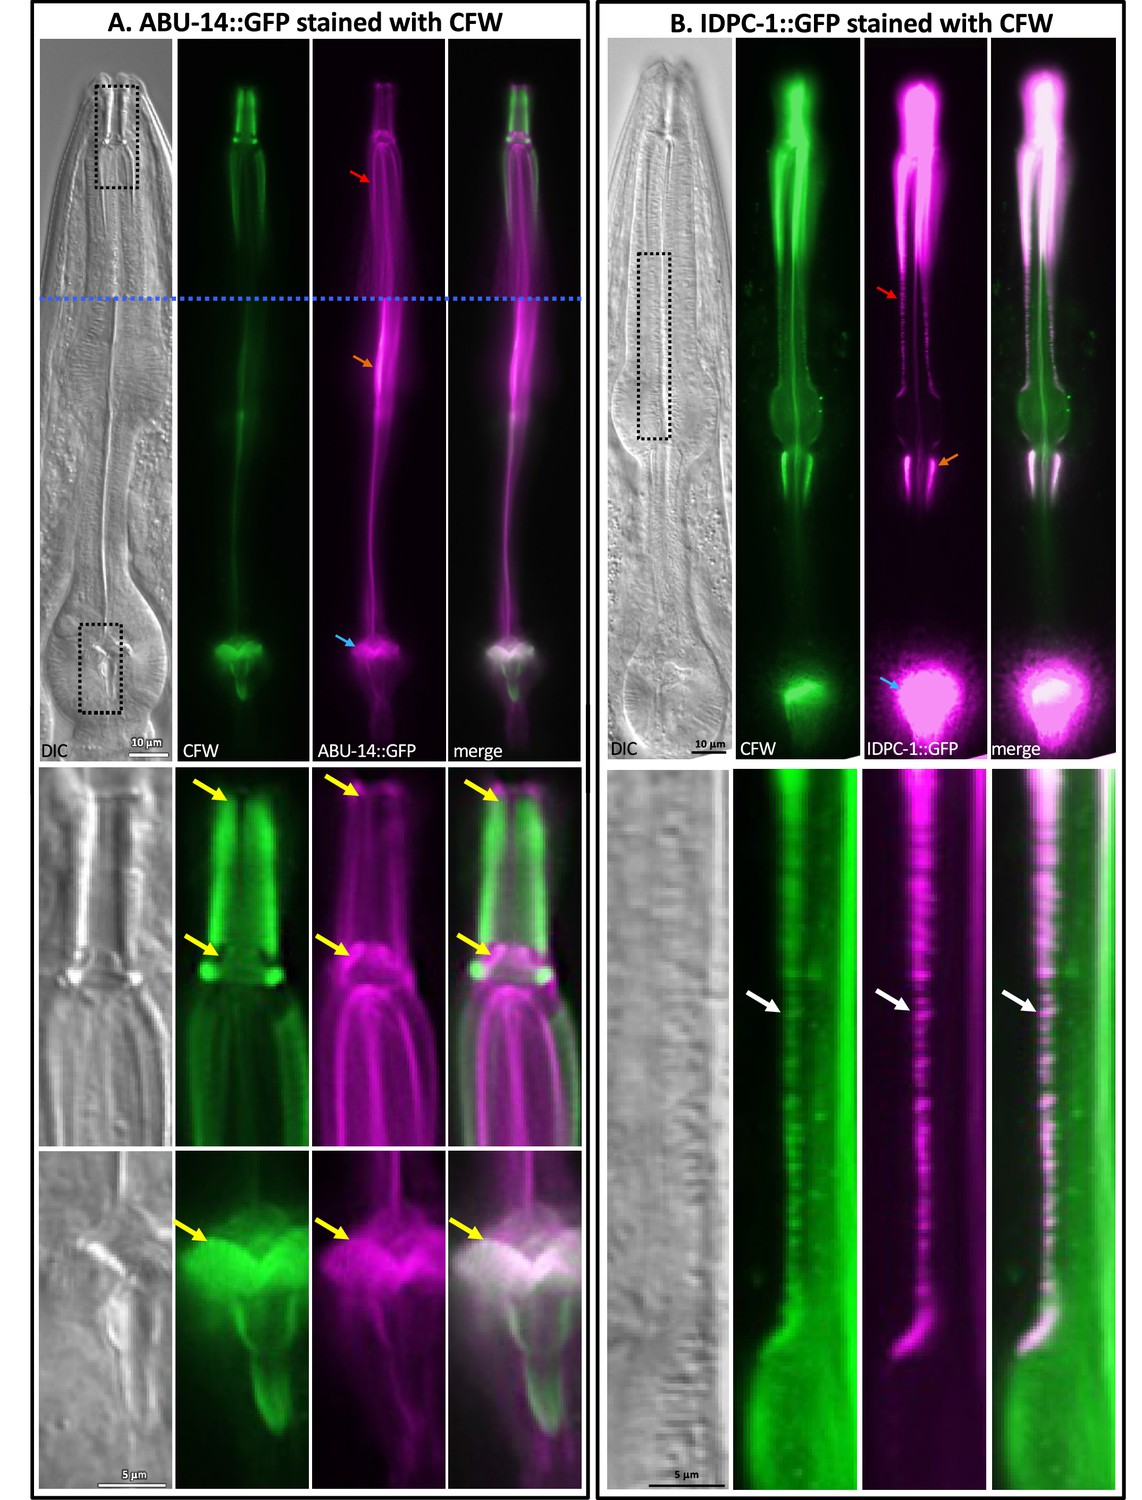
A comparison of the tagged ABU-14 and IDPC-1 localization patterns.
(A) The C. elegans RP3439 trIs113[Pabu-14:abu-14:sfGFP; rol-6(d); unc-119(+)] strain. The lower panels show a magnified view of the areas boxed in the upper lefthand panel to illustrate how the tagged ABU-14 fails to overlap many areas of intense calcofluor white (CFW) signal (yellow arrows). The horizontal blue line illustrates where two focal plans were spliced together. (B) The C. elegans RP3497 strain that has mGreenLantern (GFP) coding sequence fused in frame to the 3′ sequence of idpc-1 (Y47D3B.6) genomically. The GFP signal is specific to the pharynx cuticle. The lower panels show a magnified view of the areas boxed in the upper lefthand panel. The animal is counterstained with the CFW chitin stain. This animal is overexposed in some areas in order to show clear and discrete overlap between the tagged IDPC-1 protein and the CFW signal that likely correspond to the ribbing of the channels (white arrows on bottom panels). In all panels, a red arrow highlights the channels, an orange arrow highlights the sieve of near the isthmus channels, and a blue arrow highlights the grinder.
Figure 7
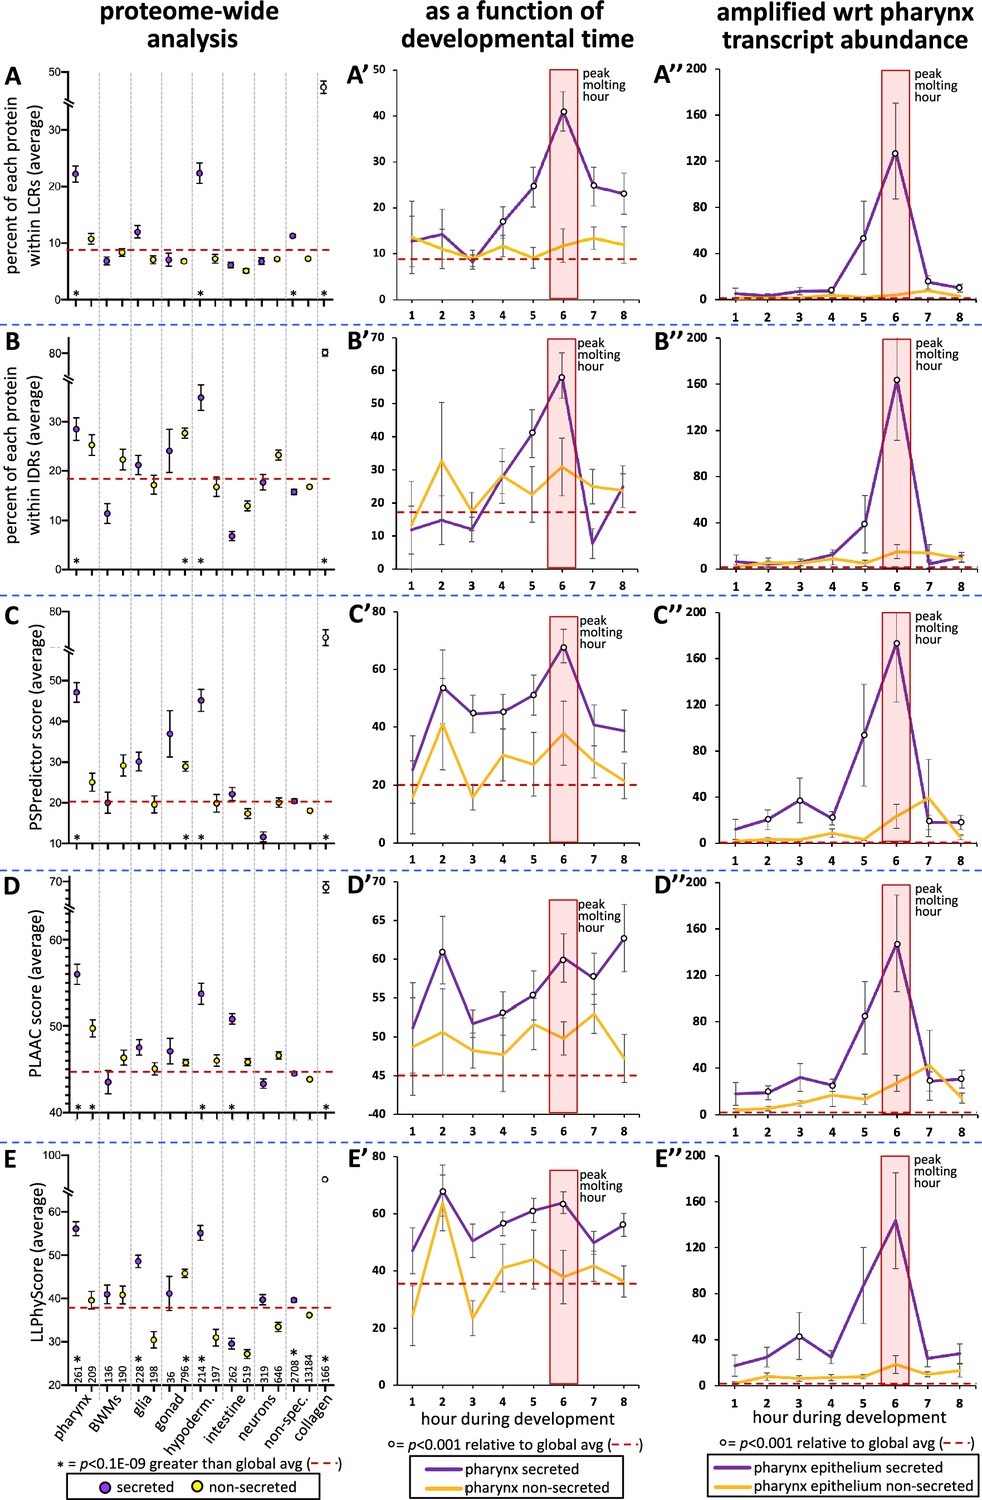
The pharynx secretome is enriched with intrinsically disordered proteins with phase separation capability.
(A–E) An analysis of the entire proteome for the indicated properties. The tissue type examined, as well as the number of genes in each bin, is indicated at the bottom of the graph in (E) (hypoderm., hypodermis; non-spec., non-specific). Statistical differences, indicated with an asterisk at the bottom of each graph, were measured using a Student’s t-test against the global average (indicated with a red hatched line for each property). (A’–E’) An examination of the same properties as (A–E), but with a focus on genes whose expression is enriched in the pharynx over developmental time. (A’’–E’’) An examination of the same properties as (A’–E’), but normalized with respect to each gene’s transcript abundance within the pharyngeal epithelium. For each gene, the number of transcripts was multiplied by the value of gene products property (i.e., % within low-complexity region [LCR], % withing intrinsically disordered regions [IDRs], or PSPredictor score, etc.), and the average for that temporal bin was calculated. The Y-axis in (A’’–E’’) reports numbers in the thousands. Statistical differences were measured using a Student’s t-test against the global average. In all graphs, standard error of the mean is shown. Because the PLAAC algorithm can report negative scores up to –60, 60 was added to the PLAAC scores of all gene products for the sake of clarity. The peak molting hour is highlighted by the transparent red box.
Figure 8
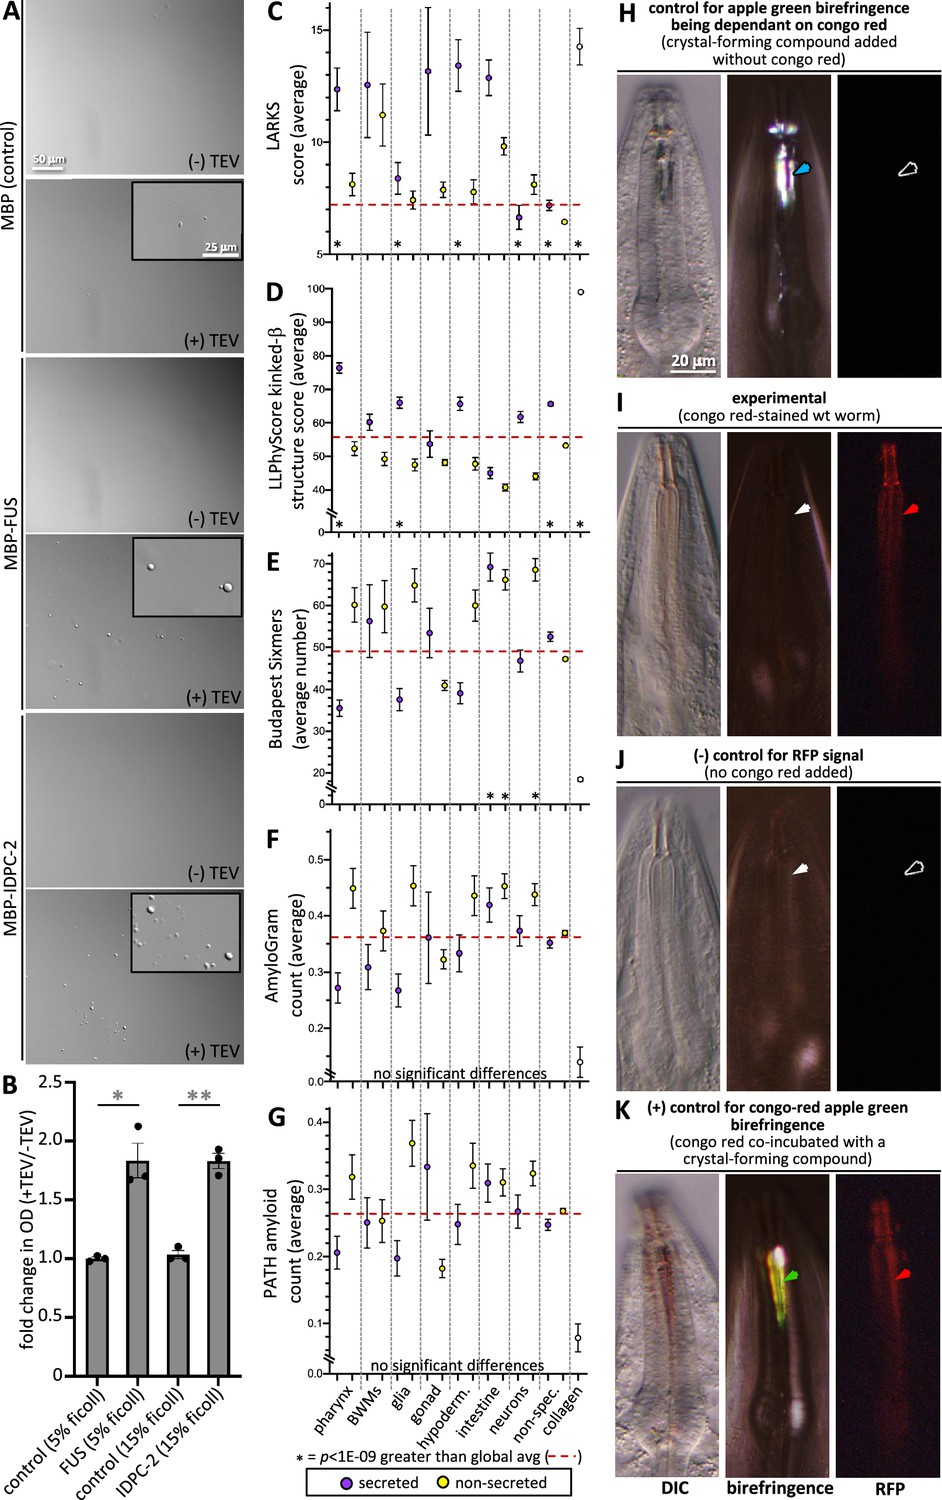
Cuticle proteins can likely phase separate and are enriched with protofilament but not amyloidogenic sequence.
(A) In vitro purified maltose-binding protein (MBP) control (15% Ficoll) or fusions with the FUS-positive control (5% Ficoll) and IDPC-2 (15% Ficoll) phase separate into spheres upon cleaving off the MBP tag with TEV protease, while the MBP-only negative control does not. The inset is a magnification of the corresponding area. The scales for all insets and larger images are respectively the same. (B) Quantification of the fold change in optical density (OD; 395 nm) of indicated samples after 1 hr of treatment with TEV relative to the OD without the addition of TEV. *p<0.01 and **p<0.001, respectively, using a Student’s t-test. In (A, B), all proteins are at a concentration of 1 mg/mL, except for FUS, which is at 1.5 mg/mL. The MBP-only control is therefore a vast molar excess. (C–G) An analysis of the entire proteome for the indicated properties. The details are the same as that indicated for Figure 7. (H) Control for the dependence of the apple green color on Congo Red (CR). Wildtype animals are incubated in wact-190 as previously described (Kamal et al., 2019) and yield birefringent crystals that lack notable apple green color (blue arrowhead). (I) Wildtype adult worms incubated with CR exhibit red fluorescent pharyngeal cuticle (red arrowhead; left column), but no apple green birefringence (white arrowhead; middle column). Differential interference contrast (DIC) is shown in the left column. Zero out of 30 animals exhibited apple green birefringence. (J) Control for the CR RFP signal. Wildtype animals are incubated without CR present. No birefringence (white arrowhead) or CR signal (black arrowhead) results. (K) Control for the ability to detect CR apple green birefringence. The wildtype animal was incubated simultaneously in CR and wact-190, a small molecule that crystalizes in the pharyngeal cuticle. The apple green birefringence (green arrowhead) manifests under these conditions because CR likely incorporates into the regular crystal lattice of the wact-190-derived crystals. The scale in (H) is representative of all panels.
Figure 9 with 1 supplement
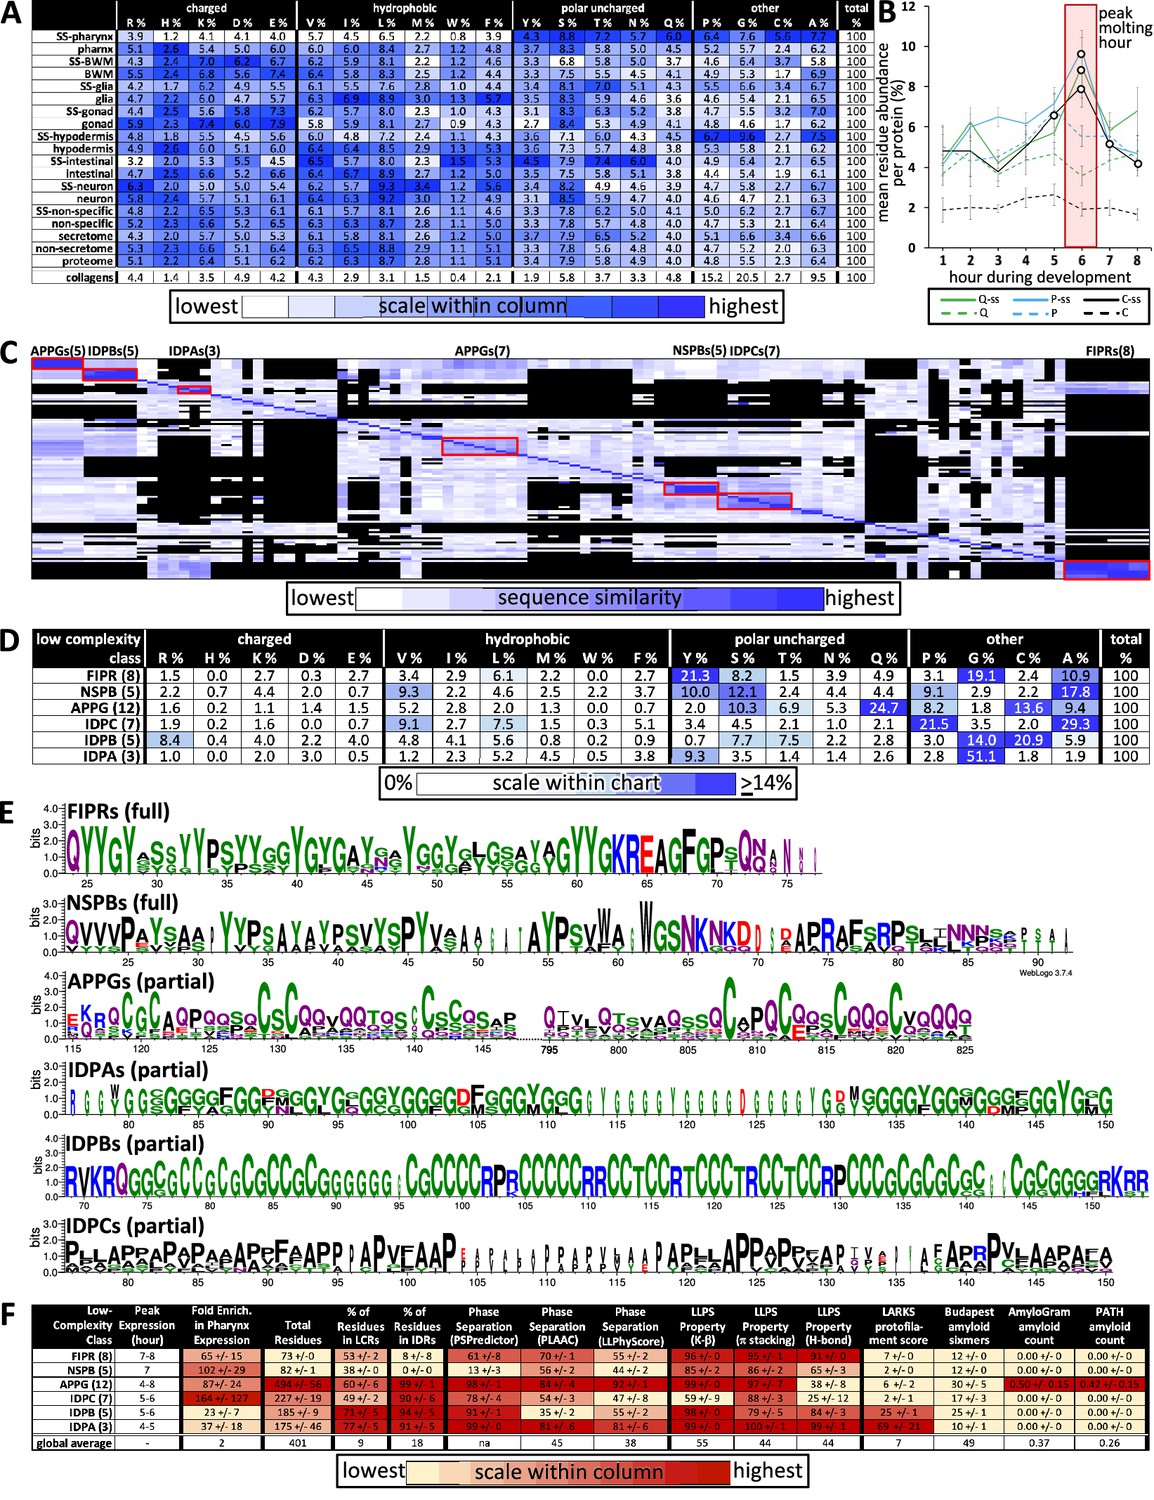
Properties of the low-complexity protein families that are likely secreted into the developing cuticle.
(A) Average percent amino acid composition of the proteins within the indicated tissue type. The percentages along a single row sum to 100. The color scale indicates the range of values within a single column so as to compare the relative abundance of the indicated residue among the different protein sets. The collagens are not included in the color scale comparison. SS, secreted proteins based on harboring a signal sequence; BWM, body wall muscles. All of the mean residue percentages from the set of proteins secreted from the pharynx cells are significantly different compared to that of the remaining proteome (Student’s t-test; p<2E-05). (B) A plot of the average percentage cysteine, proline, and glutamine composition of each protein as a function of developmental time. Secreted (ss) and non-secreted proteins are represented by solid lines and dashed lines, respectively. Open circles indicate signification differences relative to the non-secreted class (p<0.05). (C) Clustal Omega pairwise comparisons of all 106 low-complexity proteins in the pharynx secretome. Both X and Y axis have the same 106 proteins in the same order. Families with high sequence identity are outlined with a red box. (D) Similar to (A), except that residue composition is restricted to the indicated low-complexity family and that the color scale compares percentages across the entire chart. (E) Consensus sequence logos for the indicate protein families. The full consensus sequence (without the signal peptide) of the FIPRs and NSPBs is shown. The full consensus sequence of the remaining groups is given in Figure S5. (F) A chart of properties for the six low-complexity families. Because the PLAAC algorithm can report negative scores up to –60, 60 was added to the PLAAC scores of all gene products for the sake of clarity. All values show means ± standard error of the mean.
-
Figure 9—source data 1
Supporting information for the chart diagram in Figure 9C.
- https://cdn.elifesciences.org/articles/79396/elife-79396-fig9-data1-v2.xlsx
Figure 9—figure supplement 1

Consensus sequence for select low-complexity families.
Sequence logos based on full-length protein sequence alignments (Wozniak and Kotulska, 2015) of the APPGs (12 sequences), IDPAs (3 sequences), IDPBs (5 sequences), and IDPCs (7 sequences). Sequences were aligned with CLUSTAL W, and Sequence Logos were generated using WebLogo 3.7.4 (Sali and Blundell, 1993; Chaudhury et al., 2010). Details of the sequences used are given in Supplementary file 1.
Figure 10 with 2 supplements
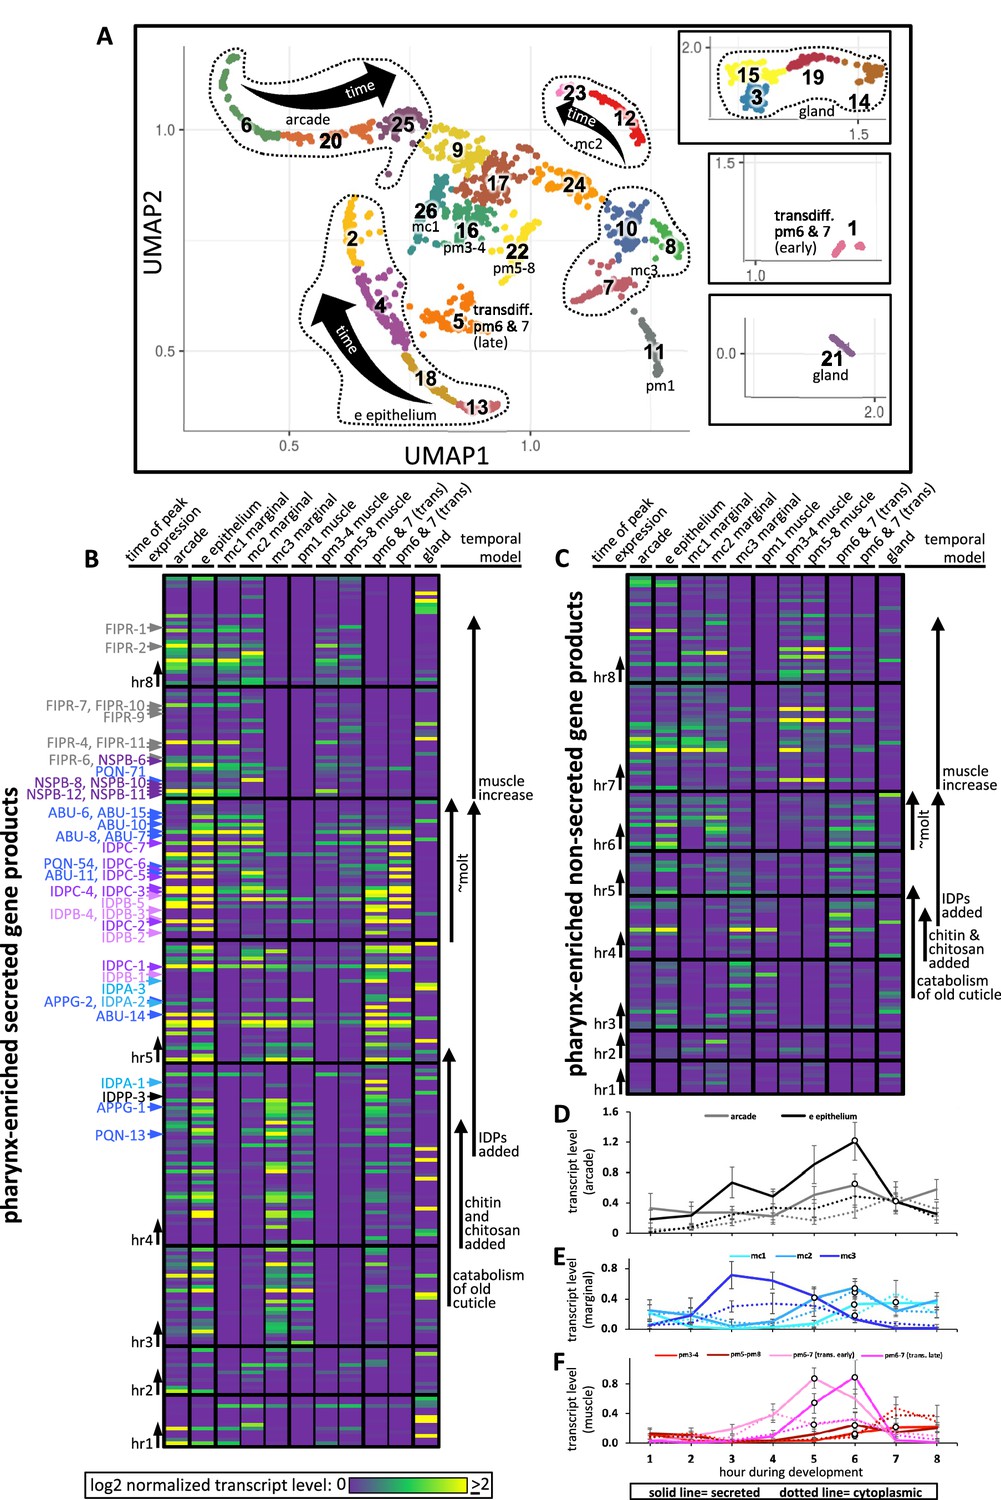
Expression of pharynx-enriched genes in distinct cell types.
(A) A UMAP of 1675 pharynx cells modified with permission from Packer et al., 2019's online tool. The clusters are numbered according to Packer et al., 2019. The cell type identities are partially based on those from Packer et al., 2019 (see Figure 10—figure supplements 1 and 2 for details). Due to space constraints, three cluster groups from the map are shown as insets. (B, C) The expression level of the pharynx-enriched gene set in the indicated tissue type. The graph notation and the order of genes in rows is preserved from Figure 4A. Genes encoding a signal peptide are shown in (B) and those without a signal sequence are shown in (C). The mc1, pm3-4, and pm5-8 values represent the average gene expression of the cells within the respective clusters (26, 16, and 22). The values corresponding to the other cell types represent the highest average from among the group of clusters that constitute that cell type. For example, the arcade cells are represented by clusters 6, 20, and 25, but the expression level from each of these clusters is distinguished by time, not space, and averaging signal from all three would dilute the expression level that represents that cell type. All members of the six low-complexity families are indicated on the left of (B) and the color code is the same as that present in Figure 4A. (D–F) The average transcript level of all genes within the indicated cell type as a function of binned time. Open white circles represent a significantly greater value (p<0.01) compared to the bin 2 hr previous.
Figure 10—figure supplement 1
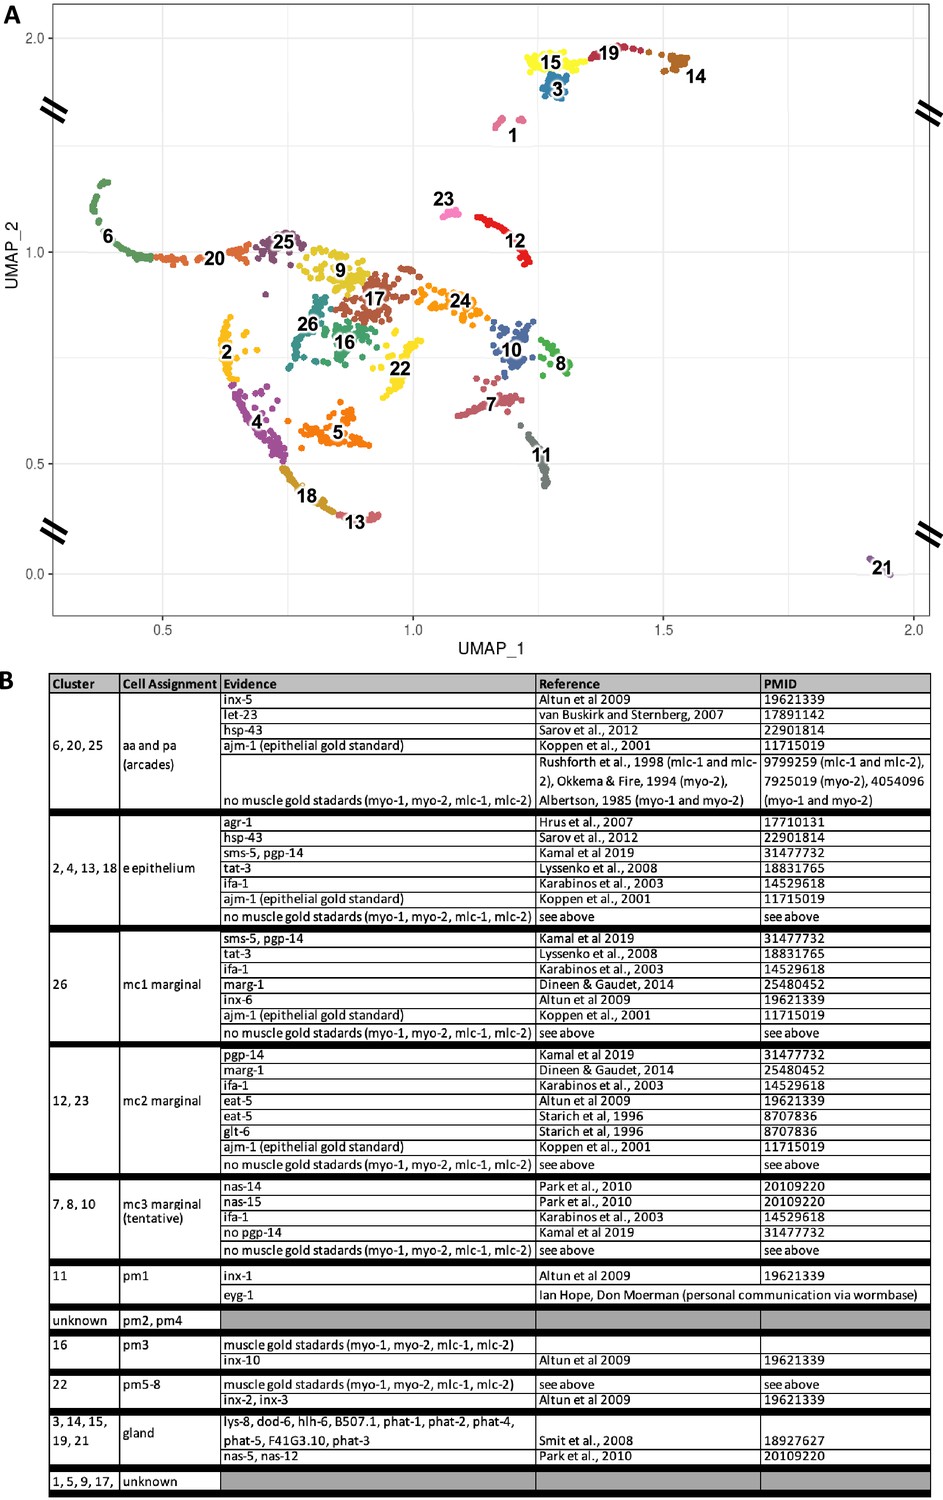
Identity assignment of the pharynx UMAP clusters.
(A) The cluster map and cluster numbers were derived from Packer et al., 2019 using the single-cell L2 sequencing data from Cao et al., 2017. Note the cropped Y-axis for reasons of graphical clarity. (B) Published gene expression patterns from transgenic reporters were used to assign identities to each of the clusters. Several of our assignments are different from that of Packer et al., 2019. See Figure 10—figure supplement 2 for the corresponding UMAP plots of the listed genes.
Figure 10—figure supplement 2
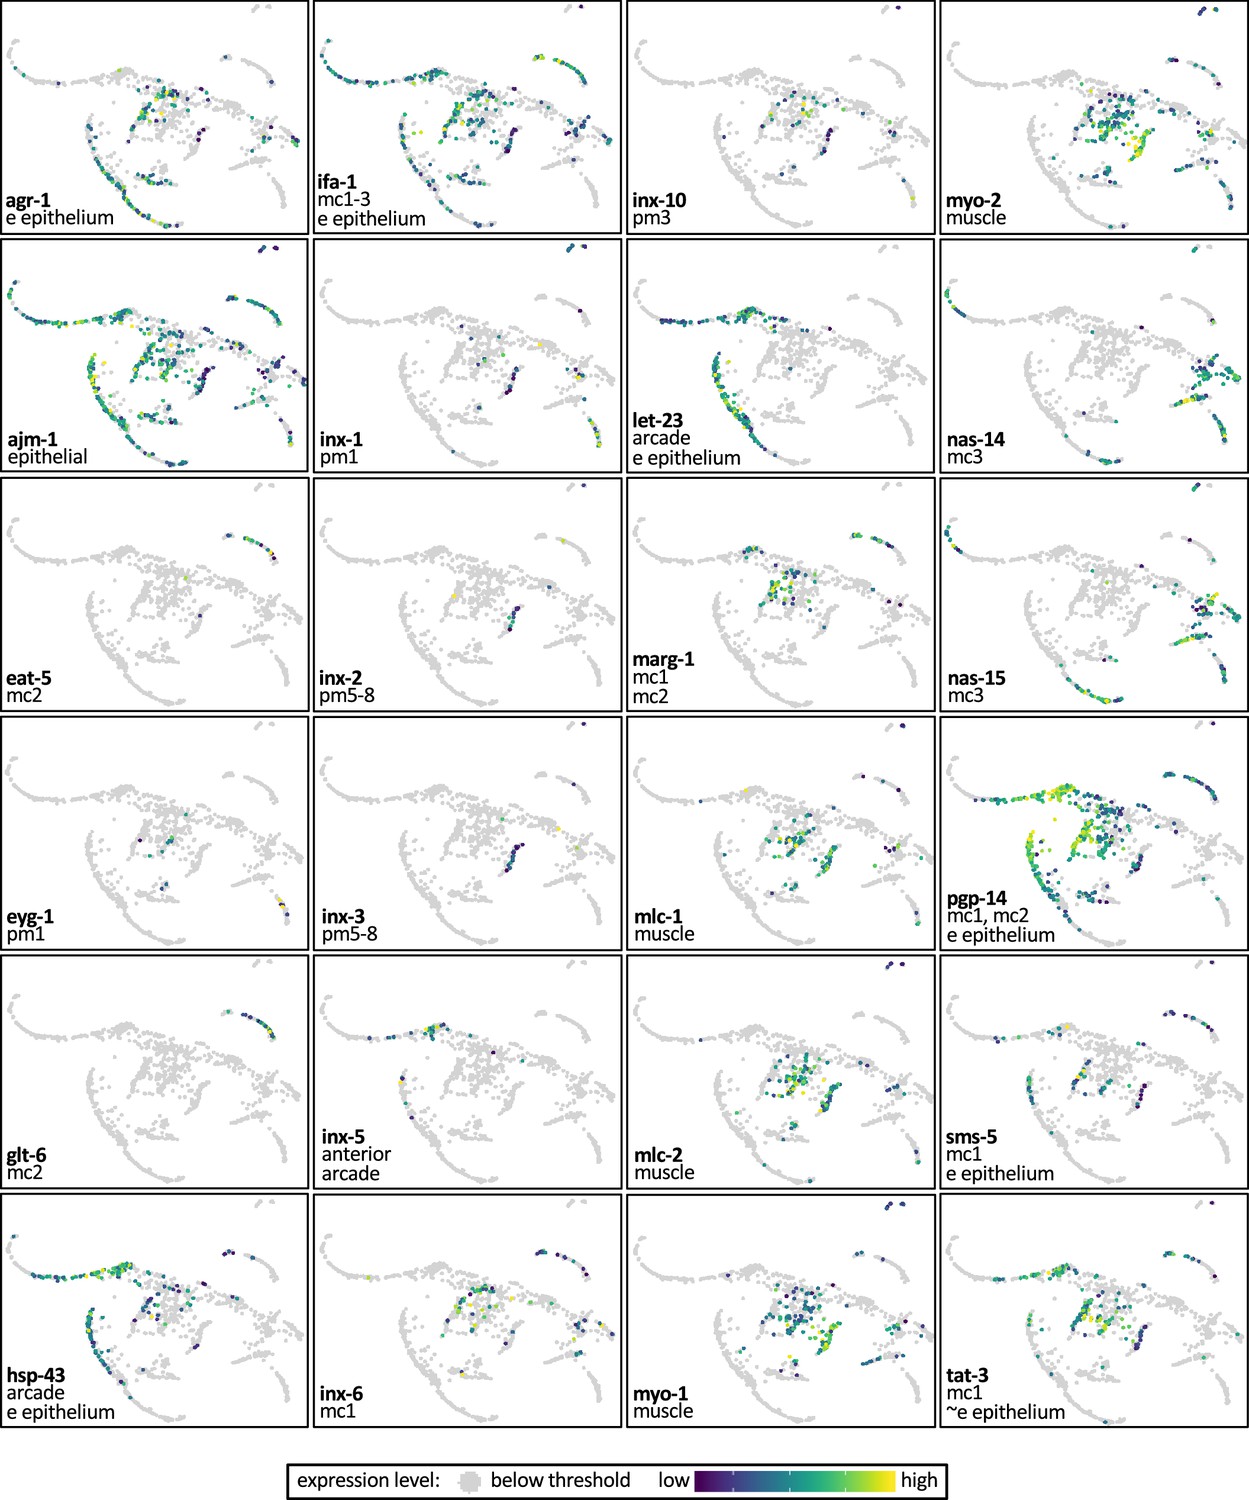
UMAP plots of the gold standard genes used to assign identity to the pharynx UMAP reference cluster.
The UMAP plots of the genes listed in Figure 10—figure supplement 1 were extracted from the Packer et al. dataset (see https://cello.shinyapps.io/celegans_L2/) and show the published markers used to assign identity to the clusters. Genes are arranged alphabetically, and the cells in which GFP reporters serve as markers are indicated. For reasons of graphical clarity, the gland clusters are not shown.
Additional files
-
Supplementary file 1
Genes of special interest and evidence of pharynx expression.
Note that the data within this table is also available in the Figure 4—source data 1 file so as to put it in context with other data for each gene. Also note that the column indicators below are named after the column in Supplementary File 1. (C) All 78 gene products called out in Figure 4A are shown, along with all 226 genes represented in Figure 4A, in addition to 17 genes that are of special interest (including additional members of the idpp gene class referred to elsewhere in the text). (B) The APPGs that have higher sequence similarity to one another and have more similar temporal expression patterns are described as APPG family (#1) members to distinguish them from more divergent APPGs. (E) The Name Status indicates the 41 new WormBase-approved gene assignments. (H) The indicated hour and degree is with respect to Figure 4A. (J) In some cases, the updated Signal P algorithm will identify a signal peptide when ParaSite did not, as indicated with a ‘no, but likley SS.’ (L) The spatial expression patterns of the indicated clones can be inspected at http://nematode.lab.nig.ac.jp/dbest/srchbyclone.html. A green color indicates confirmation of the expected expression pattern (enriched in pharynx); ‘no signal’ indicates little to no signal anywhere in photo micrographs. In two cases indicated in pink, signal could be observed in the animal, but the pharynx lacked signal. (M, N) The PubMed ID number (PMID) is shown for the publication that provides additional spatial expression information for the gene. The nature of the data is either from a transgene (transg), an antibody (Ab), or is sequence-based (seq). A green color indicates confirmation of the expected expression pattern (enriched in pharynx).
- https://cdn.elifesciences.org/articles/79396/elife-79396-supp1-v2.xlsx
-
Supplementary file 2
Transcript levels of six low-complexity protein families within pharynx cells.
The data is extracted from the data presented in Figure 10B.
- https://cdn.elifesciences.org/articles/79396/elife-79396-supp2-v2.xlsx
-
MDAR checklist
- https://cdn.elifesciences.org/articles/79396/elife-79396-mdarchecklist1-v2.pdf
Download links
A two-part list of links to download the article, or parts of the article, in various formats.
Downloads (link to download the article as PDF)
Open citations (links to open the citations from this article in various online reference manager services)
Cite this article (links to download the citations from this article in formats compatible with various reference manager tools)
A spatiotemporal reconstruction of the C. elegans pharyngeal cuticle reveals a structure rich in phase-separating proteins
eLife 11:e79396.
https://doi.org/10.7554/eLife.79396


