EZH2/hSULF1 axis mediates receptor tyrosine kinase signaling to shape cartilage tumor progression
- Graduate Institute of Biomedical Sciences, College of Medicine, China Medical University, Taiwan
- Center for Molecular Medicine, China Medical University Hospital, Taiwan
- Department of Biomedical Imaging and Radiological Science, College of Medicine, China Medical University, Taiwan
- Department and Graduate Institute of Aquaculture, National Kaohsiung Marine University, Taiwan
- Department of Biological Sciences, National Sun Yat-sen University, Taiwan
- Department of Biotechnology, Asia University, Taiwan
Figures
Figure 1
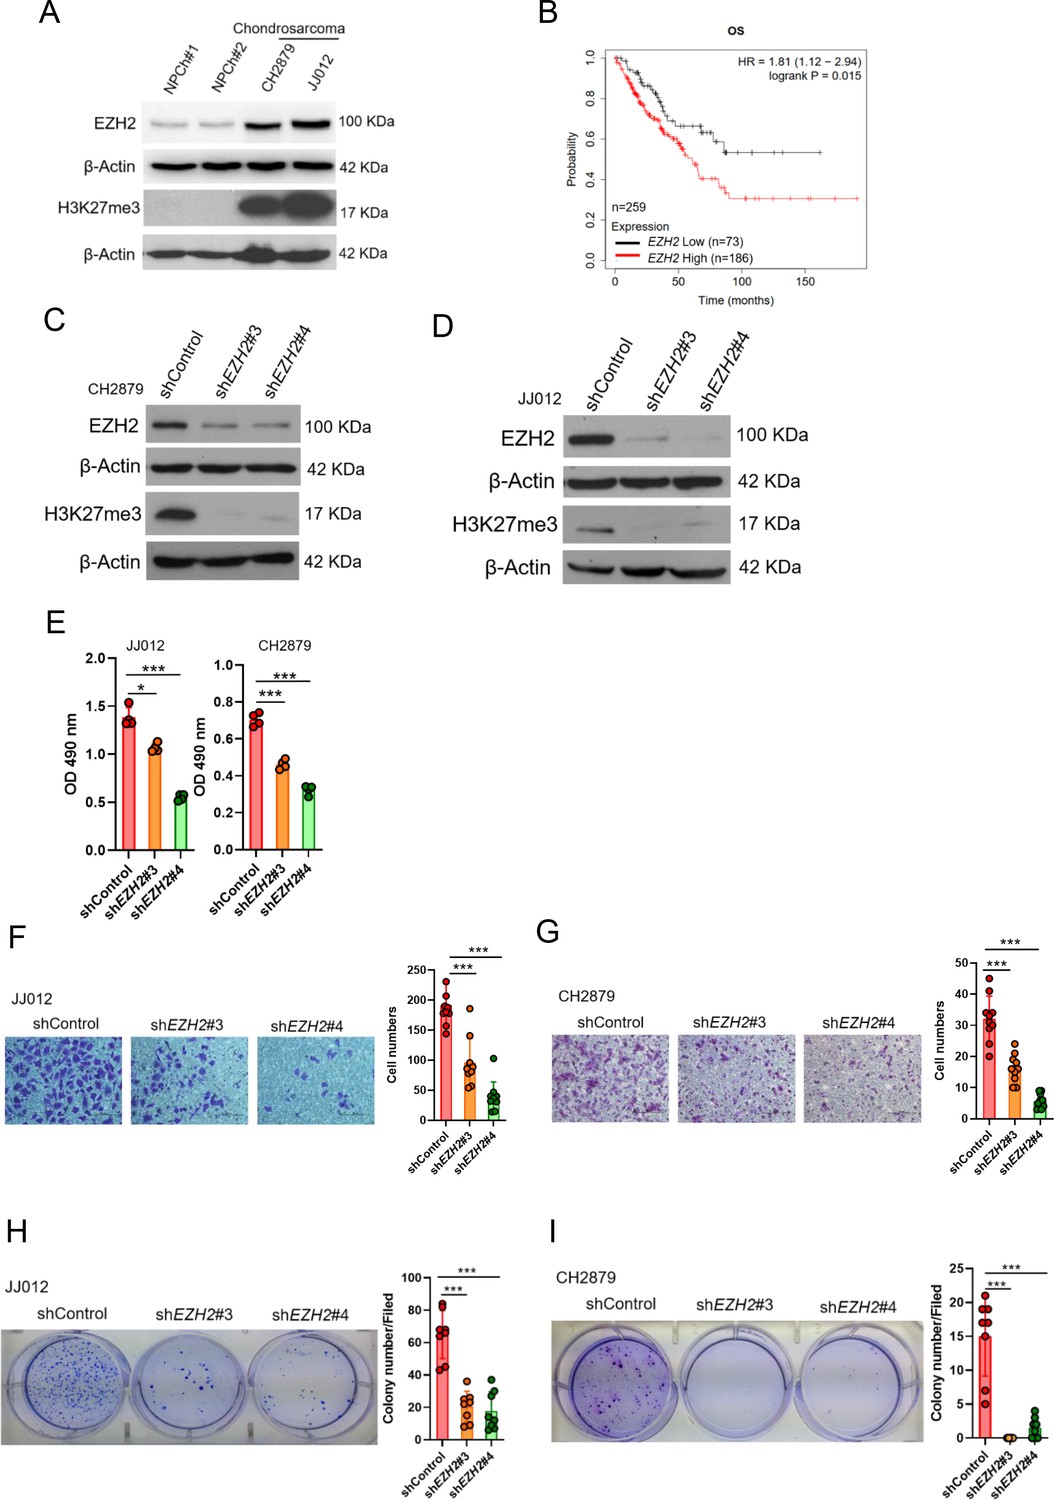
High EZH2 expression predicts poor clinical outcome in chondrosarcoma patients.
(A) Western blotting (WB) of EZH2 and H3K27me3 expression level in primary chondrocytes and chondrosarcoma cell lines. NPC, normal primary chondrocytes. (B) Prognostic correlation of survival analyses of sarcoma (including chondrosarcoma) patients with high and low EZH2 level. OS, overall survival; HR, hazard ratio. WB of EZH2 and H3K27me3 expression level in CH2879 (C) and JJ012 (D) cell lines after knockdown (KD) of EZH2 by different EZH2 shRNA, respectively. (E) Proliferation of JJ012 and CH2879 cells was measured by MTS assay after depletion of EZH2. Migration assay of JJ012 (F) and CH2879 (G) cells was represented via using transwell while KD of EZH2. The quantification results were showed on the right panel. (H and I) Soft agar assay of JJ012 (H) and CH2879 (I) cells with control or various shEZH2 was conducted. The quantification results were represented on the right panel. Error bars represent mean ± SD (E, F, G, H, and I). *p<0.05, **p<0.01, ***p<0.001, and two-tailed unpaired t test (E, F, G, H, and I).
Figure 2 with 1 supplement

SULF1 is the downstream targeted of EZH2 and repressed in chondrosarcoma cell lines.
(A) cDNA microarray analysis was performed and compared between primary normal chondrocyte and JJ012 chondrosarcoma cell lines. Dysregulated genes were selected based on the criteria of 10-fold change. EZH2 chromatin immunoprecipitation sequencing (ChIP-seq) was conducted in JJ012 chondrosarcoma cell line. Venn diagram showing the overlap between genes (n=40) differentially dysregulated from cDNA microarray in chondrosarcoma cells compared to normal chondrocyte (n=6761) and genes targeted by EZH2 from EZH2 ChIP-seq in chondrosarcoma (n=704). (B) Quantitative chromatin immunoprecipitation (qChIP) assay of SULF1 promoter was performed in JJ012 and CH2879 cells by using indicated antibodies. (C) Quantitative RT-PCR analysis of SULF1 mRNA expression in normal chondrocyte, JJ012 and CH2879 cell lines. (C) EZH2 ChIP assay was performed in JJ012 and CH2879 cell lines using antibody against EZH2 or negative IgG control and analyzed by quantitative PCR. (D) Western blotting (WB) of SULF1 expression in normal chondrocytes and chondrosarcoma cells. WB of indicated protein in JJ012 (E) and CH2879 (F) cells harboring control or EZH2 shRNA. (G) Prognostic correlation of survival analyses of sarcoma patients with high and low SULF1 levels. OS, overall survival; HR, hazard ratio.
Figure 2—figure supplement 1
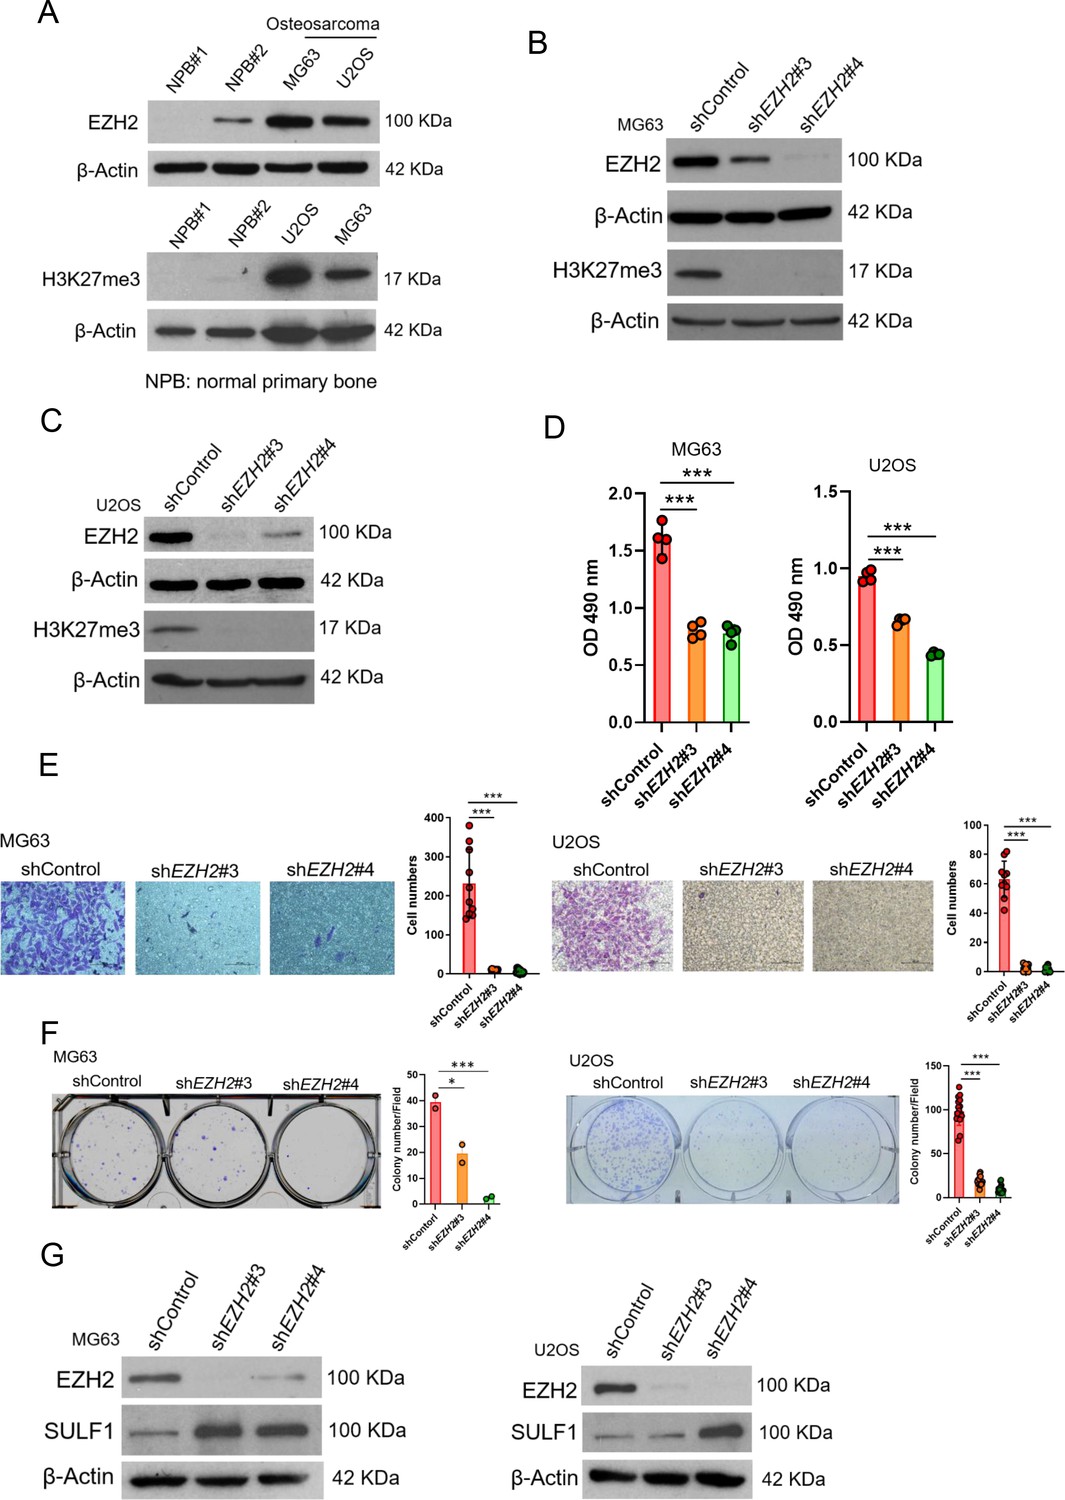
The regulation of EZH2/SULF1axis is also exhibited in osteosarcoma.
(A) Western blotting (WB) of EZH2 and H3K27me3 expression level in primary bone cells and osteosarcoma cell lines.
NPB, normal primary bone cells. WB of EZH2 and H3K27me3 expression level in MG63 (B) and U2OS (C) cell lines after knockdown (KD) of EZH2 by distinct EZH2 shRNA, respectively. (D) Proliferation of MG63 and U2OS cells was explored by MTS assay after depletion of EZH2. (E) Migration assay of MG63 and U2OS cells were represented via using transwell while KD of EZH2. The quantification results were showed on the right panel. (F) Colony formation assay of MG63 and U2OS cells with control or various shEZH2 was conducted. The quantification results were represented on the right panel. (G) WB analysis of indicated protein in MG63 and U2OS cells harboring control or EZH2 shRNA. Error bars represent mean ± SD (D, E, and F). *p<0.05, **p<0.01, ***p<0.001, and two-tailed unpaired t test (D, E, and F).
Figure 3 with 1 supplement
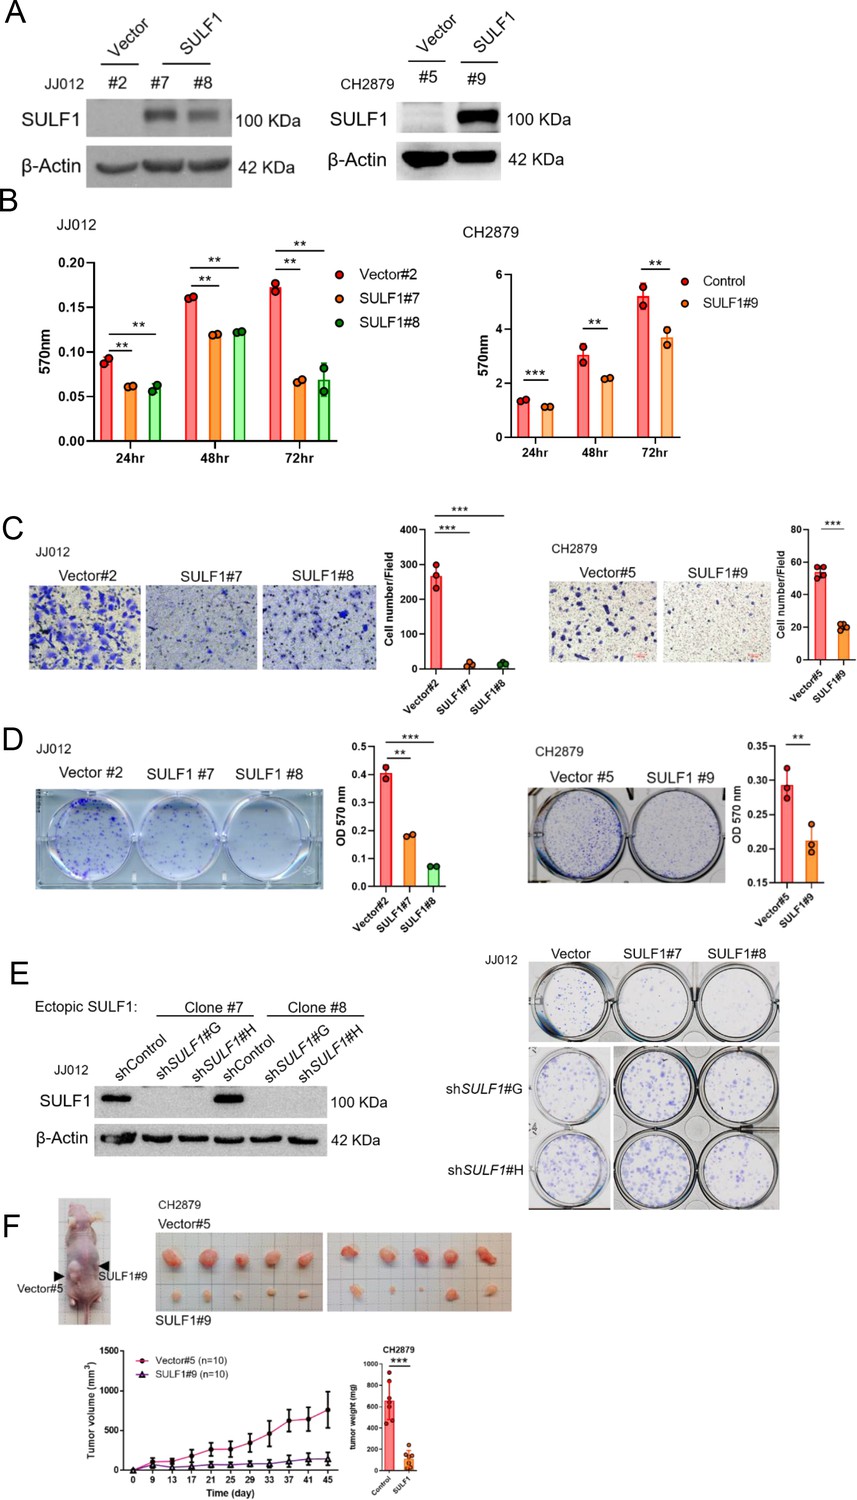
Ectopic expressed SULF1 attenuates tumorigenicity of chondrosarcoma.
(A) Western blotting (WB) of SULF1 and vector control stable transfectants with SULF1 and β-actin antibodies. (B) MTT assay of JJ012 and CH2879 with SULF1 stable cell lines were performed in the indicated time point. (C) Quantification of migrated SULF1 stable cell lines of JJ012 (represented images, n=3) and CH2879 (represented images, n=4). (D) Quantification of colony forming assay of SULF1 stable cell lines including JJ012 (represented images, n=2) and CH2879 (represented images, n=3). (E) WB of ectopic expressed SULF1 stable cell line expressing indicated shRNA in left panel. Colony formation assay of SULF1 stable cell lines with indicated SULF1 shRNA in the right panel. (F) BALB/c nude mice were subcutaneously injected vector (n=10) or SULF1 (n=10) stable cell lines, and tumor volume was showed at the indicated days after transplantation. Error bars represent mean ± SD (B, C, D, and F). *p<0.05, **p<0.01, ***p<0.001, and two-tailed unpaired t test (B, C, D, and F).
Figure 3—figure supplement 1
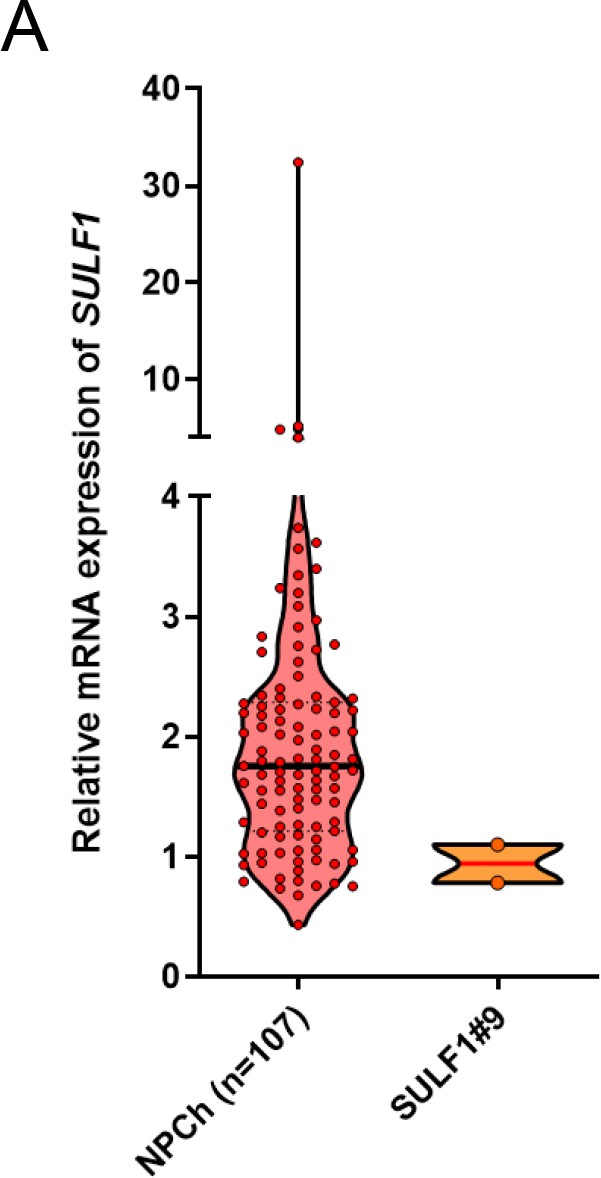
Quantitative RT-PCR analysis of SULF1 transcript in primary chondrocytes (n=107) and SULF1 stable transfectants.
Error bars represent mean ± SD. Violin plot represent the expression level of SULF1 in normal chondrocytes and ectopic expression of SULF1 in CH2879 cells.
Figure 4 with 1 supplement
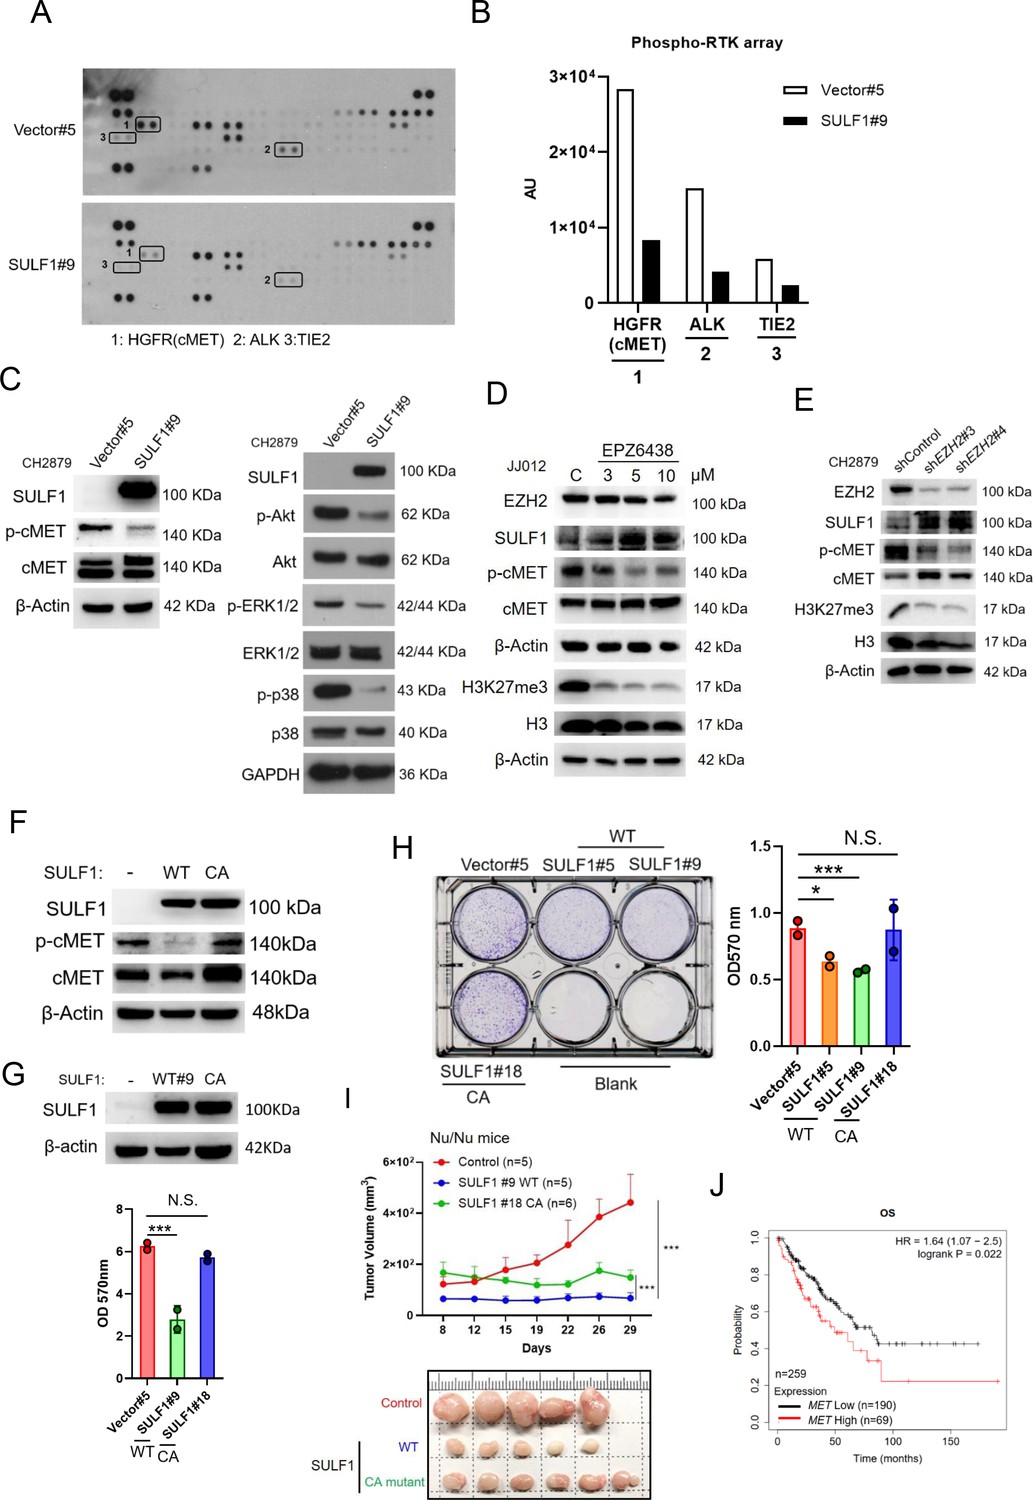
SULF1 mediates cMET signaling and is required its enzymatic activity.
(A) Human phosphor-RTK array analysis of CH2879 vector control and SULF1 stable cell line. Three pairs of positive signals in duplicate coordinates (vector compare to stable cell line) are shown in HGFR (C3/C4), ALK (E13/E14) and Tie-2 (D1/D2). (B) The quantification was represented, and the signals were detected by ImageJ. AU: arbitrary unit. (C) Western blotting (WB) of SULF1, phosphorylation of cMET and cMET expression in CH2879 vector and SULF1 stable cell line (left). The RTK downstream protein expression by western blot analysis (right). (D) WB of EZH2, H3K27me3, histone3, phosphorylation of cMET and MET expression in JJ012 treated with EPZ-6438. (E) WB of EZH2, phosphorylation of cMET and MET expression in CH2879 in depletion of EZH2. (F) WB of phosphorylation level of cMET in SULF1 wild type (WT) and enzymatic inactive mutant (CA) stable cell lines. (G) Top, WB of SULF1 expression level in WT SULF1 and mutant (CA) stable cell lines. Lower, MTT assay of WT and CA SULF1 stable transfectants. (H) Colony-forming assay of vector control, WT and CA SULF1 stable cell lines. Quantification data was showed in right panel. (I) BALB/c nude mice were subcutaneously inoculated stable cell lines with vector (n=5), WT SULF1(WT; n=5), and enzymatic inactive SULF1 (CA mutant; n=6), tumor growth was plotted at the indicated days after transplantation. Error bars represent mean ± SD. (J) Kaplan-Meier plot of overall survival of the patients stratified by high and low cMET level. Error bars represent mean ± SD (G, H, and I). *p<0.05, **p<0.01, ***p<0.001, and Two-tailed unpaired t test (E and F).
Figure 4—figure supplement 1
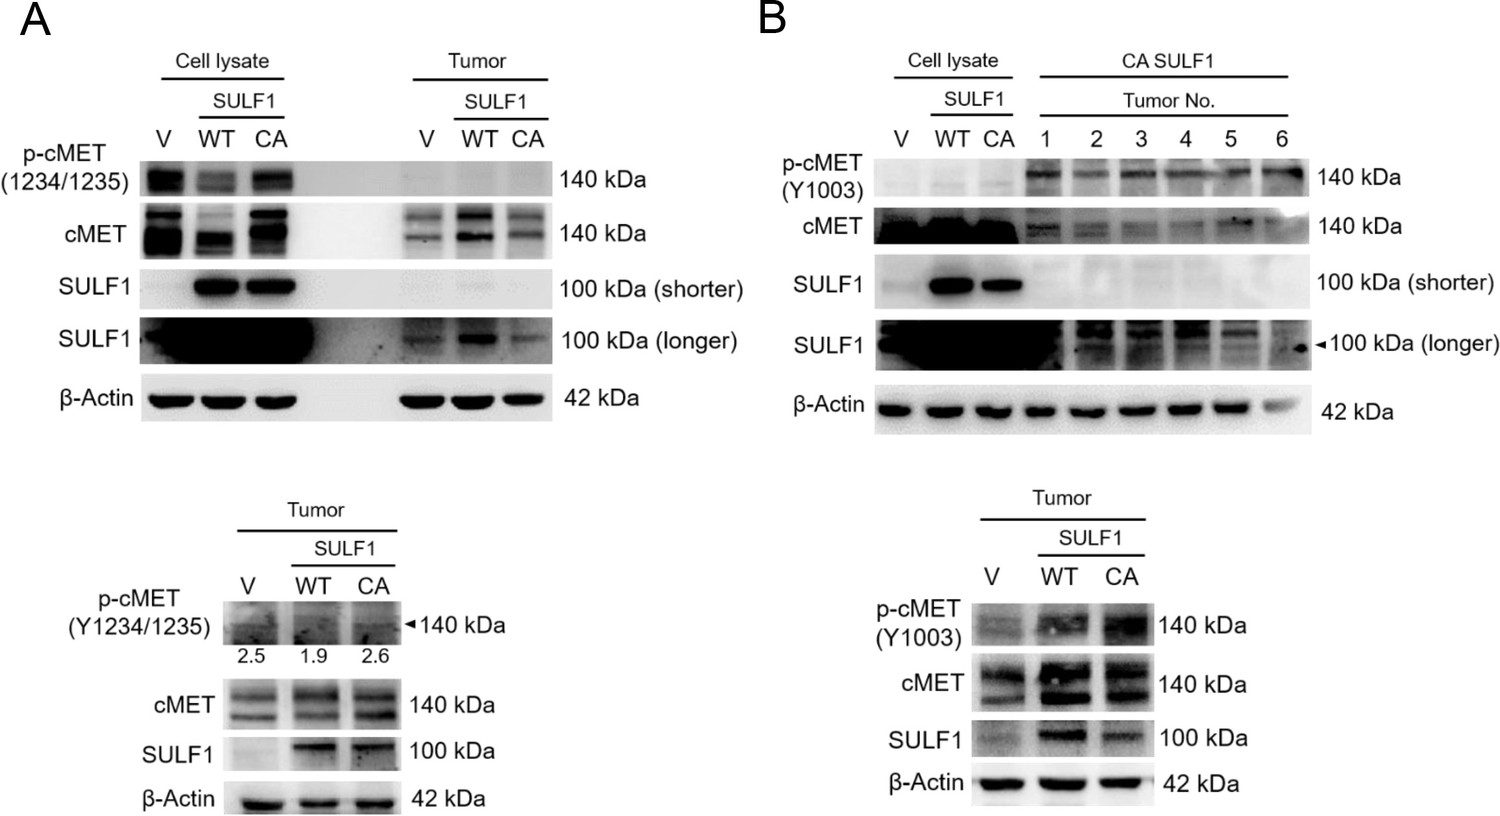
Phosphorylation of cMET at the indicated site in chondrosarcoma cell lines and tumors with stably expressed vector control, wild type (WT) SULF1, and CA mutant SULF1.
Figure 5 with 1 supplement
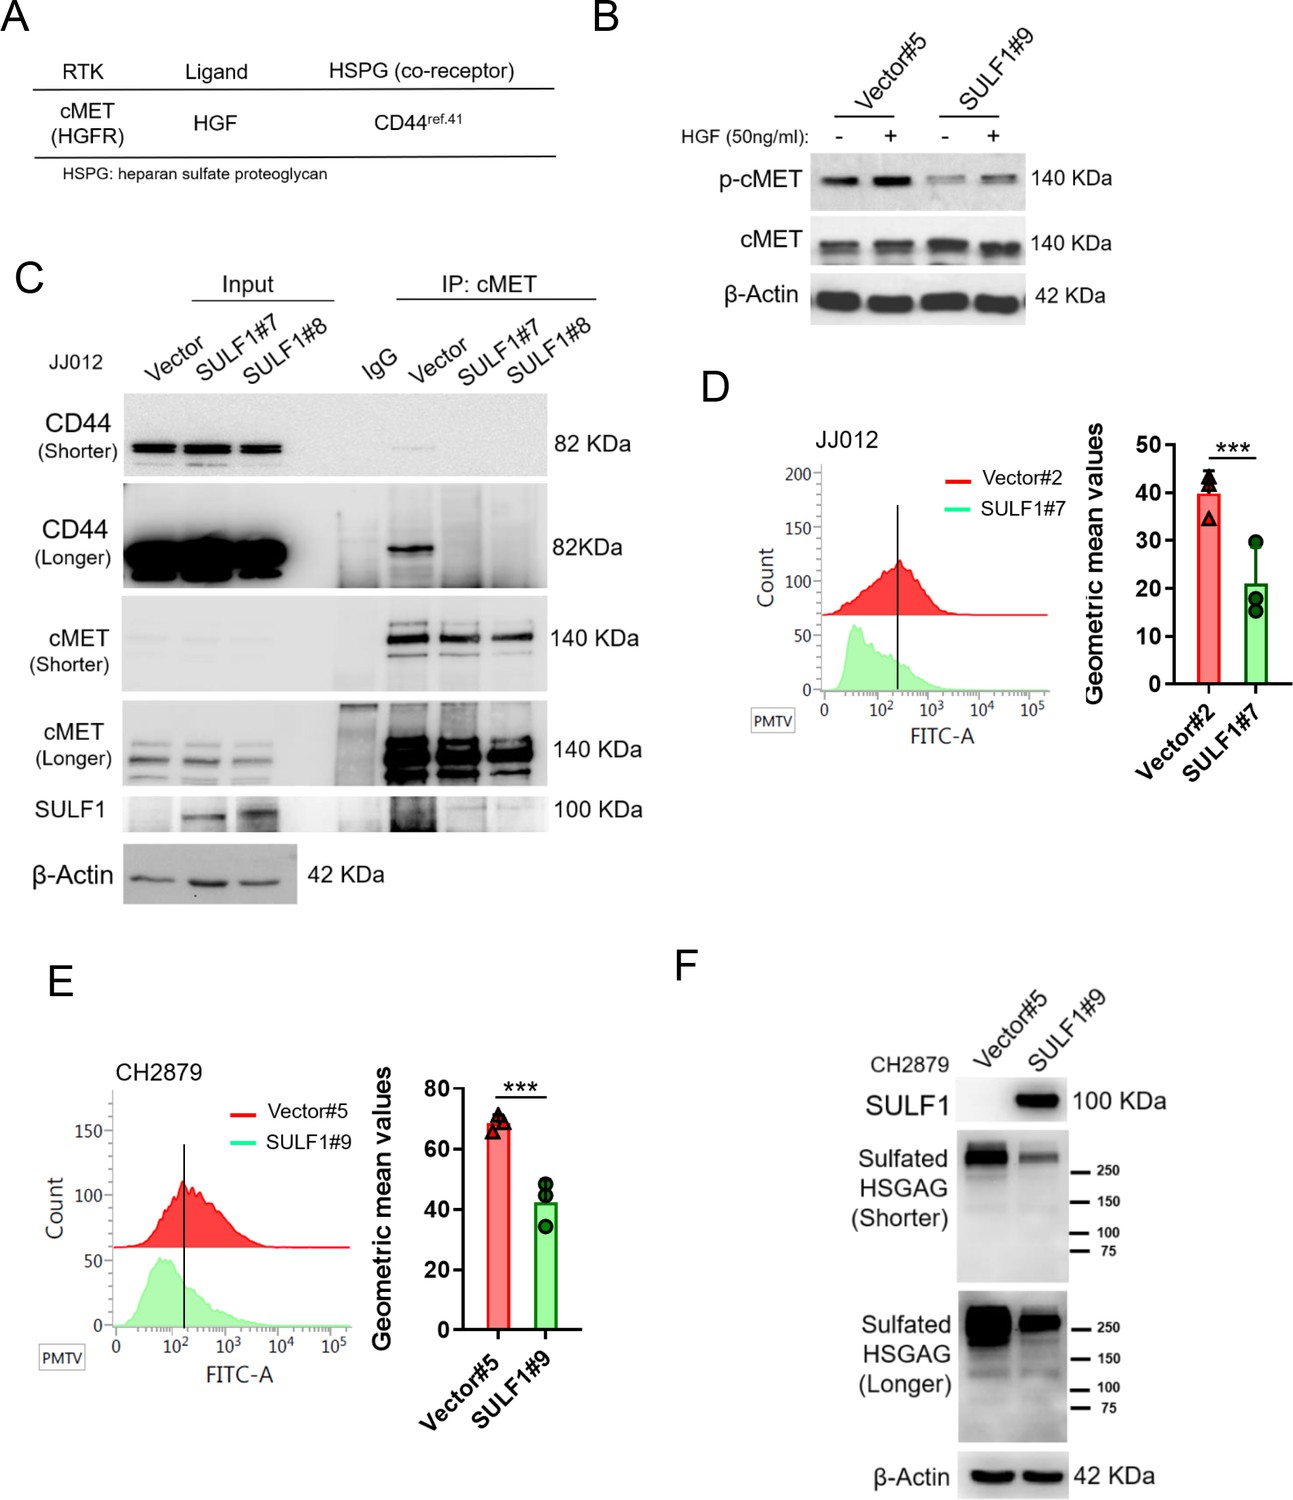
SULF1 reduces the interaction between cMET and its co-receptor, CD44, by removing the sulfate group of CD44.
(A) cMET and its putative co-receptor was showed in table. (B) Western blotting (WB) of phospho-cMET and cMET expression in generated vector and SULF1 stable transfectants treated with or without hepatocyte growth factor (HGF). (C) Immunoprecipitation (IP) assay with IgG or cMET antibodies of JJ012 cells ectopically expression SULF1 or vector control, followed by WB of indicated antibodies. Flow cytometry analysis of sulfated heparan sulfate glycosaminoglycan (HSGAG) by anti-HSGAG monoclonal antibody 10E4 on cell surface of JJ012 (D), and CH2879 (E) of the SULF1 stable clones and the counterparts. (F) WB of sulfated HSGAG in vector and SULF1 stable transfectants with 10E4 antibody. Error bars represent mean ± SD (D and E). *p<0.05, **p<0.01, ***p<0.001, and two-tailed unpaired t test (D and E).
Figure 5—figure supplement 1
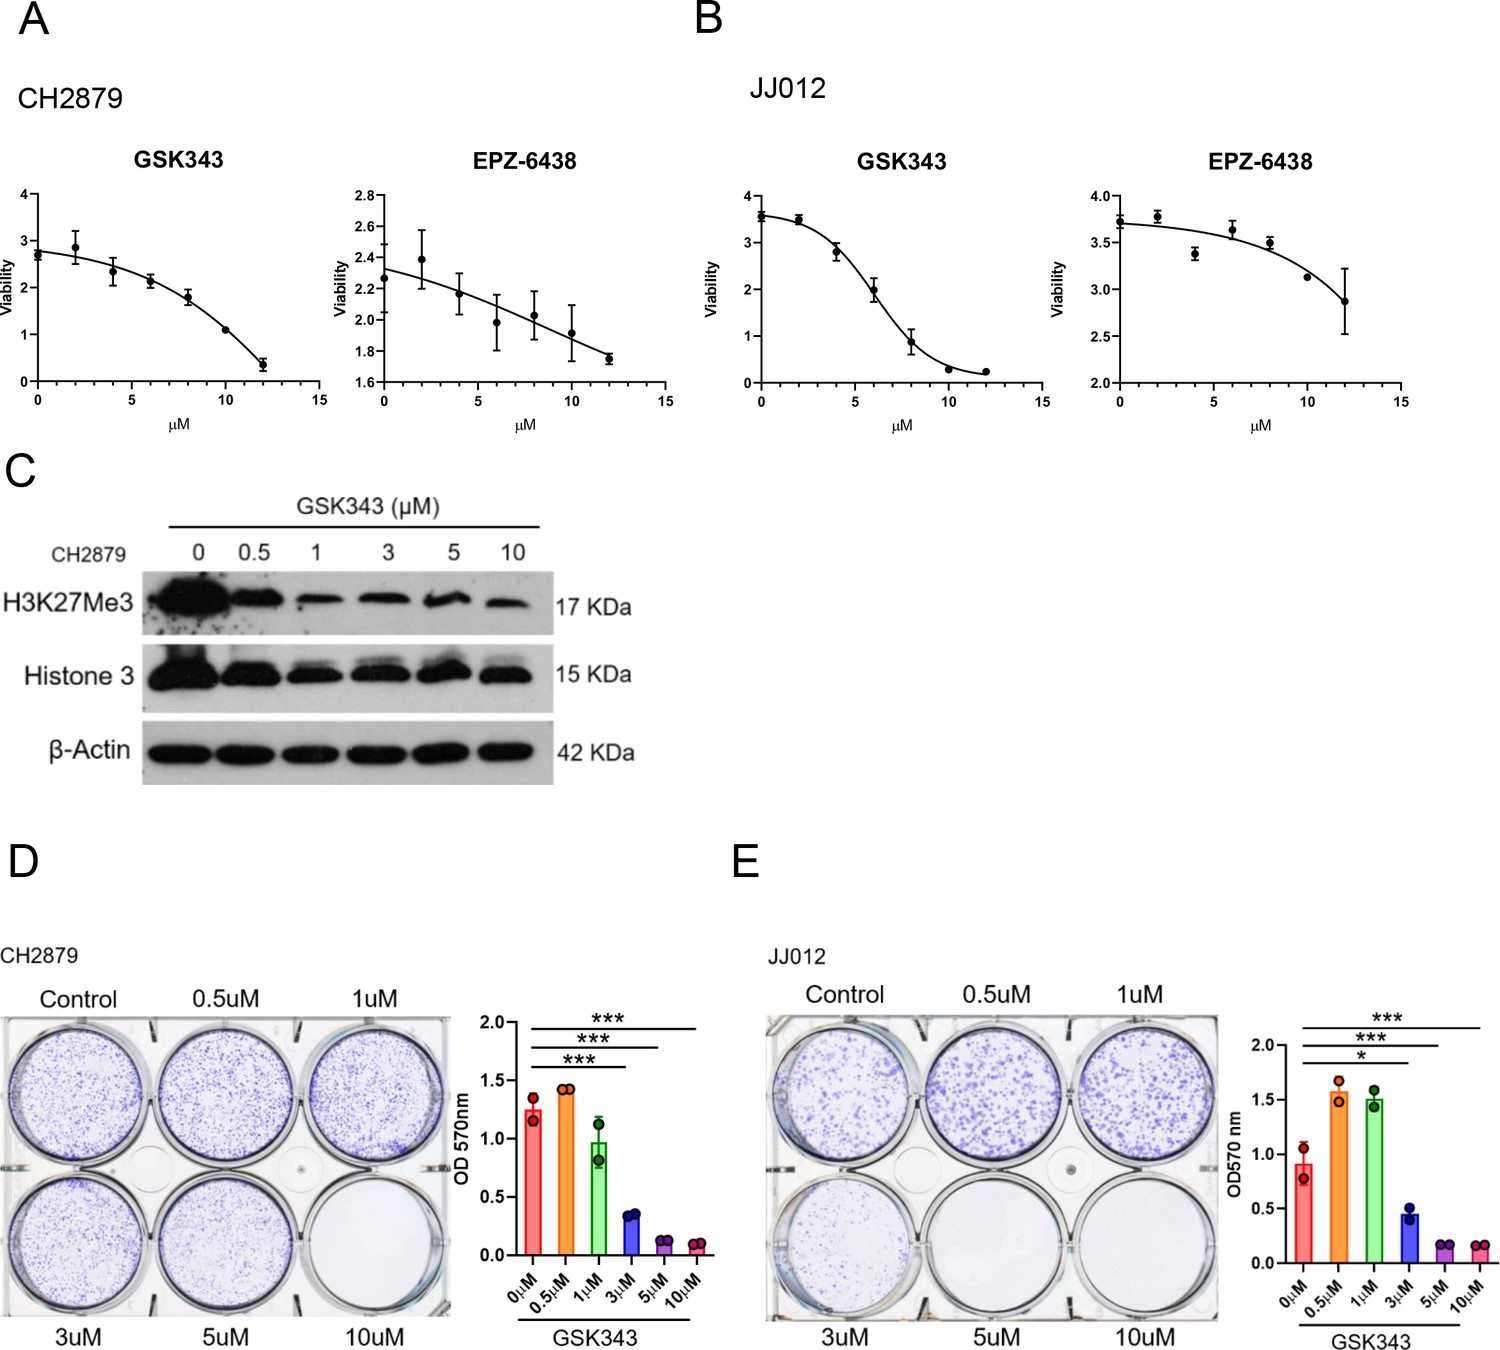
IC50 value of EZH2 inhibitors were examined by MTT assay in CH2879 cells (A), JJ012 cells (B).
(C) Western blotting (WB) of H3K27me3 and histone 3 in CH2879 cell lines treated with GSK343 at indicated dosage. (D and E) Quantitation of colony formation assay by CH2879 and JJ012 cells (represented images, n=2) cells under indicated dosage of GSK343. Error bars represent mean ± SD (D and E). *p<0.05, **p<0.01, ***p<0.001, and two-tailed unpaired t test (D and E).
Figure 6 with 1 supplement
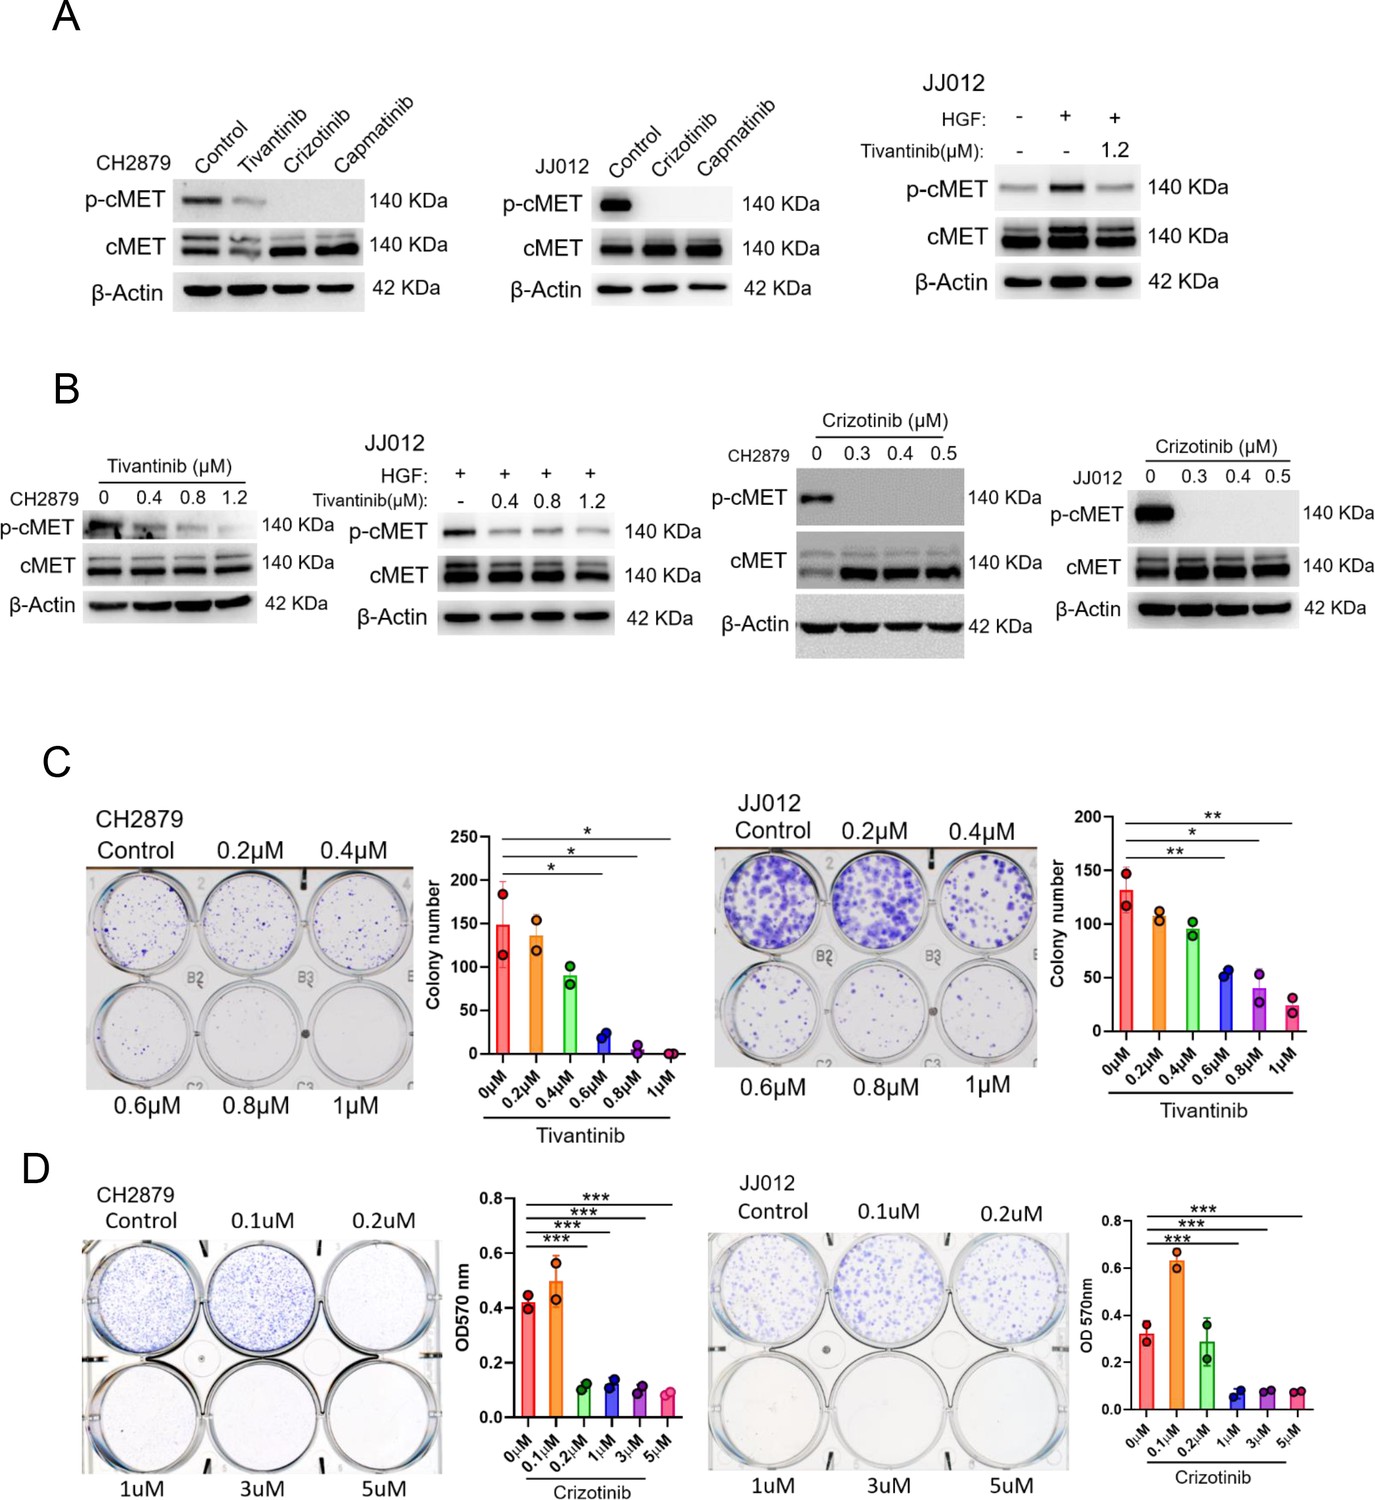
cMET inhibitors attenuate phosphorylation and colony-forming ability of chondrosarcoma cell lines.
(A and B) Western blotting (WB) of phospho-cMET and cMET in CH2879 and JJ012 cell lines treated with tivatinib, crizotinib, and capmatinib at indicated dosage. JJ012 cells were pre-treated with 50 ng/ml human recombinant hepatocyte growth factor (HGF) for 30 min before treated with tivantinib. (C and D) Colony formation assay of CH2879 and JJ012 cell lines with or without indicated inhibitors. Quantitation of colony formation assay by CH2879 (represented images, n=2), JJ012 (n=2) cells. Error bars represent mean ± SD (C and D). *p<0.05, **p<0.01, ***p<0.001, and two-tailed unpaired t test (C and D).
Figure 6—figure supplement 1
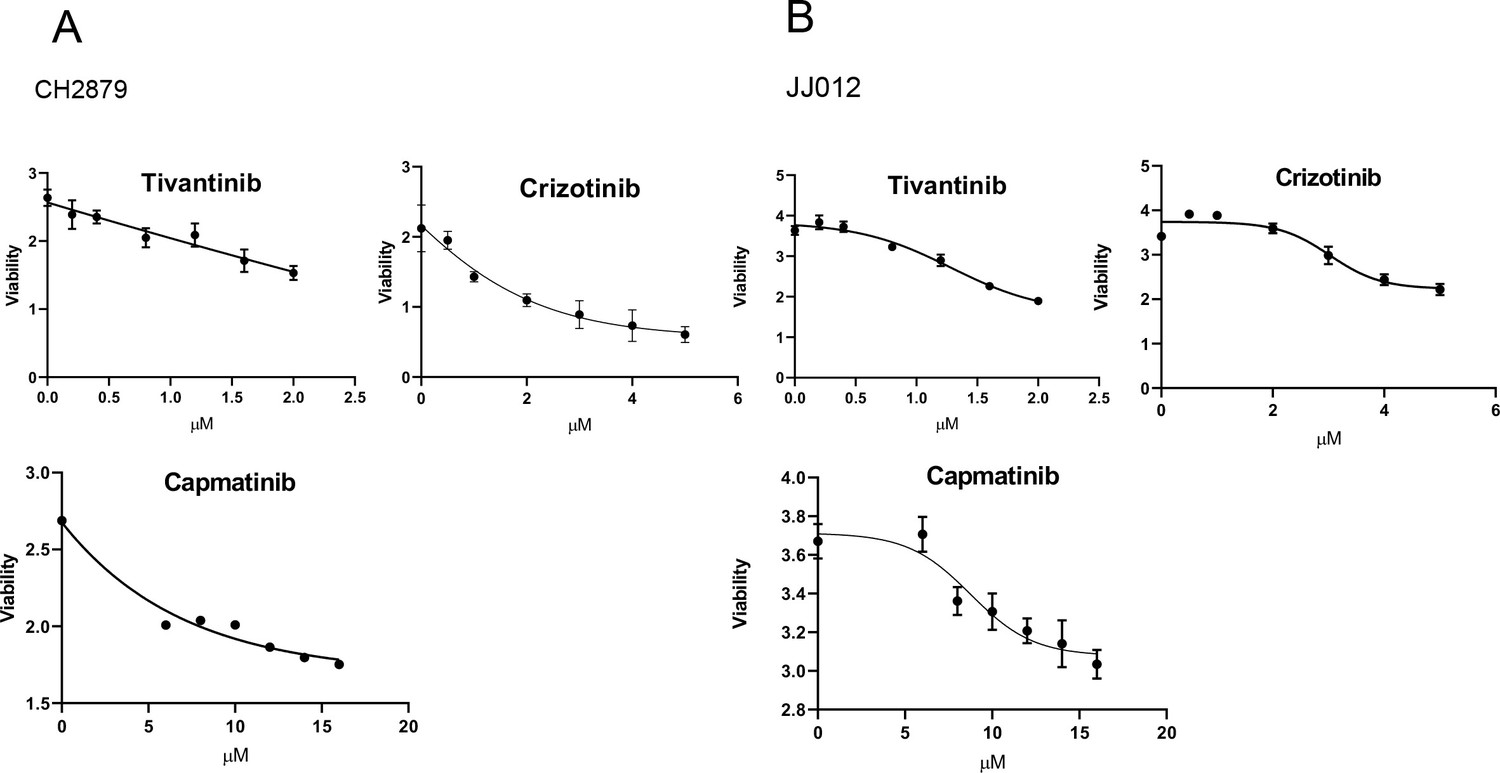
IC50 value of cMET inhibitors were examined by MTT assay in CH2879 cells (A), JJ012 cells (B).
Figure 7

cMET inhibitor decreases tumor growth and prolongs mice survival.
(A) Schematic illustration of treatment with crizotinib in orthotopic xenograft of CH2879 cells. (B) Mice were oral gavage with vehicle or crizotinib (n=5). Representative bioluminescent images of mice in following treatment at day 28. (C) Growth curves of tumors in immunodeficient mice (n=5) for days 7, 14, 21, and 28. (D) Curves of body weight of mice treat with or without crizotinib at indicated days. (E) Representative quantification and images of bioluminescent of mice in following treated with vehicle (n=7) or 0.15 mg/kg (n=7) for mice survival. (F) Western blot analysis for phosphor-cMET of tumors isolated from mice. (G) Survival curves for mice from E. Error bars represent mean ± SD (C and E). *p<0.05, **p<0.01, ***p<0.001, and two-tailed unpaired t test (C and E).
Figure 8 with 1 supplement

Pathological relevance of EZH2/SULF1/cMET axis in chondrosarcoma.
(A–C) The representative cases of immunohistochemistry (IHC) staining for EZH2, SULF, and phospho-cMET expression in human paraffin embedded chondrosarcoma tissue array. Quantification of IHC staining by H-score via Image Scope software. (D) A propose model of the regulation of EZH2/SULF1/cMET axis in chondrosarcoma. Briefly, SULF1 expression was suppressed by EZH2, consequently de-reduced the sulfation of CD44 through the downregulate of SULF1. This de-reduction of sulfate group increases the complex formation of HGF, cMET, and CD44, thereby enhancing and trigging the downstream signaling of cMET. Artwork by Y-C. L., Z-S.L., and Y-H. (C) was created with BioRender.com.
Figure 8—figure supplement 1
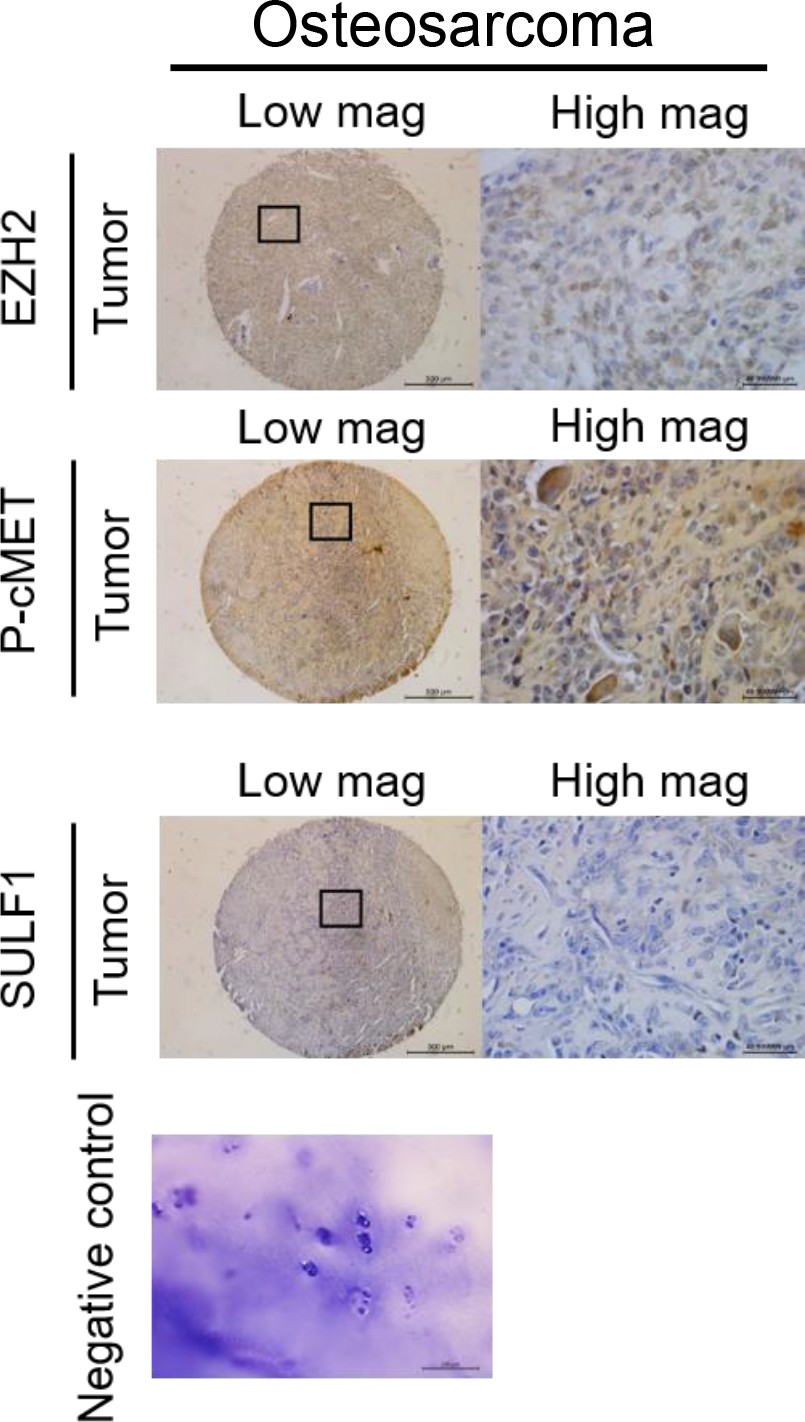
The representative cases of immunohistochemistry (IHC) staining for EZH2, SULF1, and phospho-cMET expression in human paraffin embedded osteosarcoma tissue array (n=31).
Tables
Appendix 1—key resources table
| Reagent type (species) or resource | Designation | Source or reference | Identifiers | Additional information |
|---|---|---|---|---|
| Cell line (Homo sapiens, chondrosarcoma) | JJ012 | Dr. JA Block (Rush University Medical Center, Chicago, IL, USA) | RRID: CVCL_D605 | |
| Cell line (Homo sapiens, chondrosarcoma) | CH2879 | Professor A Llombart Bosch (University of Valencia, Spain) | RRID: CVCL_9921 | |
| Cell line (Homo sapiens, osteosarcoma) | U2OS | From Dr. Jer-Yuh Liu | RRID:CVCL_0042 | |
| Cell line (Homo sapiens, osteosarcoma) | MG63 | From Dr, Shian-Ying Sung | RRID:CVCL_0426 | |
| Cell line | HEK293T | Academia Sinica, Taiwan | RRID: CVCL_0063 | For lentiviral production |
| Cell line | NP-Chon | From bone surgeon Dr.Teng-Le Huang | Detail information was in the supplement file | Isolated from clinical tissue sample |
| Biological sample | Cartilage tissue | From bone surgeon Dr.Teng-Le Huang | Detail information was in the supplement file | Isolated from clinical tissue sample |
| Strain and strain background | DH5α | This paper | Competent cell for construction | |
| Strain and strain background | Lentivirus | Academia Sinica, Taiwan | For shRNA transfection | |
| Strain and strain background | NU/NU (Crl:NU-Foxn1nu)/female | BioLASCO | For animal study | |
| Transfected construct (human) | shEZH2#3 | Academia Sinica, Taiwan | TRCN0000040076 | Lentiviral construct to transfect and express the shRNA. |
| Transfected construct (human) | shEZH2#4 | Academia Sinica, Taiwan | TRCN0000010475 | Lentiviral construct to transfect and express the shRNA. |
| Transfected construct (human) | shSULF1#7 | Academia Sinica, Taiwan | TRCN0000373658 | Lentiviral construct to transfect and express the shRNA. |
| Transfected construct (human) | shSULF1#8 | Academia Sinica, Taiwan | TRCN0000373588 | Lentiviral construct to transfect and express the shRNA. |
| Transfected construct (human) | pcDNA3.1(-)-Luc | This paper | Transfected construct for luciferase expression (human) | |
| Transfected construct (human) | pcDNA3.1(-)-SULF1 WT | This paper | Transfected construct for WT SULF1 expression (human) | |
| Transfected construct (human) | pcDNA3.1(-)-SULF1 CA | This paper | Transfected construct for enzyme inactivated SULF1 expression (human) | |
| Antibody | ß-Actin | Santa Cruz Biotechnology (mouse monoclonal) | sc-47778 RRID:AB_626632 | WB 1:10000 |
| Antibody | pAKT | Cell Signaling Technology (rabbit polyclonal) | sc-7985-R RRID:AB_2861344 | WB 1:1000 |
| Antibody | AKT | Cell Signaling Technology (rabbit polyclonal) | #9272 RRID:AB_329827 | WB 1:1000 |
| Antibody | pCMET | Cell Signaling Technology (rabbit polyclonal) | #3077 RRID:AB_2143884 | IHC: 1:100 WB 1:1000 |
| Antibody | pCMET | ABclonal (rabbit polyclonal) | AP0533 RRID:AB_2771334 | WB 1:1000 |
| Antibody | CMET | Cell Signaling Technology (rabbit polyclonal) | #8198 RRID:AB_10858224 | WB 1:1000 |
| Antibody | CD44v6 | R&D systems Technology (mouse monoclonal) | BBA13 RRID:AB_356935 | WB 1:1000 |
| Antibody | pERK 1/2 | Genetex Biotechnology (rabbit polyclonal) Cell Signaling Technology (rabbit polyclonal) | GTX59568 RRID:AB_10731702 #9101 RRID:AB_331563 | WB 1:1000 |
| Antibody | ERK 1/2 | Cell Signaling Technology (rabbit monoclonal) | #4695 RRID:AB_390779 | WB 1:1000 |
| Antibody | H3K27me3 | Cell Signaling Technology (rabbit polyclonal) Abcam (mouse monoclonal) | #9733 RRID:AB_2616029 ab6002 RRID:AB_305237 | WB 1:1000 |
| Antibody | Histone 3 | Genetex Biotechnology (rabbit polyclonal) Cell Signaling Technology (rabbit polyclonal) | GTX122148 RRID:AB_10633308 #9715 RRID:AB_331563 | WB 1:1000 |
| Antibody | pP38 | Cell Signaling Technology (rabbit polyclonal) | #9211 RRID:AB_331641 | WB 1:1000 |
| Antibody | P38 | Santa Cruz Biotechnology (rabbit polyclonal) | sc-7149 RRID:AB_653716 | WB 1:1000 |
| Antibody | SULF1 | Abcam (rabbit polyclonal) | ab327 RRID:AB_882749 63 | IHC: 1:100 WB 1:1000 |
| Antibody | EZH2 | Cell Signaling Technology (rabbit polyclonal) | #3147 RRID:AB_10694383, #5246 RRID:AB_10694683 | IHC: 1:100 WB 1:1000 |
| Antibody | 10E4 | Amsbio (mouse monoclonal) | #370255 S RRID:AB_10891554 | WB 1:1000 |
| Antibody | Secondary antibody-HRP conjugated | Bioss antibodies (Goat polyclonal) | BS-0368G-HRP RRID:AB_10890902 | WB 1:5000 |
| Antibody | Secondary antibody-HRP conjugated | Mouse IgG antibody (HRP) (Rabbit polyclonal) | GTX213112-01 RRID:AB_10617557 | 1:5000 |
| Antibody | Secondary antibody-HRP conjugated | Rabbit IgG antibody (HRP) (Goat polyclonal) | GTX213110-01 RRID:AB_10618573 | 1:4000 |
| Sequence-based reagent | EZH2-q-F | This paper | qPCR-Primers | 5'-CAGTTCGTGCCCTTGTGTGA-3' |
| Sequence-based reagent | EZH2-q-R | This paper | qPCR-Primers | 5'-GCACTGCTTGGTGTTGCACT-3' |
| Sequence-based reagent | SULF1-q-F | This paper | qPCR-Primers | 5’CAAGGAGGCTGCTCAGGAAG3’ |
| Sequence-based reagent | SULF1-q-R | This paper | qPCR-Primers | 5’CATGCGTGAAGCAAGTGAGG3’ |
| Sequence-based reagent | q-ChIP-SULF1-F-P | This paper | qPCR-Primers | 5’CGCATGCGGAATGACAACAG3’ |
| Sequence-based reagent | q-ChIP-SULF1-R-P | This paper | qPCR-Primers | 5’CTCAGTTCAAATCCCGCCTC3’ |
| Chemical compound and drug | Capmatinib | Selleckchem | INCB28060 | For pCMET inhibition |
| Chemical compound and drug | Crizotinib | Sigma | PZ0191 | For pCMET inhibition |
| Chemical compound and drug | EPZ-6438 | MCE | HY-13803 | For EZH2 enzyme activity inhibition |
| Chemical compound and drug | GSK343 | Sigma | SML0766 | For EZH2 enzyme activity inhibition |
| Chemical compound and drug | G418 (Geneticin) | InvivoGen | Anti-gn-1 | For stable cell line selection |
| Chemical compound and drug | Tivantinib | Selleckchem | S2753 | For pCMET inhibition |
| Commercial assay and kit | Human RTK array | R&D Systems | ARY001B | For human RTK receptor detection |
| Commercial assay and kit | MTS | Promega | RG3580 | For cell proliferation detection |
| Commercial assay and kit | MTT | InvivoGen | M6494 | For cell proliferation detection |
| Commercial assay and kit | SYBR green | Roche | KK4600 | For mRNA detection |
| Commercial assay and kit | Antigen retrieval solution | Abcam | ab970 | For antigen retrieval |
| Commercial assay and kit | Lipofectamine | Invitrogen | 11668019 | |
| Commercial assay and kit | TransITR-2020 | Mirus | MS-MIR5400 | |
| Commercial assay and kit | Jet PRIME | Polyplus | PO-114–15 | |
| Software | Image Lab | Bio-Rad Laboratories | RRID:SCR_014210 | For WB image analysis |
| Software | BD FACSuite v1.0.6 | BD bioscience | For FACS analysis | |
| Software | IVIS Spectrum In Vivo Imaging System | PerkinElmer | For in vivo tumour analysis | |
| Software and algorithm | PRISM | GraphPad Software | RRID:SCR_002798 | For survival analysis and bargraph |
| Software and algorithm | Image scope | Leica | For IHC H score quantification | |
| Other | Bone cancer tissue array | US Biomax | B0481 | Chondrosarcoma IHC staining |
| Other | Bone cancer tissue array | US Biomax | B0481a | Chondrosarcoma IHC staining |
| Other | Normal cartilage tissue array | From bone surgeon Dr.Teng-Le Huang | Primary cartilage tissue IHC staining |
Additional files
Download links
A two-part list of links to download the article, or parts of the article, in various formats.
Downloads (link to download the article as PDF)
Open citations (links to open the citations from this article in various online reference manager services)
Cite this article (links to download the citations from this article in formats compatible with various reference manager tools)
EZH2/hSULF1 axis mediates receptor tyrosine kinase signaling to shape cartilage tumor progression
eLife 12:e79432.
https://doi.org/10.7554/eLife.79432


