Phorbolester-activated Munc13-1 and ubMunc13-2 exert opposing effects on dense-core vesicle secretion
- Department of Neuroscience, University of Copenhagen, Denmark
- Department of Molecular Neurobiology, Max-Planck-Institute for Multidisciplinary Sciences, Germany
- Leibniz-Forschungsinstitut für Molekulare Pharmakologie (FMP), Germany
Figures
Figure 1
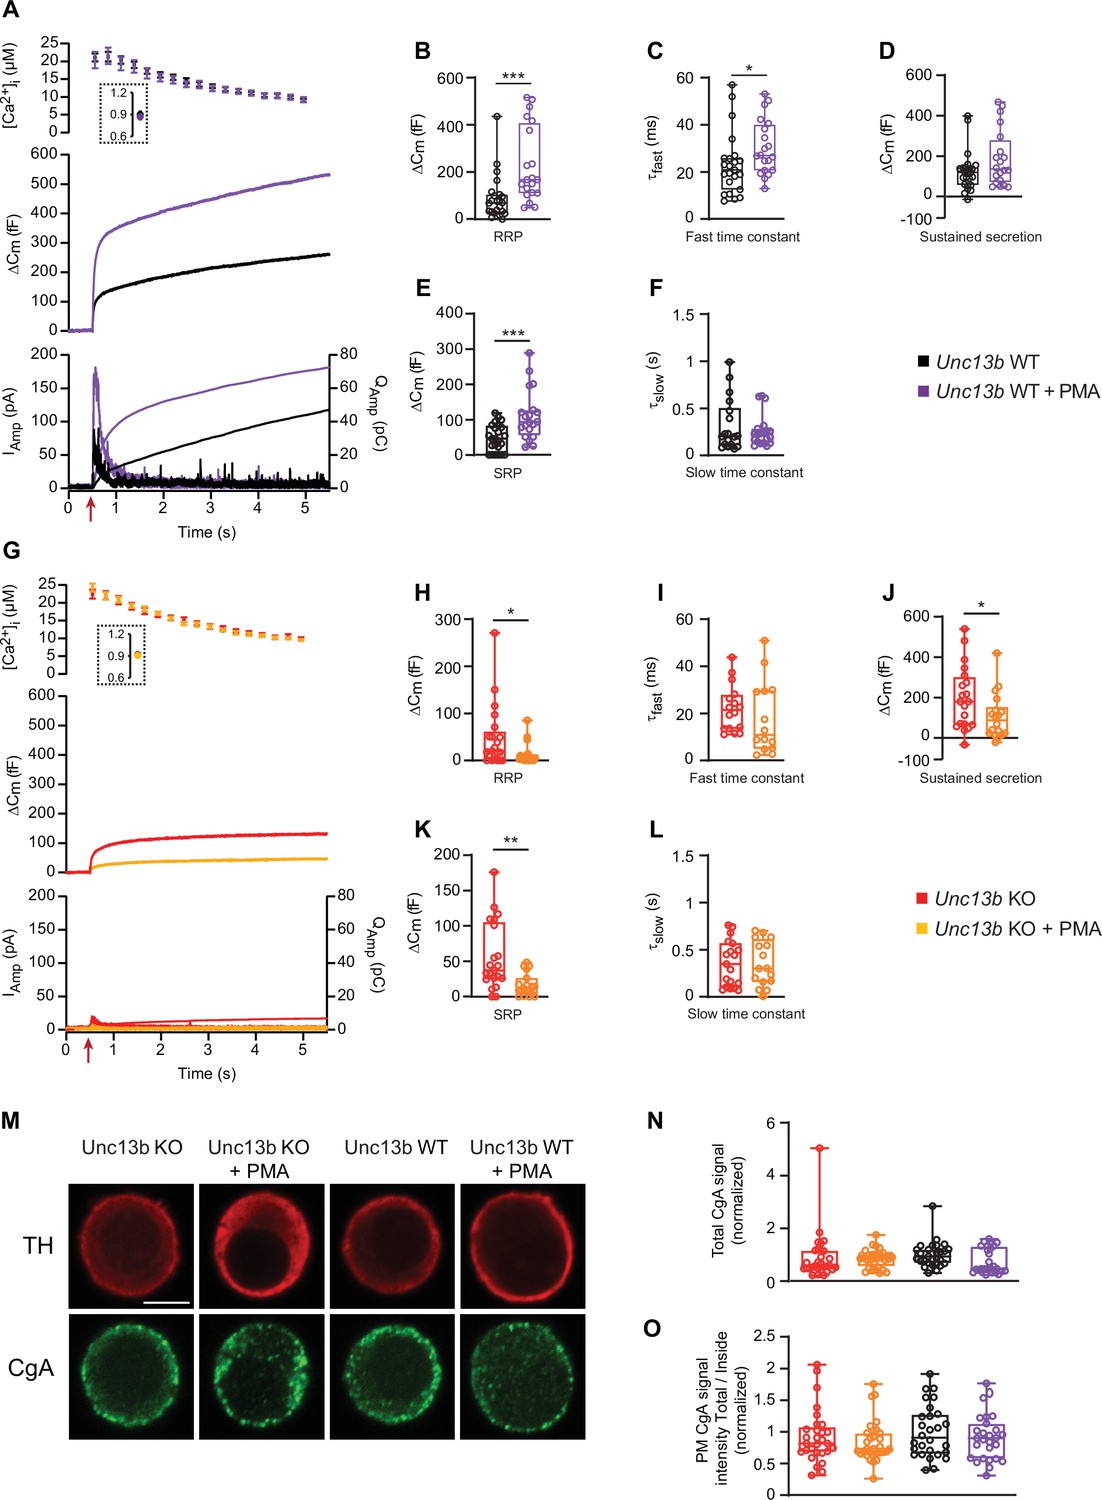
In the absence of Munc13-2, phorbolesters are inhibitory for dense-core vesicle secretion.
(A) Calcium uncaging experiment in Unc13b WT chromaffin cells from newborn mice (P0–P2) in the absence and presence of PMA (Black and purple traces). Top panel: [Ca2+] before (insert) and after calcium uncaging (uncaging flash at red arrow, bottom panel). Middle panel: capacitance traces (mean of all cells) show that PMA treatment potentiates secretion in WT cells (higher amplitude). Bottom panel: Mean amperometry (left ordinate axis) and mean integrated amperometry (right ordinate axis). (B) Sizes of the RRP. (C) Time constants of fusion for fast (i.e. RRP) secretion. (D) Sustained secretion (secretion during the last 4 s of the trace in A). (E) Sizes of the SRP. (F) Time constants of fusion for slow (i.e. SRP) secretion. (G) Calcium uncaging experiment in Unc13b KO in the absence and presence of PMA (red and orange traces). Panels are arranged as in A. (H) Sizes of the RRP. (I) Time constants of fusion for fast secretion. (J) Sustained secretion (secretion during the last 4 s of the trace in G). (K) Sizes of the SRP. (L) Time constants of fusion for slow secretion. Data information: In panel A and G (top) data are presented as mean ± SEM; in A and G (middle and bottom panels), the traces are the mean of all cells. In B-F and H-L, data are presented as box and whiskers. *: p<0.05; **: p<0.01; ***: p<0.001. Mann-Whitney test comparing WT cells with WT cells treated with PMA, or KO cells with KO cells treated with PMA or. Number of cells, KO: n=21 cells; KO +PMA: n=19 cells; WT: n=24 cells; WT +PMA: n=20 cells. (M) Single confocal slices of Unc13b KO and WT mouse chromaffin cells with or without PMA stained against tyrosine hydroxylase (α-TH) and Chromogranin A (α-CgA). Scale bar: 5 µm. (N) normalized total cellular CgA fluorescence (integrated density) in Unc13b KO and WT cells with or without PMA. Kruskal-Wallis test with Dunn’s post-hoc test: no differences were significant. (O) Quantification of the plasma membrane fluorescence intensity of CgA (total divided by inside fluorescence, using integrated density) in Unc13b KO and WT cells with or without PMA (normalization to Unc13b WT). Data information: quantitative data are presented as box and whiskers. In (M–O) number of cells, KO: n=30 cells; KO +PMA: n=32 cells; WT: n=29 cells; WT +PMA: n=28 cells.
-
Figure 1—source data 1
Quantitative data.
- https://cdn.elifesciences.org/articles/79433/elife-79433-fig1-data1-v2.xlsx
Figure 2
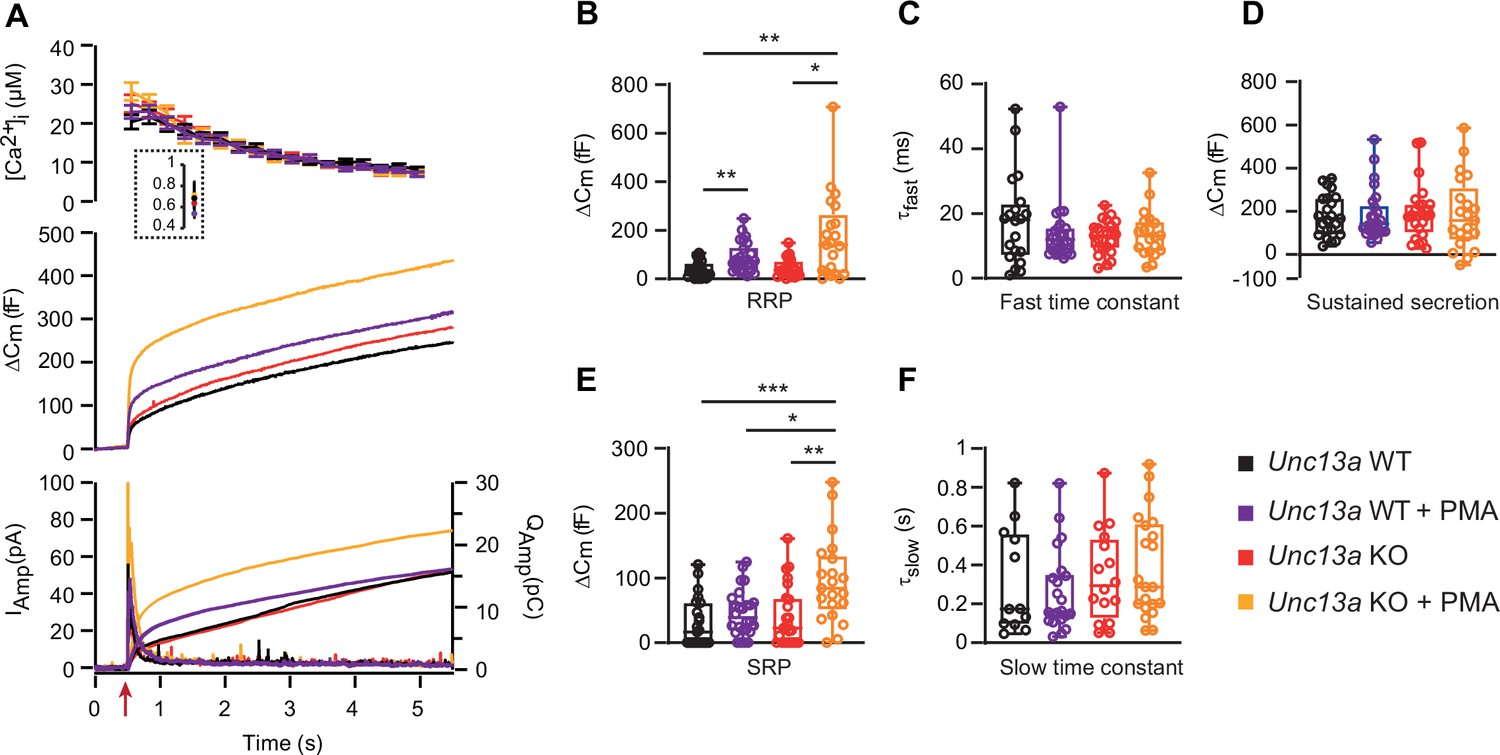
Absence of Munc13-1 potentiates phorbolester-induced secretion.
(A) Calcium uncaging experiment in Unc13a WT (black traces) and KO embryonic (E18) chromaffin cells (red traces) untreated or treated with PMA (WT-PMA: Blue traces; KO-PMA: Yellow traces). Panels are arranged as in Figure 1A. (B) Sizes of the RRP. (C) Time constants of fusion for fast (i.e. RRP) secretion. (D) Sustained secretion. (E) Sizes of the SRP. (F) Time constants of fusion for slow (i.e. SRP) secretion. In the absence of Munc13-1 (Unc13a KO), PMA potentiates secretion more than in Unc13a WT cells. Data information: In panel A (top panel), data are presented as mean ± SEM; in A (middle and bottom panels), the traces are the mean of all cells. In B-F, data are presented as box and whiskers. * p<0.05; ** p<0.01. Kruskal-Wallis test with Dunn’s post-hoc test. Number of cells in (A–F): WT: n=23 cells; KO: n=24 cells; WT +PMA: n=26 cells; KO +PMA: n=21 cells.
-
Figure 2—source data 1
Quantitative data.
- https://cdn.elifesciences.org/articles/79433/elife-79433-fig2-data1-v2.xlsx
Figure 3 with 5 supplements
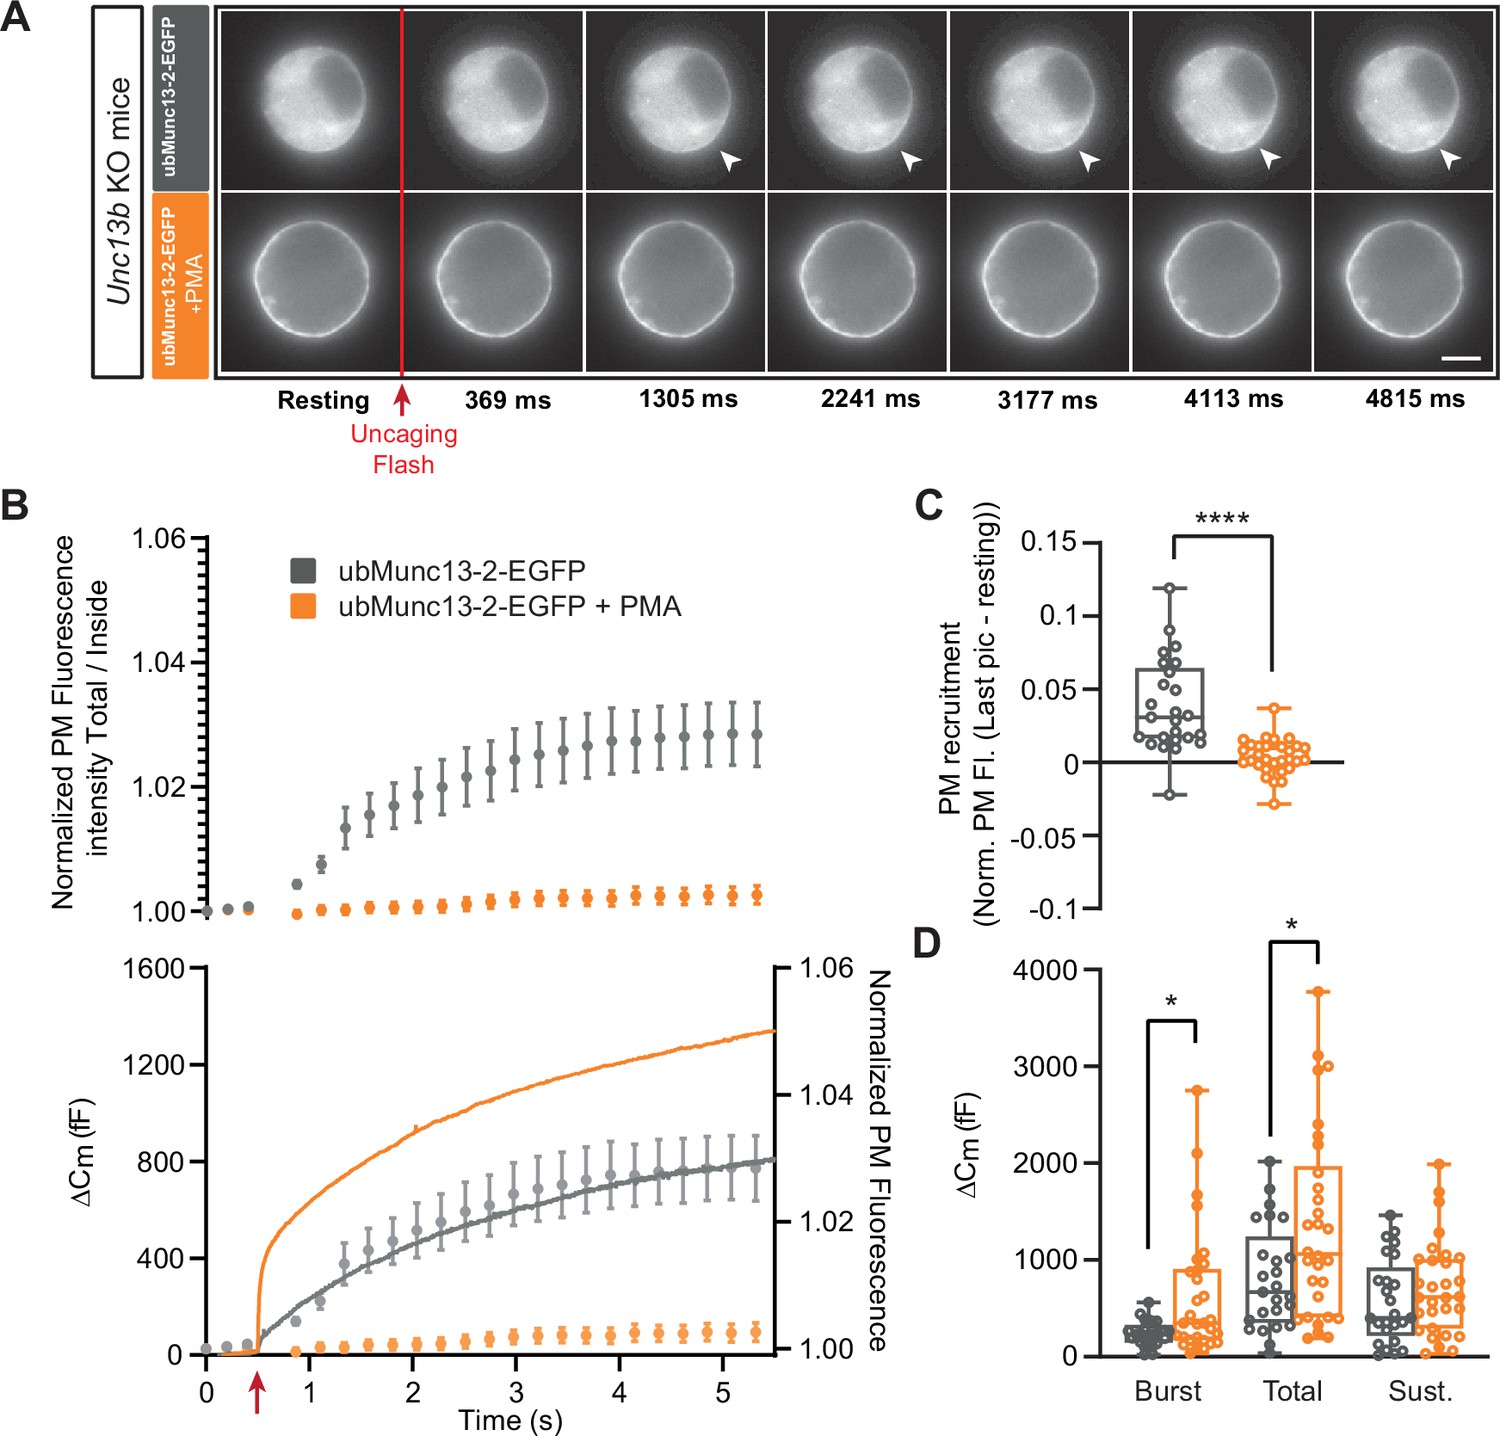
UbMunc13-2-dependent secretion is potentiated by phorbolester.
(A) Wide-field imaging of ubMunc13-2-EGFP expressed in Unc13b KO chromaffin cells and treated with PMA (orange) or left untreated (grey). ubMunc13-2 was recruited at the plasma membrane after calcium uncaging (Top panel - white arrows) and upon PMA treatment (bottom panels). The uncaging light flash is represented by a red arrow. Scale bar: 5 µm. (B) Top: Quantification of the plasma membrane ubMunc13-2-EGFP fluorescence intensity normalized to the first picture acquired in resting condition (mean ± SEM of all cells). Bottom: Capacitance traces (mean of all cells) obtained simultaneously with EGFP imaging, showing that PMA treatment potentiates secretion in Unc13b KO cells expressing ubMunc13-2. Right axis: Normalized PM fluorescence replotted from panel (A) showing that the time course coincides with the capacitance trace. (C) Plasma membrane ubMunc13-2-EGFP recruitment (total fluorescence / inside fluorescence) normalized to resting (pre-stimulation) values. (D) Sizes of Burst, Total and Sustained release. Data information: data in panel B are presented as mean ± SEM; data in panels C and D are presented as box and whiskers. *: p<0.05; ****: p<0.0001, Mann-Whitney tests. ubMunc13-2-EGFP in Unc13b KO: n=25 cells; ubMunc13-2-EGFP in Unc13b KO +PMA: n=30 cells.
-
Figure 3—source data 1
Quantitative data.
- https://cdn.elifesciences.org/articles/79433/elife-79433-fig3-data1-v2.xlsx
Figure 3—figure supplement 1

Experimental setup combining capacitance measurements and GFP-imaging in adrenal chromaffin cells.
(Top:) Stimulation of secretion by ultraviolet flash photolysis of caged-calcium (Nitrophenyl-EGTA: NPE). Upon stimulation, NPE is cleaved, releasing free Ca2+. The amount of calcium released upon flash photolysis is calibrated before the experiments by adjusting the intensity of the flash lamp. Middle: Capacitance measurements: the whole-cell patch clamp configuration was used to perform capacitance measurements. Lower: UV flash-lamp / Monochromator light are directed towards the filtercube that contains a dichroic mirror. The mirror reflects the light for calcium-uncaging, Ca2+ measurements and for GFP-fluorescence picture acquisition. In the emission pathway, light is directed either to a camera (for GFP fluorescence imaging), or towards a photodiode (for Ca2+ measurements). On this setup, GFP-fluorescence imaging and photometry cannot be performed simultaneously.
Figure 3—figure supplement 2

Calcium concentration before and after UV flash photolysis of nitrophenyl-EGTA.
(A) Calcium uncaging experiment in CD1 WT cells. Top panel: [Ca2+] (mean ± SEM) before (insert) and after calcium uncaging (uncaging flash at red arrow, bottom panel). Bottom panel: capacitance traces (mean of all cells). In the setup depicted in Figure 3—figure supplement 1, GFP-imaging cannot be carried out simultaneously with photometry. Therefore, we performed a calcium uncaging experiment using photometry to measure calcium concentrations under identical conditions as in GFP-imaging experiments. Thereby, we determined the average pre-flash and post-flash calcium concentrations with the current settings (for values, see main text). n=14 cells.
Figure 3—figure supplement 3

Expression levels of Munc13-1-EGFP and ubMunc13-2-EGFP.
(A) Western blot of HEK-cells expressing ubMunc13-2-EGFP, or Munc13-1-EGFP, or left uninfected. Expression was induced by infection with Semliki Forest Virus. The membrane was blotted with rabbit polyclonal α-GFP. As expected, Munc13-1-EGFP is slightly larger than ubMunc13-2-EGFP. β-actin was used as loading control. (B) Quantification of EGFP-fluorescence of single mouse chromaffin cells infected with similar quantities of Semliki Forest Virus encoding either Munc13-1 or ubMunc13-2. Munc13-1-EGFP was on average expressed in higher amounts. *: p<0.05. Mann-Whitney test comparing Munc13-1 KO cells overexpressing Munc13-1-EGFP and Munc13-2 KO cells overexpressing Munc13-2-EGFP. OEMunc13-1-EGFP: N=21 cells; OE Munc13-2-EGFP: N=25 cells.
-
Figure 3—figure supplement 3—source data 1
Western blots, raw and with bands.
- https://cdn.elifesciences.org/articles/79433/elife-79433-fig3-figsupp3-data1-v2.zip
-
Figure 3—figure supplement 3—source data 2
Quantitative data.
- https://cdn.elifesciences.org/articles/79433/elife-79433-fig3-figsupp3-data2-v2.xlsx
Figure 3—figure supplement 4
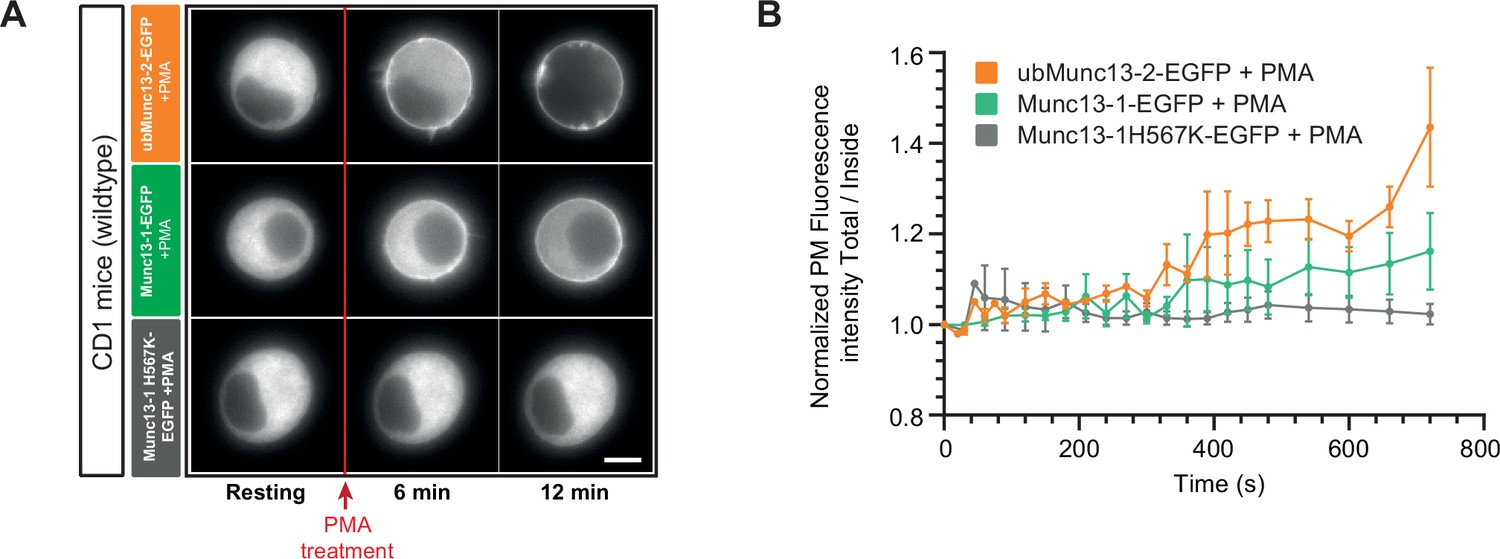
PMA-induced recruitment of overexpressed Munc13 proteins to the plasma membrane in WT mouse adrenal chromaffin cells.
(A) Wide-field imaging of overexpressed ubMunc13-1-EGFP, Munc13-1-EGFP and Munc13-1-H567K-EGFP in wildtype cells (CD1 expressing ubMunc13-1-EGFP – Orange, CD1 WT expressing Munc13-1-EGFP – Green, CD1 WT expressing Munc13-1-H567K-EGFP – Grey) mouse adrenal chromaffin cells. Munc13-1-H567K-EGFP was not recruited to the plasma membrane after PMA treatment. PMA treatment is represented by the red arrow. Scale bar: 5 µm. (B) Quantification of the plasma membrane fluorescence intensity normalized to the first picture acquired under resting condition (OE ubMunc13-2-EGFP: n=3 cells; OE Munc13-1-EGFP: n=3 cells; OE Munc13-1-H567K-EGFP: n=3 cells).
Figure 3—figure supplement 5

ubMunc13-2 trafficking in individual chromaffin cells.
(A) Individual fluorescence traces of EGFP localization in ubMunc13-2-EGFP expressing cells, after Ca2+ uncaging (individual traces underlying average graph in Figure 3B, top panel, grey symbols). (B) Individual fluorescence traces of EGFP localization in ubMunc13-2-EGFP expressing cells treated with PMA, after Ca2 +uncaging (individual traces underlying average graph in Figure 3B, top panel, orange symbols).
Figure 4 with 3 supplements

Munc13-1-dependent secretion is inhibited by phorbolester.
(A) Wide-field imaging of Munc13-1-EGFP expressed in Unc13a KO chromaffin cells treated with PMA (green) or left untreated (grey). Munc13-1-EGFP was not recruited at the plasma membrane after calcium uncaging (top panel) but was present at the PM upon PMA treatment (bottom panel). The uncaging light flash is represented by a red arrow. Scale bar: 5 µm. (B) Top: Quantification of the plasma membrane Munc13-1-EGFP fluorescence intensity normalized to the first picture acquired in resting condition (mean ± SEM of all cells). Bottom: Capacitance traces (mean of all cells) obtained simultaneously with EGFP imaging, showing that PMA treatment reduces secretion in Unc13a KO cells overexpressing Munc13-1. (C) Plasma membrane Munc13-1-EGFP recruitment (total fluorescence / inside fluorescence) normalized to resting (pre-stimulation) values. (D) Sizes of Burst, Total and Sustained release. Data information: data in panel B are presented as mean ± SEM; data in panels C and D are presented as box and whiskers. *: p<0.05, Mann-Whitney tests. OE Munc13-1-EGFP: n=21 cells; OE Munc13-1-EGFP+PMA: n=21 cells.
-
Figure 4—source data 1
Quantitative data.
- https://cdn.elifesciences.org/articles/79433/elife-79433-fig4-data1-v2.xlsx
Figure 4—figure supplement 1
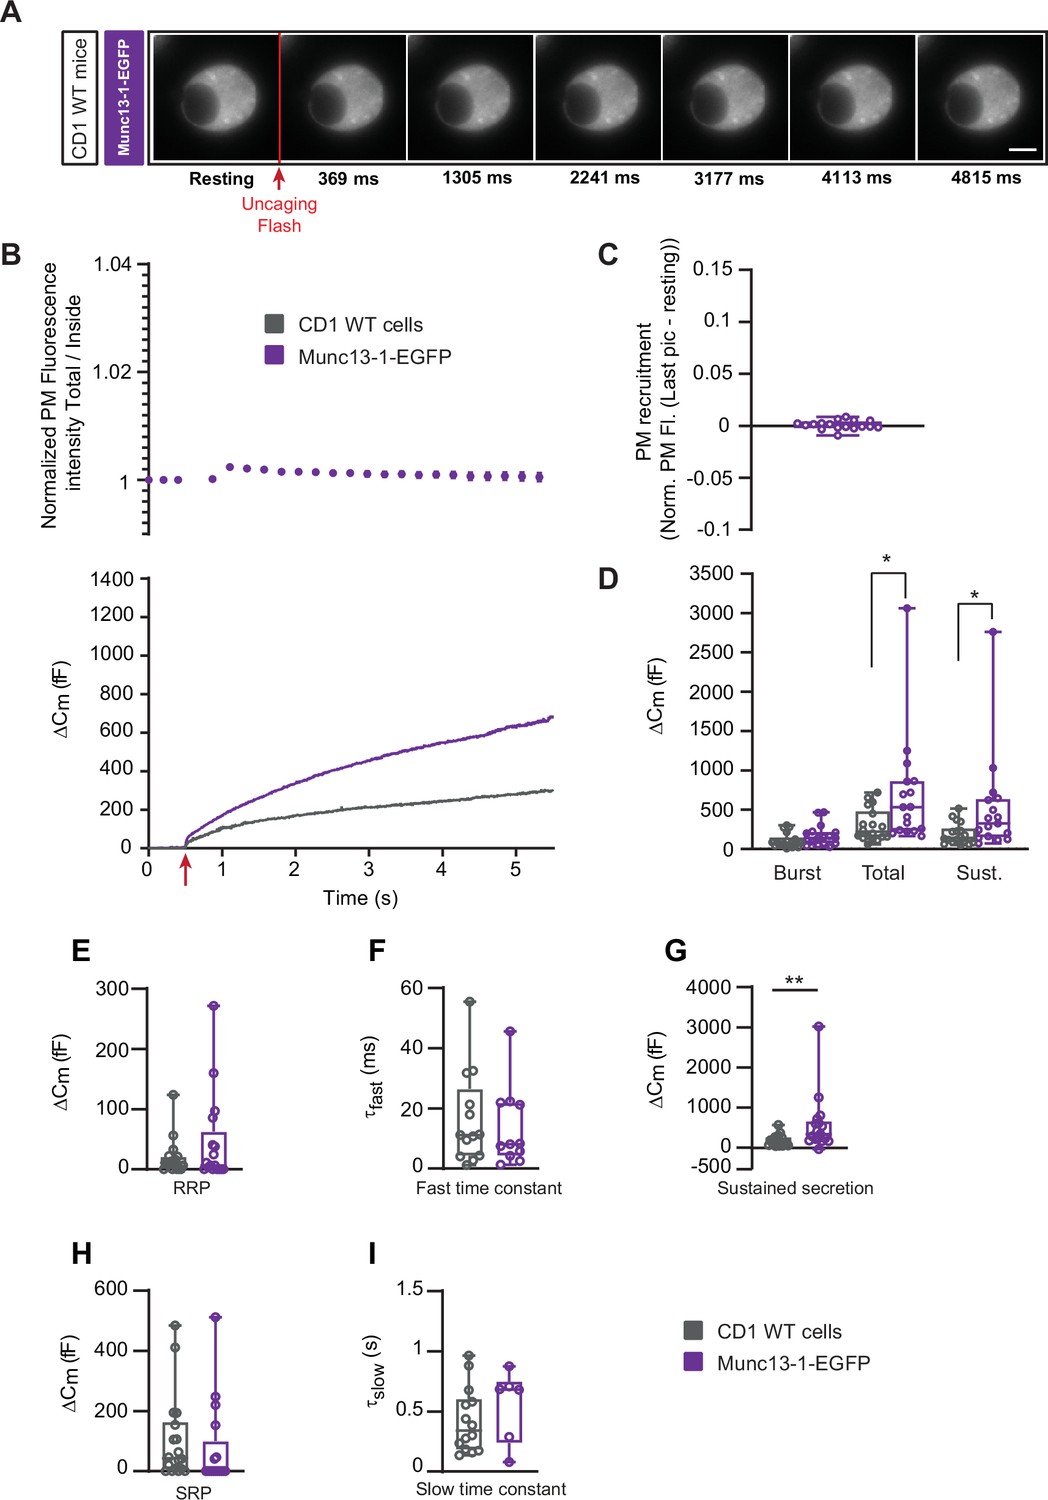
Munc13-1 overexpression potentiates secretion in WT mouse adrenal chromaffin cells.
(A) Wide-field imaging of overexpressed Munc13-1-EGFP in wildtype (CD1 WT – Grey; CD1 WT expressing Munc13-1-EGFP) mouse adrenal chromaffin cells. Munc13-1-EGFP was not recruited at the plasma membrane after calcium uncaging. Uncaging flash is represented by the red arrow. Scale bar: 5 µm. (B) Top: Quantification of the plasma membrane fluorescence intensity normalized to the first picture acquired under resting condition. Bottom: capacitance traces (mean of all cells) obtained simultaneously with EGFP imaging show that overexpression of Munc13-1 potentiates secretion in WT cells. (C) Total plasma membrane Munc13-1-EGFP recruitment. (D) Sizes of Burst, Total and Sustained release. (E) Sizes of the RRP. (F) Time constants of fusion for fast (i.e. RRP) secretion. (G) Sustained secretion (secretion during the last 4 s of the trace in A).(H) Sizes of the SRP. (I) Time constants of fusion for slow (i.e. SRP) secretion. Data information: data in panel B are presented as mean ± SEM; data in panels C-I are presented as box and whiskers. *: p<0.05. *p<0.01. Mann-Whitney. WT cells: N=17 cells; OE Munc13-1-EGFP: N=18 cells.
-
Figure 4—figure supplement 1—source data 1
Quantitative data.
- https://cdn.elifesciences.org/articles/79433/elife-79433-fig4-figsupp1-data1-v2.xlsx
Figure 4—figure supplement 2

Munc13-1 trafficking in individual chromaffin cells.
(A) Individual fluorescence traces of EGFP localization in Munc13-1-EGFP expressing cells, after Ca2+ uncaging (individual traces underlying average graph in Figure 4B, top panel, grey symbols). (B) Individual fluorescence traces of EGFP localization in Munc13-1-EGFP expressing cells treated with PMA, after Ca2+ uncaging (individual traces underlying average graph in Figure 4B, top panel, green symbols).
Figure 4—figure supplement 3
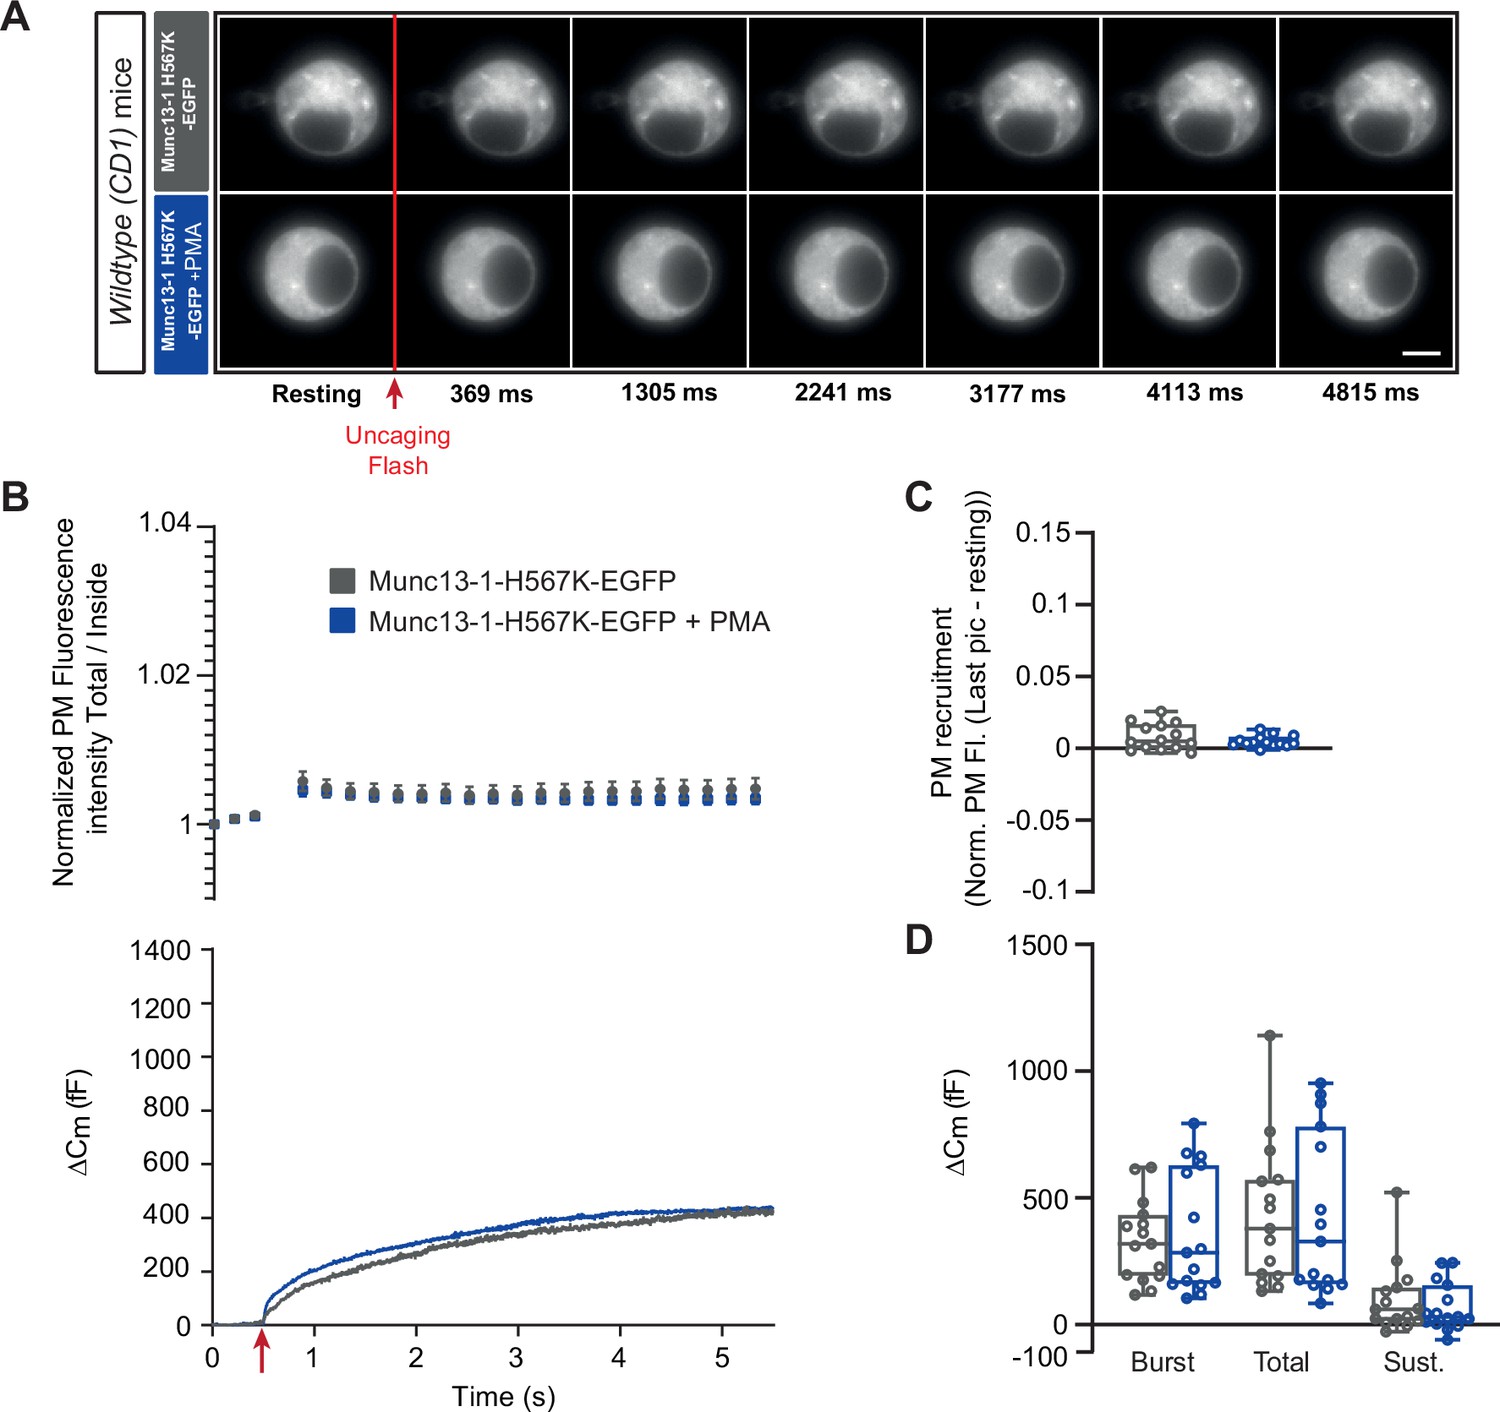
PMA treatment of WT mouse adrenal chromaffin cells overexpressing Munc13-1 H567K does not change secretion.
(A) Wide-field imaging of overexpressed Munc13-1-H567K-EGFP in wildtype (CD1 WT – Grey; CD1 WT expressing Munc13-1-H567K-EGFP – Blue) mouse adrenal chromaffin cells. Munc13-1-H567K EGFP was not recruited at the plasma membrane after calcium uncaging or PMA treatment. Uncaging flash is represented by the red arrow. Scale bar: 5 µm. (B) Top: Quantification of the plasma membrane fluorescence intensity normalized to the first picture acquired under resting condition. Bottom: capacitance traces (mean of all cells) obtained simultaneously with EGFP imaging show that overexpression of Munc13-1-H567K do not change secretion in WT cells. (C) Total plasma membrane Munc13-1-H567K-EGFP recruitment. (D) Sizes of Burst, Total and Sustained release. Data information: data in panel B are presented as mean ± SEM; data in panels C and D are presented as box and whiskers. Mann-Whitney tests comparing WT cells with WT cells overexpressing Munc13-1-H567K-EGFP were insignificant. OE Munc13-1-H567K-EGFP: N=15 cells; OE Munc13-1-H567K-EGFP PMA: N=15 cells.
-
Figure 4—figure supplement 3—source data 1
Quantitative data.
- https://cdn.elifesciences.org/articles/79433/elife-79433-fig4-figsupp3-data1-v2.xlsx
Figure 5
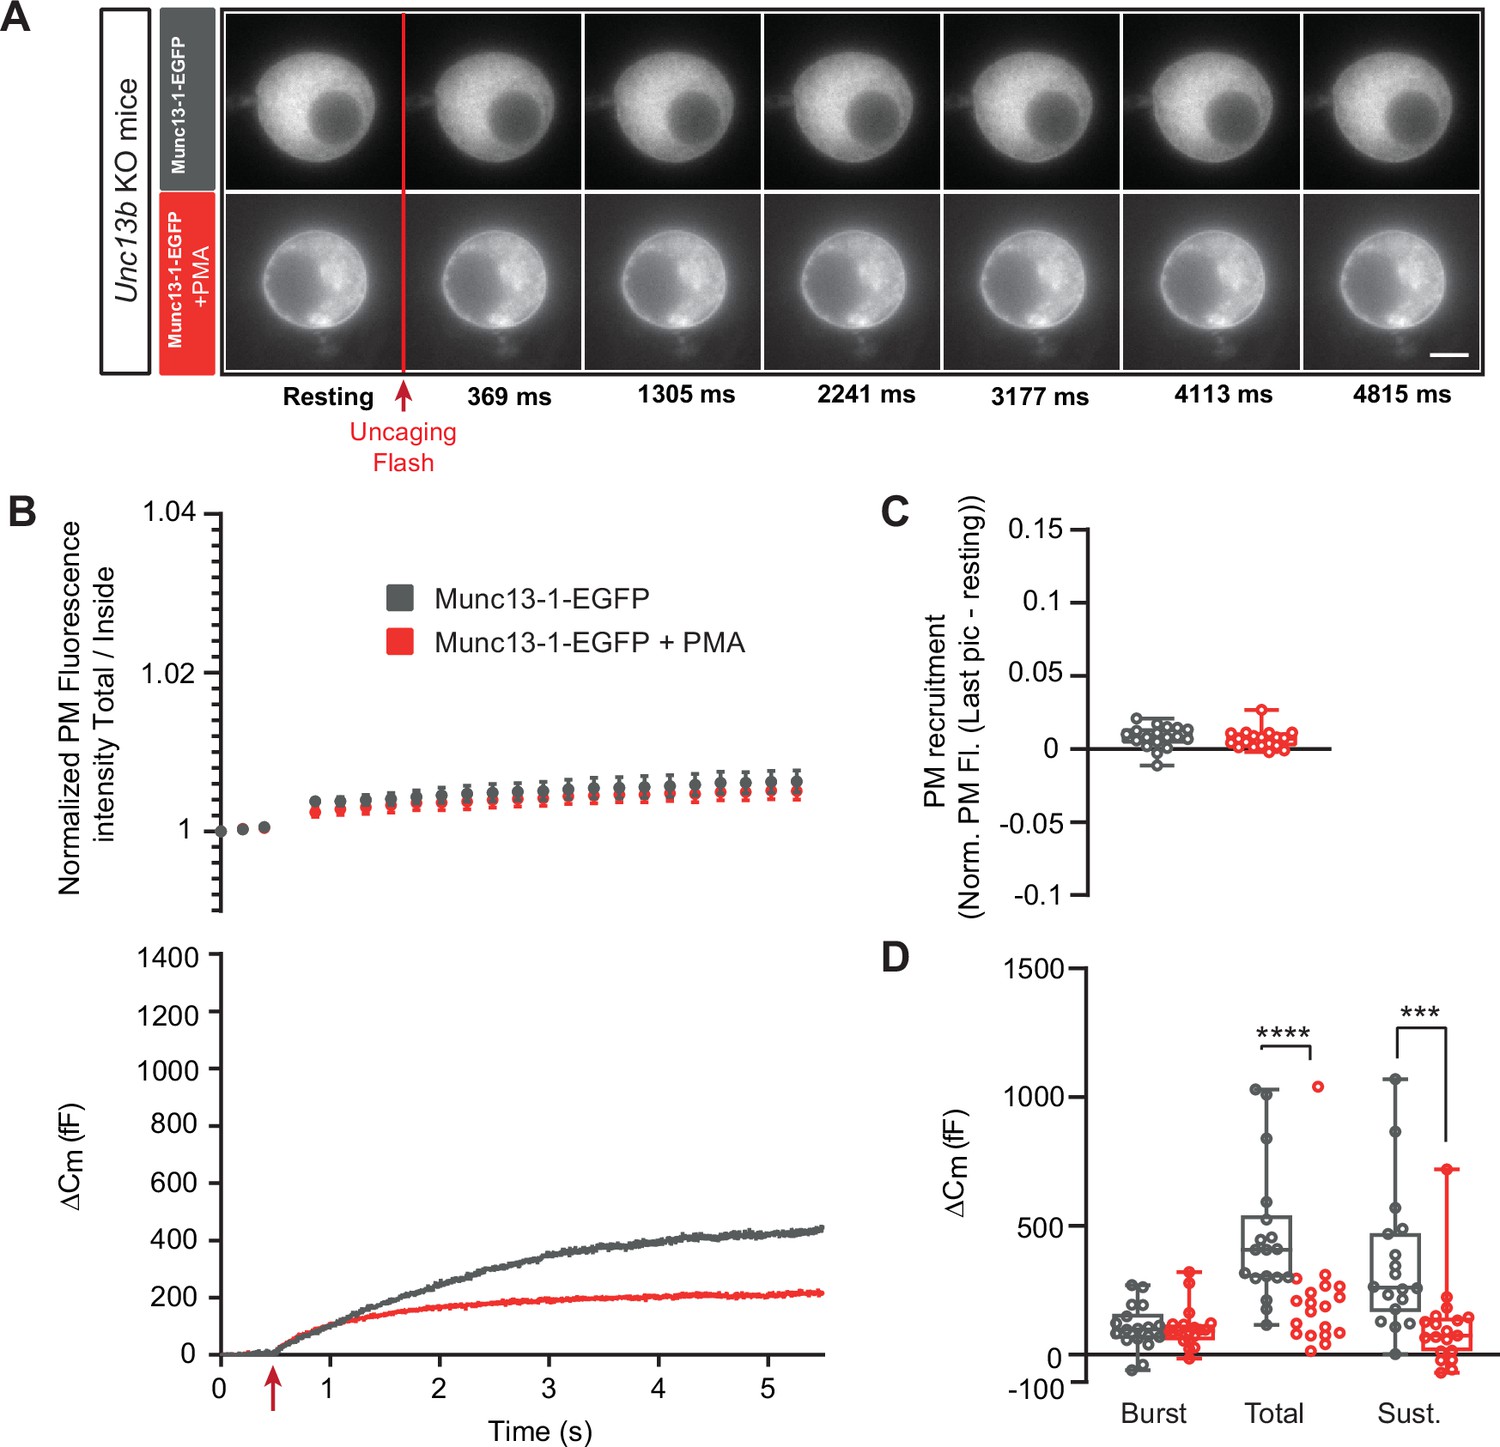
Munc13-1-dependent secretion is inhibited by phorbolester in the absence of ubMunc13-2.
(A) Wide-field imaging of Munc13-1-EGFP expressed in Unc13b KO chromaffin cells and treated with PMA (red) or left untreated (grey). Munc13-1-EGFP was not recruited at the plasma membrane after calcium uncaging (top panel) but was present at the PM upon PMA treatment (bottom panel). The uncaging light flash is represented by a red arrow. Scale bar: 5 µm. (B) Top: Quantification of the plasma membrane Munc13-1-EGFP fluorescence intensity normalized to the first picture acquired in resting condition (mean ± SEM of all cells). Bottom: Capacitance traces (mean of all cells) obtained simultaneously with EGFP imaging, showing that PMA treatment reduces secretion in Unc13b KO cells overexpressing Munc13-1-EGFP. (C) Plasma membrane Munc13-1-EGFP recruitment. (D) Sizes of Burst, Total and Sustained release. Data information: data in panel B are presented as mean ± SEM; data in panels C and D are presented as box and whiskers. ***: p<0.001; ****: p<0.0001, Mann-Whitney tests. OE Munc13-1-EGFP: n=18 cells; OE Munc13-1-EGFP+PMA: n=19 cells.
-
Figure 5—source data 1
Quantitative data.
- https://cdn.elifesciences.org/articles/79433/elife-79433-fig5-data1-v2.xlsx
Figure 6 with 1 supplement

Ca2+-dependent recruitment of ubMunc13-2 is independent of Synaptotagmin-7.
(A) Wide-field imaging of ubMunc13-2-EGFP expressed in Syt7 KO (grey) or Syt7 WT cells (blue) chromaffin cells. ubMunc13-2-EGFP is recruited to the plasma membrane after calcium uncaging in the presence or absence of Syt7 (white arrows). The uncaging light flash is represented by a red arrow. Scale bar: 5 µm. (B) Top: Quantification of the plasma membrane ubMunc13-2-EGFP fluorescence intensity normalized to the first picture acquired in resting condition (mean ± SEM of all cells). Bottom: Capacitance traces (mean of all cells) obtained simultaneously with EGFP imaging show a delay in secretion in Syt7 KO cells overexpressing ubMunc13-2-EGFP. Right axis: Normalized PM fluorescence replotted from panel (A) showing that the time course of ubMunc13-2 precedes the capacitance trace. (C) Plasma membrane ubMunc13-2-EGFP recruitment. (D) Sizes of the Burst, Total and Sustained release. Data information: data in panel B are presented as mean ± SEM; data in panels C and D are presented as box and whiskers. *: p<0.05, Mann-Whitney test. Syt7 KO OE ubMunc13-2-EGFP: n=21 cells; Syt7 WT OE ubMunc13-2-EGFP PMA: n=22 cells.
-
Figure 6—source data 1
Quantitative data.
- https://cdn.elifesciences.org/articles/79433/elife-79433-fig6-data1-v2.xlsx
Figure 6—figure supplement 1

Syt-7 is not co-immunoprecipitated with Munc13-2 or Munc13-1.
(A) Co-immunoprecipitation of endogenous Syt7 with Munc13-2-EYFP. Soluble protein extracts from mouse brain expressing Munc13-2-EYFP were subjected to the GFP-Trap assay, in the presence or absence of 1 mM Ca2+. Samples of the protein extracts used in the immunoprecipitation (input), supernatant (non-bound) and eluted supernatant containing possible immunocomplexes (bound) were processed by SDS-PAGE followed by Western Blot analysis. Western blot was performed using antibodies to detect the proteins indicated on the left. (B) Co-immunoprecipitation of endogenous Syt7 with Munc13-1. A home-made mouse monoclonal α-Munc13-1 was attached to Sepharose-Protein G beads. Brain protein extracts from WT mice were incubated with the beads, washed and eluted (‘IP’ samples) and resolved on Bis-Tris polyacrylamide genes, together with the original sample (‘input’).
-
Figure 6—figure supplement 1—source data 1
Western blots, raw and with bands.
Note that the file marked Figure 6-Figure supplement 1 - source data 6 contains two blots unrelated to the present manuscript.
- https://cdn.elifesciences.org/articles/79433/elife-79433-fig6-figsupp1-data1-v2.zip
Figure 7 with 2 supplements
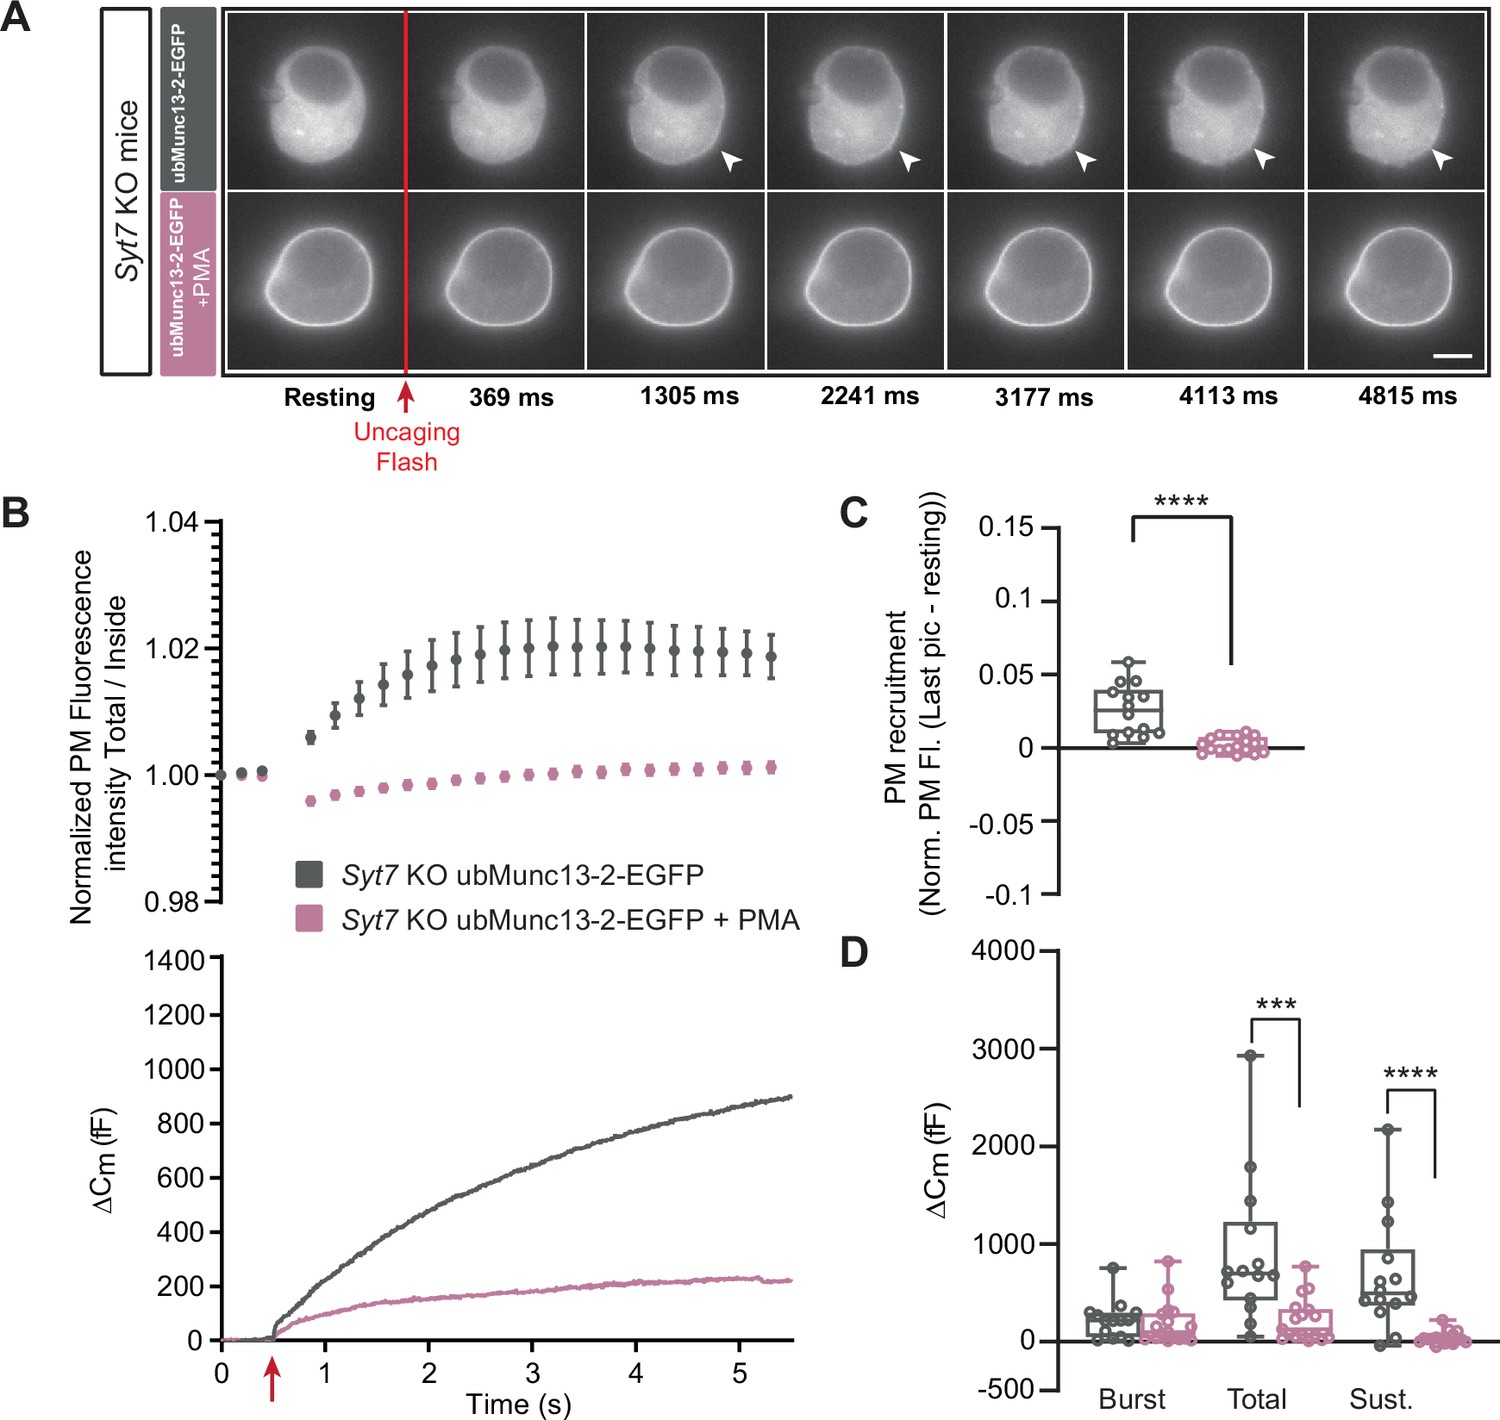
In the absence of Synaptotagmin-7, ubMunc13-2-dependent secretion is inhibited by phorbolester.
(A) Wide-field imaging of overexpressed ubMunc13-2-EGFP expressed in Syt7 KO chromaffin cells treated with PMA (pink) or left untreated (grey). ubMunc13-2-EGFP was recruited to the plasma membrane after calcium uncaging, and was found at the plasma membrane upon PMA treatment. The uncaging light flash is represented by a red arrow. Scale bar: 5 µm. (B) Top: Quantification of the plasma membrane ubMunc13-2-EGFP fluorescence intensity normalized to the first picture acquired in resting condition (mean ± SEM of all cells). Bottom: Capacitance traces (mean of all cells) obtained simultaneously with EGFP imaging in Syt7 KO cells expressing ubMunc13-2-EGFP in the absence and presence of PMA. Upon exposure to PMA, secretion in ubMunc13-2 expressing Syt7 KO cells was strongly inhibited. (C) Plasma membrane ubMunc13-2-EGFP recruitment. (D) Sizes of Burst, Total and Sustained release. Data information: data in panel B are presented as mean ± SEM; data in panels C and D are presented as box and whiskers.*: p<0.05; ***: p<0.001; ****: p<0.0001, Mann-Whitney tests. OE ubMunc13-2-EGFP in Syt7 KO: n=14 cells;+PMA: n=17 cells.
-
Figure 7—source data 1
Quantitative data.
- https://cdn.elifesciences.org/articles/79433/elife-79433-fig7-data1-v2.xlsx
Figure 7—figure supplement 1
Munc13-1 inhibits secretion independently of Syt7.
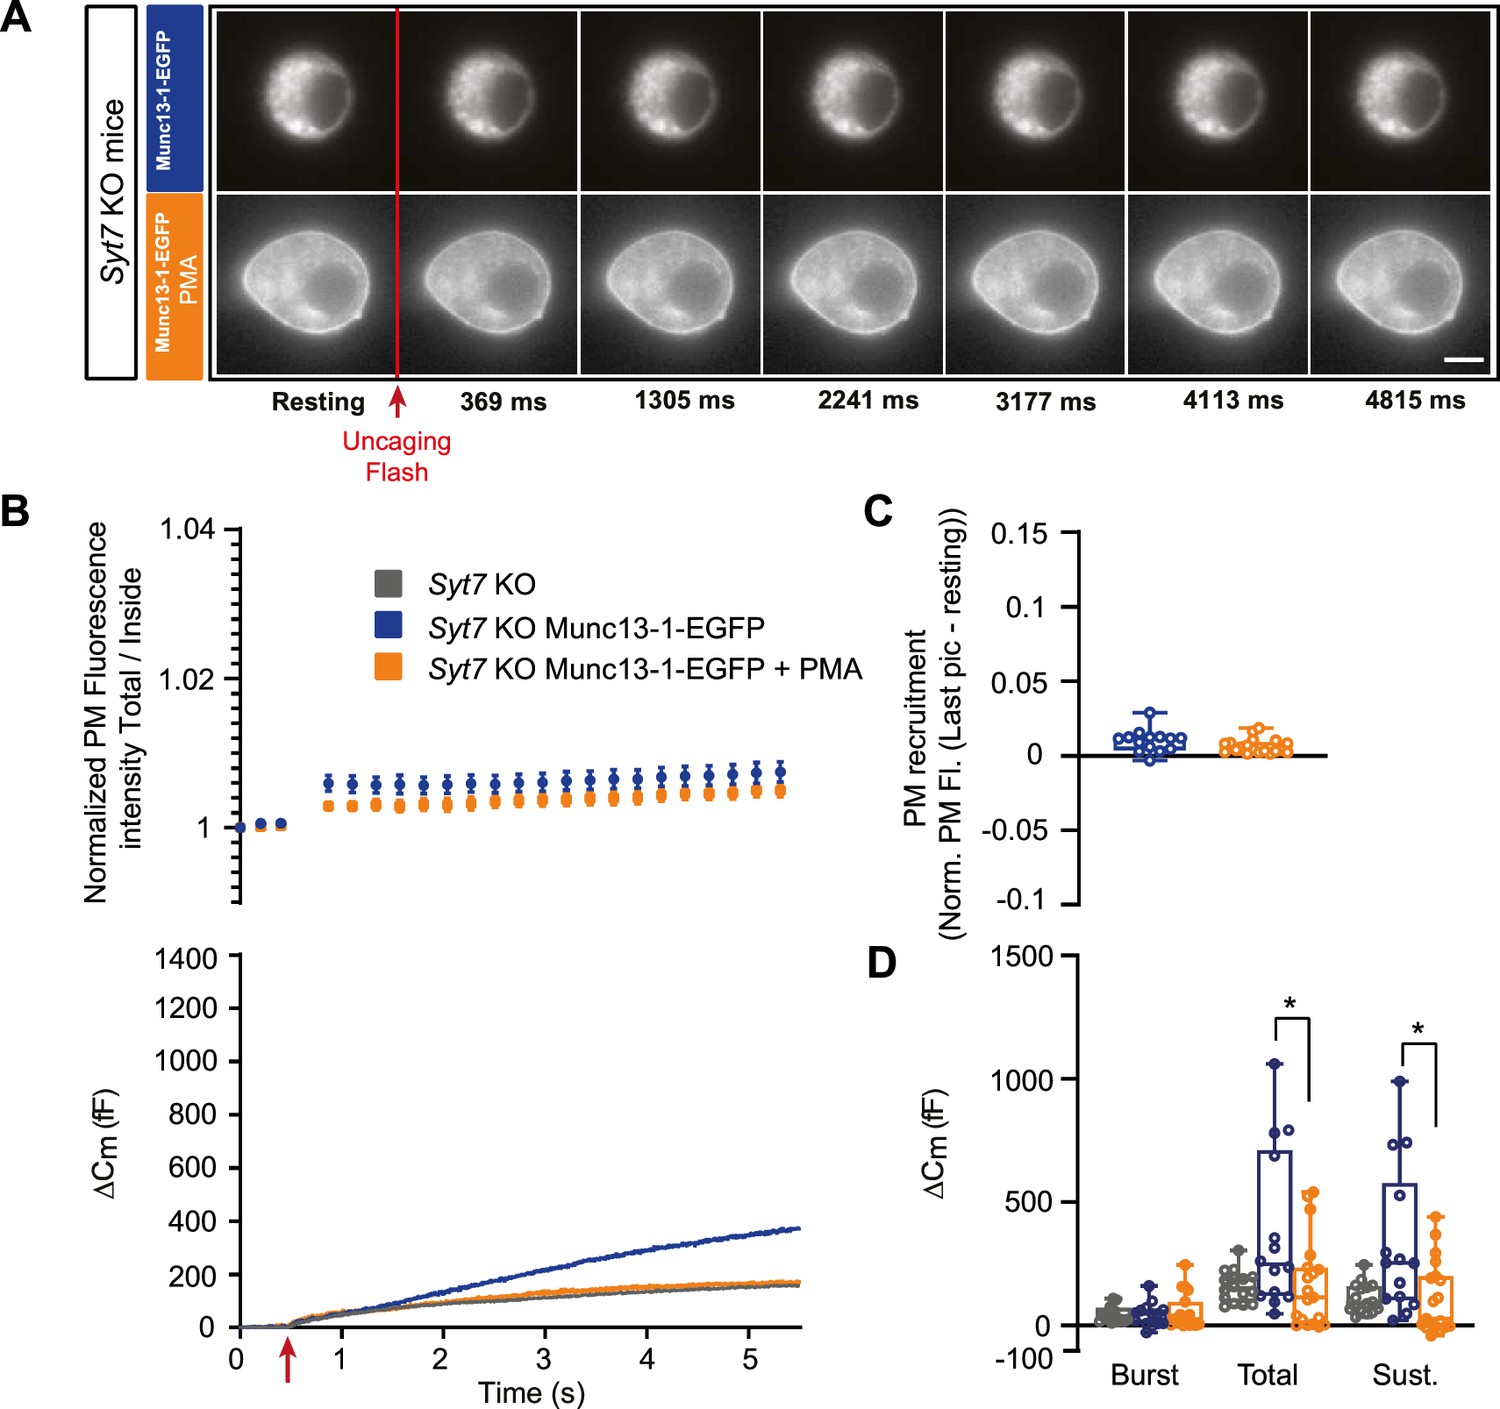
(A) Wide-field imaging of Munc13-1-EGFP expressed in Syt7 KO mice cells treated (Orange) with PMA or left untreated (Blue). Munc13-1-EGFP was not recruited at the plasma membrane after calcium uncaging but was relocalized to the plasma membrane upon PMA treatment. Uncaging flash is represented by a red arrow. Scale bar: 5 µm. (B) Top: Quantification of the plasma membrane fluorescence intensity normalized to the first picture acquired under resting condition. Bottom: Capacitance traces (mean of all cells) obtained simultaneously with EGFP imaging shows that in Syt7 KO cells overexpressing Munc13-1-EGFP, PMA inhibits secretion and reverses it back to the level of non-overexpressing Syt7 KO cells. (C) Total plasma membrane Munc13-1-EGFP recruitment. (D) Sizes of Burst, Total and Sustained release. Data information: data in panel B are presented as mean ± SEM; data in panels C and D are presented as box and whiskers. *: p<0.05. Mann-Whitney tests comparing Syt7 KO with Syt7 KO overexpressing Munc13-1-EGFP or Syt7 KO overexpressing Munc13-1-EGFP treated with PMA. Syt7 KO: N=16 cells; Syt7 KO OE Munc13-1: N=14 cells; Syt-7 WT OE Munc13-1 PMA: N=19 cells.
-
Figure 7—figure supplement 1—source data 1
Quantitative data.
- https://cdn.elifesciences.org/articles/79433/elife-79433-fig7-figsupp1-data1-v2.xlsx
Figure 7—figure supplement 2
PKC inhibition does not affect membrane fusion in the presence or absence of ubMunc13-2.
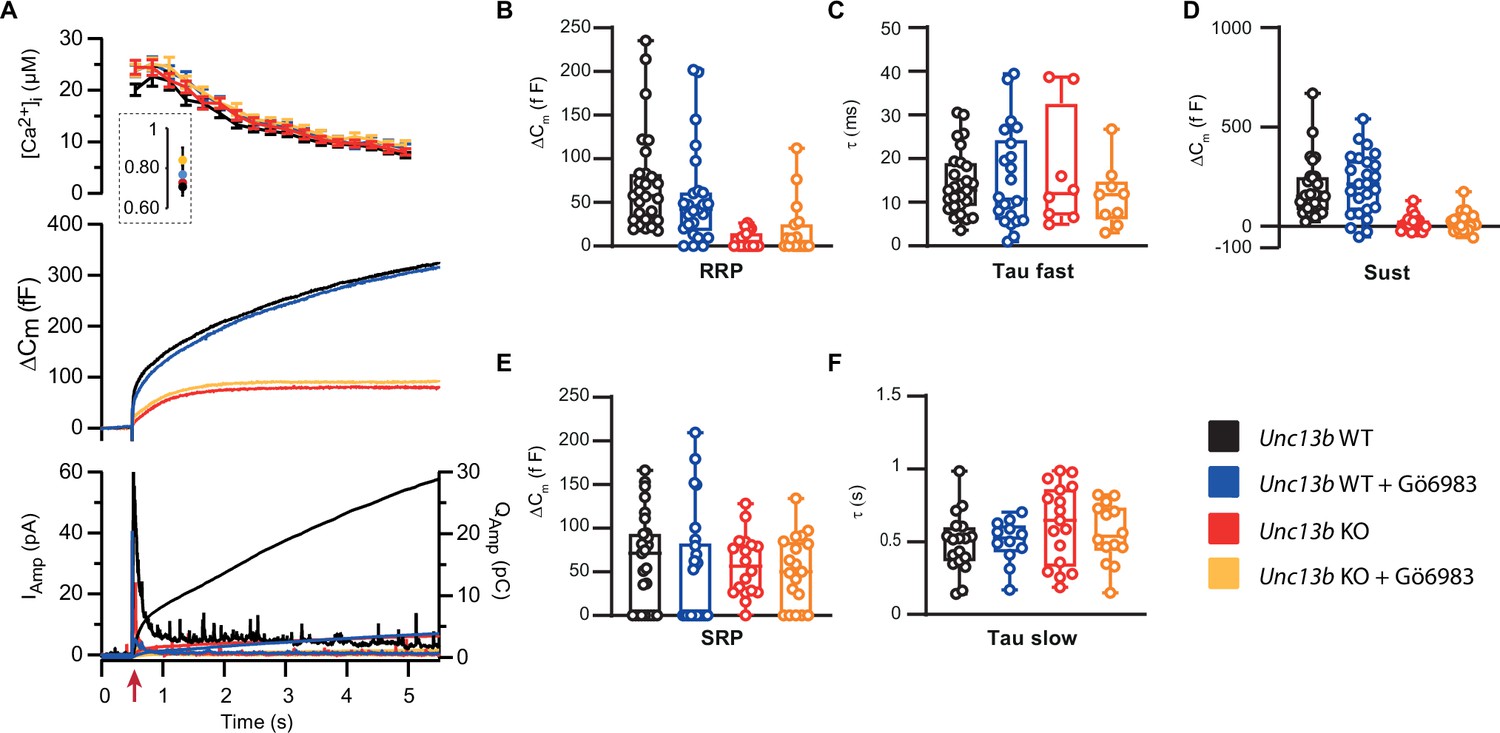
(A) Calcium uncaging experiment in Unc13b WT (black traces) and KO embryonic chromaffin cells (red traces) untreated or treated with an inhibitor of PKC (Gö6983) (WT- Gö6983: Blue traces; KO- Gö6983: Yellow traces). Panels are arranged as in Figure 1A. (B) Sizes of the RRP. (C) Time constants of fusion for fast (i.e. RRP) secretion. (D) Sustained secretion. (E) Sizes of the SRP. (F) Time constants of fusion for slow (i.e. SRP) secretion. Pharmacological inhibition of PKC did not change membrane fusion as measured by capacitance increase, in the presence or absence of ubMunc13-2. Note that release of adrenaline/noradrenaline was blocked by the Gö6983 inhibitor, which is reflected in a reduction in the amperometric current (see also Fulop and Smith, 2006, Biochem. J. 399, 111–119). Data information: data in panel B are presented as mean ± SEM; data in panels C and D are presented as box and whiskers. Mann-Whitney tests comparing Unc13b WT with Unc13b WT +Gö6983 or Unc13b KO with Unc13b KO +Gö6983. Number of cells in (A–F): WT: n=27 cells; KO: n=18 cells; WT +Gö6983: n=25 cells; KO +Gö6983: n=19 cells.
-
Figure 7—figure supplement 2—source data 1
Quantitative data.
- https://cdn.elifesciences.org/articles/79433/elife-79433-fig7-figsupp2-data1-v2.xlsx
Tables
Key resources table
| Reagent type (species) or resource | Designation | Source or reference | Identifiers | Additional information |
|---|---|---|---|---|
| Strain, strain background (M. musculus) | CD1 | Experimental Medicine, Panum Stable, University of Copenhagen. | ||
| Genetic reagent (M. musculus) | Synaptotagmin-7 (Syt7) null allele | Maximov et al., 2008 | PMID:18308933 | |
| Genetic reagent (M. musculus) | Unc13a null allele | Augustin et al., 1999a | PMID:10440375 | |
| Genetic reagent (M. musculus) | Unc13b null allele | Varoqueaux et al., 2005 | PMID:12070347 | |
| Transfected construct (Rattus Norvegicus) | pSFV1-ubmunc13-2-EGFP | Zikich et al., 2008 | PMID:18287511 Local identifier: 486 | Gift from Sonja Wojcik |
| Transfected construct (Rattus Norvegicus) | pSFV1-ubmunc13-1-EGFP | Ashery et al., 1999 | PMID:10494858 Local identifier: 487 | Gift from Sonja Wojcik |
| Antibody | anti-Chromogranin A (Rabbit polyclonal) | Abcam | Ab15160 RRID: AB_301704 | 1:500; Overnight at 4 degrees |
| Antibody | anti-TH (Mouse monoclonal) | Merck Millipore | MAB318 RRID: AB_2201528 | 1:2000; Overnight at 4 degrees |
| Antibody | anti-Synaptotagmin-7 (Rabbit polyclonal) | Synaptic System | SYSY: 105173 RRID: AB_887838 | 1:500; Overnight at 4 degrees. |
| Antibody | Anti-Munc13-1 (mouse monoclonal) | Home-made (Max Planck Institute of Multidisciplinary Sciences, Göttingen) Betz et al., 1998 | PMID:9697857 | 1:1000 1 hr at room temperature |
| Antibody | Anti-Munc13-1 (Rabbit polyclonal) | Home-made (Max Planck Institute of Multidisciplinary Sciences, Göttingen) Varoqueaux et al., 2005 | PMID:15988013 | Co-IP: 1:300 1 hr at 4 degrees |
| Antibody | anti-bMunc13 (Rabbit polyclonal) | Synaptic System | SYSY126203 RRID: AB_2619807 | 1:1000; Overnight at 4 degrees |
| Antibody | Anti-β-Actin−Peroxidase antibody (Mouse monoclonal) | Sigma-aldrich | A3854 RRID:AB_262011 | 1:10000; 30 min at room temperature |
| Antibody | anti-rabbit HRP (Goat polyclonal) | Agilent | Dako-P0448 RRID: AB_2617138 | 1:2000; 1 hr and 30 min at room temperature |
| Antibody | anti-rabbit Alexa 488 (Goat polyclonal) | ThermoFisher Scientific | A11008 RRID: AB_143165 | 1:500; 30 min at room temperature |
| Antibody | anti-mouse Alexa 647 (Goat polyclonal) | ThermoFisher Scientific | A21235 RRID: AB_2535804 | 1:500; 30 min at room temperature |
| Antibody | anti-GFP (Rabbit polyclonal) | Synaptic Systems | SYSY132003 RRID: AB_1834147 | 1:300; Overnight at 4 degrees |
| Commercial assay or kit | BCA Protein assay kit | Pierce | Pierce: 23227 | |
| Commercial assay or kit | GFP-Trap | Chromotek | gtak-20 | |
| Chemical compound, drug | NaCl | Sigma-aldrich | Sigma-aldrich: S9888 | |
| Chemical compound, drug | KCl | Sigma-aldrich | Sigma-aldrich: P5405 | |
| Chemical compound, drug | NaH2PO4 | Sigma-aldrich | Sigma-aldrich: S8282 | |
| Chemical compound, drug | Glucose | Sigma-aldrich | Sigma-aldrich: G8270 | |
| Chemical compound, drug | DMEM | Gibco | Gibco: 31966047 | |
| Chemical compound, drug | L-cysteine | Sigma-aldrich | Sigma-aldrich: C7352 | |
| Chemical compound, drug | CaCl2 | Sigma-aldrich | Sigma-aldrich: 499609 | |
| Chemical compound, drug | EDTA | Sigma-aldrich | Sigma-aldrich: E5134 | |
| Chemical compound, drug | papain | Worthington Biochemical | Worthington Biochemical: LS003126 | |
| Chemical compound, drug | albumin | Sigma-aldrich | Sigma-aldrich: A3095 | |
| Chemical compound, drug | trypsin-inhibitor | Sigma-aldrich | Sigma-aldrich: T9253 | |
| Chemical compound, drug | penicillin/ streptomycin | Invitrogen | Invitrogen: 15140122 | |
| Chemical compound, drug | insulin-transferrin-selenium-X | Invitrogen | Invitrogen: 51500056 | |
| Chemical compound, drug | fetal calf serum | Invitrogen | Invitrogen: 10500064 | |
| Chemical compound, drug | MgCl2 | Sigma-aldrich | Sigma-aldrich: 449172 | |
| Chemical compound, drug | HEPES | Sigma-aldrich | Sigma-aldrich: H3375 | |
| Chemical compound, drug | Nitrophenyl-EGTA (NPE) | Synthesized at the Max-Planck-Institute for biophysical chemistry, Göttingen. | ||
| Chemical compound, drug | Fura-4F | Invitrogen | Invitrogen: F14174 | |
| Chemical compound, drug | Furaptra | Invitrogen | Invitrogen: M1290 | |
| Chemical compound, drug | Mg-ATP | Sigma-aldrich | Sigma-aldrich: A9187 | |
| Chemical compound, drug | GTP | Sigma-aldrich | Sigma-aldrich: G8877 | |
| Chemical compound, drug | Vitamin C | Sigma-aldrich | Sigma-aldrich: A5960 | |
| Chemical compound, drug | EGTA | Sigma-aldrich | Sigma-aldrich: E4378 | |
| Chemical compound, drug | Paraformaldehyde | Sigma-aldrich | Sigma-aldrich: P6148 | |
| Chemical compound, drug | PIPES | Sigma-aldrich | Sigma-aldrich: 80635 | |
| Chemical compound, drug | Triton X-100 | Sigma-aldrich | Sigma-aldrich: T8787 | |
| Chemical compound, drug | BSA | Sigma-aldrich | Sigma-aldrich: A4503 | |
| Chemical compound, drug | Prolong Gold | Invitrogen | Invitrogen: P36934 | |
| Chemical compound, drug | Protease cocktail inhibitor | Invitrogen | Invitrogen: 87785 | |
| Chemical compound, drug | RIPA buffer | Invitrogen | Invitrogen: R0278 | |
| Chemical compound, drug | ECL plus western blotting substrate | Pierce | Pierce: 32132 | |
| Chemical compound, drug | Go 6983 | Tocris | Tocris:133053-19-7 PubChem ID: 3499 | |
| Software, algorithm | Igor | wavemetrics | Versions 6.2.1.0 and 8.0.4.2 | |
| Software, algorithm | ImageJ | NIH software | Version 1.53e |
Additional files
Download links
A two-part list of links to download the article, or parts of the article, in various formats.
Downloads (link to download the article as PDF)
Open citations (links to open the citations from this article in various online reference manager services)
Cite this article (links to download the citations from this article in formats compatible with various reference manager tools)
Phorbolester-activated Munc13-1 and ubMunc13-2 exert opposing effects on dense-core vesicle secretion
eLife 11:e79433.
https://doi.org/10.7554/eLife.79433


